Embed Size (px)
Citation preview

What is the iSkills™ assessment?Irvin R. Katz, Ph.D.ETS Senior Research Scientist
William T. WynneETS Higher Education Assessment Specialist
OverviewDigital Fluency and Critical ThinkingAssessing Digital Fluencyg g y
Some results about Digital Fluency


Trustworthiness of Information
Information from libraries is…Less trustworthy than informationfrom search engines
9%
More trustworthy than information from search engines
21%from search engines
NO DIFFERENCE in trustworthiness 70%
Source: De Rosa, Cathy, and others. Perceptions of Libraries and Information Resources. (OCLC, November 2005) http://www.oclc.org/reports/2005perceptions.htm

Headlines in the PressCollege Notes on the Web: Learning, or Laziness?
-New York Times The Tyranny of InformationLos Angeles Times
Americans Give Mixed Reviews to Use of Web for Schoolwork—San Diego Union-Tribune
—Los Angeles Times
Information Inundation Imperils Our Children
How to Handle Cyber-Sloth in Academe
g Imperils Our Children—Los Angeles Times Point, Click,
Plagiarize
S F i
H kProfessors Vie with Web for Class’s Attention—New York Times
-Chronicle of Higher Education-San Francisco
Chronicle
Homework Copycats Prosper on the Net
Lessons in the School of Cut and Paste—New York Times
Copyright © 2012 Educational Testing Service. All rights reserved.
Net—San Francisco Chronicle Abe Lincoln and the Truth Get Mugged at the Click of a Mouse
-Los Angeles Times
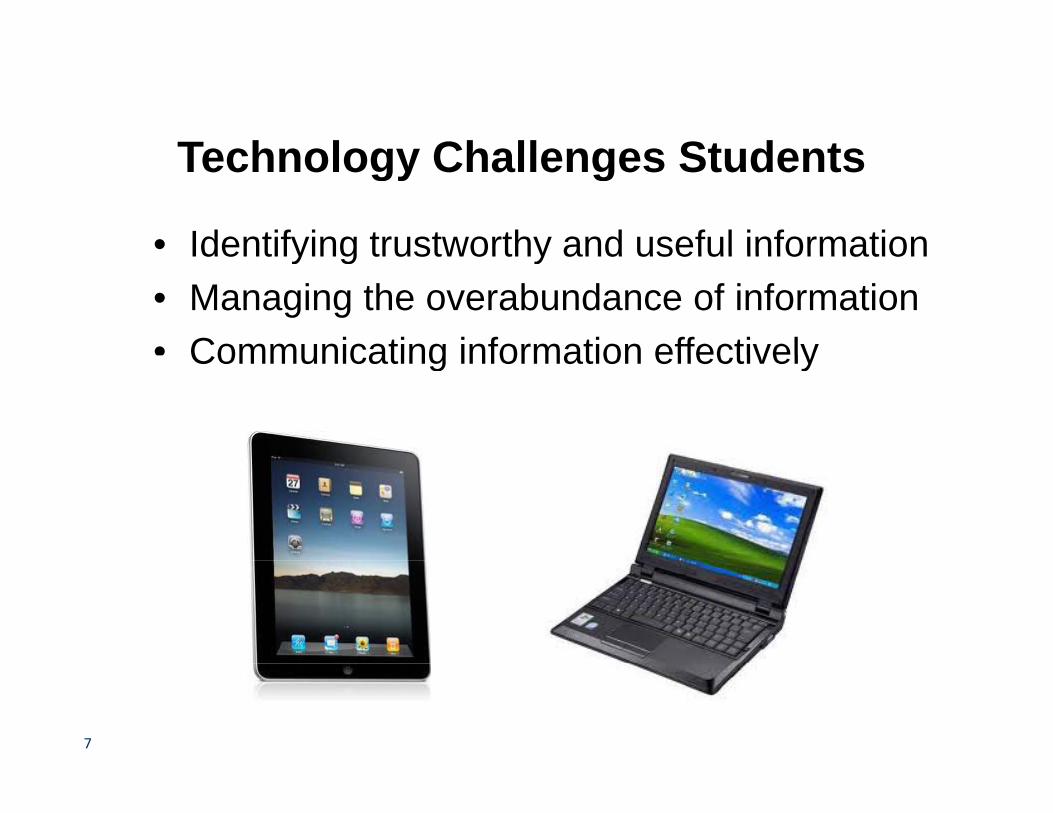
Technology Challenges StudentsTechnology Challenges Students
• Identifying trustworthy and useful informationIdentifying trustworthy and useful information• Managing the overabundance of information• Communicating information effectivelyCommunicating information effectively
7
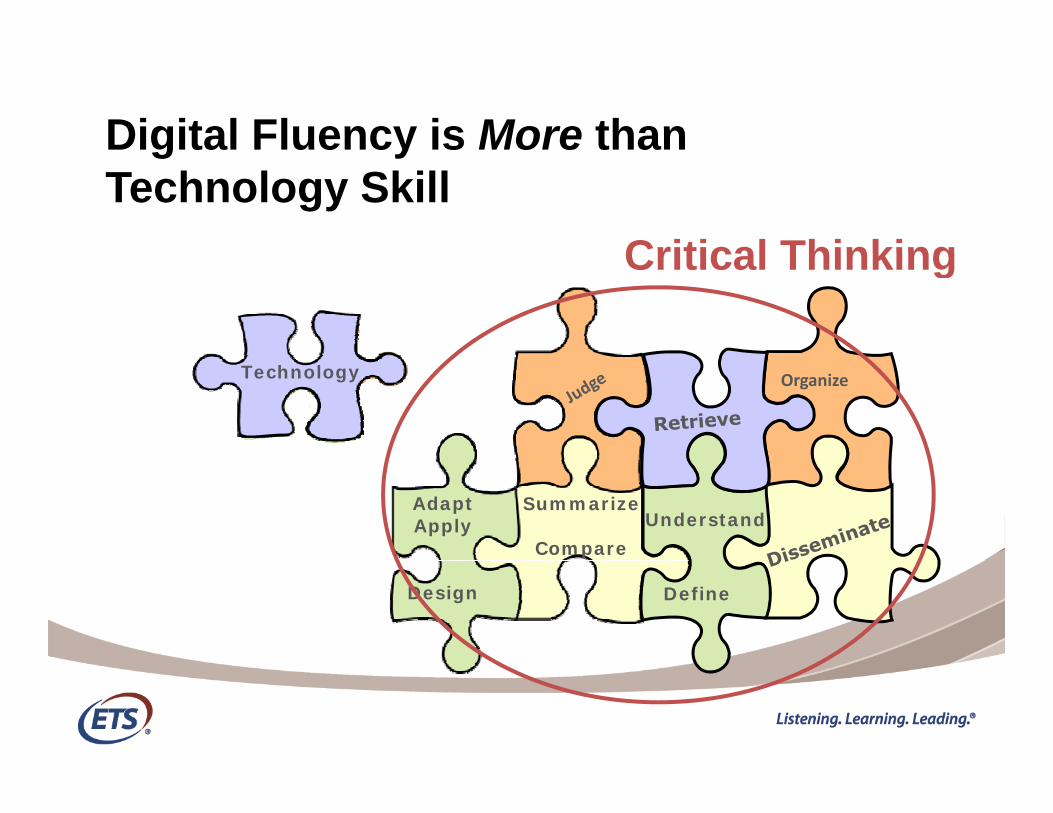
Digital Fluency is More than g yTechnology Skill
Critical ThinkingCritical Thinking
OrganizeTechnology
AdaptApply
Summarize
CompareUnderstand
Design Define
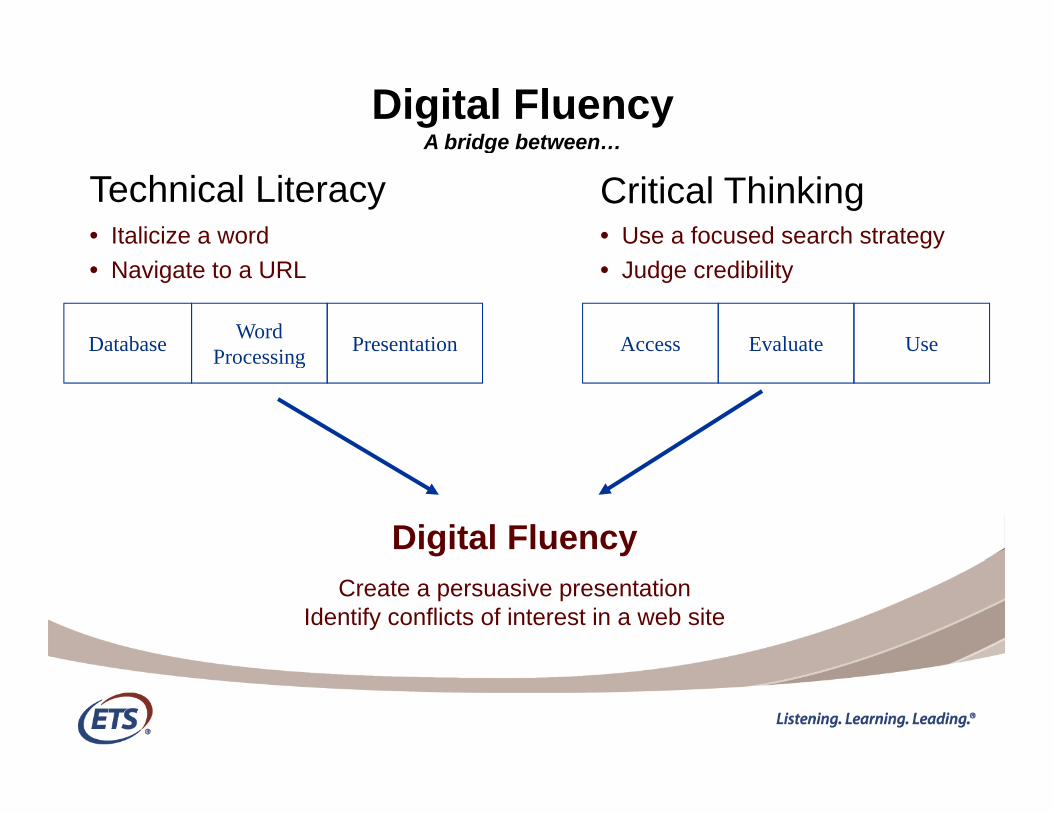
Digital FluencyA bridge between…g
Technical Literacy Information Literacy• Italicize a word • Use a focused search strategy
Critical Thinking
Database Word Processing Presentation
• Navigate to a URL
Access Evaluate Use
• Judge credibility
Processing
Digital FluencyCreate a persuasive presentation
Identify conflicts of interest in a web site
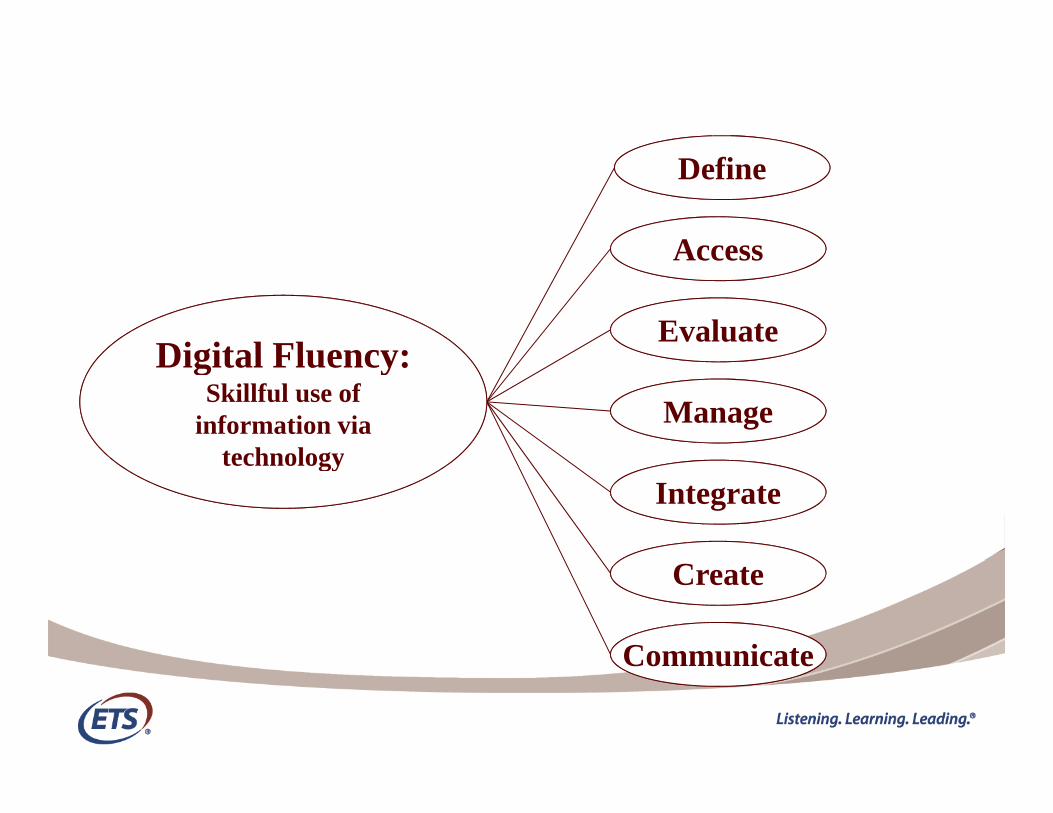
Access
Define
Evaluate
Access
Digital Fluency:Manage
Digital Fluency:Skillful use of
information via technology
Integratetechnology
CommunicateCommunicate
Create
CommunicateCommunicate
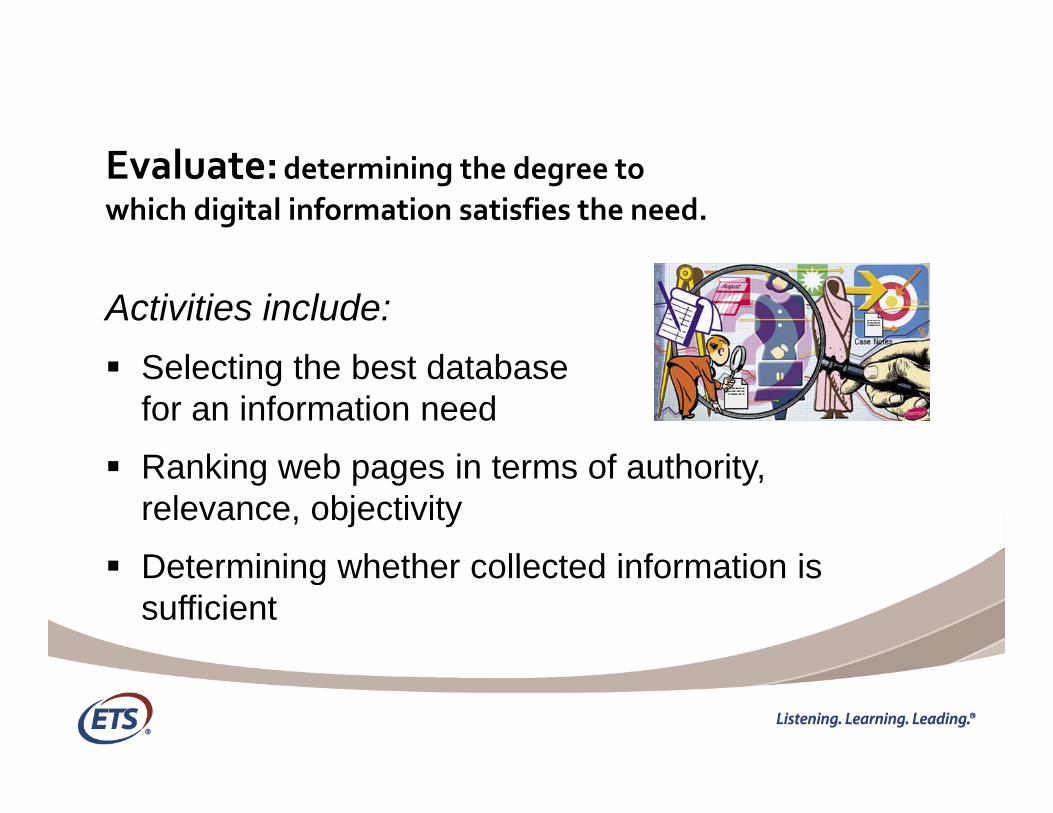
lEvaluate:determining the degree to which digital information satisfies the need.
Activities include:S l ti th b t d t b Selecting the best database for an information need
R ki b i t f th it Ranking web pages in terms of authority, relevance, objectivity
Determining whether collected information is Determining whether collected information is sufficient
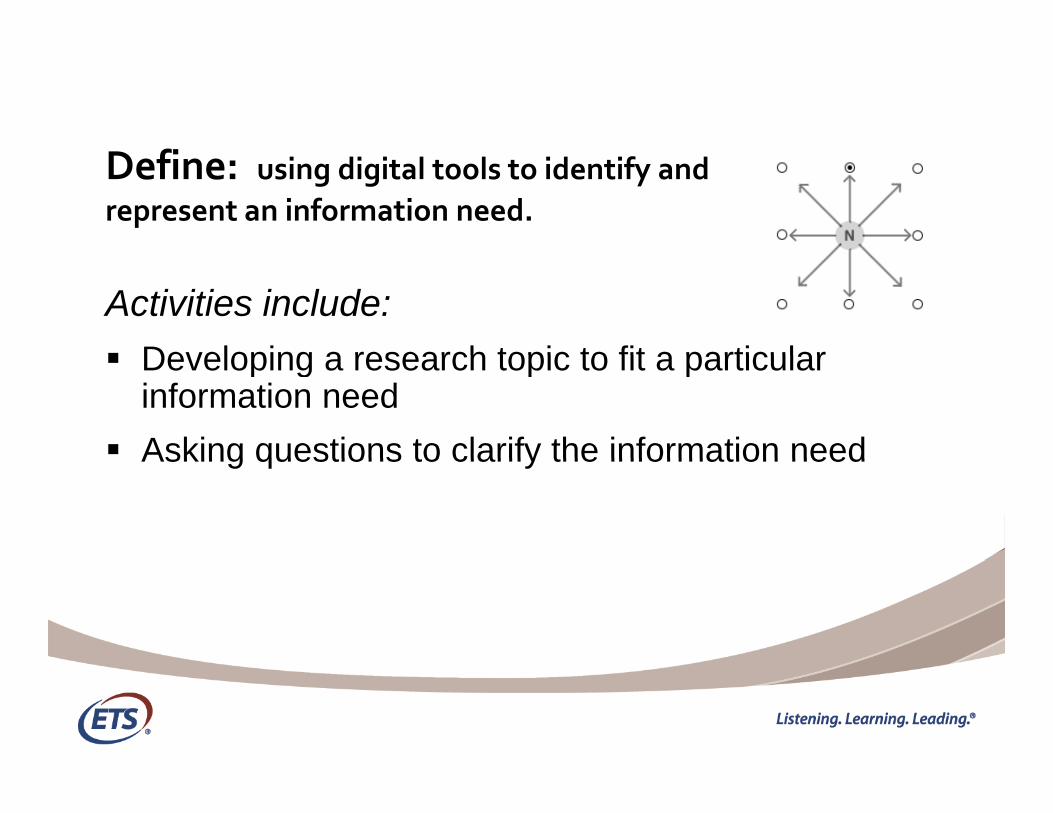
fiDefine: using digital tools to identify and represent an information need.
Activities include: Developing a research topic to fit a particular Developing a research topic to fit a particular
information need Asking questions to clarify the information needAsking questions to clarify the information need
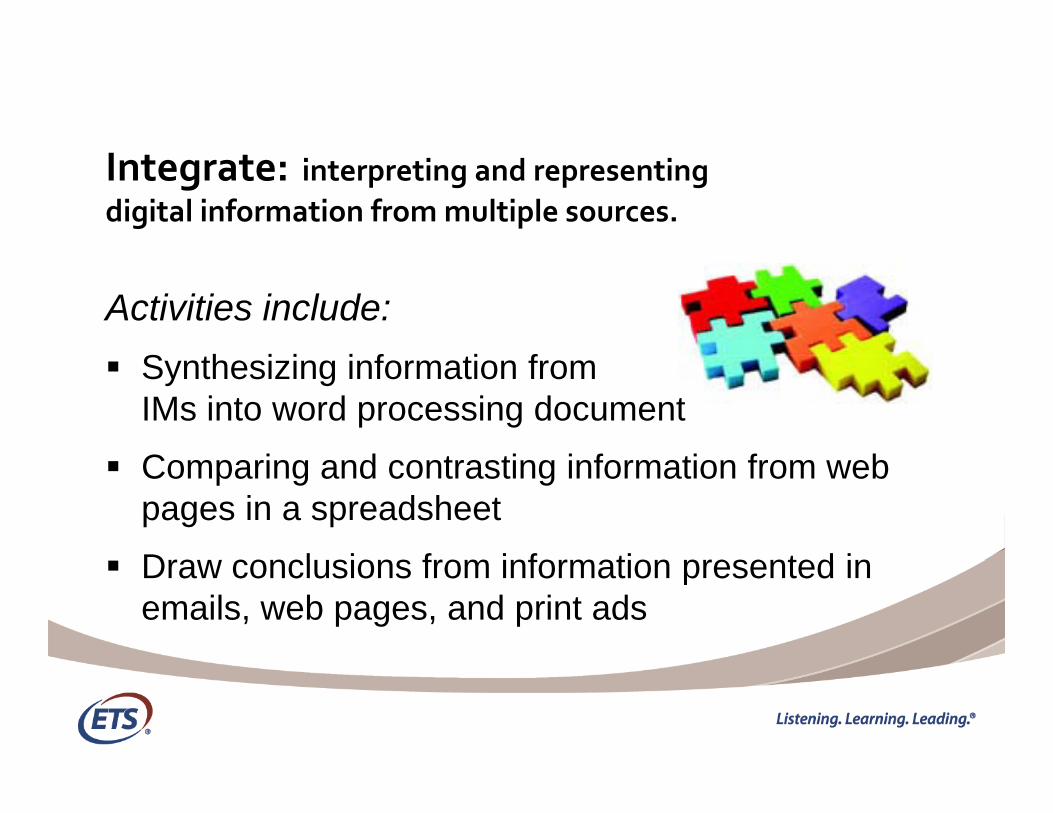
Integrate: interpreting and representing digital information from multiple sources.
Activities include:S th i i i f ti f Synthesizing information from IMs into word processing document
C i d t ti i f ti f b Comparing and contrasting information from web pages in a spreadsheet
Draw conclusions from information presented in Draw conclusions from information presented in emails, web pages, and print ads
Communicate: communicating digital Communicate: communicating digital information properly in its context of use for a particular audience in a particular venue.
Activities include:C ti h th t h l d i i Creating a graph that helps a decision
Adapting presentation slides to a new audience

Assessment of Digital FluencyHow do we assure students are ready for the digital fluency demands of college and the workplace?

Challenges in developing a believablemeasure of Digital Fluencymeasure of Digital Fluency• Design an assessment with face validity
A th ti l t f b d– Authentic, relevant, performance-based– Measure the application of knowledge rather than
facts or standard proceduresp– Aligned to nationally-recognized standards
• Ensure that it is based on solid measurement principlesQ lit d F i– Quality and Fairness
– Validity– ReliabilityReliability
• Provide test-takers, instructors, and institutions with useful data and feedback
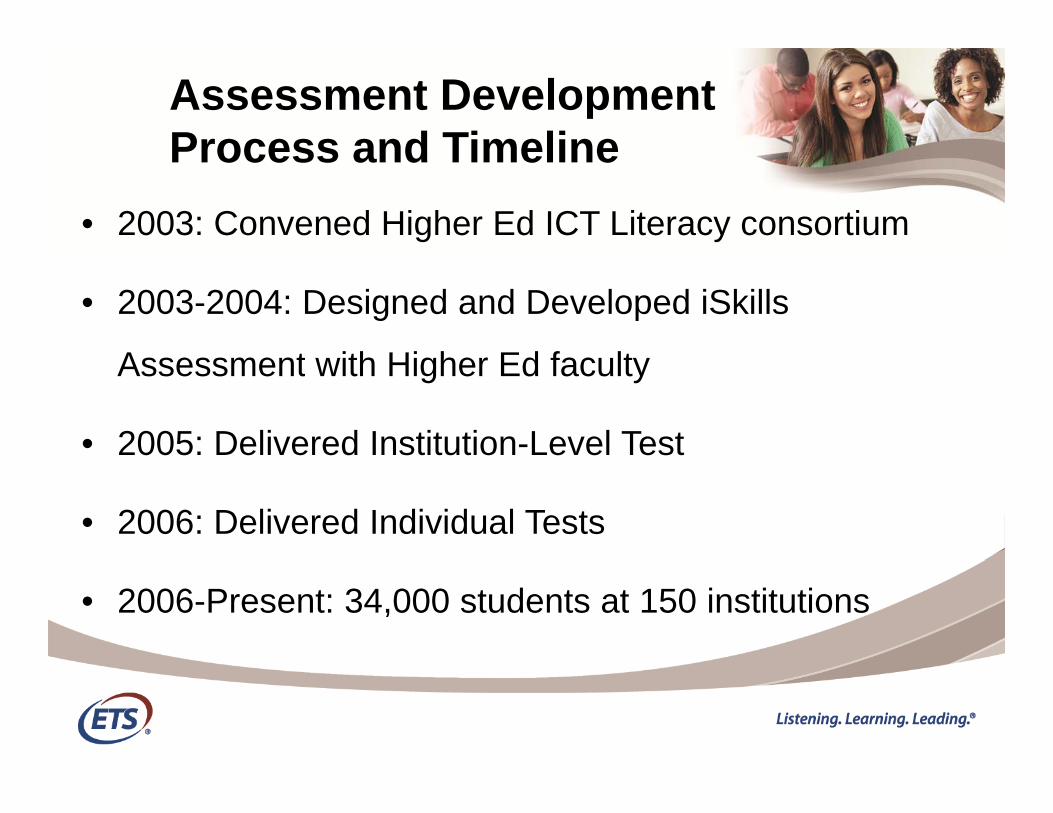
Assessment Development Process and TimelineProcess and Timeline
• 2003: Convened Higher Ed ICT Literacy consortium
• 2003-2004: Designed and Developed iSkills
A t ith Hi h Ed f ltAssessment with Higher Ed faculty
• 2005: Delivered Institution-Level Test
• 2006: Delivered Individual Tests
• 2006-Present: 34,000 students at 150 institutions
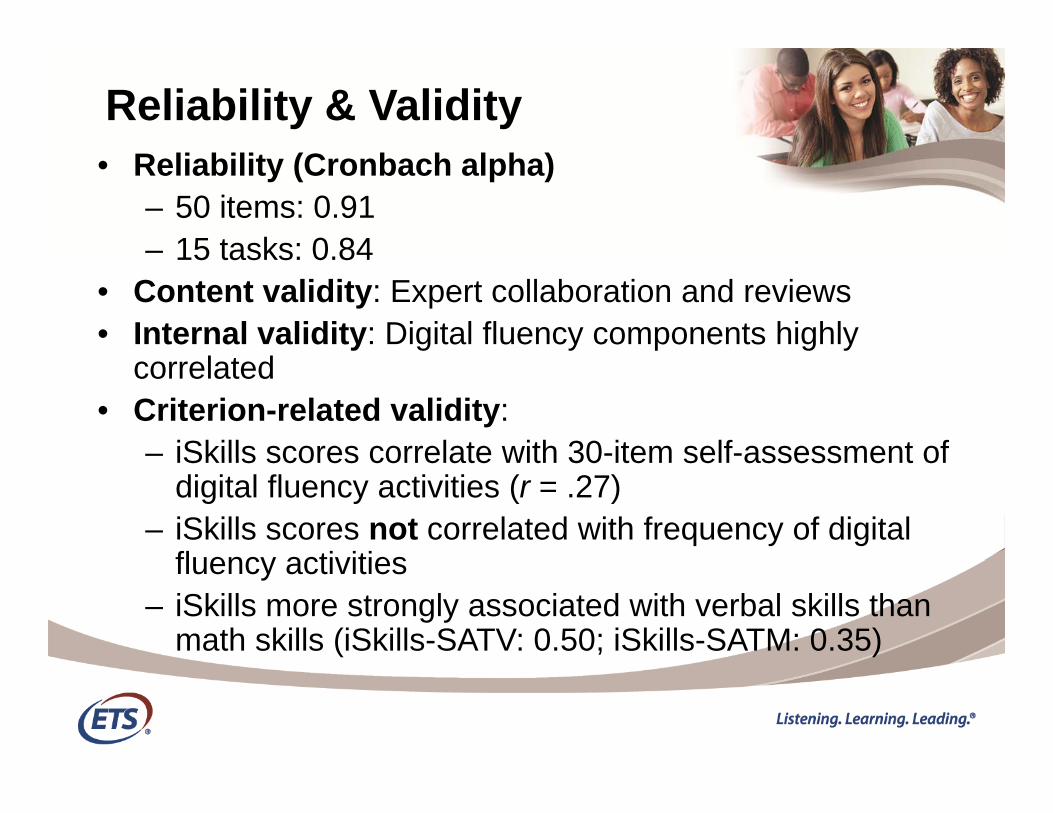
Reliability & Validity• Reliability (Cronbach alpha)
– 50 items: 0.91– 15 tasks: 0 8415 tasks: 0.84
• Content validity: Expert collaboration and reviews• Internal validity: Digital fluency components highly
correlated • Criterion-related validity:
– iSkills scores correlate with 30-item self-assessment ofiSkills scores correlate with 30 item self assessment of digital fluency activities (r = .27)
– iSkills scores not correlated with frequency of digital fluency activitiesfluency activities
– iSkills more strongly associated with verbal skills than math skills (iSkills-SATV: 0.50; iSkills-SATM: 0.35)
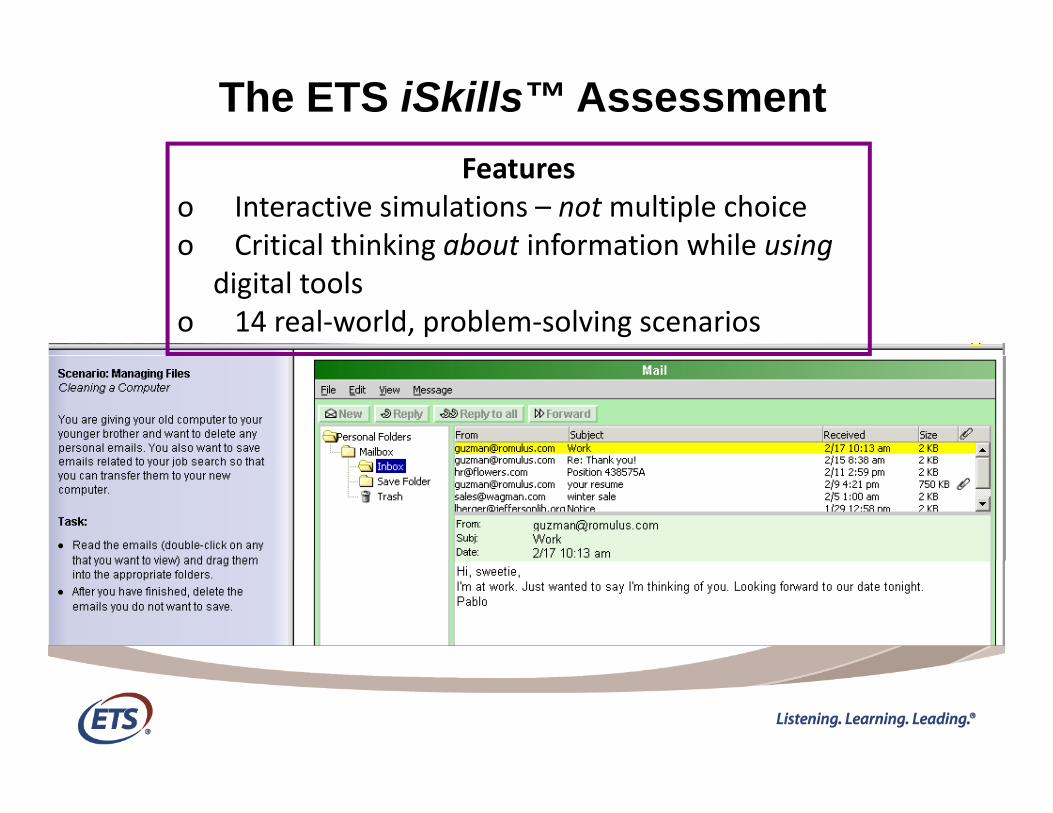
The ETS iSkills™ AssessmentFeatures
o Interactive simulations – notmultiple choiceo Critical thinking about information while usingo Critical thinking about information while using
digital toolso 14 real‐world, problem‐solving scenarios

iSkills Sample TasksAn inside look at the assessment
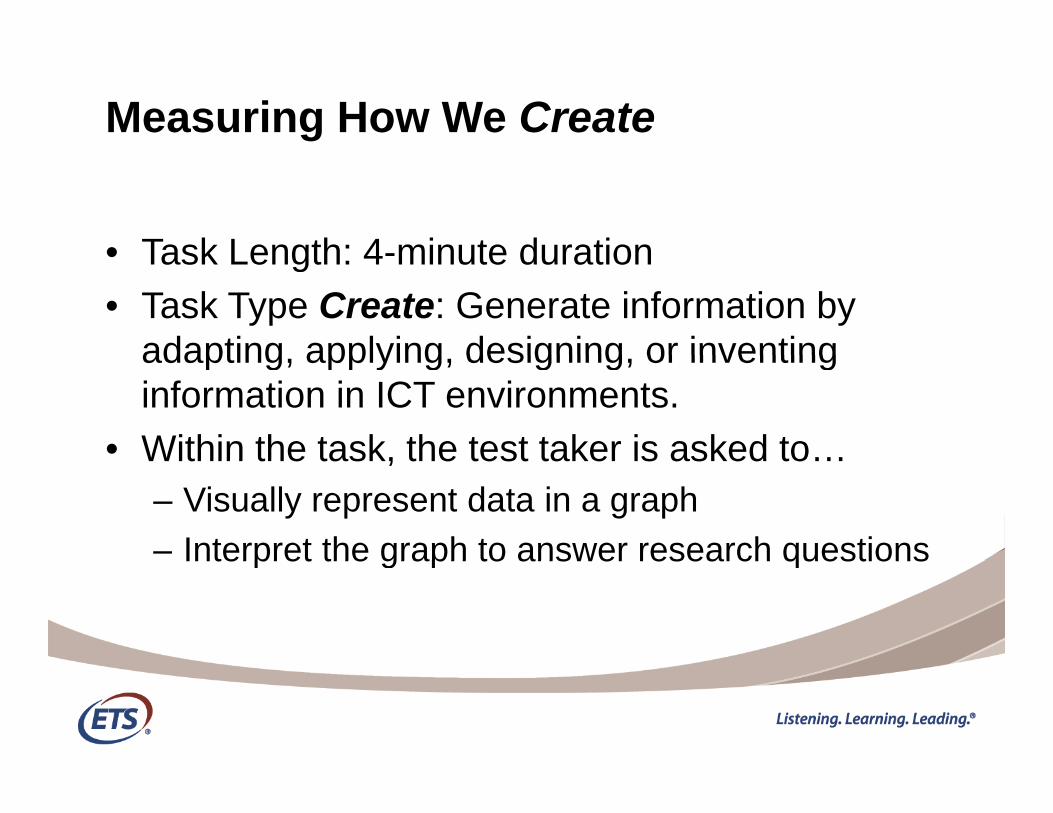
Measuring How We Create
• Task Length: 4 minute duration• Task Length: 4-minute duration• Task Type Create: Generate information by
adapting applying designing or inventingadapting, applying, designing, or inventing information in ICT environments.
• Within the task, the test taker is asked to…Within the task, the test taker is asked to…– Visually represent data in a graph– Interpret the graph to answer research questionsInterpret the graph to answer research questions
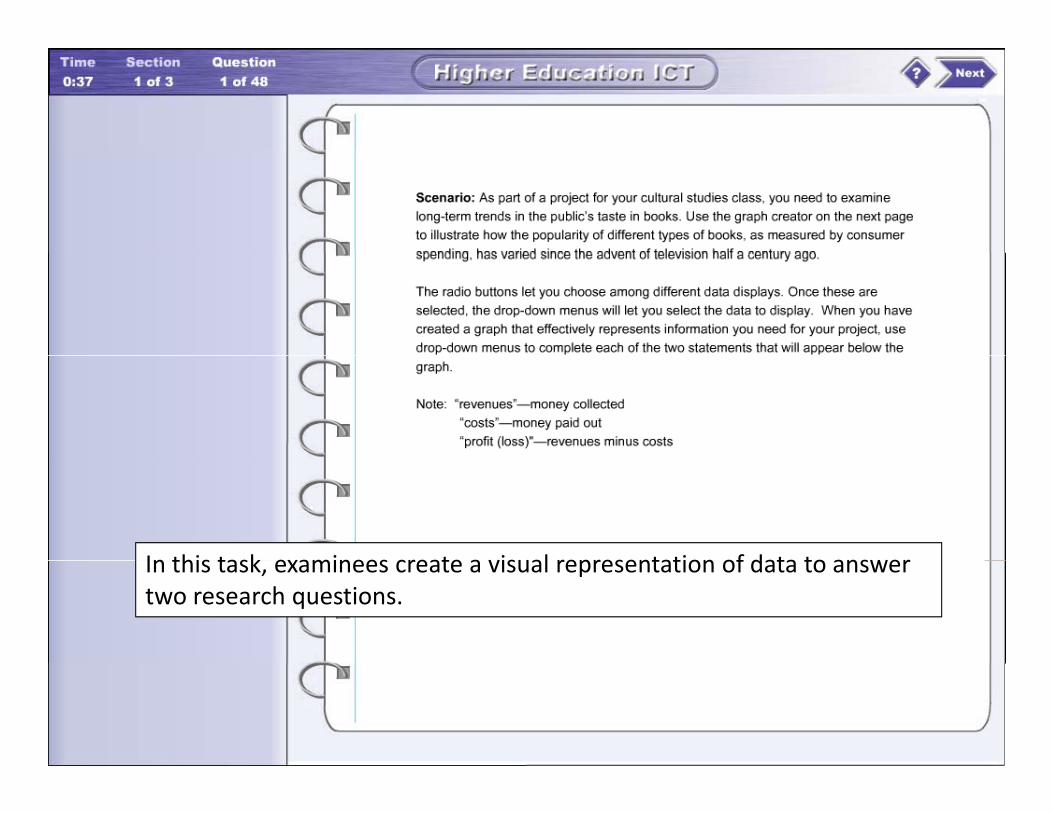
In this task examinees create a visual representation of data to answerIn this task, examinees create a visual representation of data to answer two research questions.

Examinees select which variables to display on p yeach of the axes.

Identifying the correct time span involves considering the implicit requirements of the information need.
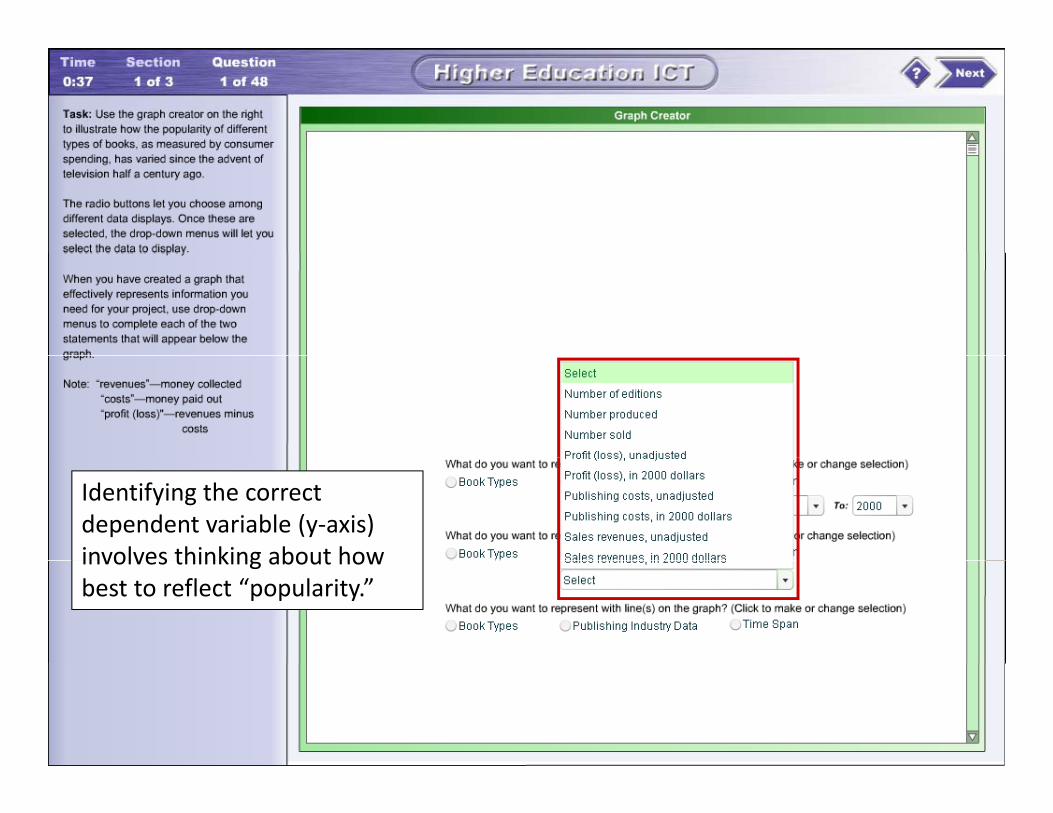
Identifying the correct dependent variable (y‐axis) involves thinking about howinvolves thinking about how best to reflect “popularity.”
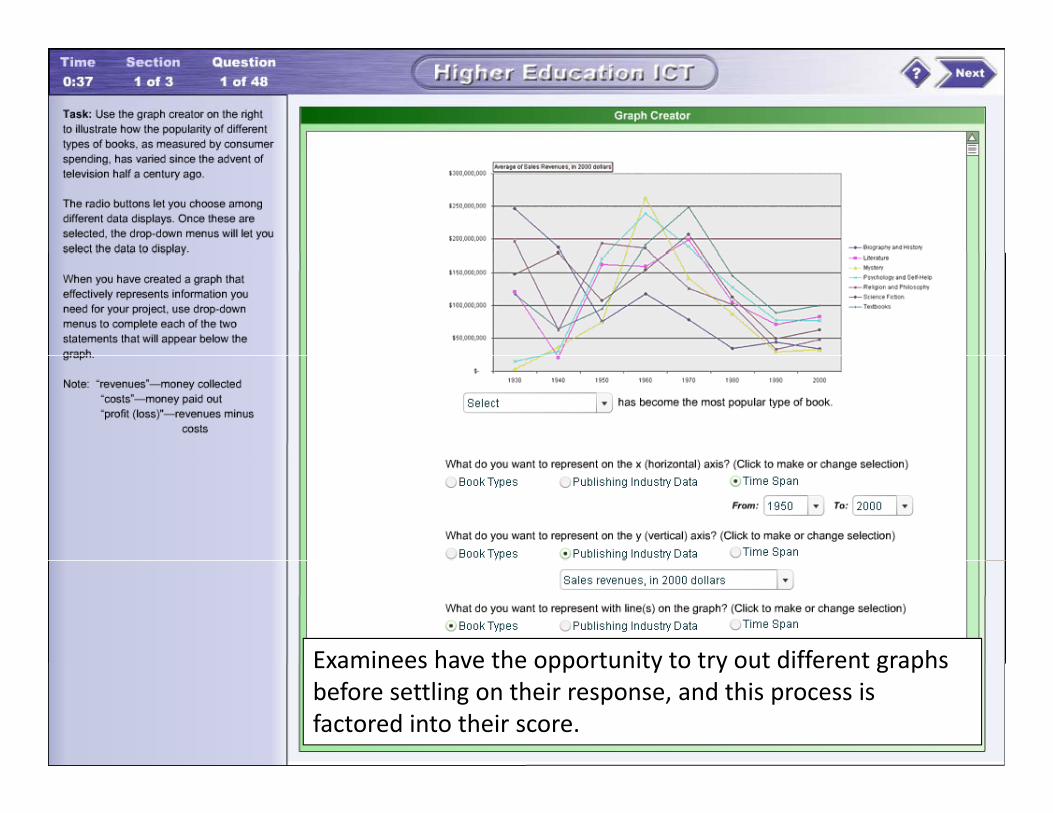
Examinees have the opportunity to try out different graphsExaminees have the opportunity to try out different graphs before settling on their response, and this process is factored into their score.
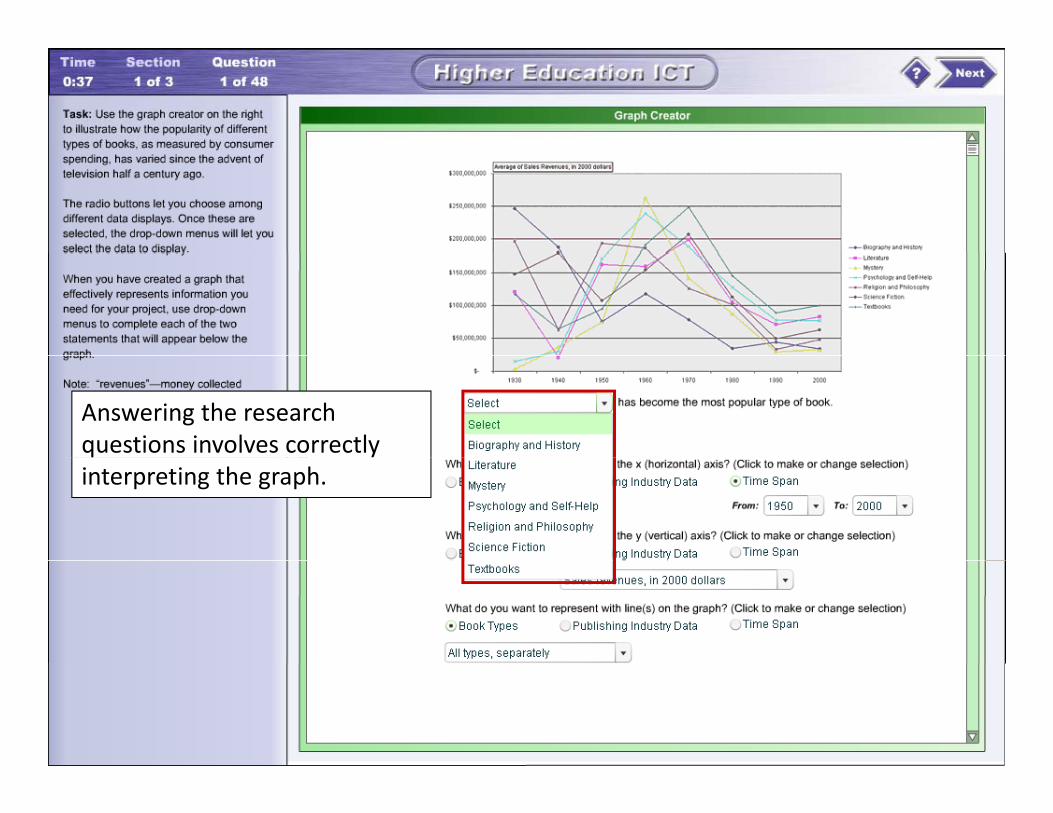
Answering the research questions involves correctly interpreting the graph.
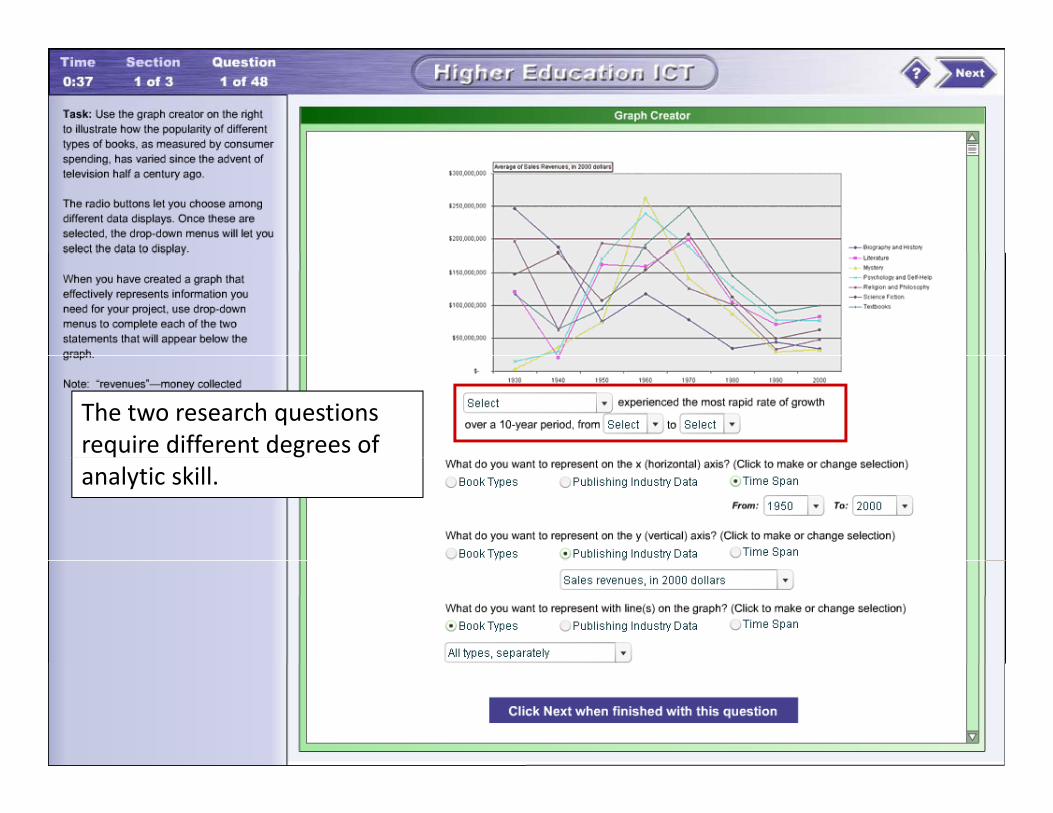
The two research questions require different degrees of analytic skill.

Measuring How We Access
• Task Length: 4-minute duration• Task Type Access: Collect and/or retrieve• Task Type Access: Collect and/or retrieve
information in digital environments.• Within the task the test taker is asked to• Within the task, the test taker is asked to…
– Formulate an advanced search, utilizing Boolean operators, syntactic elementsBoolean operators, syntactic elements (parentheses, quotes), and search parameters.
– Use feedback on likely results to improve search strategy

This task requires examinees to construct an advanced search based on aThis task requires examinees to construct an advanced search based on a complex information need.

A successful examinee must enter the correct search terms and combine them using Boolean operators and syntax…
…and must also select other appropriate
t f thparameters for the search.
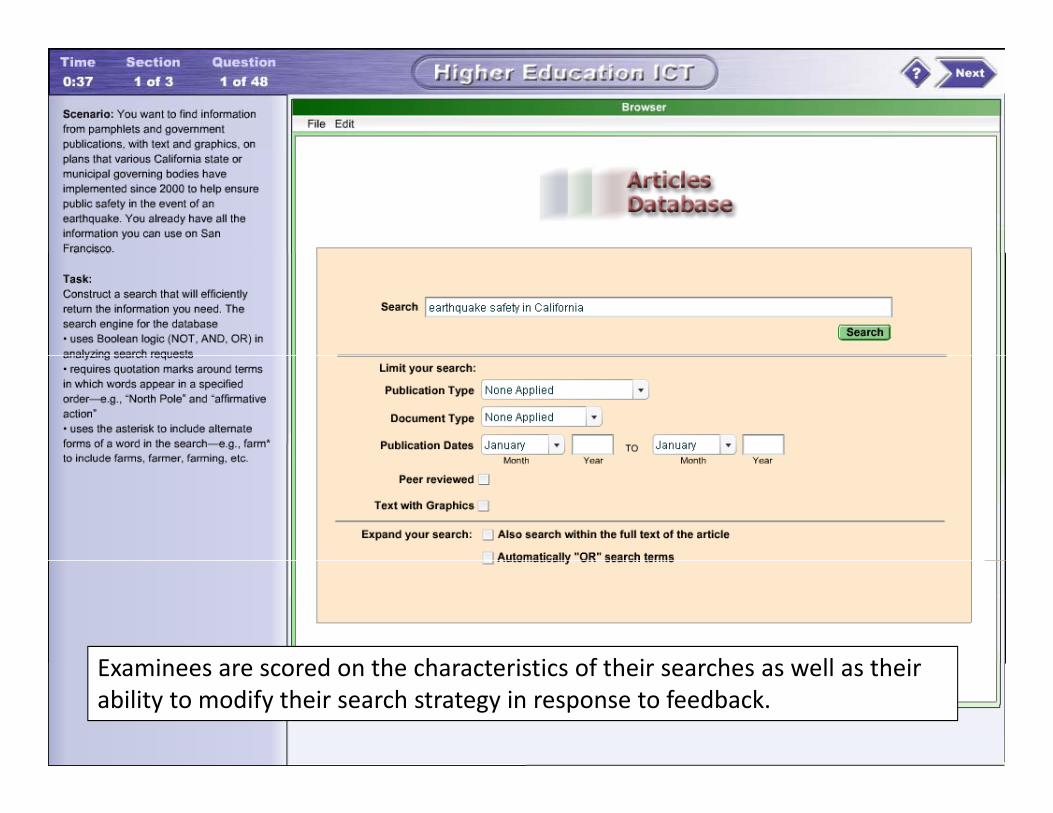
E i d th h t i ti f th i h ll th iExaminees are scored on the characteristics of their searches as well as their ability to modify their search strategy in response to feedback.
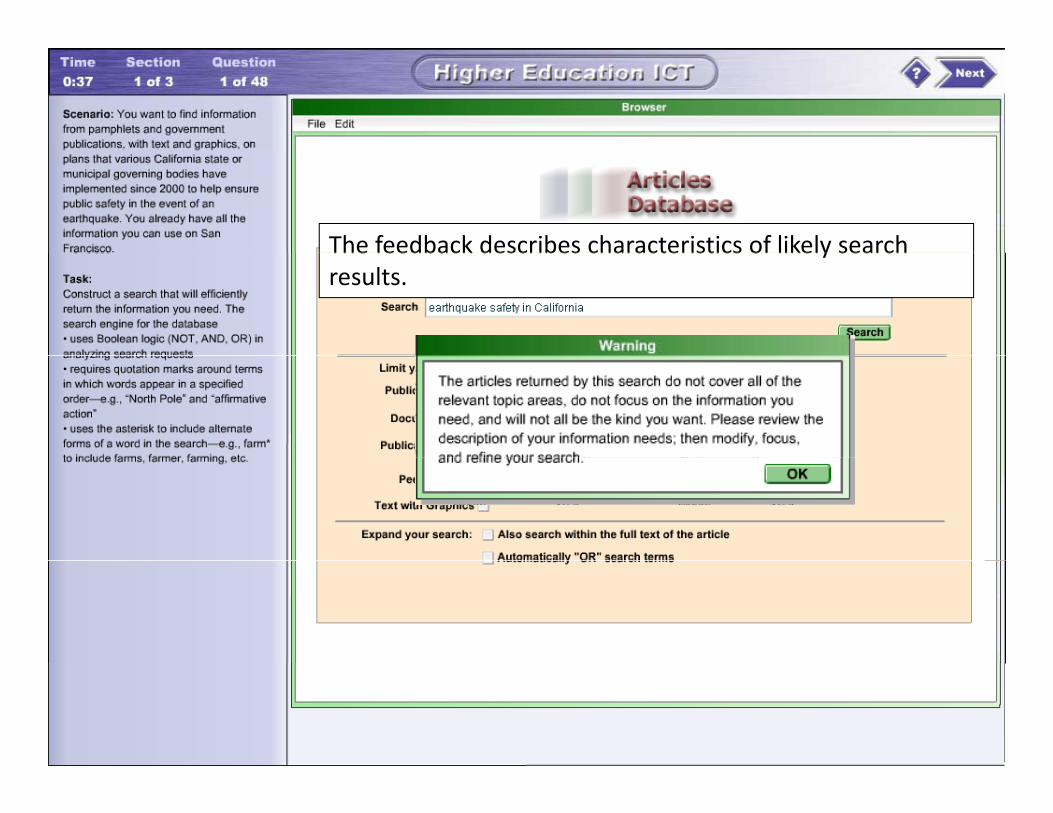
The feedback describes characteristics of likely searchThe feedback describes characteristics of likely search results.
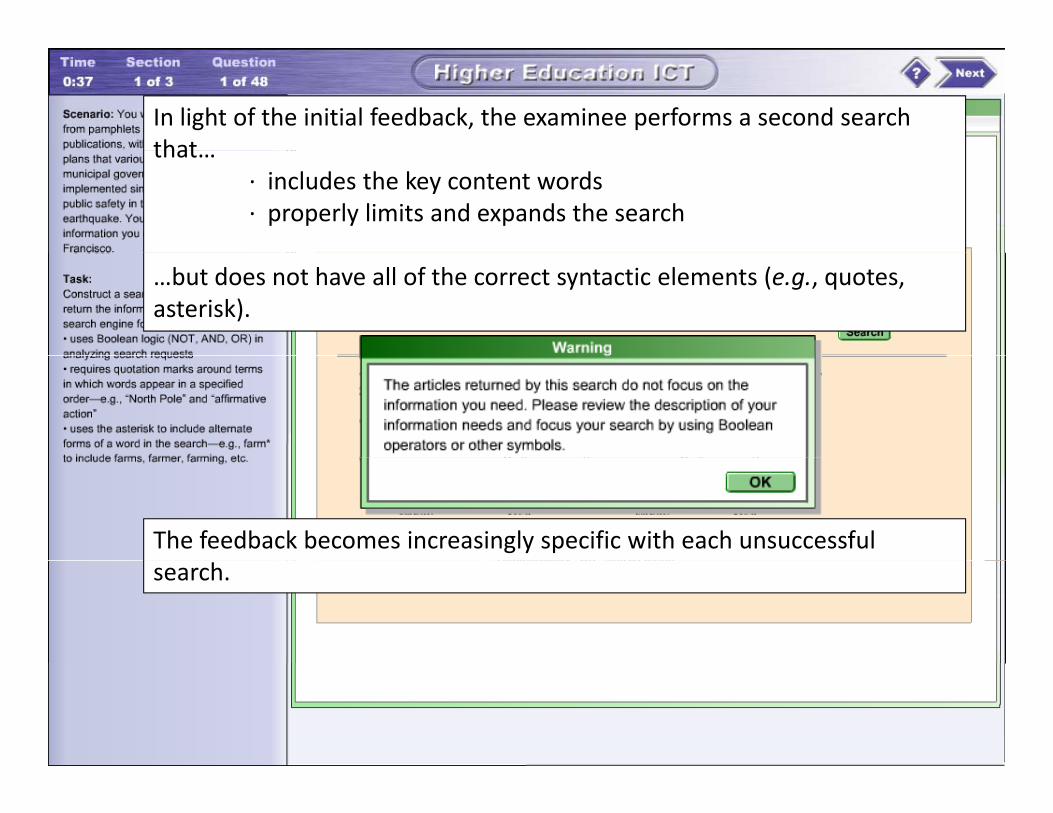
In light of the initial feedback, the examinee performs a second search thatthat…
∙ includes the key content words∙ properly limits and expands the search
…but does not have all of the correct syntactic elements (e.g., quotes, asterisk).
The feedback becomes increasingly specific with each unsuccessful search.
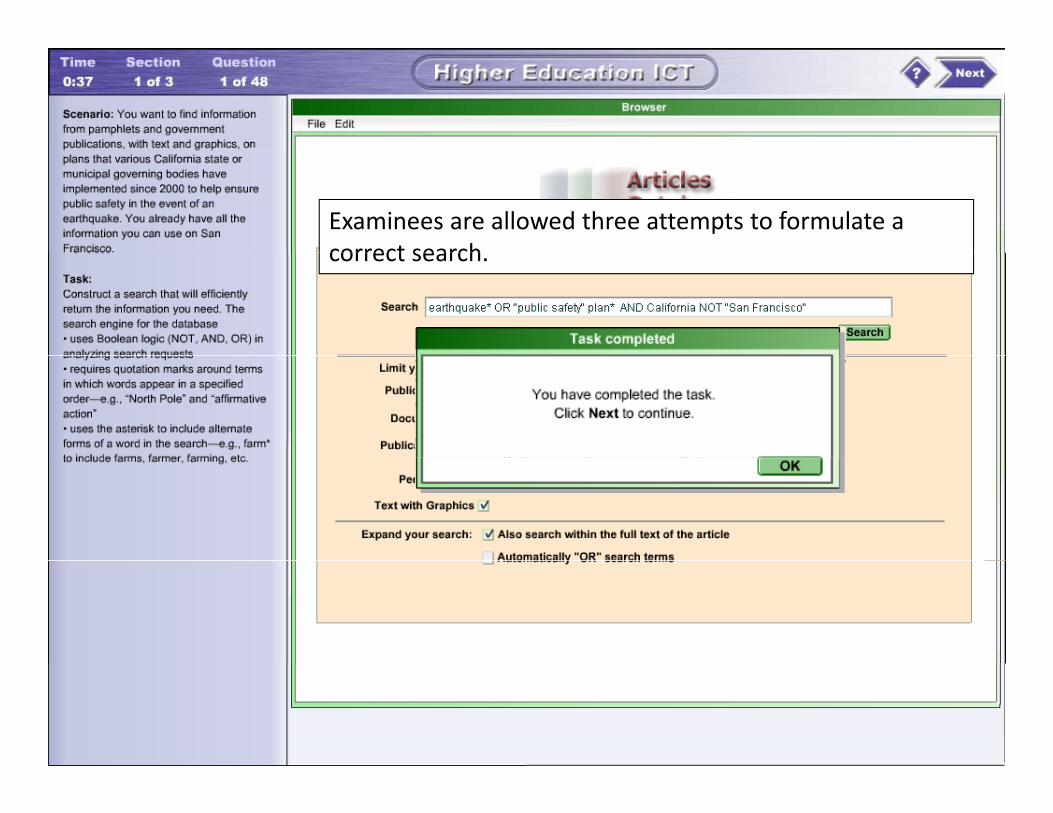
Examinees are allowed three attempts to formulate a correct searchcorrect search.
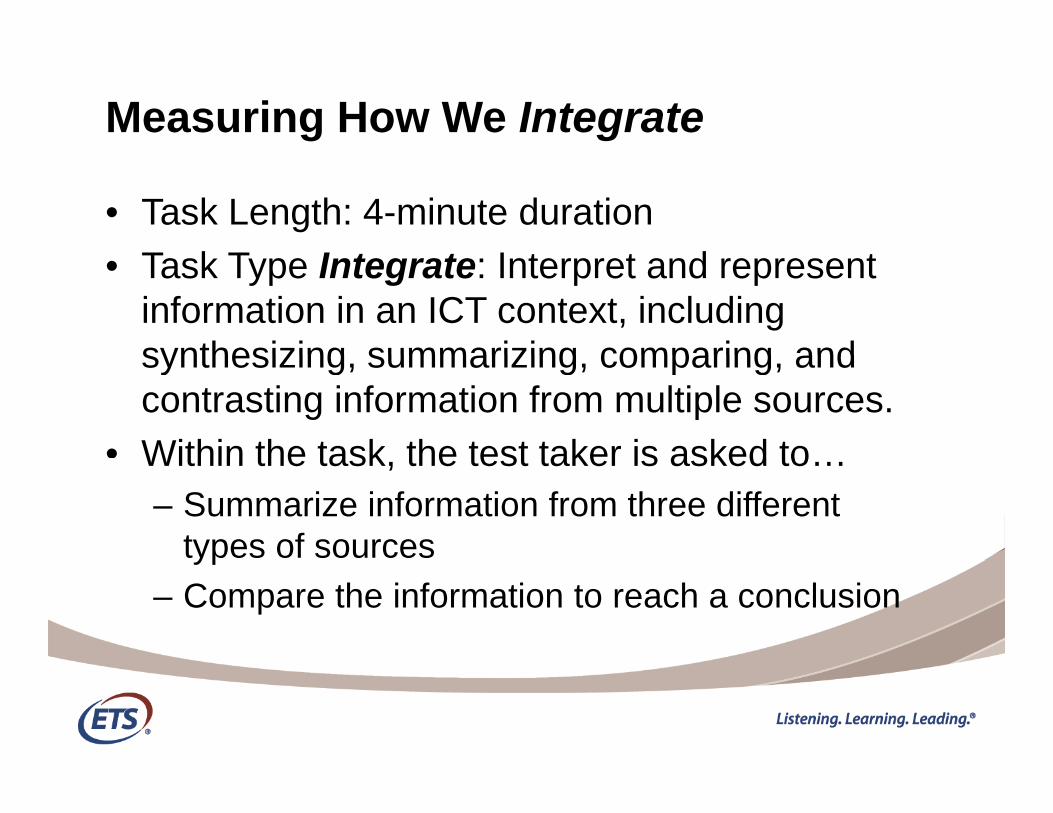
Measuring How We Integrate
• Task Length: 4-minute durationT k T I t t I t t d t• Task Type Integrate: Interpret and represent information in an ICT context, including synthesizing summarizing comparing andsynthesizing, summarizing, comparing, and contrasting information from multiple sources.
• Within the task the test taker is asked toWithin the task, the test taker is asked to…– Summarize information from three different
types of sourcesyp– Compare the information to reach a conclusion

In this task, examinees summarize information from a variety of sources and then draw conclusions from their summary.y

Examinees are presented with an information need and three different types of information sources.

Examinees are presented with an information need and three different types of information sources:three different types of information sources:
1. Webpage

Examinees are presented with an information need and three different types of information sources:three different types of information sources:
2. Email

Examinees are presented with an information need and three different types of information sources:three different types of information sources:
3. Advertisement
The three sources present information according to different conventions. A successful candidate must be able to locate the relevant information in each source.
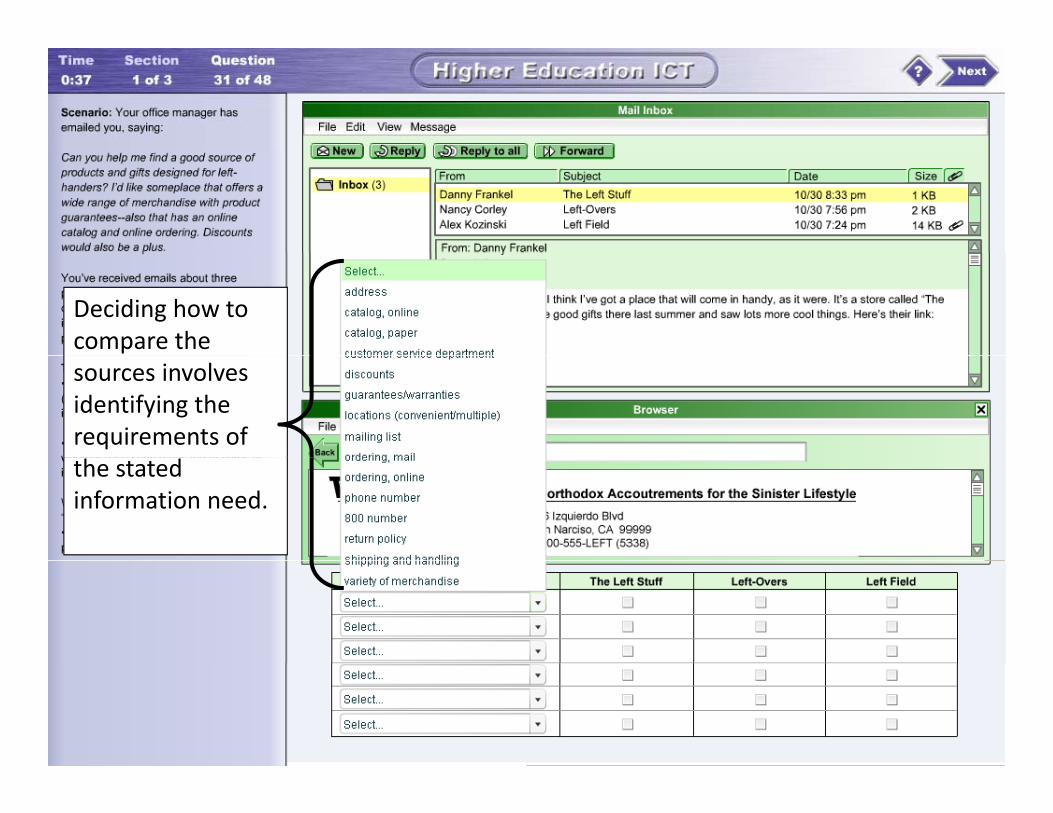
Deciding how to compare the sources involves identifying the requirements of the stated information need.

After filling in the table, examinees must interpretexaminees must interpret the summary to rank the three sources correctly.
Preliminary Research ResultsThe reality about your students’ digital fluency
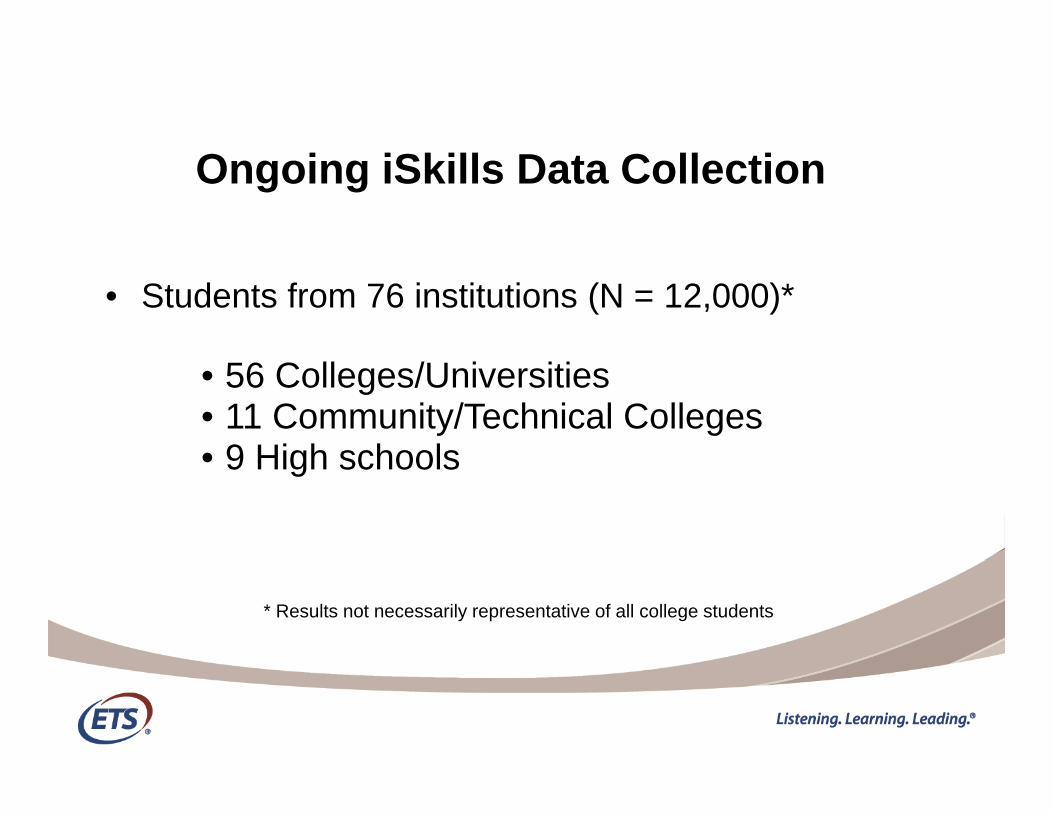
Ongoing iSkills Data Collection
• Students from 76 institutions (N = 12,000)*
• 56 Colleges/Universities• 11 Community/Technical Colleges• 9 High schools• 9 High schools
* Results not necessarily representative of all college students
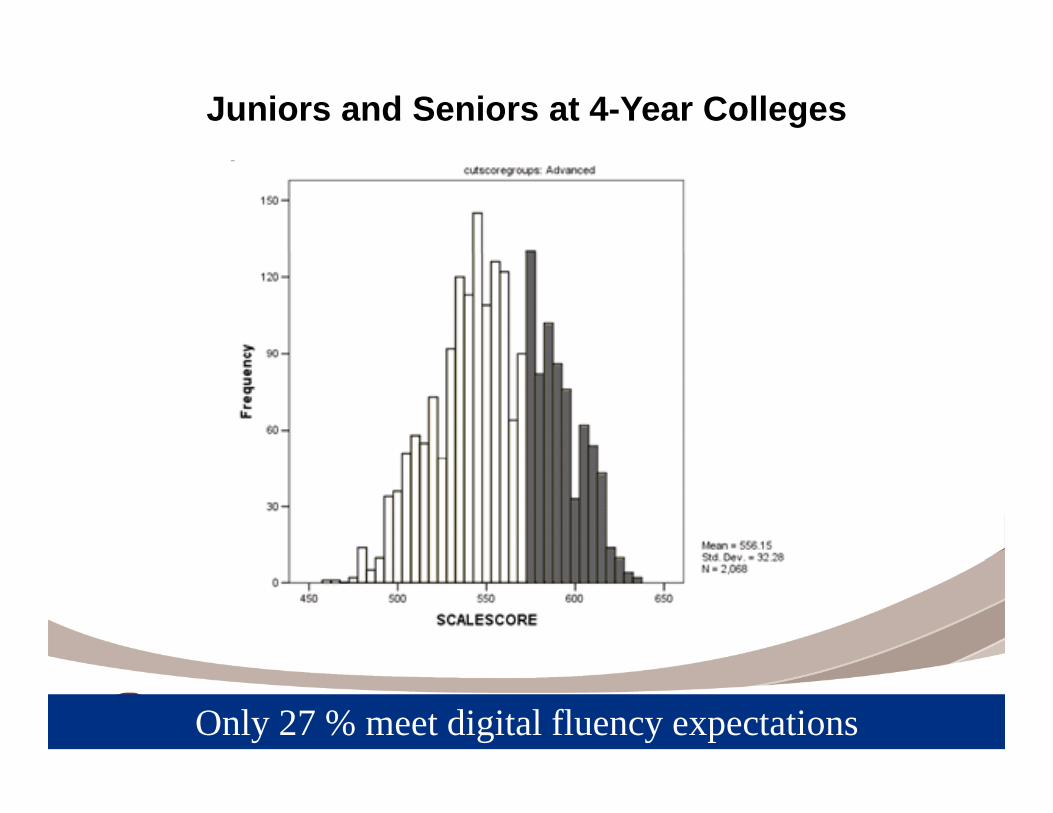
Juniors and Seniors at 4-Year Colleges
Only 27 % meet digital fluency expectations

Room for Student Improvement
• When selecting a research statement for a class assignment, 25% of test takers picked statements that did not address thestatements that did not address the assignment.
• When asked to narrow an overly broad search,When asked to narrow an overly broad search, more than 80% of students could not correctly describe a specific problem with their initial
hsearch.• When asked to evaluate a set of websites, only
48% of test takers identified the website that48% of test takers identified the website that met the criteria of currency, authority and objectivity.
iSkills ReportsThe various uses of the data that iSkills generates
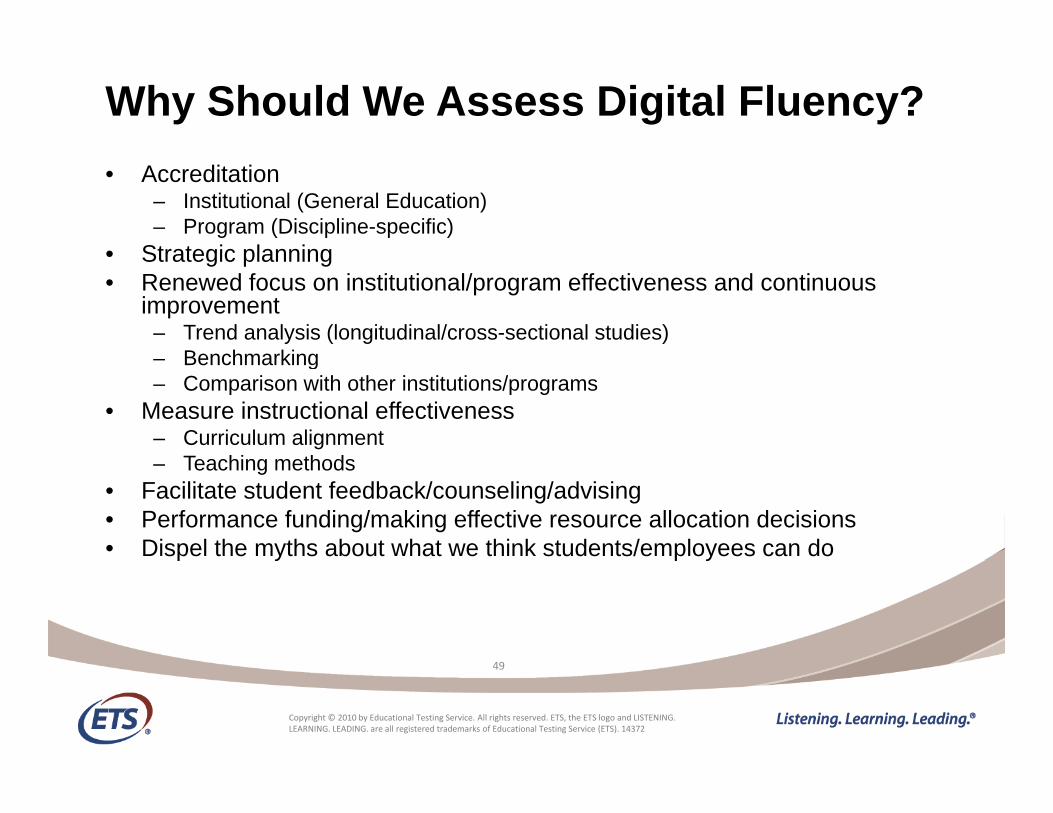
Why Should We Assess Digital Fluency?• Accreditation
– Institutional (General Education)– Program (Discipline-specific)
• Strategic planning• Strategic planning• Renewed focus on institutional/program effectiveness and continuous
improvement– Trend analysis (longitudinal/cross-sectional studies)
Benchmarking– Benchmarking– Comparison with other institutions/programs
• Measure instructional effectiveness– Curriculum alignment
T hi th d– Teaching methods• Facilitate student feedback/counseling/advising• Performance funding/making effective resource allocation decisions• Dispel the myths about what we think students/employees can dop y p y
4949
Copyright © 2010 by Educational Testing Service. All rights reserved. ETS, the ETS logo and LISTENING. LEARNING. LEADING. are all registered trademarks of Educational Testing Service (ETS). 14372
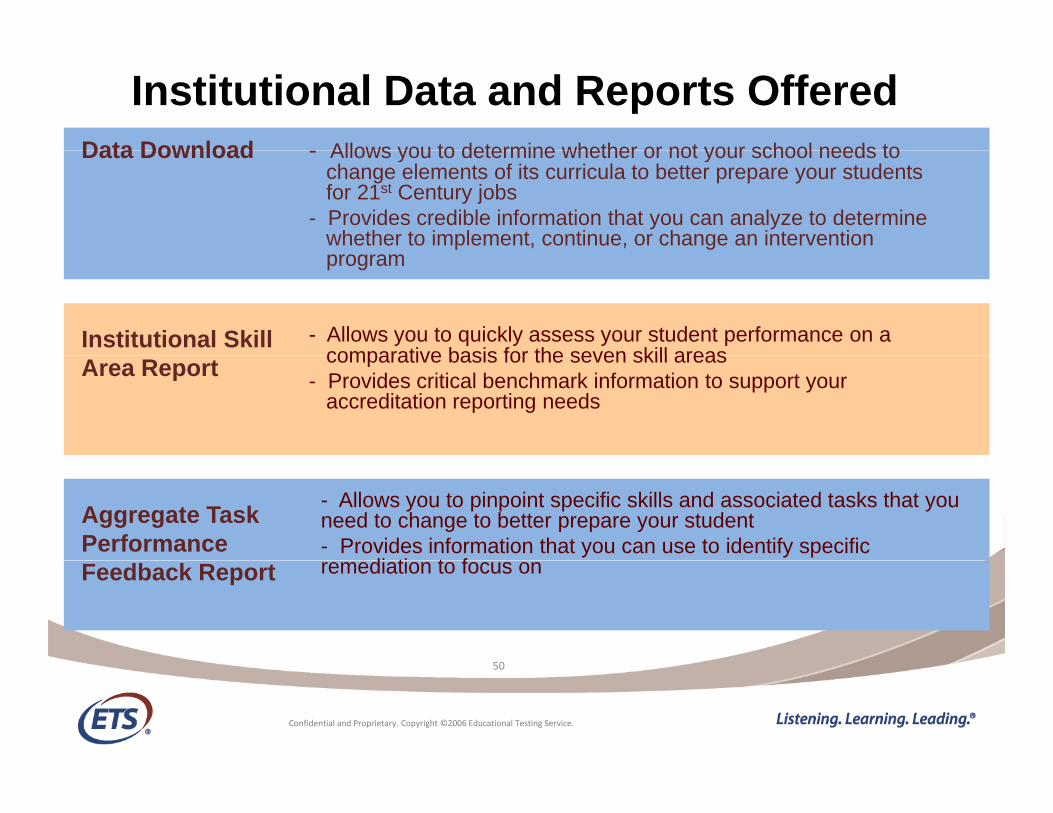
Institutional Data and Reports OfferedData Download Allows you to determine whether or not your school needs toData Download - Allows you to determine whether or not your school needs to
change elements of its curricula to better prepare your students for 21st Century jobs
- Provides credible information that you can analyze to determine whether to implement, continue, or change an intervention
- Allows you to quickly assess your student performance on a comparative basis for the seven skill areas
program
Institutional Skill comparative basis for the seven skill areas
- Provides critical benchmark information to support your accreditation reporting needs
Area Report
- Allows you to pinpoint specific skills and associated tasks that you need to change to better prepare your student- Provides information that you can use to identify specific
di ti t f
Aggregate Task Performance
50
remediation to focus onFeedback Report
50
Confidential and Proprietary. Copyright ©2006 Educational Testing Service.

How do institutions useiSkills Institutional Data and Reports?p
• Test results are a portion of the data that might be used for different decision makingg
• This is how some institutions are using the results:– Helping to determine placement of transfer students– Pre- and post-testing in conjunction with interventionPre and post testing in conjunction with intervention– End-of-course exams– Measuring outcomes– Meet accreditation requirementsq
• Guide student in their academic careers• Collect evidence used for accreditation
51
• Perform curriculum evaluation
51
Confidential and Proprietary. Copyright ©2006 Educational Testing Service.

Individual Student Score Report
5252
Confidential and Proprietary. Copyright ©2006 Educational Testing Service.
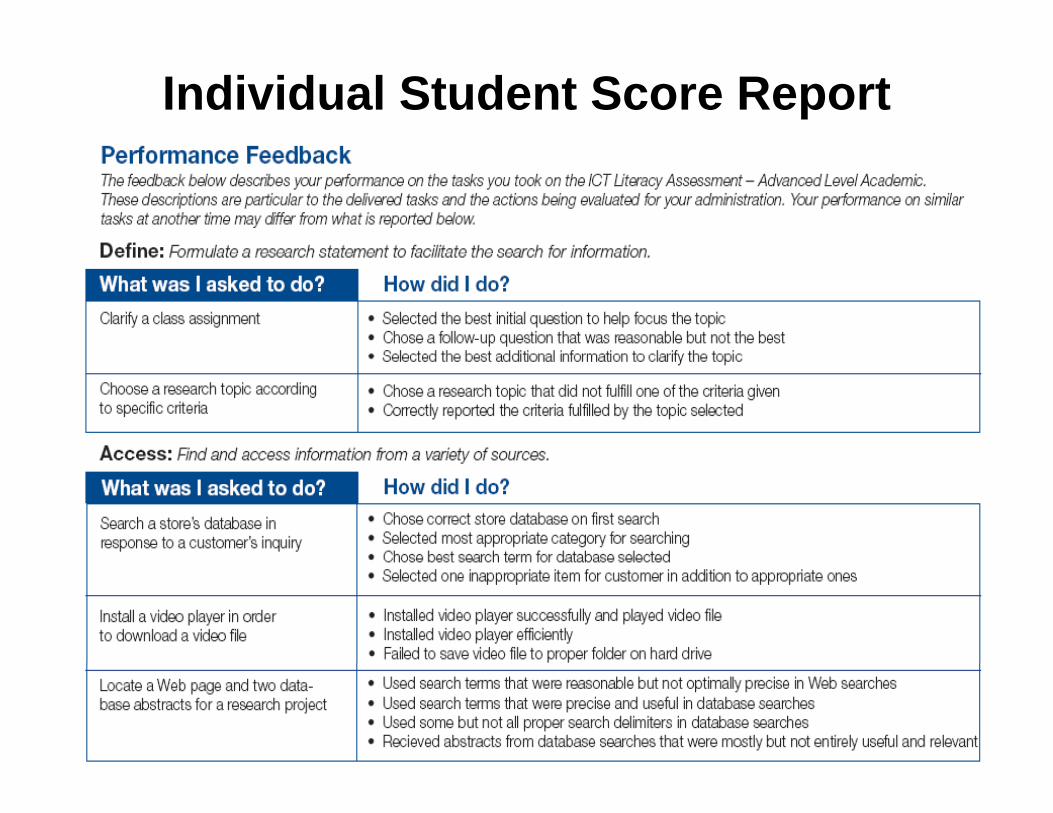
Individual Student Score Report
5353
Confidential and Proprietary. Copyright ©2006 Educational Testing Service.© 2007, Educational Testing Service. All rights reserved
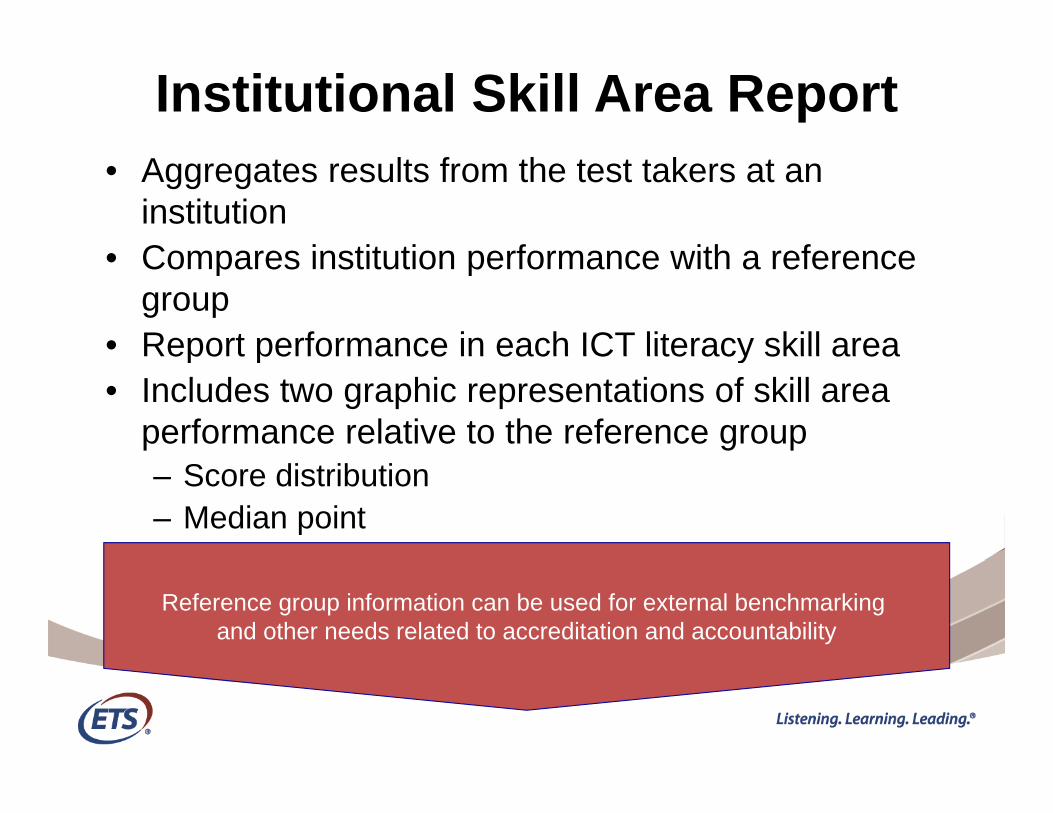
Institutional Skill Area Report• Aggregates results from the test takers at an
institution • Compares institution performance with a reference• Compares institution performance with a reference
group• Report performance in each ICT literacy skill areaReport performance in each ICT literacy skill area• Includes two graphic representations of skill area
performance relative to the reference group– Score distribution– Median point
54
Reference group information can be used for external benchmarking and other needs related to accreditation and accountability
54

Institutional Skill Area Report
5555
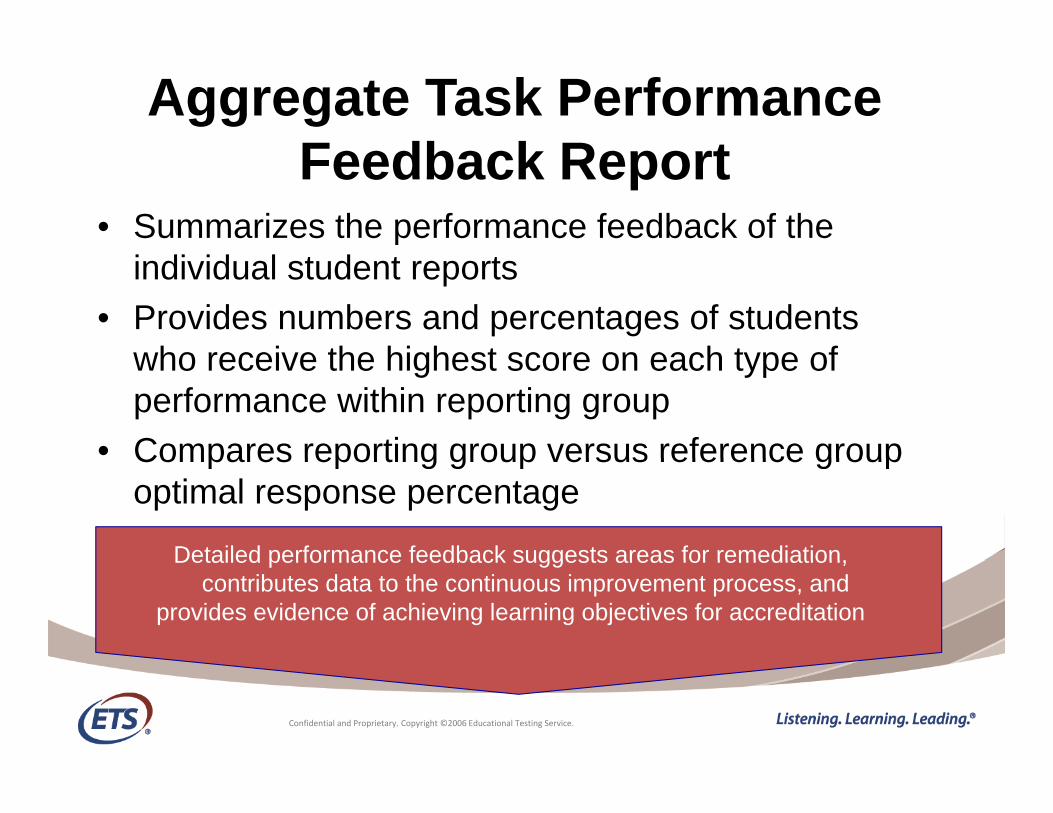
Aggregate Task Performance F db k R tFeedback Report
• Summarizes the performance feedback of the individual student reports
• Provides numbers and percentages of students who receive the highest score on each type ofwho receive the highest score on each type of performance within reporting group
• Compares reporting group versus reference groupCompares reporting group versus reference group optimal response percentage
Detailed performance feedback suggests areas for remediation,
56
Detailed performance feedback suggests areas for remediation, contributes data to the continuous improvement process, and
provides evidence of achieving learning objectives for accreditation
56
Confidential and Proprietary. Copyright ©2006 Educational Testing Service.
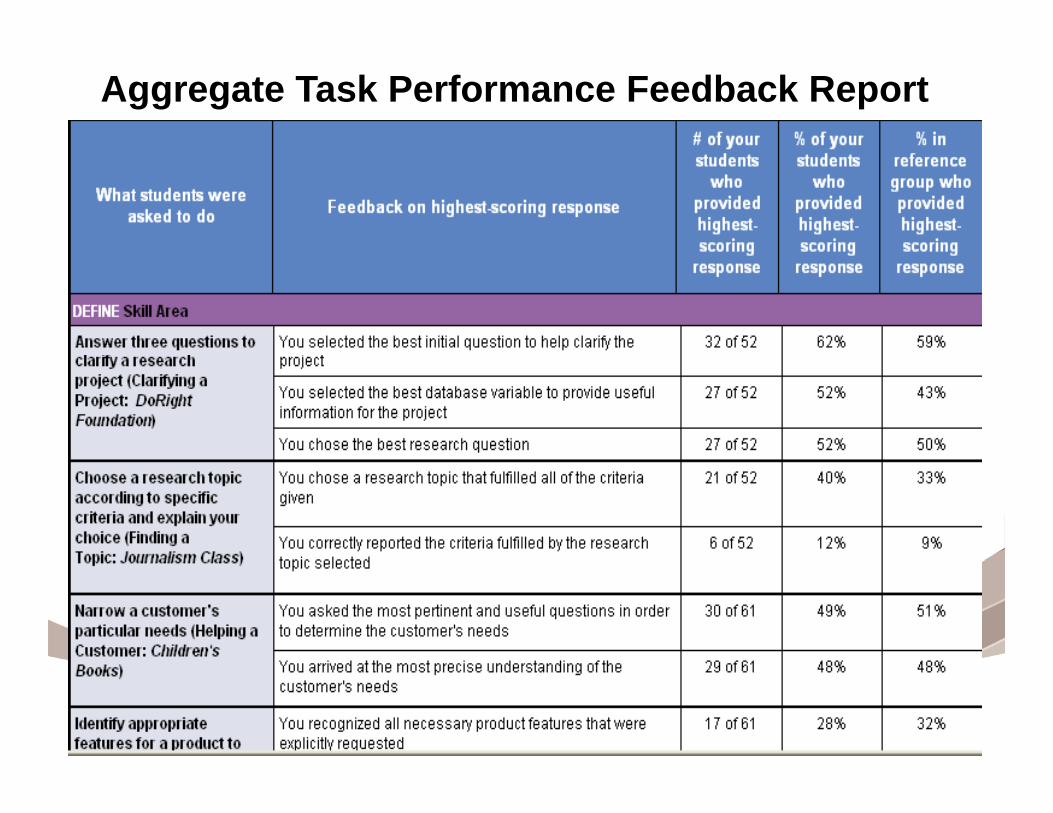
Aggregate Task Performance Feedback Report
5757
Confidential and Proprietary. Copyright ©2006 Educational Testing Service.
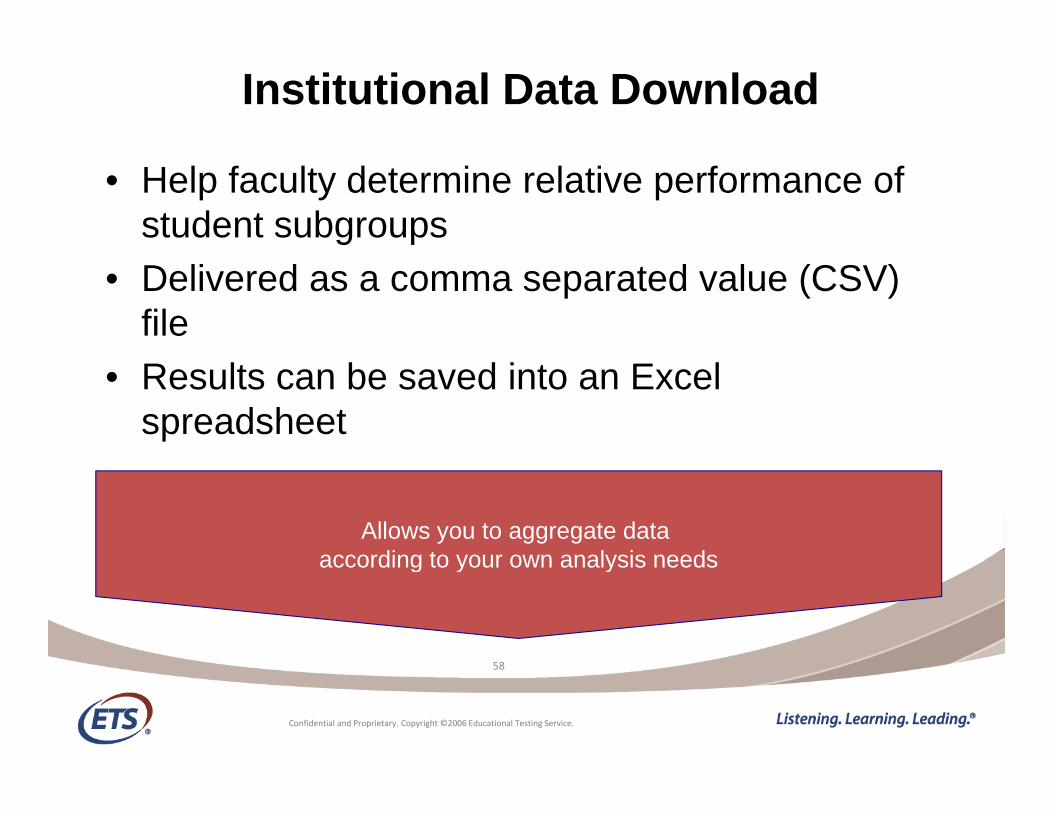
Institutional Data Download
• Help faculty determine relative performance of student subgroups
• Delivered as a comma separated value (CSV) file
• Results can be saved into an Excel spreadsheet
Allows you to aggregate data according to your own analysis needs
58
according to your own analysis needs
58
Confidential and Proprietary. Copyright ©2006 Educational Testing Service.

Institutional Data DownloadAdministrative Information Unique IdentifiersAdministrative Information Candidate test date Product tested School where test was administered
Unique Identifiers Unique ETS student ID Unique test result identifier Self-reported student ID
Student Profile Data Student Demographic DataStudent Profile Data Student name (first, middle, last,
suffix) Address (street, city, state, zip,
country) Phone
Student Demographic Data Race Gender Birth date
Phone E-mail
Student Background Information Which language did you learn to
speak first
Association with current education
institution SAT Math scorespeak first Which language do you know best Current education level Undergraduate grade-point average in
field of study Overall undergraduate grade-point
institution SAT Math score SAT Verbal score ACT score Transfer credits Classes taken this tern Full or part-time status
59
Overall undergraduate grade point average in high school
Citizenship status Undergraduate field of study
Full or part time status Work status Work hours Post high school plans
59
Confidential and Proprietary. Copyright ©2006 Educational Testing Service.

Institutional Data Download
60
Download results can be saved into an Excel spreadsheet and analyzed
60
Confidential and Proprietary. Copyright ©2006 Educational Testing Service.
Summary
Technology challenges students’ critical thinking skillscritical thinking skills
iSkills measures digital fluency: criticaliSkills measures digital fluency: critical use of information via technology
61
Copyright © 2012 by Educational Testing Service. All rights reserved. ETS, the ETS logo and LISTENING. LEARNING. LEADING. are all registered trademarks of Educational Testing Service (ETS).
Questions and Comments?
S• Visit the ETS Higher Education Assessment web pages at www.ets.org/iSkills to learn more about the iSkills assessment
• Contact an iSkills assessment expert toll free at 1-800-745-0269
6262
Copyright © 2012 by Educational Testing Service. All rights reserved. ETS, the ETS logo and LISTENING. LEARNING. LEADING. are all registered trademarks of Educational Testing Service (ETS).