Embed Size (px)
Citation preview
What is SDM?
• SDM : Server and Database Monitoring SDM is the web-based real-time server and database monitoring
and reporting tool
Service Items• Server Resource Reporting
• Server Monitoring
• Database Monitoring
• Resource Simulating
• TSD Reporting (problem)
Architecture
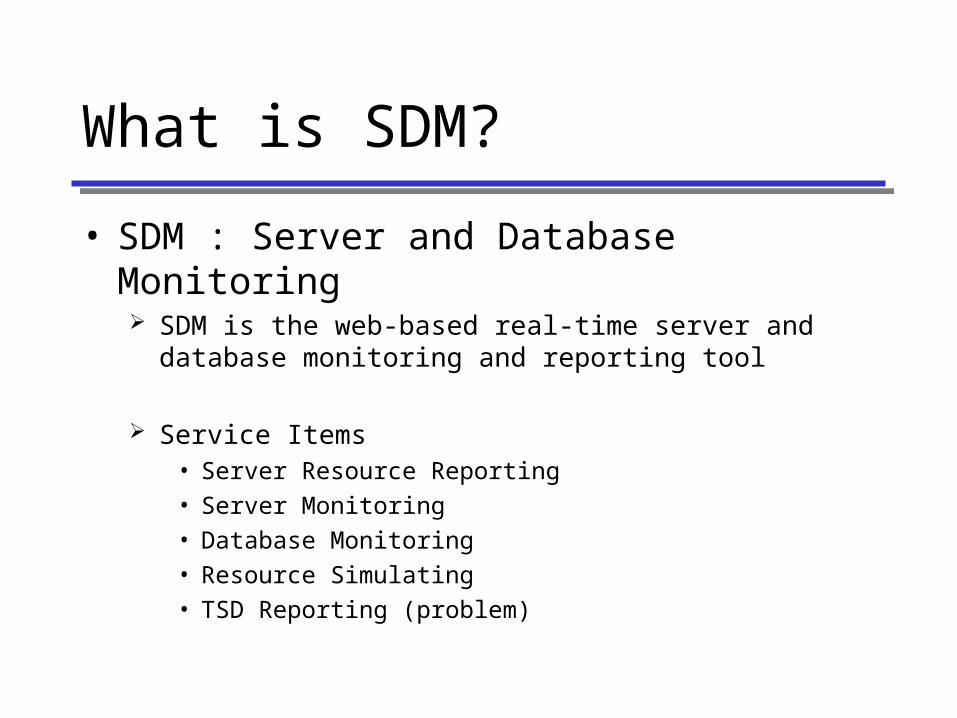
Customer Web Layer
Customer DB Layer
Transfer data using FTP
Gathering Data using SHELL
Gathering Data using SHELLSDM ServerServer : Linux, Web: ApacheDB : rrdtoolCGI : Perl5Analysis Module : Shell, CGI
Web Server(Server Resource Report)
Operator
Customer
Internet USF
Transfer data using FTP
Real TimeServer Resource &Database Monitor
httpd
httpd
Basic Flow
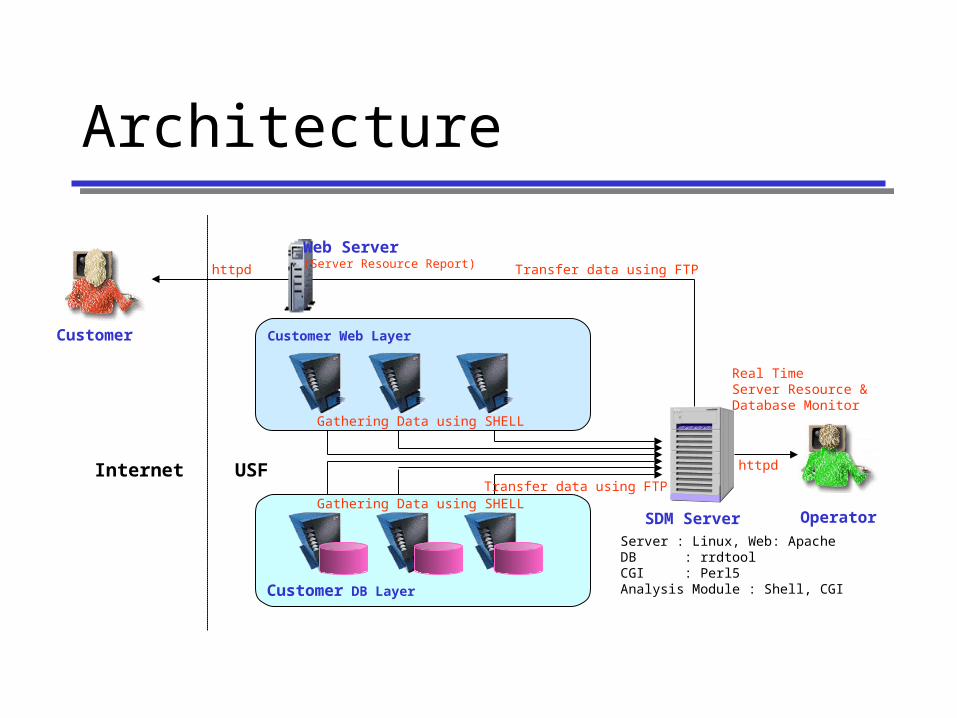
Gathering data Analyzing data Monitoring dataFTP HTTP
Agent Layer Analysis Layer Web Interface Layer
• Gather raw data from monitoring target server
• Using SHELL script
(ex. ksh, perl, awk…)
• Basic monitoring items are from Tivoli
• User can add an optional items
• Polling time : 15 minute (change available)
• Transfer raw data from target servers by FTP
• Save raw data to archive directory
• Analyzing data using batch or CGI program
• CGI : perl *
• Graph : gd library * *
• Data archive : rrdtool * * *
• All of monitoring data and report are provided using Web-interface
• Server admin, DBA, operator and customer can use SDM
• Only web browser needed
• Notification (alarm, mail…)
• Auto generating report
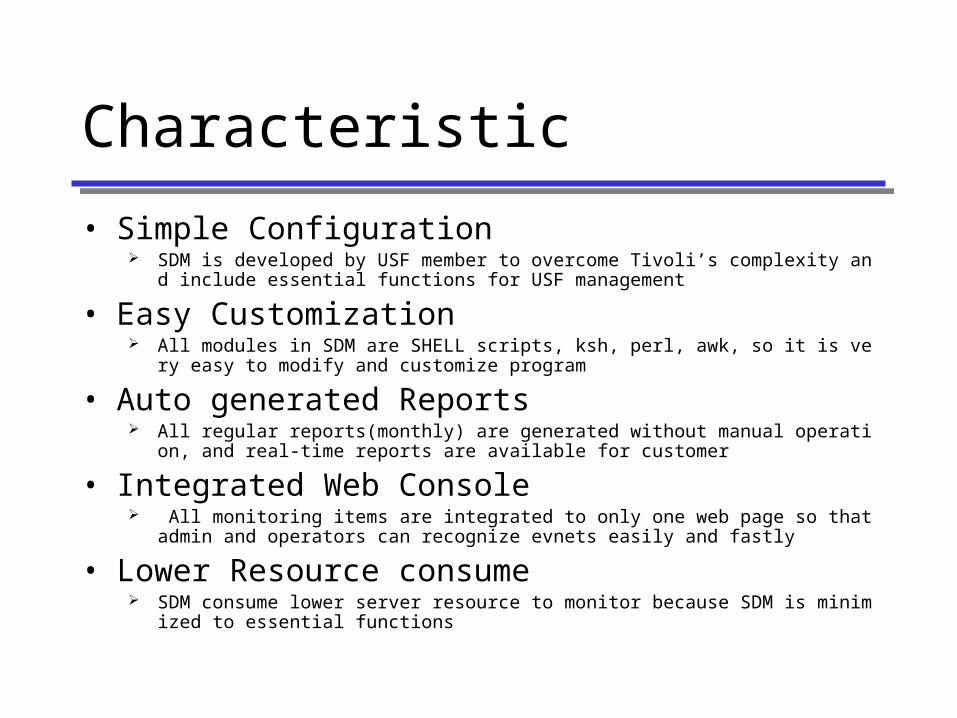
Characteristic
• Simple Configuration SDM is developed by USF member to overcome Tivoli’s complexity and include essential fun
ctions for USF management
• Easy Customization All modules in SDM are SHELL scripts, ksh, perl, awk, so it is very easy to modify and custo
mize program
• Auto generated Reports All regular reports(monthly) are generated without manual operation, and real-time reports are
available for customer
• Integrated Web Console All monitoring items are integrated to only one web page so that admin and operators can reco
gnize evnets easily and fastly
• Lower Resource consume SDM consume lower server resource to monitor because SDM is minimized to essential functi
ons
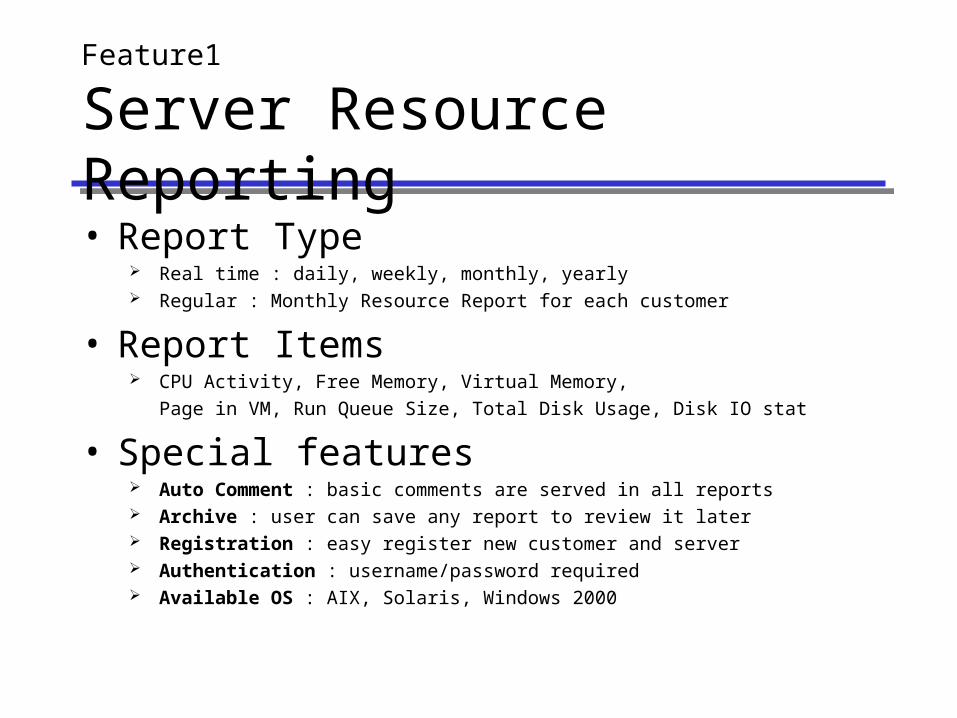
Feature1
Server Resource Reporting
• Report Type Real time : daily, weekly, monthly, yearly Regular : Monthly Resource Report for each customer
• Report Items CPU Activity, Free Memory, Virtual Memory,
Page in VM, Run Queue Size, Total Disk Usage, Disk IO stat
• Special features Auto Comment : basic comments are served in all reports Archive : user can save any report to review it later Registration : easy register new customer and server Authentication : username/password required Available OS : AIX, Solaris, Windows 2000
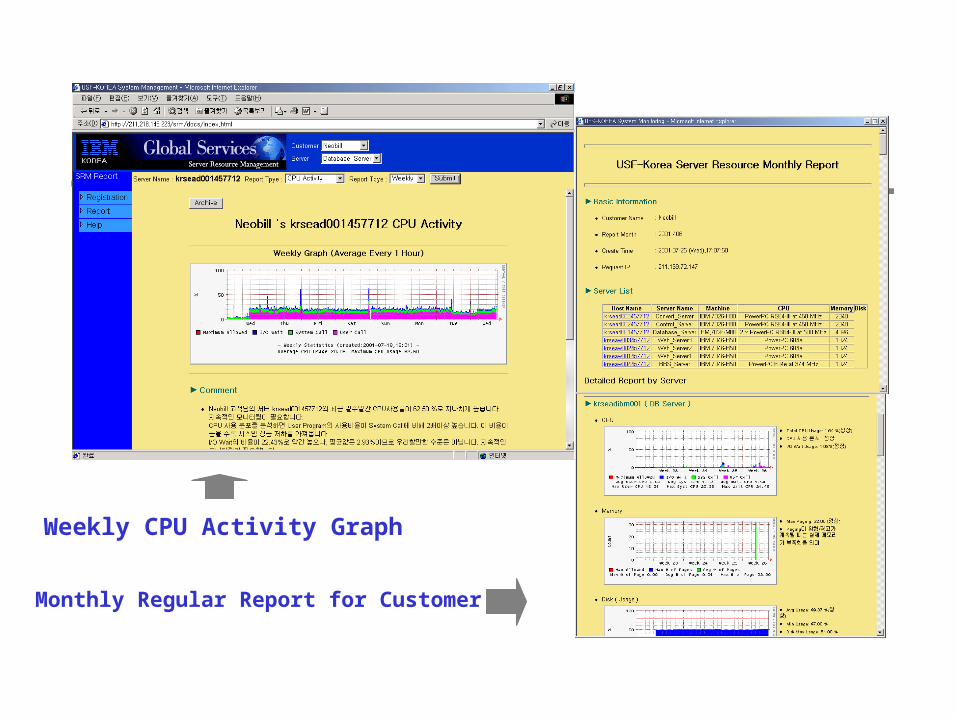
Weekly CPU Activity Graph
Monthly Regular Report for Customer
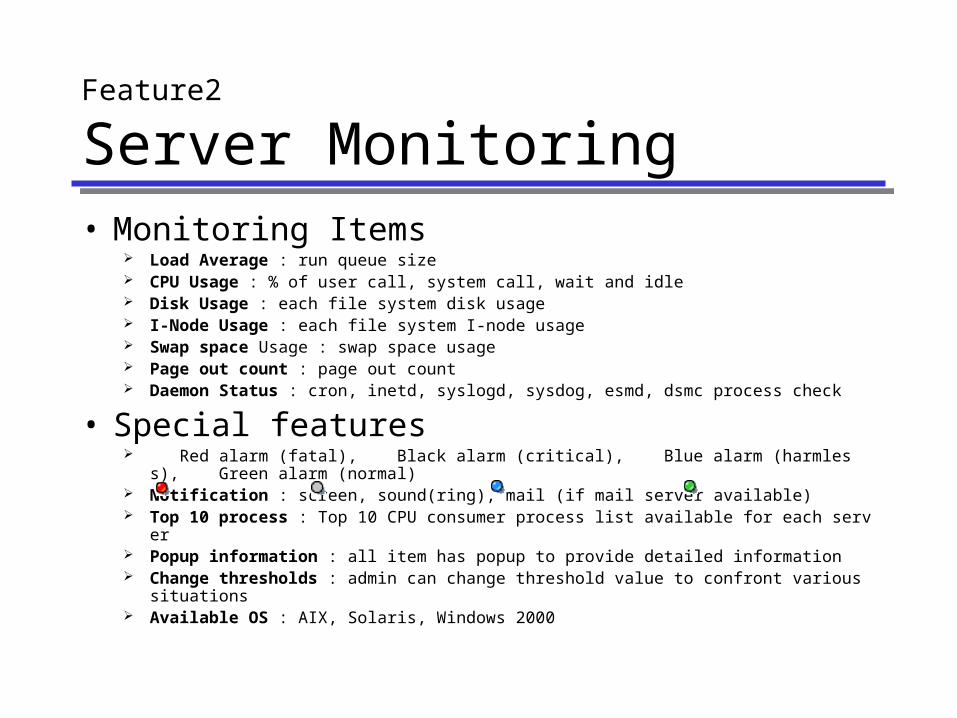
• Monitoring Items Load Average : run queue size CPU Usage : % of user call, system call, wait and idle Disk Usage : each file system disk usage I-Node Usage : each file system I-node usage Swap space Usage : swap space usage Page out count : page out count Daemon Status : cron, inetd, syslogd, sysdog, esmd, dsmc process check
• Special features Red alarm (fatal), Black alarm (critical), Blue alarm (harmless), Green alarm (normal) Notification : screen, sound(ring), mail (if mail server available) Top 10 process : Top 10 CPU consumer process list available for each server Popup information : all item has popup to provide detailed information Change thresholds : admin can change threshold value to confront various situations Available OS : AIX, Solaris, Windows 2000
Feature2
Server Monitoring
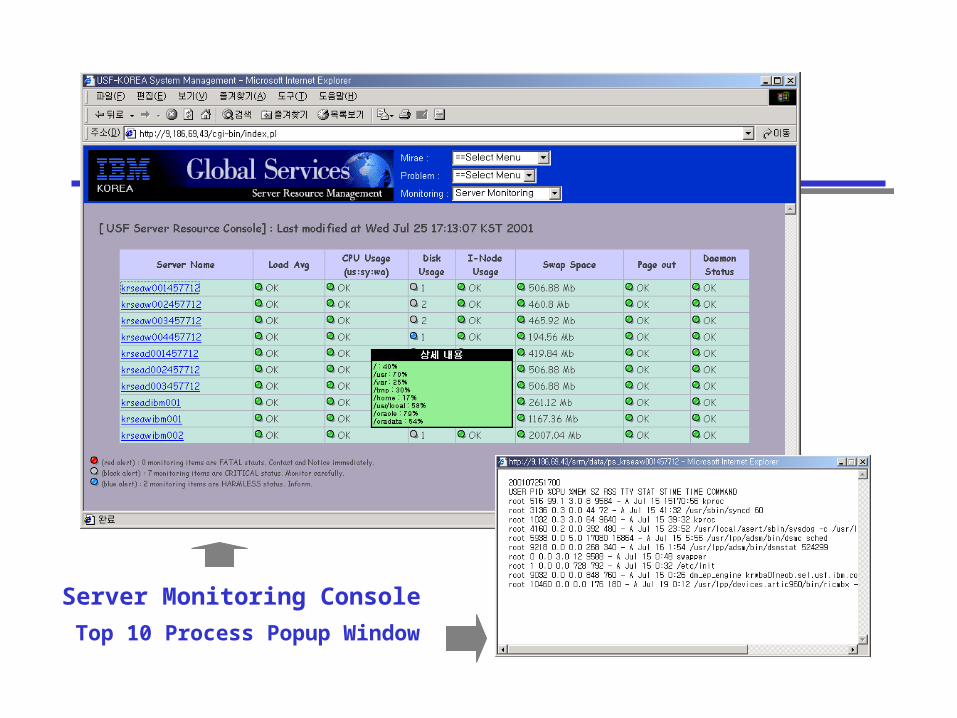
Server Monitoring Console
Top 10 Process Popup Window
• Monitoring Item
• Special features Red alarm (fatal), Black alarm (critical), Blue alarm (harmless), Green alarm (normal) Notification : screen, sound(ring), mail (if mail server available) Popup information : all item has popup to provide detailed information Change thresholds : admin can change threshold value to confront various situations
Feature3
Database Monitoring
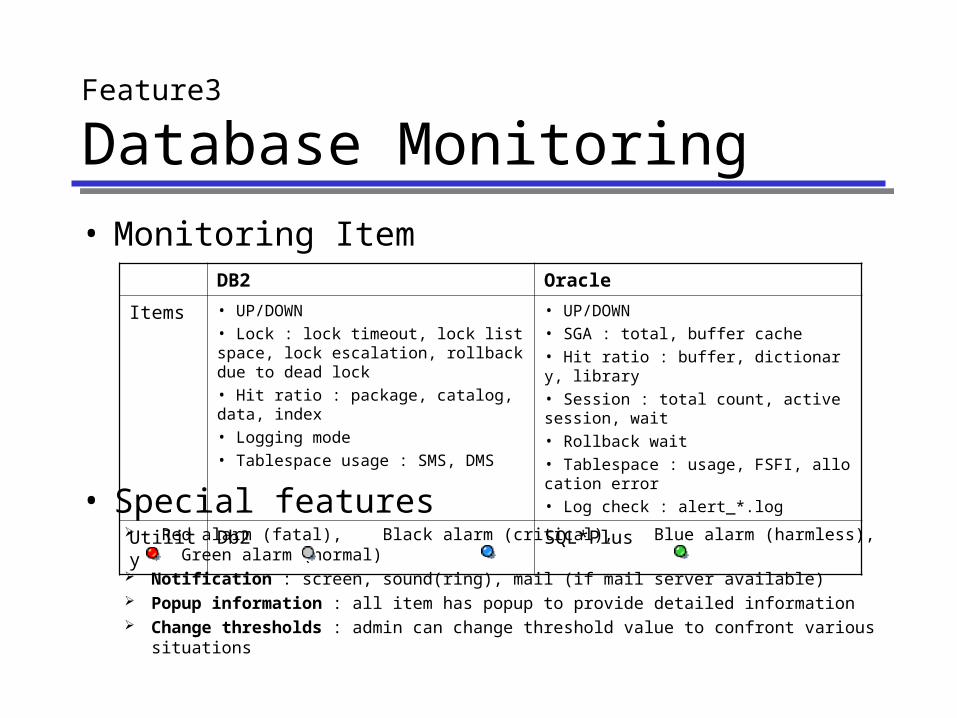
DB2 Oracle
Items • UP/DOWN
• Lock : lock timeout, lock list space, lock escalation, rollback due to dead lock
• Hit ratio : package, catalog, data, index
• Logging mode
• Tablespace usage : SMS, DMS
• UP/DOWN
• SGA : total, buffer cache
• Hit ratio : buffer, dictionary, library
• Session : total count, active session, wait
• Rollback wait
• Tablespace : usage, FSFI, allocation error
• Log check : alert_*.log
Utility Db2 SQL*Plus
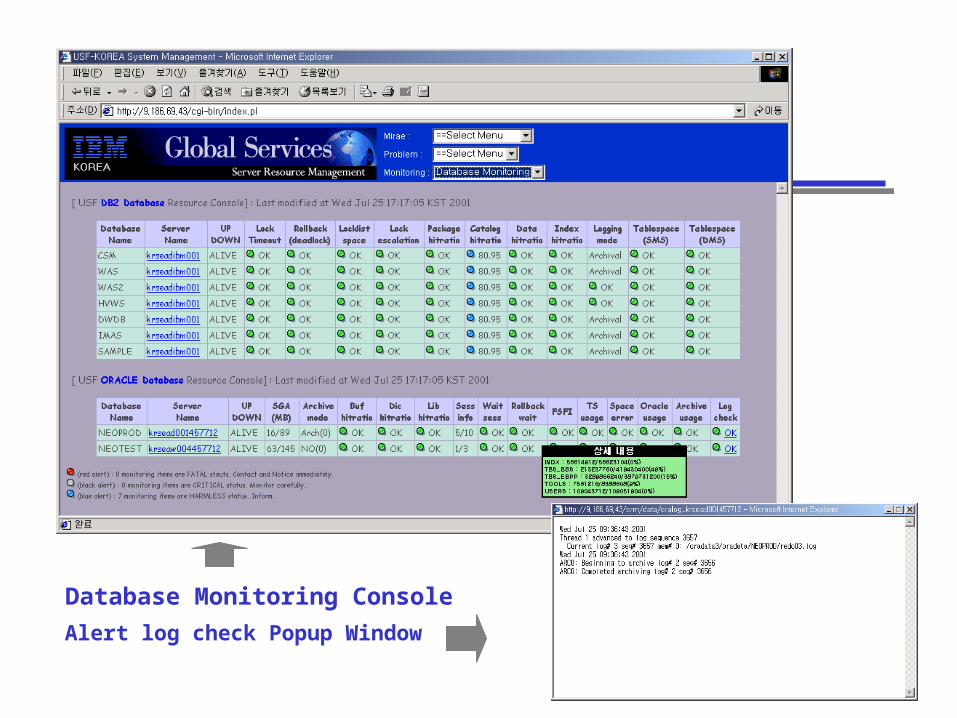
Database Monitoring Console
Alert log check Popup Window
• What is Resource Simulating? Sometimes, need to show previous monitoring data like a real-time monitoring
console ( for example; when you want to show previous night problem status) You can select
• Date, hour, minute (interval 15 minutes)
• Speed : slow, normal, fast, very fast
• Special features Monitoring items : Same to server monitoring PAUSE/CONTINUE : you can pause simulation and continue STOP : you can stop simulate Any time you want to see
Feature4
Resource Simulating
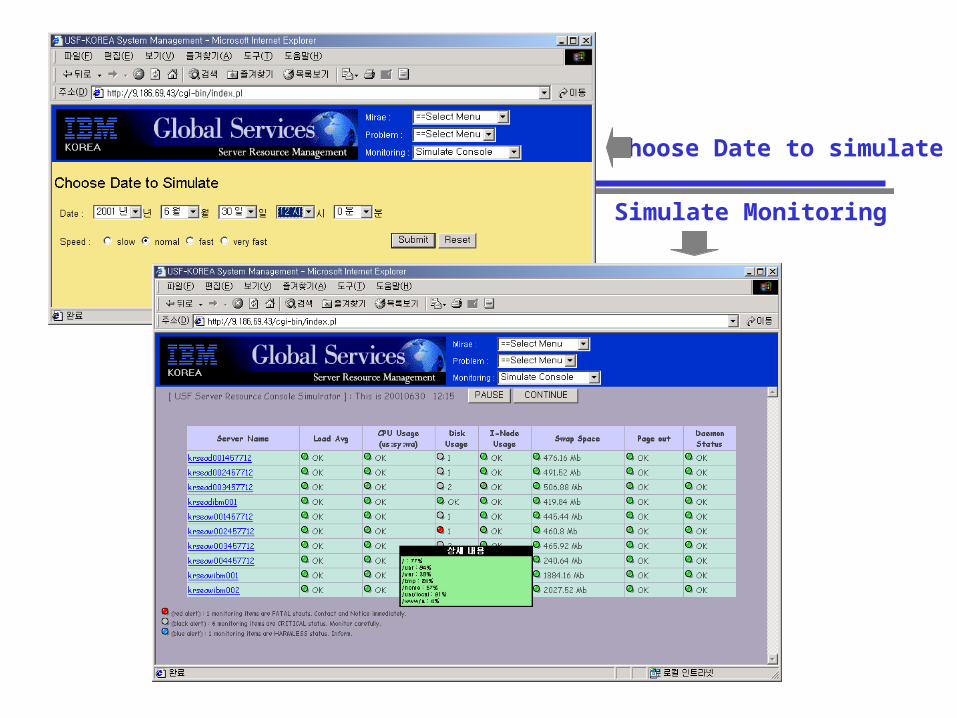
Choose Date to simulate
Simulate Monitoring
• Problem reports from TSD Database Daily Report : problem list generated from yesterday Weekly Report : for problem meeting Monthly Report : for problem analysis Search Problem : investigate problem by keyword
• Special features Web-based report : overcome TSD’s weak point; reporting Print Format : print format available Easy Customizing : only SQL statement using Perl and DBI Graphical Interface
Feature5
TSD Reporting
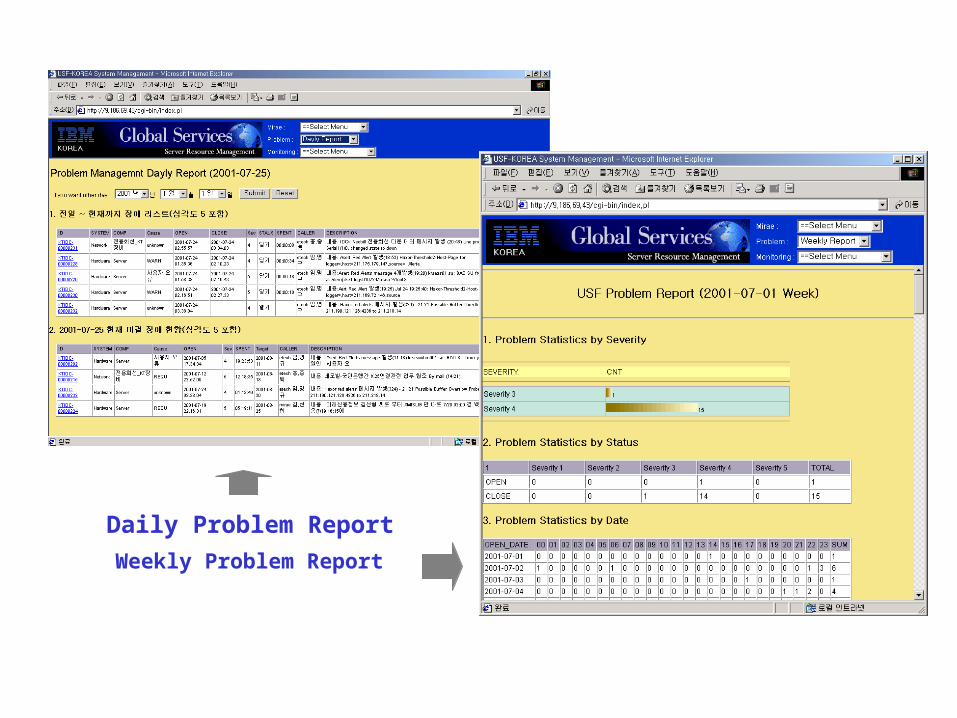
Daily Problem Report
Weekly Problem Report
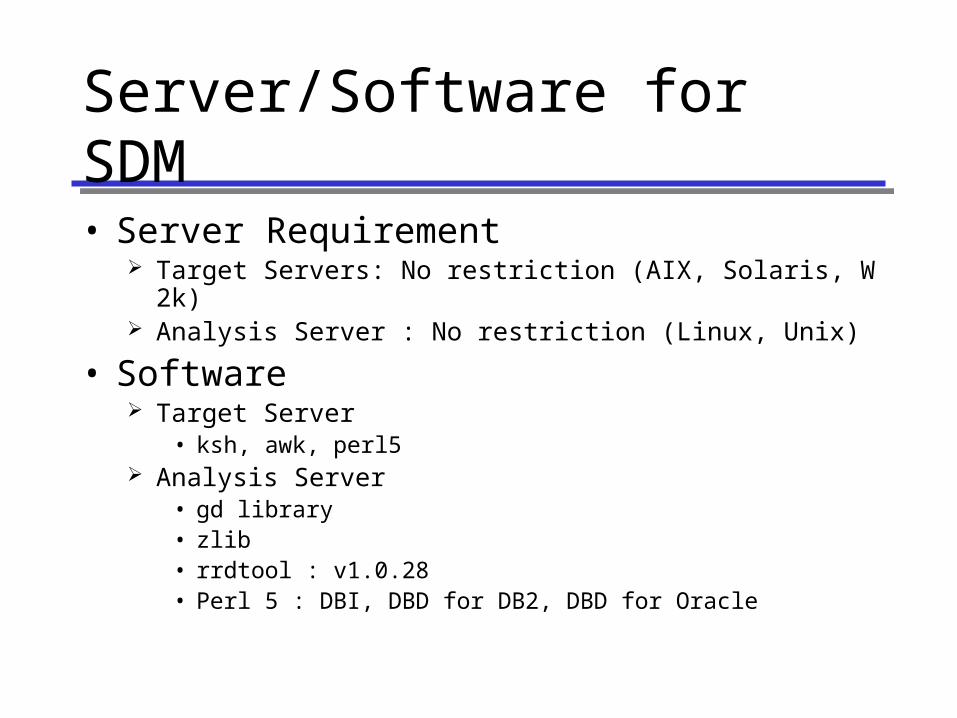
Server/Software for SDM
• Server Requirement Target Servers: No restriction (AIX, Solaris, W2k) Analysis Server : No restriction (Linux, Unix)
• Software Target Server
• ksh, awk, perl5 Analysis Server
• gd library• zlib• rrdtool : v1.0.28• Perl 5 : DBI, DBD for DB2, DBD for Oracle


![Database Client Server Pt2[1]](https://img.pdfslide.us/doc/110x75/55cf8cfa5503462b1390f1b3/database-client-server-pt21.jpg)