Embed Size (px)
Citation preview
Lecture-1
Graphics : To plot some points on graph to make an image.
Computer Graphics : To plot some points/pixels (picture element) on computer screen to make an image. Pixel is the smallest piece of the display screen which we can control . The control is achieved by setting the intensity and color of the pixel .
What is Resolution Of Image ?
Number of pixels per inch . Better the resolution better the image quality .
PPI are calculated for 5.2 inch screen
HD 720* 1280 =282
Full HD 1080*1920 =424
Quad HD (2K) 1440* 2560=565
Ultra HD (4K) 2160*3840=847
Realistically a 300PPI smartphone screen is good enough and our eyes cannot distinguish individual pixels in it . Your eyes can not notice the difference between a 300PPI and 400 PPI screen .The only time you would notice the pixels would be if you use VR goggles

What is aspect ratio Aspect Ratio= width / height
Lecture -2
Scan Conversion: The process of representing continuous graphical object as a collection of discrete pixels by identifying their locations and setting them ON is called scan conversion .
In computer graphics the coordinates of points are represented by pixel positions. The pixels are considered to be placed at a distance of unity from each other .
LINE DRAWING ALGORITHMS
DDA( Digital Differential Analyzer )
Step1:
Get the input of two end points (X0,Y0) and (X1,Y1)
Step2:
Calculate the difference between two end points
dx = | X1 - X0 | , dy = | Y1 - Y0 |
Step 3 :
if (dx> = dy)
Steps = dx
else
Steps = dy
Step 4:
Xincrement = X1 - X0 / Steps;
Yincrement = Y1 - Y0 / Steps;
( Round the values of x,y to find the position of pixel as we know that we can only plot integer value on screen )
Q. Consider the line from (0,0) to (10,5) .Use DDA algorithm to rasterize this line
Lecture -3
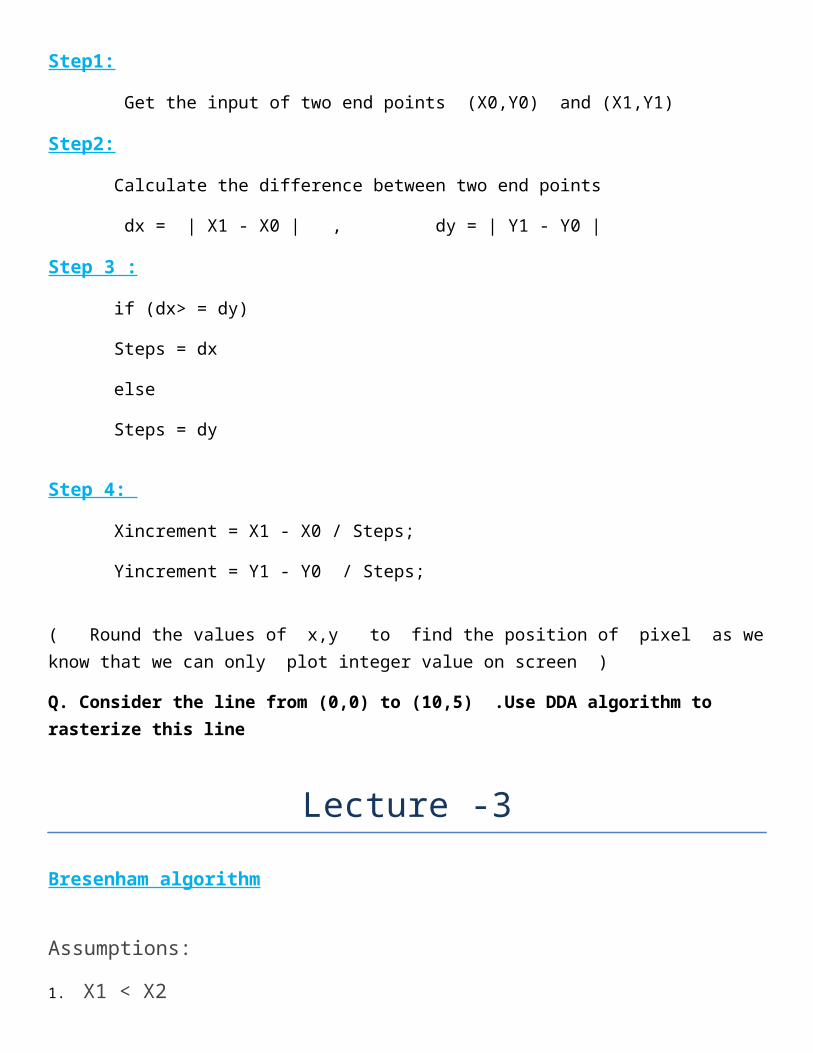
Bresenham algorithm
Assumptions:
1. X1 < X2
2. Slope of line must be positive
Step1:
Get the input of two end points (X0,Y0) and (X1,Y1)
Step2:
Calculate the difference between two end points
dx = | X1 - X0 | , dy = | Y1 - Y0 |
Step 3 :
if (dx> = dy) // i.e Slope < 1
Steps = dx
Else if (dy> = dx) // i.e Slope > 1
Steps = dy
Step4:
For Steps = dx
For next step next X coordinate ( i.e. X i+1 ) will be Xi+1 and next Y coordinate ( i.e. Yi+1 ) can be Yi or Yi+1 depending upon decision parameter ( P )
Initially Decision parameter ( P ) = 2dy−dx
If P < 0 then next Y coordinate = Y and P = P + 2dy
Otherwise next Y coordinate = Y + 1 and P = P + 2dy - 2dx
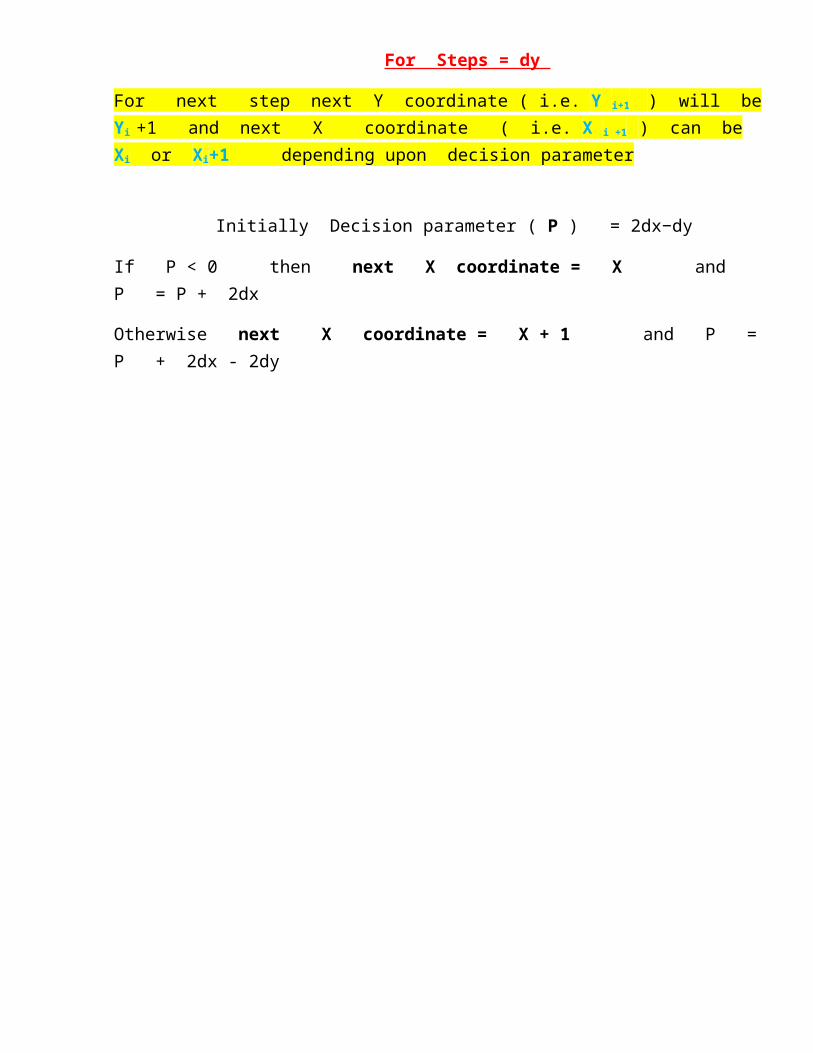
For Steps = dy

For next step next Y coordinate ( i.e. Y i+1 ) will be Yi +1 and next X coordinate ( i.e. X i +1 ) can be Xi or Xi+1 depending upon decision parameter
Initially Decision parameter ( P ) = 2dx−dy
If P < 0 then next X coordinate = X and P = P + 2dx
Otherwise next X coordinate = X + 1 and P = P + 2dx - 2dy
Lecture -4
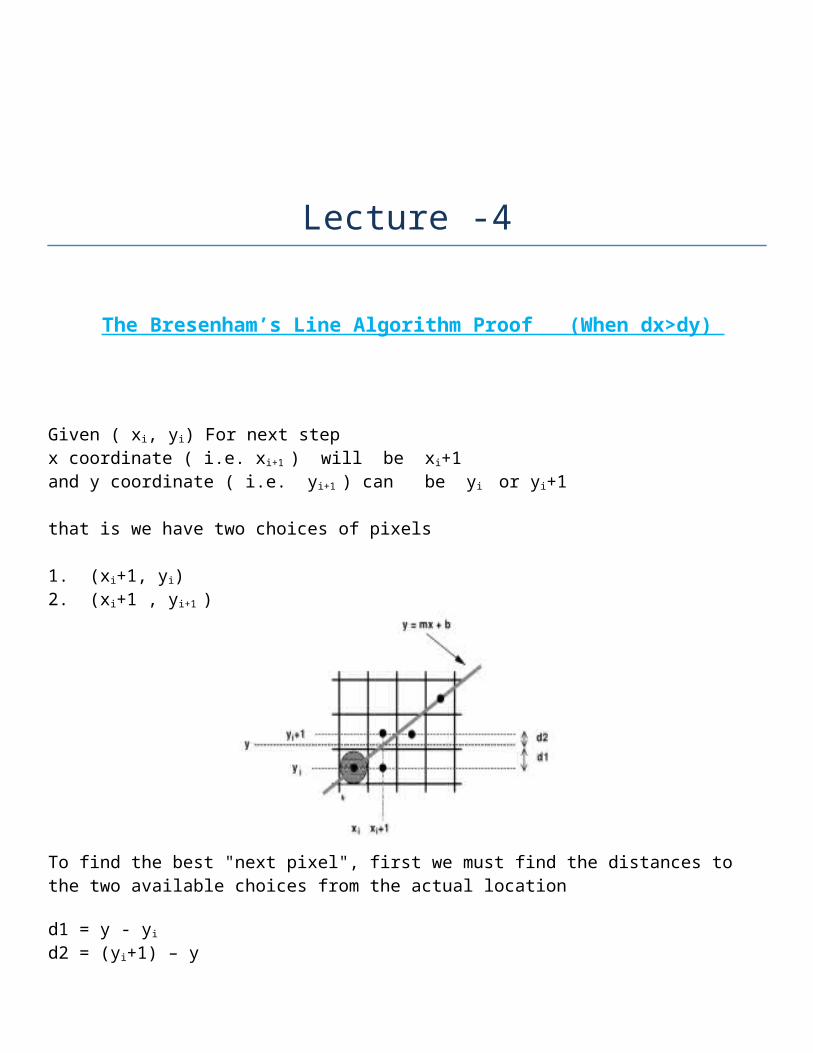
The Bresenham’s Line Algorithm Proof (When dx>dy)
Given ( xi, yi) For next step x coordinate ( i.e. xi+1 ) will be xi+1 and y coordinate ( i.e. yi+1 ) can be yi or yi+1
that is we have two choices of pixels
1. (xi+1, yi) 2. (xi+1 , yi+1 )
To find the best "next pixel", first we must find the distances to the two available choices from the actual location
d1 = y - yi d2 = (yi+1) – y
if d1< d2 ( i.e. the pixel (xi+1, yi ) is closer to the ideal location of line , then choose pixel (xi+1, yi) )if d1>d2 ( i.e. the pixel (xi+1, yi+1) is closer to the ideal location of line , then choose pixel (xi+1, yi+1 )
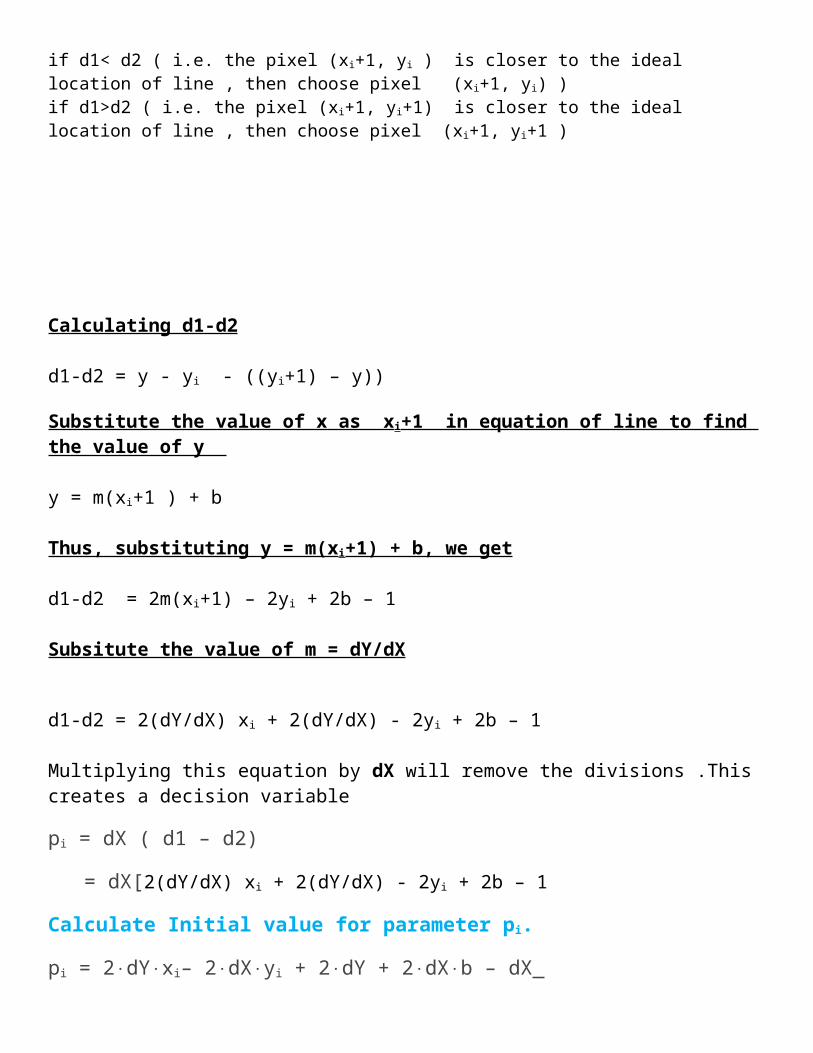
Calculating d1-d2
d1-d2 = y - yi - ((yi+1) – y))
Substitute the value of x as xi+1 in equation of line to find the value of y
y = m(xi+1 ) + b
Thus, substituting y = m(xi+1) + b, we get
d1-d2 = 2m(xi+1) – 2yi + 2b – 1
Subsitute the value of m = dY/dX
d1-d2 = 2(dY/dX) xi + 2(dY/dX) - 2yi + 2b – 1
Multiplying this equation by dX will remove the divisions .This creates a decision variable
pi = dX ( d1 – d2)
= dX[2(dY/dX) xi + 2(dY/dX) - 2yi + 2b – 1
Calculate Initial value for parameter pi.
pi = 2⋅dY⋅xi– 2⋅dX⋅yi + 2⋅dY + 2⋅dX⋅b – dX p0 = 2⋅dY⋅x0– 2⋅dX⋅y0 + 2⋅dY + 2dX⋅b – dX For the initial point on the line:
y0 = mx0 + b therefore, b = y0 – (dY/dX) ⋅ x0
Substituting the above for b, we get:
p0 = 2⋅dY – dX
Calculate Recursive definition for pi:
pi= 2⋅dY⋅xi– 2⋅dX⋅yi + 2 ⋅ dY + 2 ⋅ dX ⋅ b – dX
Note that the underlined part is constant (it does not change during iteration), we call it c, i.e.
c = 2⋅dY + 2⋅dX⋅b – dX Hence we can write an expression for pi as:
pi = 2⋅dY⋅xi– 2⋅dX⋅yi + c
Find pi+1
pi+1 = 2⋅dY⋅xi+1– 2⋅dX⋅yi+1 + c
Find pi+1 - pi
pi+1 – pi = 2dY ⋅ (xi+1 – xi) – 2dX ⋅ (yi+1 – yi)
xi+1 – xi = 1, always
pi+1 – pi = 2dY – 2dX ⋅ (yi+1 – yi)
Recursive definition for pi:
pi+1 = pi + 2dY – 2dX ⋅ (yi+1 – yi)
Because the sign of pi is the same as the sign of d1 – d2, we can make decision with respect to sign of pi
if pi < 0, means d1-d2<0 i.e. d1<d2 we choose pixel (xi+1, yi) Therefore pi+1 = pi + 2dy
if pi > 0, means d1-d2>0 i.e. d1>d2 we choose pixel(xi+1, yi+1 )Therefore pi+1 = pi + 2dy – 2dx
Lecture -5

CIRCLE DRAWING ALGORITHMS
If we know one point on circle then we can draw remaining points on it by using
1. Mid point / Breshams Circle Drawing Algorithm (Only for one octant )
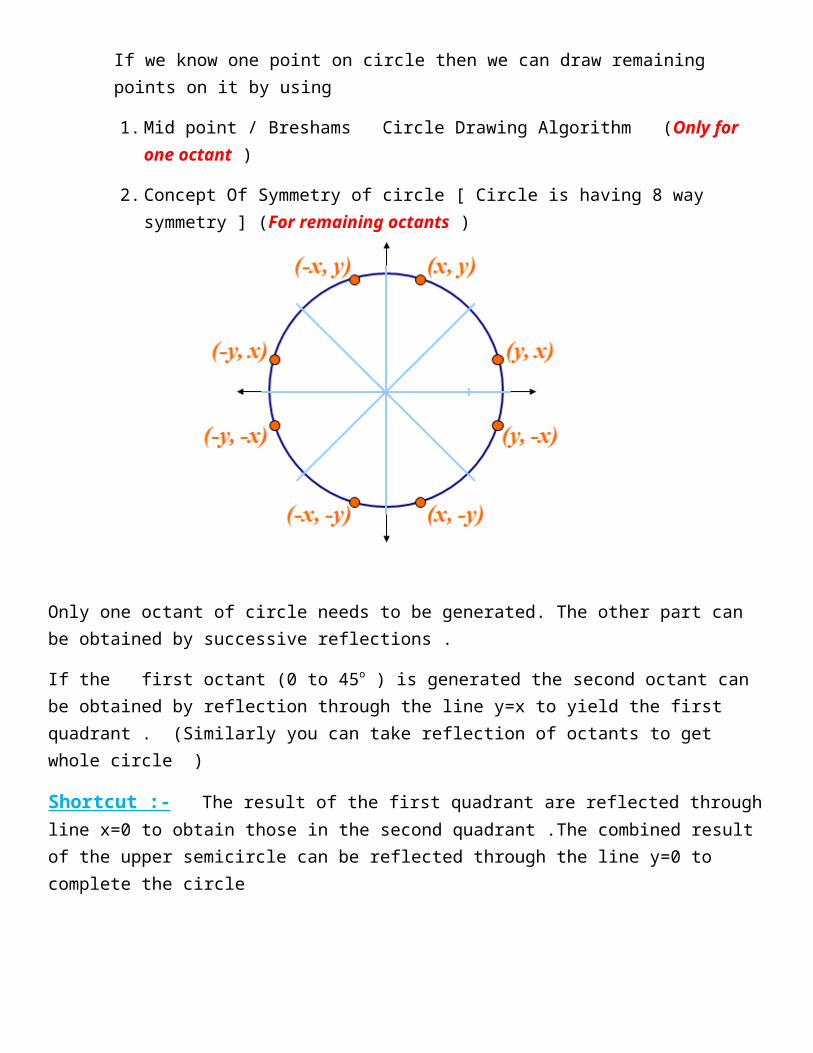
2. Concept Of Symmetry of circle [ Circle is having 8 way symmetry ] (For remaining octants )
Only one octant of circle needs to be generated. The other part can be obtained by successive reflections .
If the first octant (0 to 45o ) is generated the second octant can be obtained by reflection through the line y=x to yield the first quadrant . (Similarly you can take reflection of octants to get whole circle )
Shortcut :- The result of the first quadrant are reflected through line x=0 to obtain those in the second quadrant .The combined result of the upper semicircle can be reflected through the line y=0 to complete the circle
Mid Point Circle drawing Algorithm
Concept
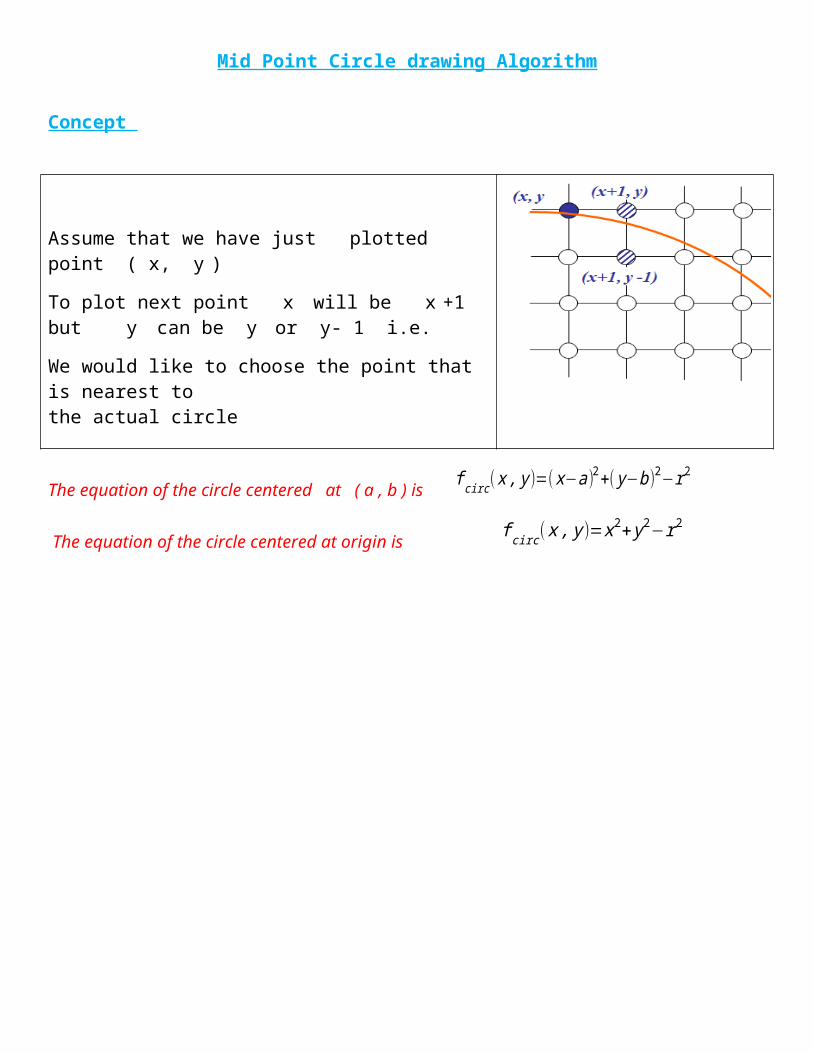
Assume that we have just plotted point ( x, y )
To plot next point x will be x +1 but y can be y or y- 1 i.e.
We would like to choose the point that is nearest to the actual circle
The equation of the circle centered at ( a , b ) is f circ (x , y )=( x−a )2+( y−b )2−r2
The equation of the circle centered at origin is f circ (x , y )=x2+ y2−r2
Assume that we have just plotted point ( x, y ) . To choose the point that is nearest to the
actual circle we will find the location of mid - point x+1 , y−1
2 with respect to circle which is known as decision parameter ( P )
P= f circ ( x+1, y−12)
If P = 0 then midpoint is on the circle , it means that pixels at y , y - 1 are equal distance from circle hence we can choose any one of these
If P < 0 the midpoint is inside the circle and the pixel at y is closer to the circle
Otherwise If P > 0 the midpoint is outside the circle and the pixel at y- 1 is closer to the circle
Algorithm
Step1: Get the radius of circle input from user , we know center is at origin so initial point
will be x=0 , y=r and we know that initial decision parameter P = 54−r
Step2:-
While (x <=y)
{
set pixel( x ,y )
if (P < 0)
{
P = P + 2 (x +1) +1 ;
x=x+1;
y=y;
else
{
P = P + 2 ( x - y ) + 5 ;
x=x+1;
y=y-1;
}
}
Lecture -6
Bresenham’s Circle drawing Algorithm
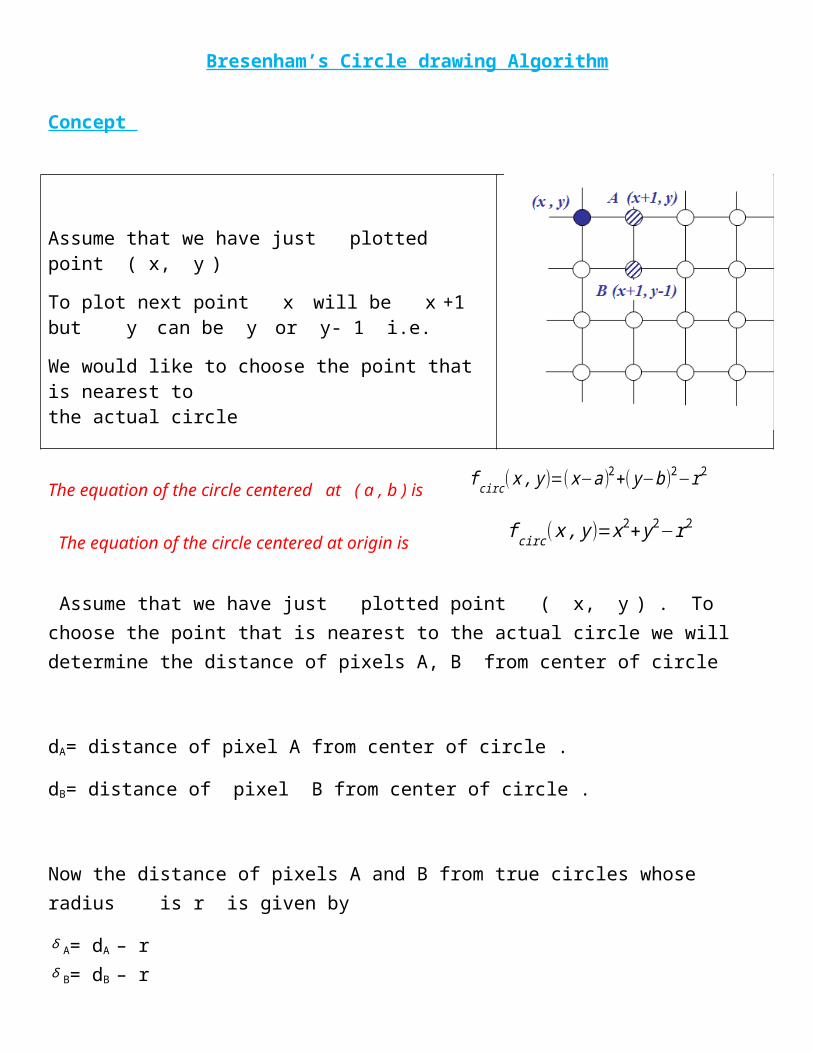
Concept
Assume that we have just plotted point ( x, y )
To plot next point x will be x +1 but y can be y or y- 1 i.e.
We would like to choose the point that is nearest to the actual circle
The equation of the circle centered at ( a , b ) is f circ (x , y )=( x−a )2+( y−b )2−r2
The equation of the circle centered at origin is f circ (x , y )=x2+ y2−r2
Assume that we have just plotted point ( x, y ) . To choose the point that is nearest to the actual circle we will determine the distance of pixels A, B from center of circle

dA= distance of pixel A from center of circle .
dB= distance of pixel B from center of circle .
Now the distance of pixels A and B from true circles whose radius is r is given by
δ A= dA – r δ B= dB – r
To avoid square root in derivation of decision variable we will square therefore
δ A= dA2 – r2
δ B= dB2 – r 2
δ A always positive and δ B is always negative .Therefore we can define decision variable P as P = δ A + δ B
If P = 0 it means that pixels at A , B are equal distance from circle hence we can choose any one of these
If P < 0 then it means δ A < δ B which means circle is more near to pixel A
Therefore point x = x +1 , y = y
If P > 0 then it means δ A > δ B which means circle is more near to pixel B
Therefore point x = x +1 , y = y-1
Algorithm
Step1: Get the radius of circle input from user , we know center is at origin so initial point will be x=0 , y=r and we know that initial decision parameter P = 3 - 2r
Step2:-
While (x <=y)
{
set pixel( x ,y )
if ( P < 0)
{
P = P + 4x + 6
x=x+1;
y=y;
else
{
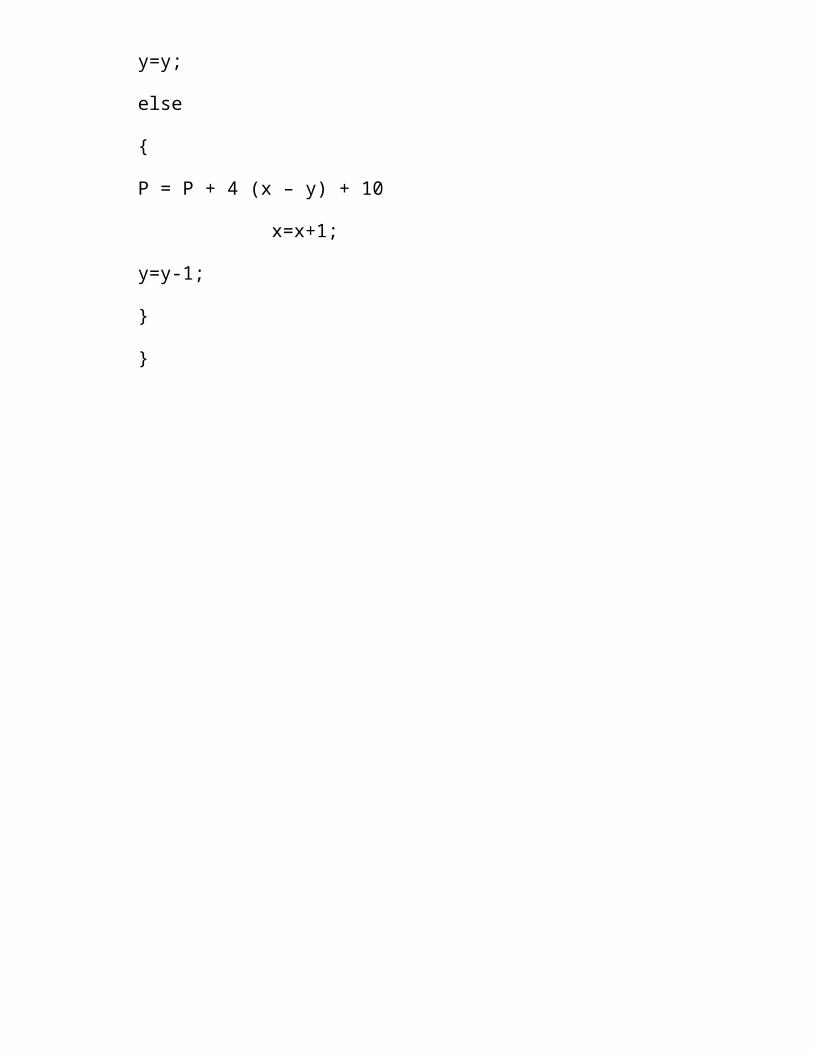
P = P + 4 (x – y) + 10
x=x+1;
y=y-1;
}
}
Lecture -8
Image Compression
1. Run Length Encoding Image Compression
2. Area Image compression
RLE Image Compression
Compressing an image using RLE is based on the observation that if we select a pixel in the image at random, there is a good chance that its neighbors will have the same color. The compressor thus scans the bitmap row by row, looking for runs of pixels of the same color.
The effectiveness depends on the image being compressed; images with long runs of pixels of the same color will provide a higher compression ratio than images that have frequently changing colors.
For black and white images :
Here a single byte represents the value of a pixel and the run length. Within the 8 bits, the left-most bit identifies the color (eg 1 = black and 0 = white) the next 7 bits identify the run length.
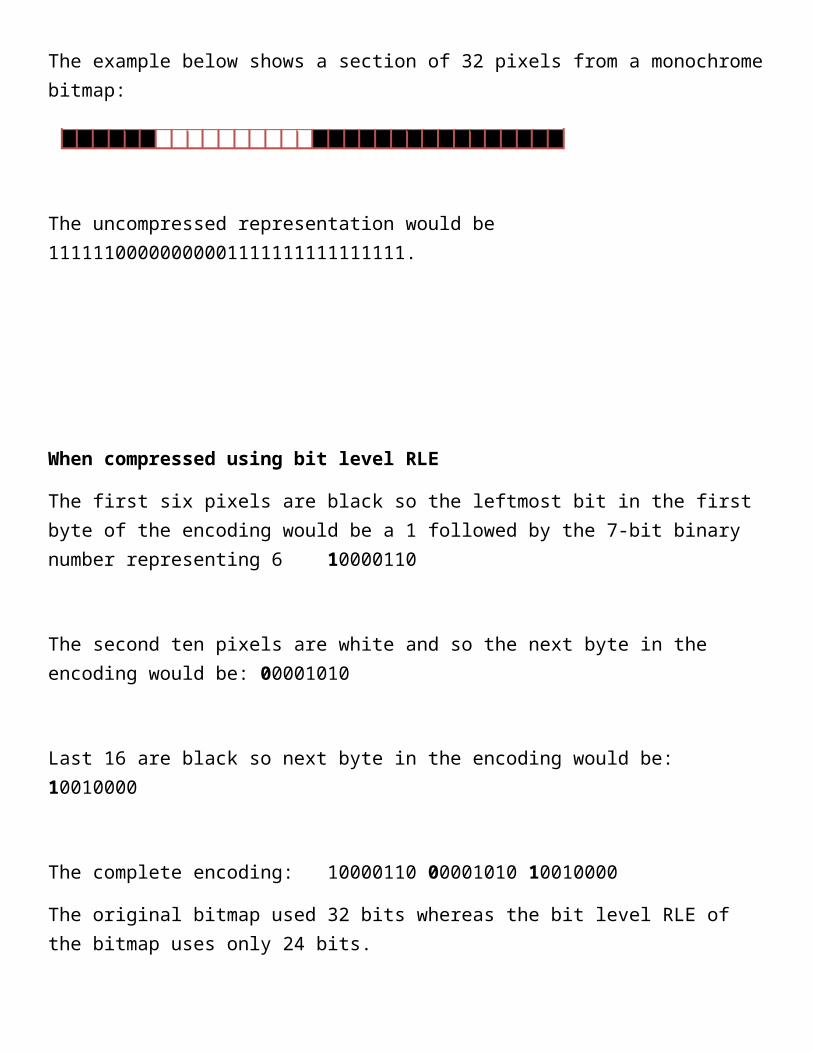
The example below shows a section of 32 pixels from a monochrome bitmap:
The uncompressed representation would be 11111100000000001111111111111111.
When compressed using bit level RLE
The first six pixels are black so the leftmost bit in the first byte of the encoding would be a 1 followed by the 7-bit binary number representing 6 10000110
The second ten pixels are white and so the next byte in the encoding would be: 00001010
Last 16 are black so next byte in the encoding would be: 10010000
The complete encoding: 10000110 00001010 10010000
The original bitmap used 32 bits whereas the bit level RLE of the bitmap uses only 24 bits.
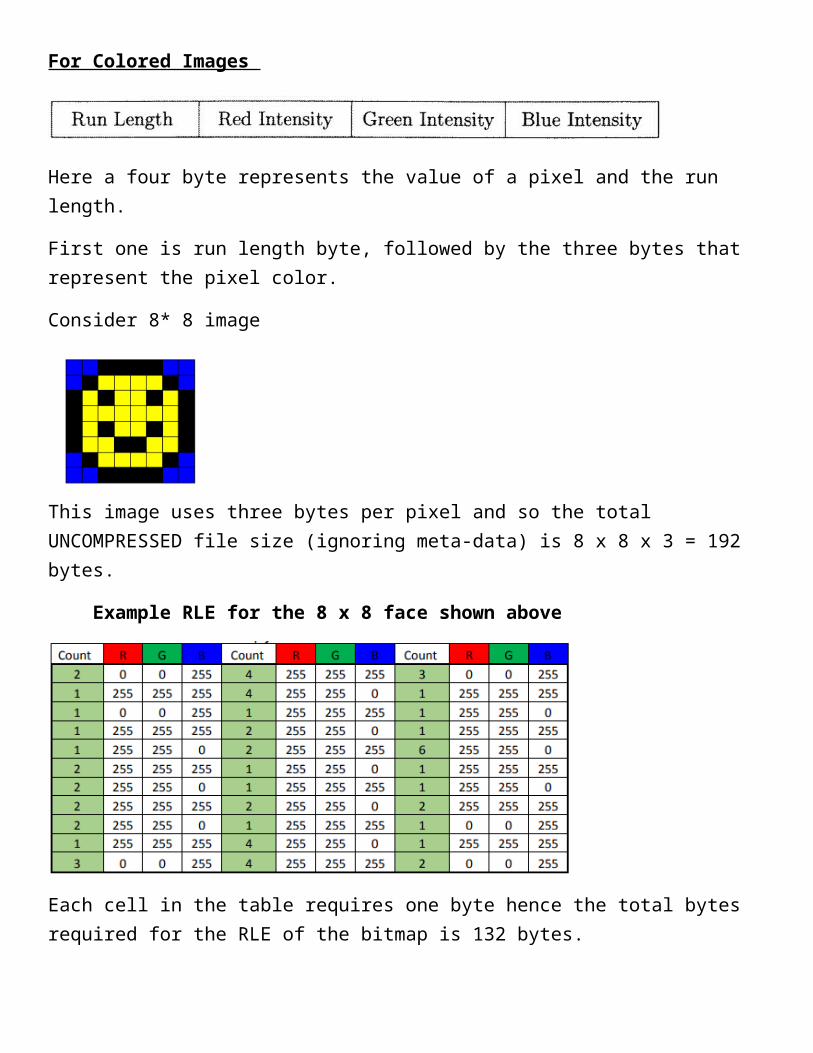
For Colored Images
Here a four byte represents the value of a pixel and the run length.
First one is run length byte, followed by the three bytes that represent the pixel color.
Consider 8* 8 image
This image uses three bytes per pixel and so the total UNCOMPRESSED file size (ignoring meta-data) is 8 x 8 x 3 = 192 bytes.
Example RLE for the 8 x 8 face shown above
Each cell in the table requires one byte hence the total bytes required for the RLE of the bitmap is 132 bytes.
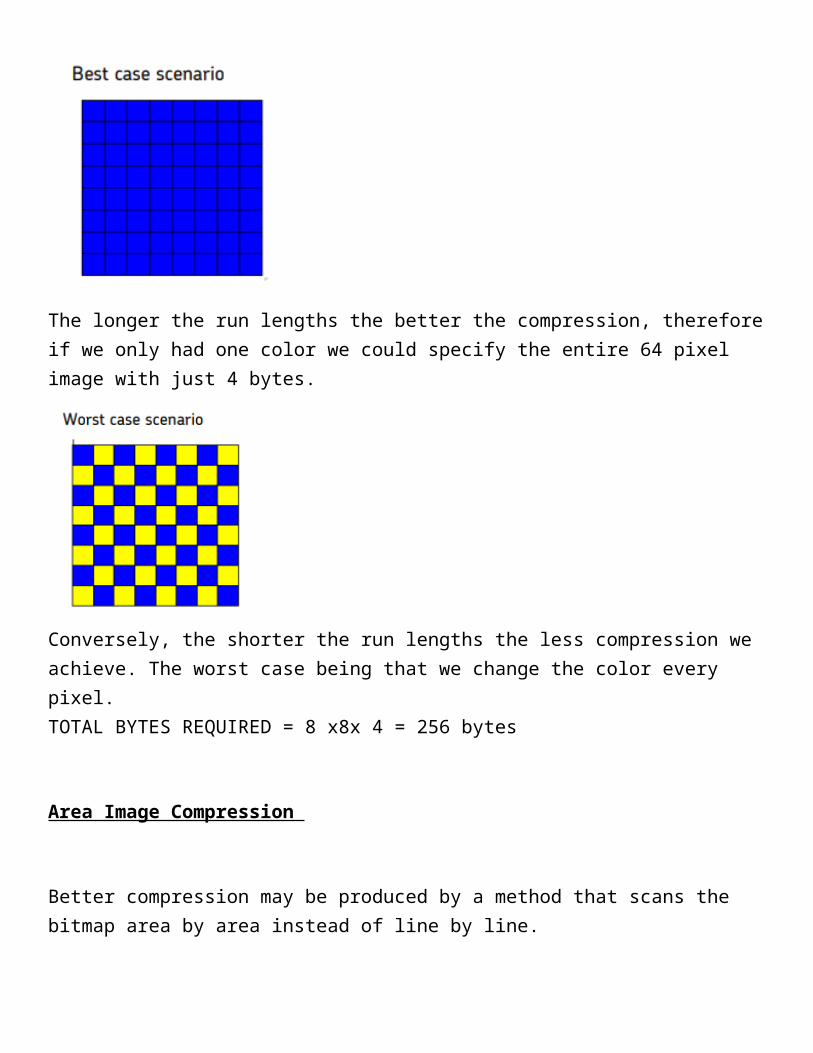
The longer the run lengths the better the compression, therefore if we only had one color we could specify the entire 64 pixel image with just 4 bytes.
Conversely, the shorter the run lengths the less compression we achieve. The worst case being that we change the color every pixel. TOTAL BYTES REQUIRED = 8 x8x 4 = 256 bytes

Area Image Compression
Better compression may be produced by a method that scans the bitmap area by area instead of line by line.
Area image compression technique attepts to take advantage of area coherence i.e the tendecy of pixels in adjacent area to have same chracterstics .
Lecture -9
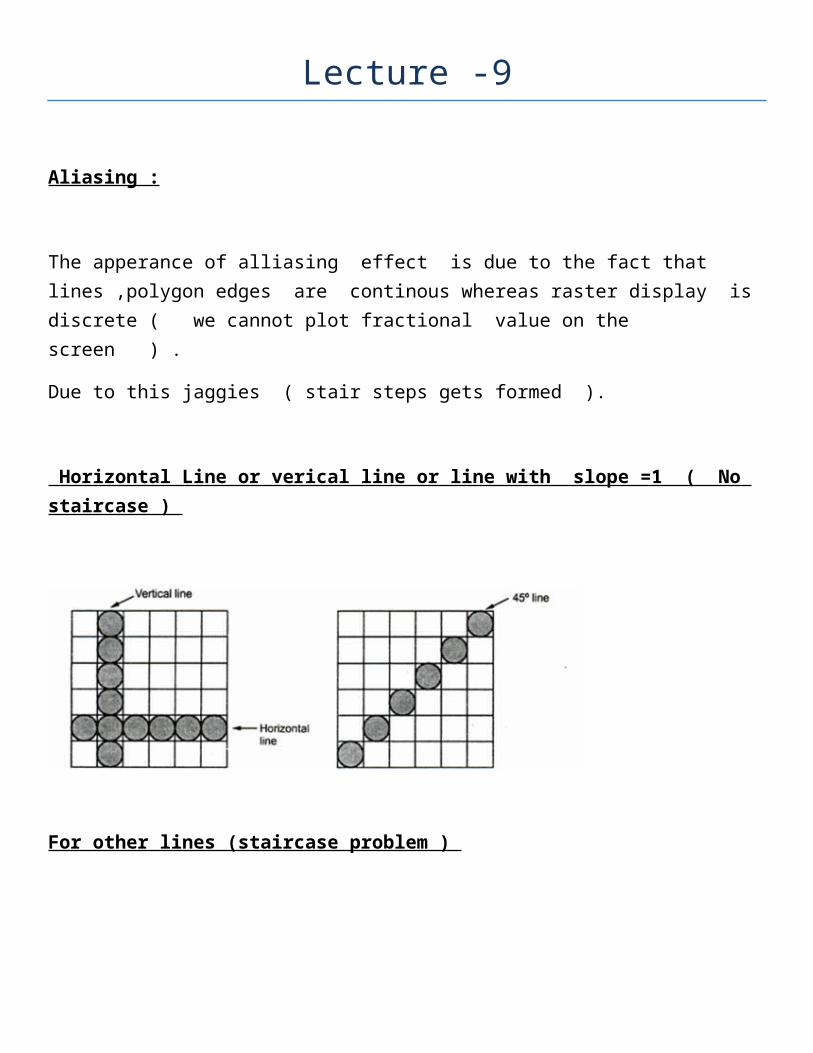
Aliasing :
The apperance of alliasing effect is due to the fact that lines ,polygon edges are continous whereas raster display is discrete ( we cannot plot fractional value on the screen ) .
Due to this jaggies ( stair steps gets formed ).
Horizontal Line or verical line or line with slope =1 ( No staircase )
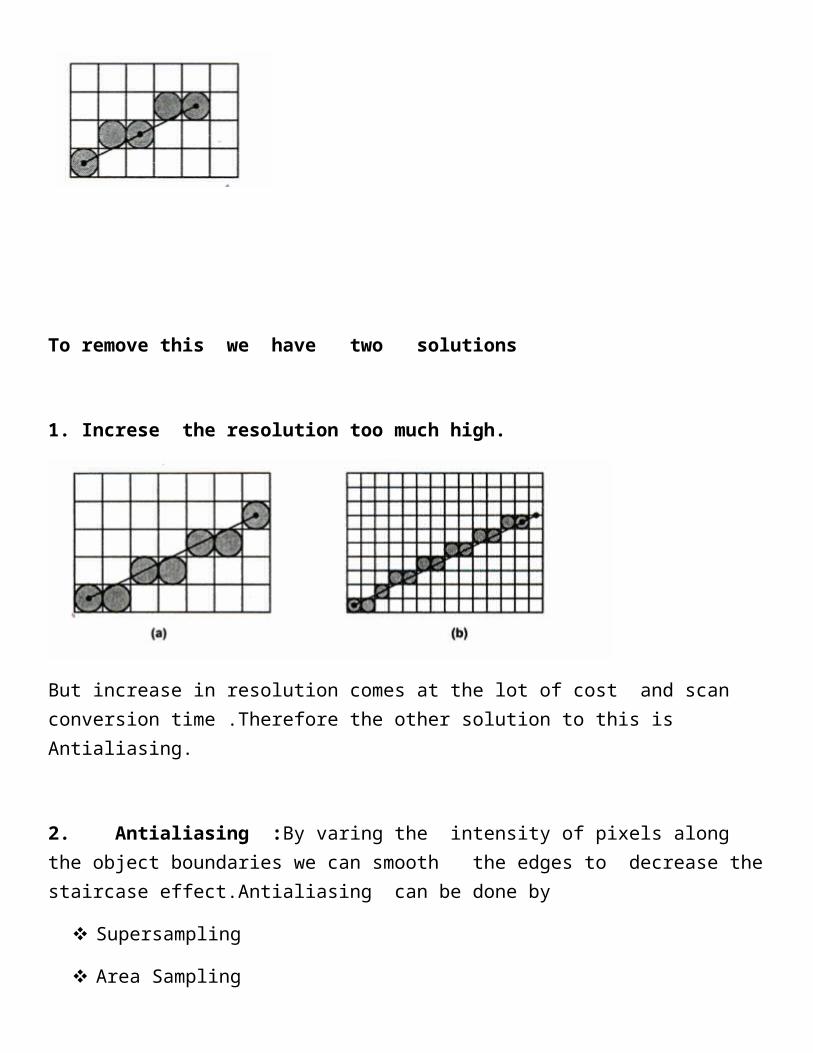
For other lines (staircase problem )
To remove this we have two solutions
1. Increse the resolution too much high.
But increase in resolution comes at the lot of cost and scan conversion time .Therefore the other solution to this is Antialiasing.
2. Antialiasing :By varing the intensity of pixels along the object boundaries we can smooth the edges to decrease the staircase effect.Antialiasing can be done by
Supersampling
Area Sampling
Pixel Phasing
Super Sampling
a. Concedring Finite length width
b. With pixel weighing mask
a. Concedring Finite length width : The width of line is equal to size of one pixel . We divide a pixel into number of parts (subpixels) .We perform supersampling by setting pixel intensity proportional to number of subpixels inside the line . A subpixels can be considered to be inside the line if its lower left corner is inside the polygon.The number of
b. With pixel weighing mask : Giving more weight to the subpixel near the centre of pixel area since we consider these subpixels to be more imp in determining the overall intensity of pixel.

Area Sampling
We have seen in line drawing algorithm or circle drawing algorithm that at every step we have option to choose the next pixel and we decide the next pixel based on the concept of decision parameter. This step can be modified to perfom antialiasing.In antialiasing instead of closest pixel both pixels are highlighted .However their intensity of highlighting differs.
a. Unweight Area Sampling
b. Weighted Area sampling:
a) Unweighted Area Sampling : The intensity of pixel is proportional to amount of line area occupied by pixel .This technique produces noticiable better results than setting pixels to full intensity or zero intensity . (Equal areas contribute equal intensity )
b) Weighted Area sampling: Equal areas contribute unequally
Two things are kept in mind
i) Amount of area of line covered by pixel
ii) Distance of pixel center from line area
Pixel phasing It is an antialiasing technique, stair steps are smoothed out by moving (micro positioning) the electron beam to plot points closer to the true path of object. The electron beam is typically shifted by ¼ , ½ or ¾ of pixel diameter to plot points closer to true path of object .
Self-Study
Character Generation
There are three methods of character generation.
1) Stroke method
2) Star bust method
3) Bitmap Method
Stroke method
In this method we use a sequence of line drawing function and arc functions to generate characters. We can generate a sequence of character by assigning starting and end point of line or arc. By using this method various faces of character can be generated by changing the values (parameters) in line and arc function.
Star bust method
• In this method a fix pattern of line segments are used to generate characters.
• As shown in figure, there are 24 line segments.
• Out of 24 line segments, segments required to display for particular character, are highlighted
• Each bit representing one line segment.
• The bit is set to one to highlight the line segment otherwise it is set to zero.
Fig shows the starburst patterns for character A and M.
Character A : 0011 0000 0011 1100 1110 0001
Character M: 0000 0011 0000 1100 1111 0011
This method of character generation is not used now a days because of following disadvantages:
The 24-bits are required to represent a character. Hence more memory is required.
Requires code conversion software to display character from its 24 bits code.
Character quality poor. Worst for curve shaped character.
Bitmap Method

The Graphical Kernel System (GKS) was the first ISO standard for computer graphics in low-level, established in 1977. GKS offers a group of drawing aspects for 2D graphics. The calls are defined to be moveable across various programming languages, graphics hardware, so that applications noted to use GKS will be willingly portable to different devices and platforms.
Output Primitive A computer Graphics can be anything like beautiful scenery, images, trees, or anything else that we can imagine, however all these computer graphics are made up of the most basic components of Computer Graphics that are called Graphics Output Primitive .The Primitives are the simple geometric functions that are used to generate various Computer Graphics required by the User. Some most basic Output primitives are point-position(pixel), and a straight line. However different Graphic packages offers different output primitives like a rectangle, conic section, circle etc.


![Graphics and Data Visualization in R - OverviewGraphics and Data Visualization in R Graphics Environments Base Graphics Slide 16/121. Line Plot: Single Data Set > plot(y[,1], type="l",](https://img.pdfslide.us/doc/110x75/5f4a6acb48016c636763a1cb/graphics-and-data-visualization-in-r-overview-graphics-and-data-visualization.jpg)