Embed Size (px)
Citation preview
What is racism?
What is racism?
A system
A system of structuring opportunity and assigning value
What is racism?
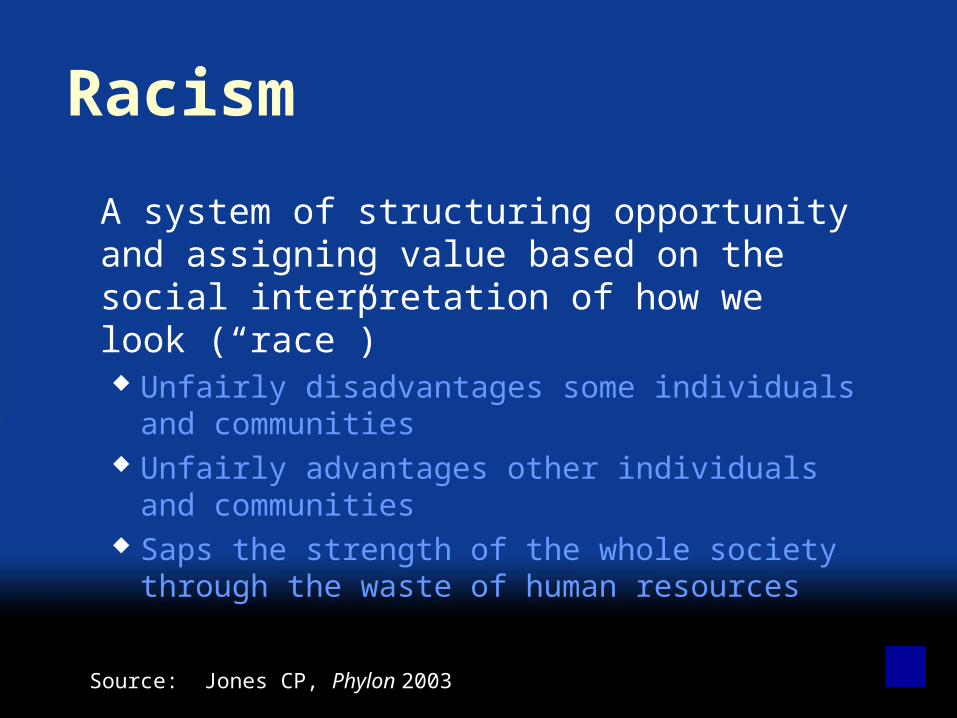
A system of structuring opportunity and assigning value based on the social interpretation of how we look (“race”)
What is racism?
A system of structuring opportunity and assigning value based on the social interpretation of how we look (“race”) Unfairly disadvantages some individuals and
communities
What is racism?
A system of structuring opportunity and assigning value based on the social interpretation of how we look (“race”) Unfairly disadvantages some individuals and
communities Unfairly advantages other individuals and
communities
What is racism?
A system of structuring opportunity and assigning value based on the social interpretation of how we look (“race”) Unfairly disadvantages some individuals and
communities Unfairly advantages other individuals and
communities Saps the strength of the whole society through the
waste of human resources
What is racism?
Source: Jones CP, Phylon 2003
“Reactions to Race” module
Six-question optional module on the Behavioral Risk Factor Surveillance System
Piloted by six states in 2002Now available to all states
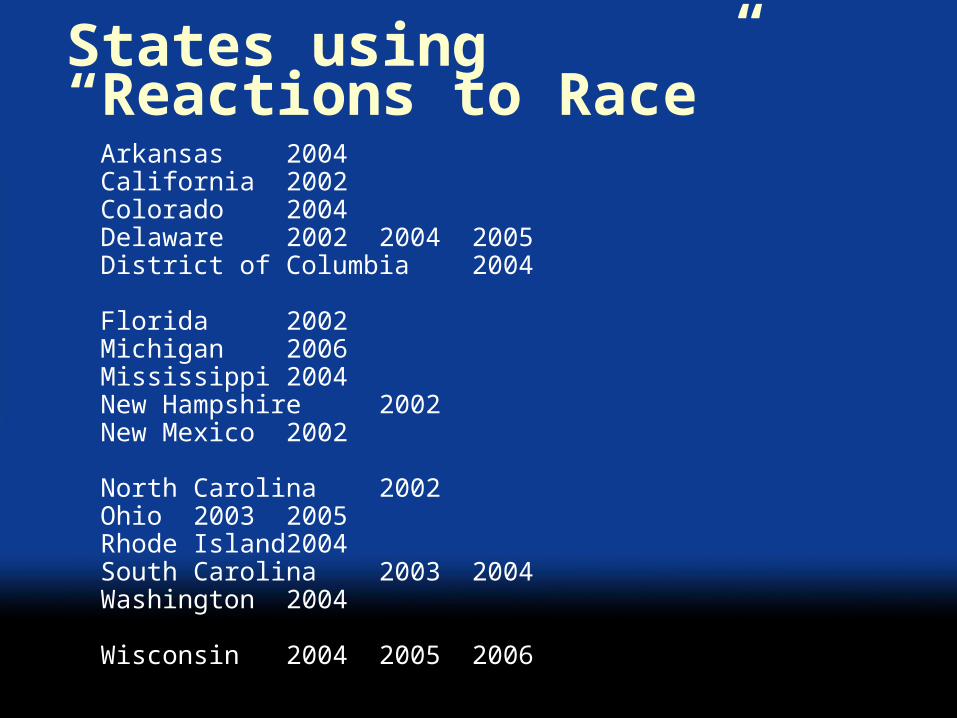
States using “Reactions to Race”Arkansas 2004California 2002Colorado 2004Delaware 2002 2004 2005District of Columbia 2004
Florida 2002Michigan 2006Mississippi 2004New Hampshire 2002New Mexico 2002
North Carolina 2002Ohio 2003 2005Rhode Island 2004South Carolina 2003 2004Washington 2004
Wisconsin 2004 2005 2006
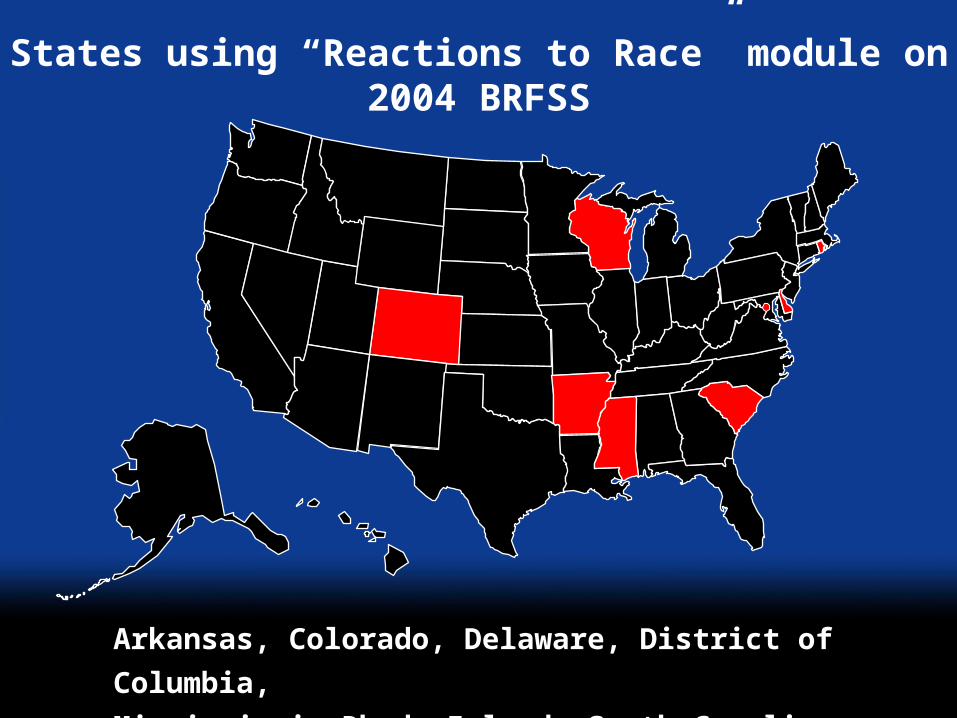
Arkansas, Colorado, Delaware, District of Columbia,
Mississippi, Rhode Island, South Carolina, Wisconsin
States using “Reactions to Race” module on 2004 BRFSS
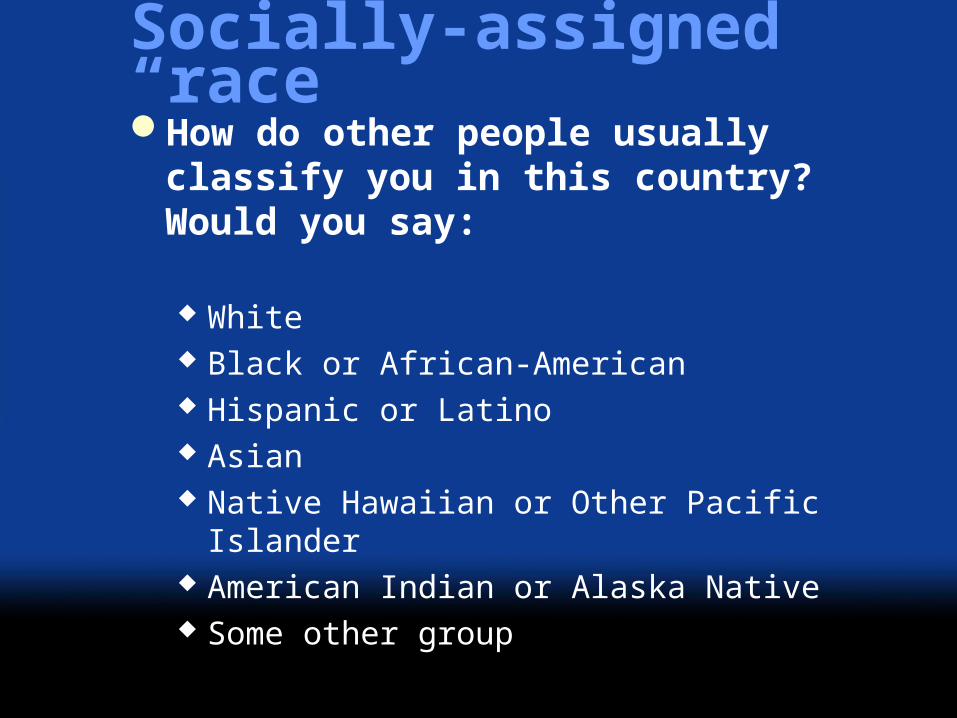
Socially-assigned “race”How do other people usually classify you in
this country? Would you say:
White Black or African-American Hispanic or Latino Asian Native Hawaiian or Other Pacific Islander American Indian or Alaska Native Some other group
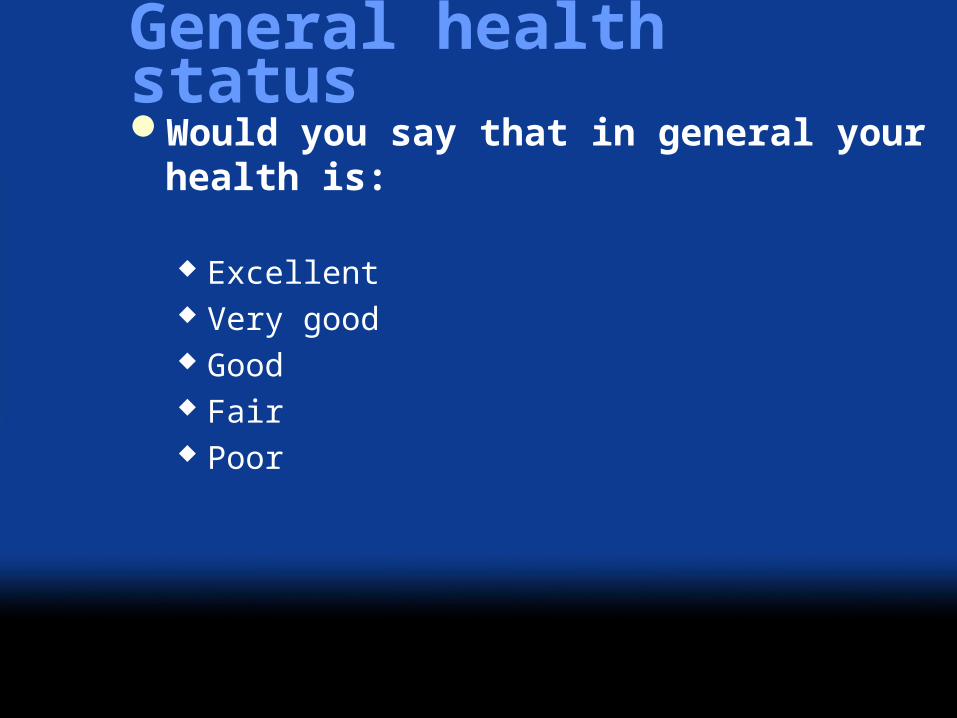
General health statusWould you say that in general your health
is:
Excellent Very good Good Fair Poor
020
4060
8010
0
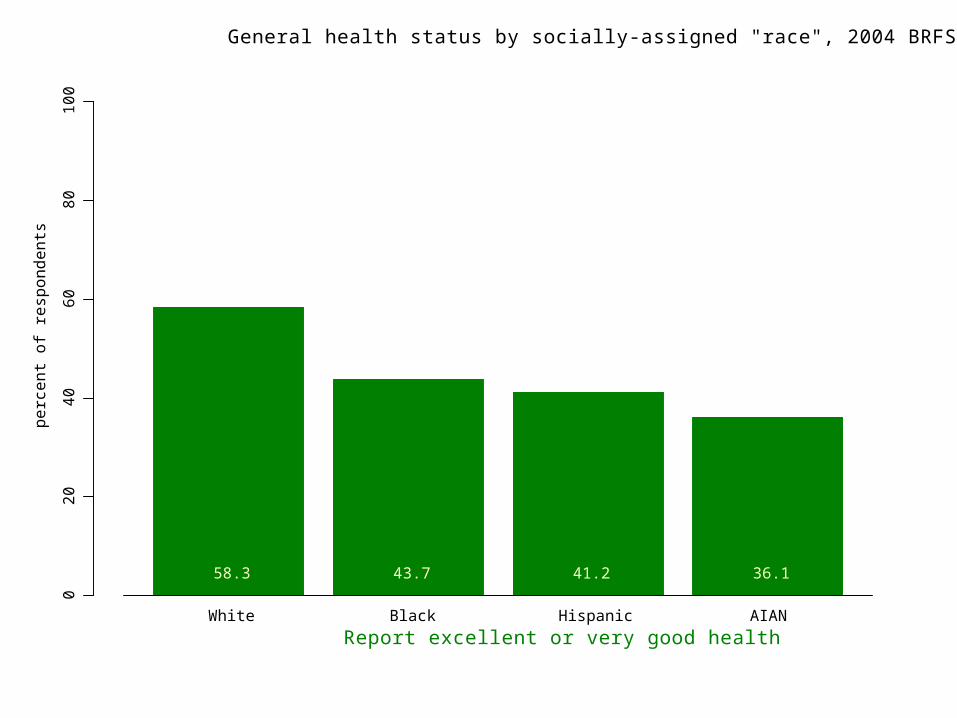
58.3 43.7 41.2 36.1
perc
ent
of r
espo
nden
ts
Report excellent or very good healthWhite Black Hispanic AIAN
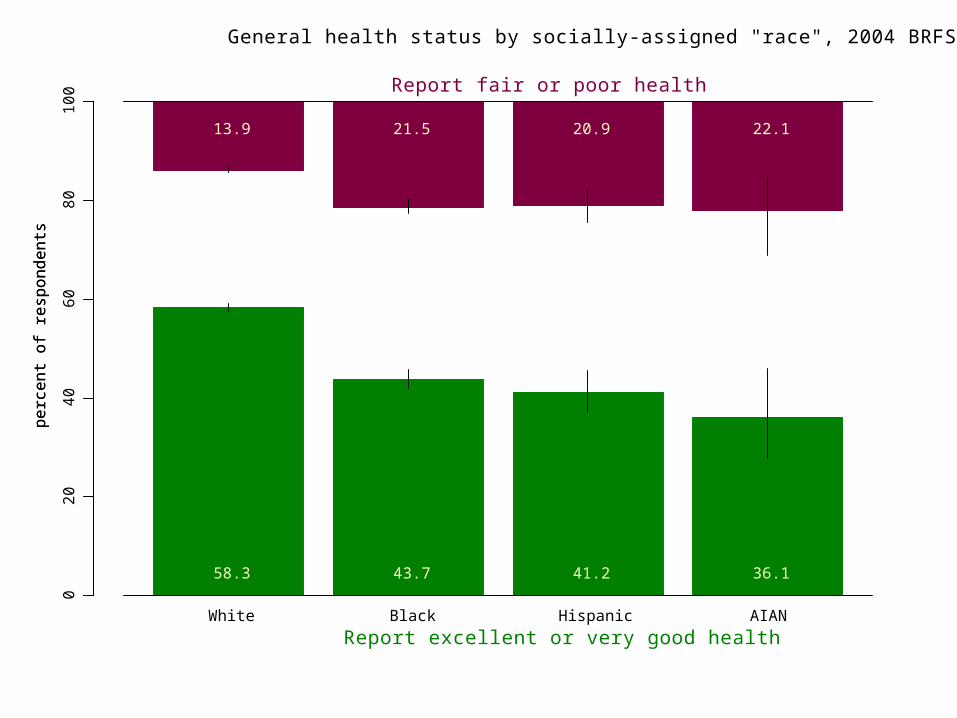
General health status by socially-assigned "race", 2004 BRFSS

020
4060
8010
0
58.3 43.7 41.2 36.1
perc
ent
of r
espo
nden
ts
Report excellent or very good healthWhite Black Hispanic AIAN
General health status by socially-assigned "race", 2004 BRFSS
020
4060
8010
0
58.3 43.7 41.2 36.1
perc
ent
of r
espo
nden
ts
Report excellent or very good healthWhite Black Hispanic AIAN
General health status by socially-assigned "race", 2004 BRFSS
13.9 21.5 20.9 22.1
perc
ent
of r
espo
nden
ts
Report fair or poor health
General health status and “race”“White” social experience associated with
better health
Self-identified ethnicityAre you Hispanic or Latino?
Yes No
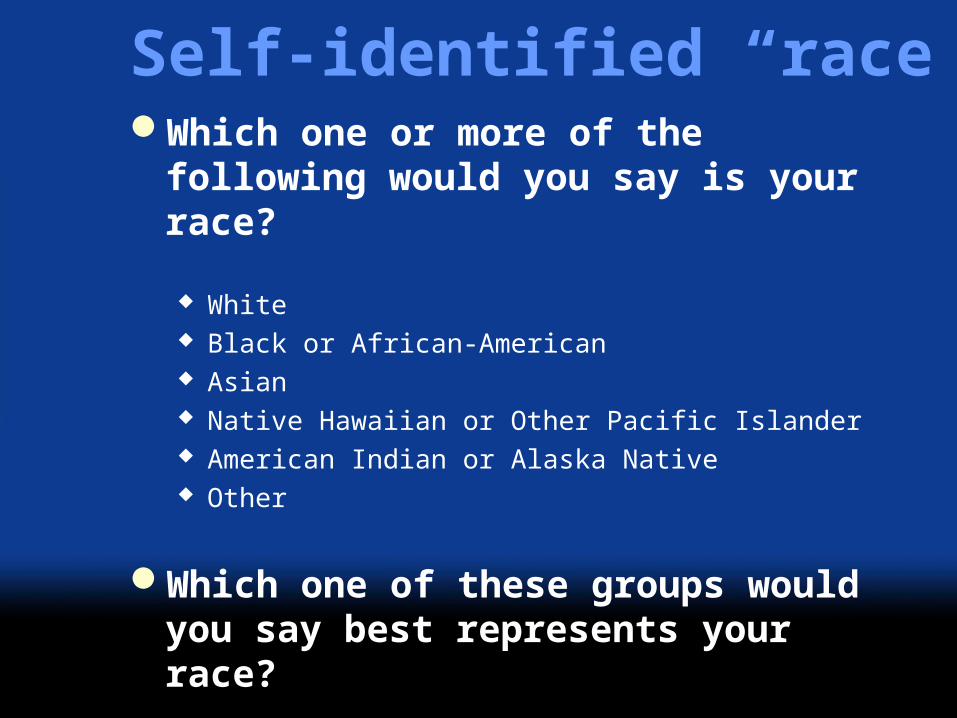
Self-identified “race”Which one or more of the following would
you say is your race?
White Black or African-American Asian Native Hawaiian or Other Pacific Islander American Indian or Alaska Native Other
Which one of these groups would you say best represents your race?
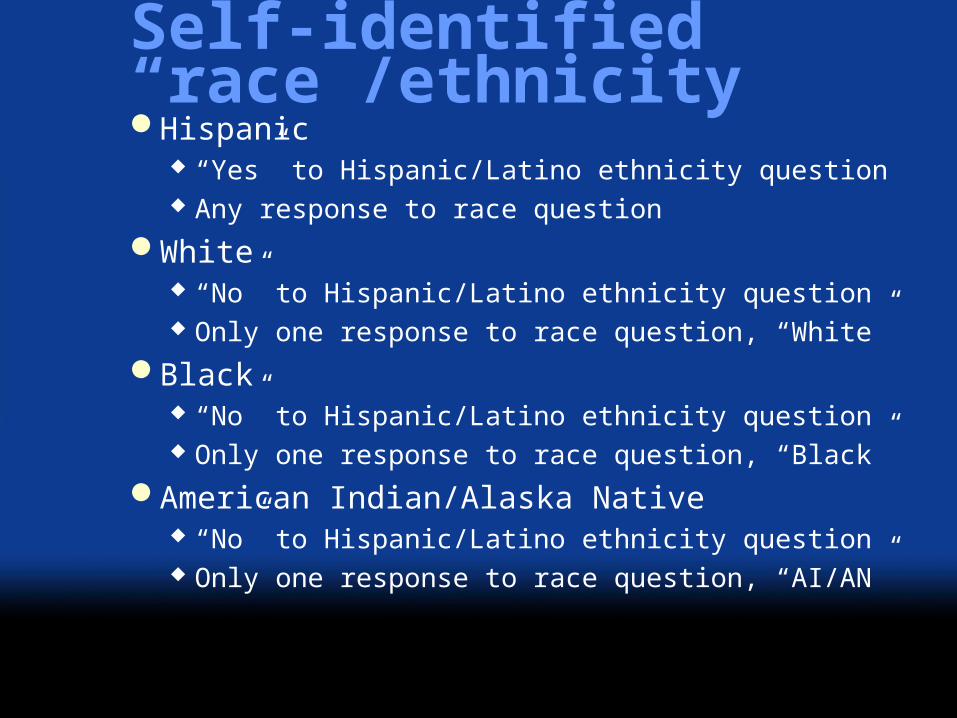
Self-identified “race”/ethnicityHispanic
“Yes” to Hispanic/Latino ethnicity question Any response to race question
White “No” to Hispanic/Latino ethnicity question Only one response to race question, “White”
Black “No” to Hispanic/Latino ethnicity question Only one response to race question, “Black”
American Indian/Alaska Native “No” to Hispanic/Latino ethnicity question Only one response to race question, “AI/AN”
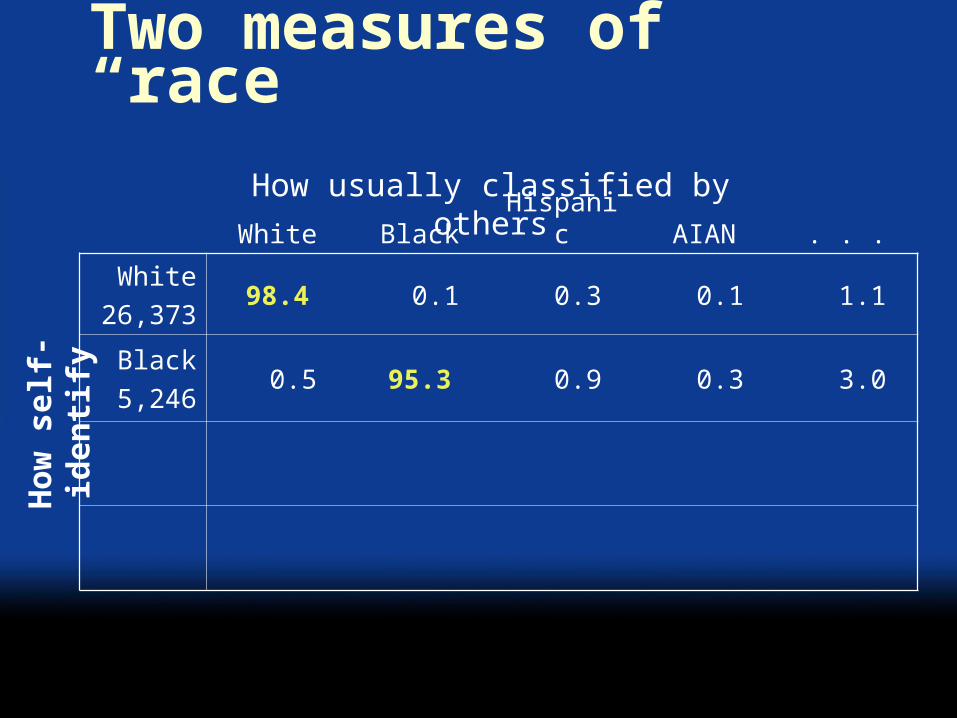
White Black Hispanic AIAN . . .
White
26,37398.4 0.1 0.3 0.1 1.1
Black
5,246 0.5 95.3 0.9 0.3 3.0
How
self
-id
en
tify
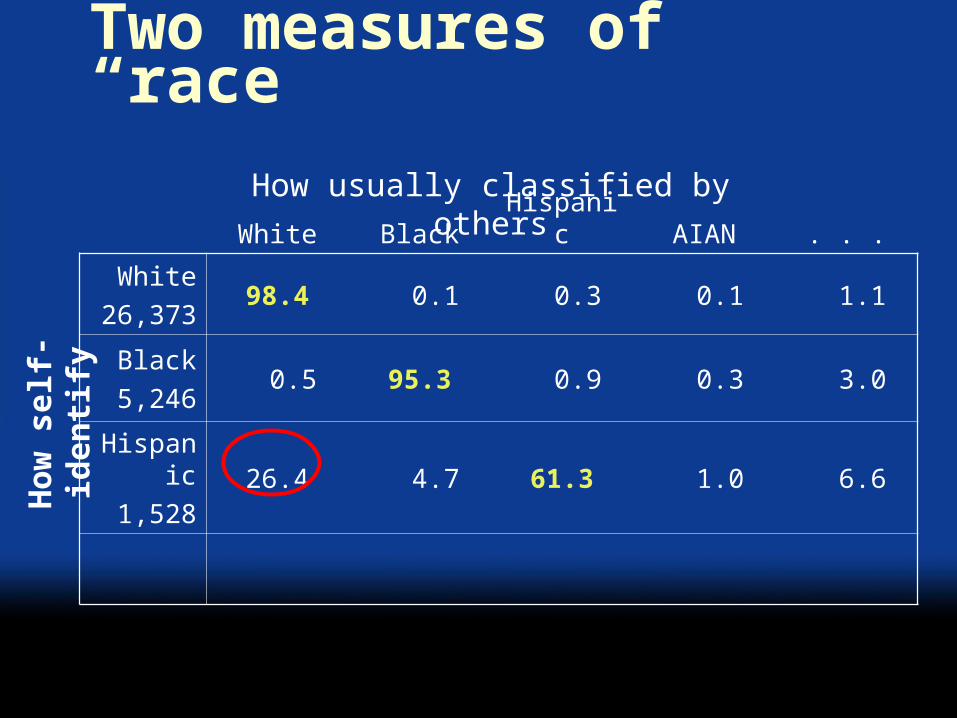
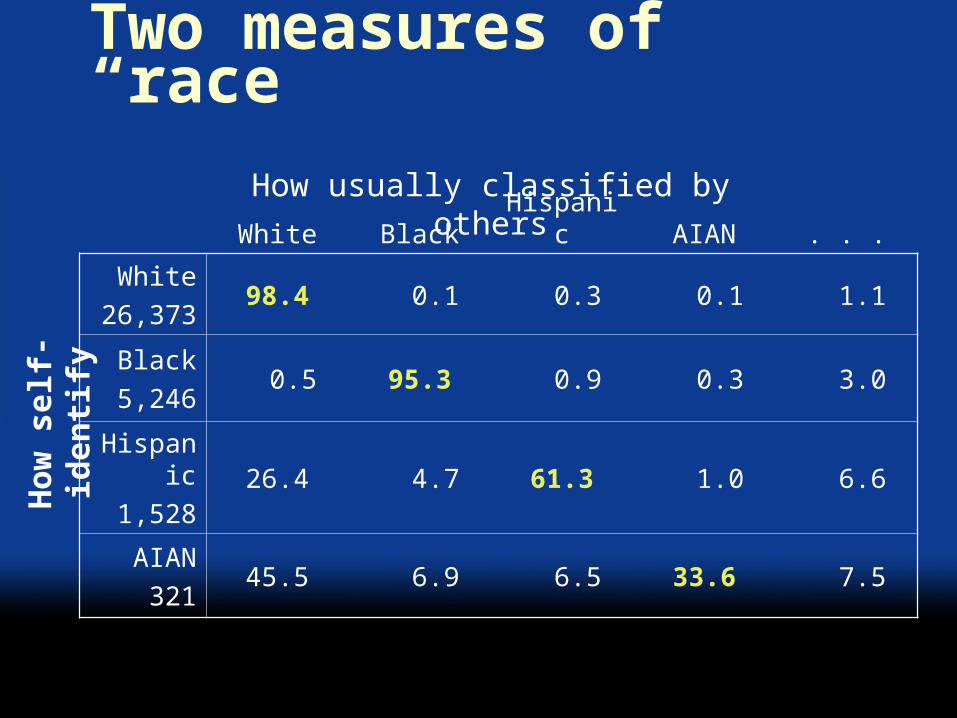
Two measures of “race”
How usually classified by others
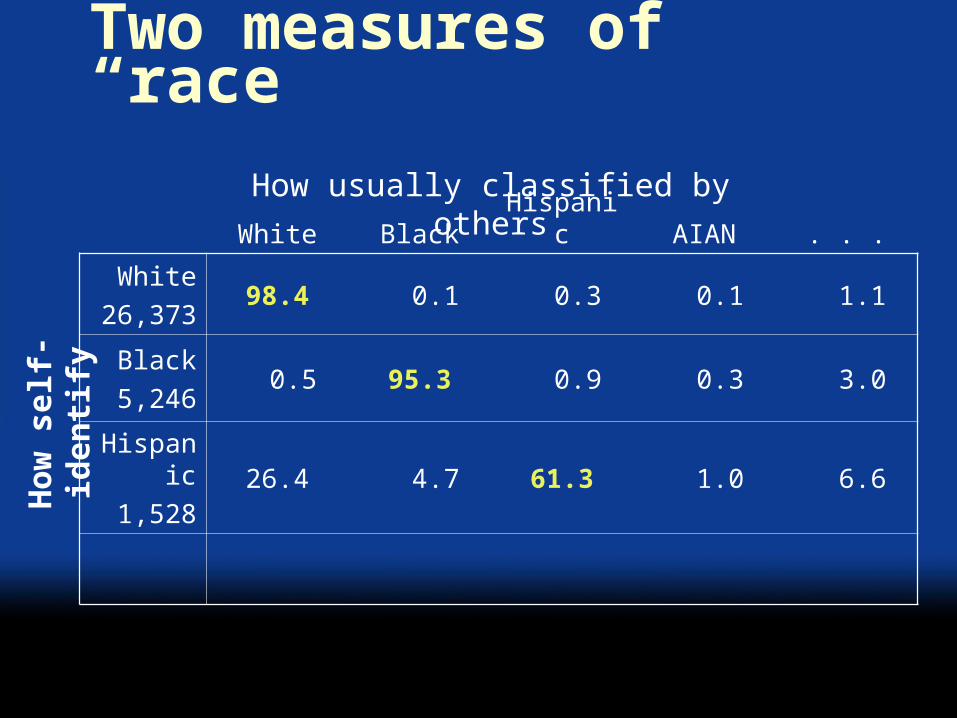
White Black Hispanic AIAN . . .
White
26,37398.4 0.1 0.3 0.1 1.1
Black
5,246 0.5 95.3 0.9 0.3 3.0
Hispanic
1,52826.4 4.7 61.3 1.0 6.6
How
self
-id
en
tify
Two measures of “race”
How usually classified by others
White Black Hispanic AIAN . . .
White
26,37398.4 0.1 0.3 0.1 1.1
Black
5,246 0.5 95.3 0.9 0.3 3.0
Hispanic
1,52826.4 4.7 61.3 1.0 6.6
How
self
-id
en
tify
Two measures of “race”
How usually classified by others
02
04
06
08
01
00
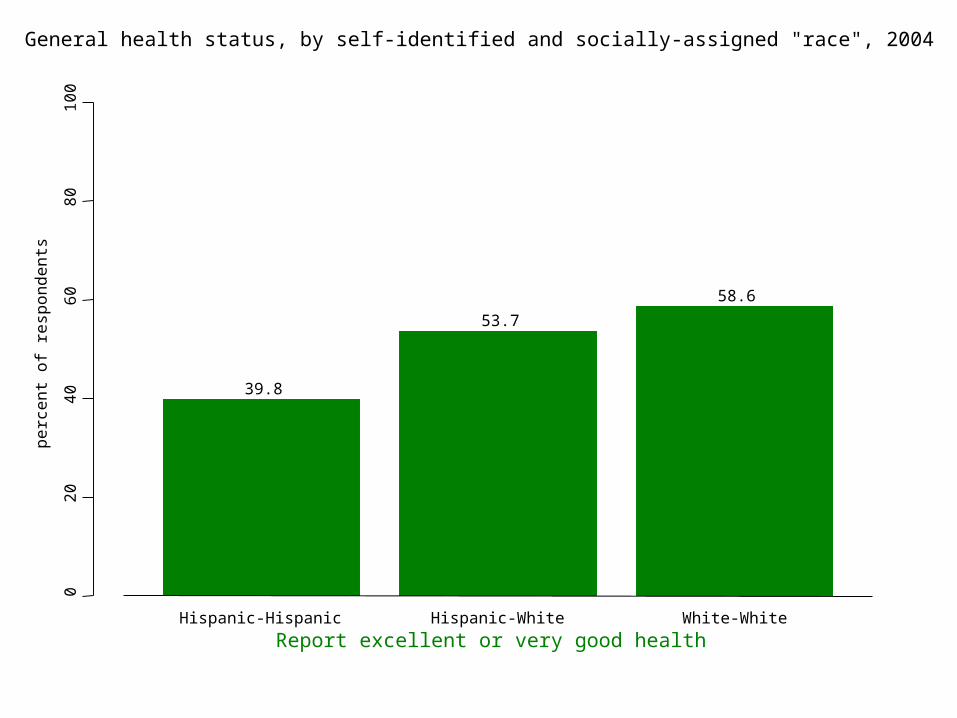
39.8
53.7
58.6
pe
rce
nt
of
resp
on
de
nts
Report excellent or very good healthHispanic-Hispanic Hispanic-White White-White
General health status, by self-identified and socially-assigned "race", 2004
02
04
06
08
01
00
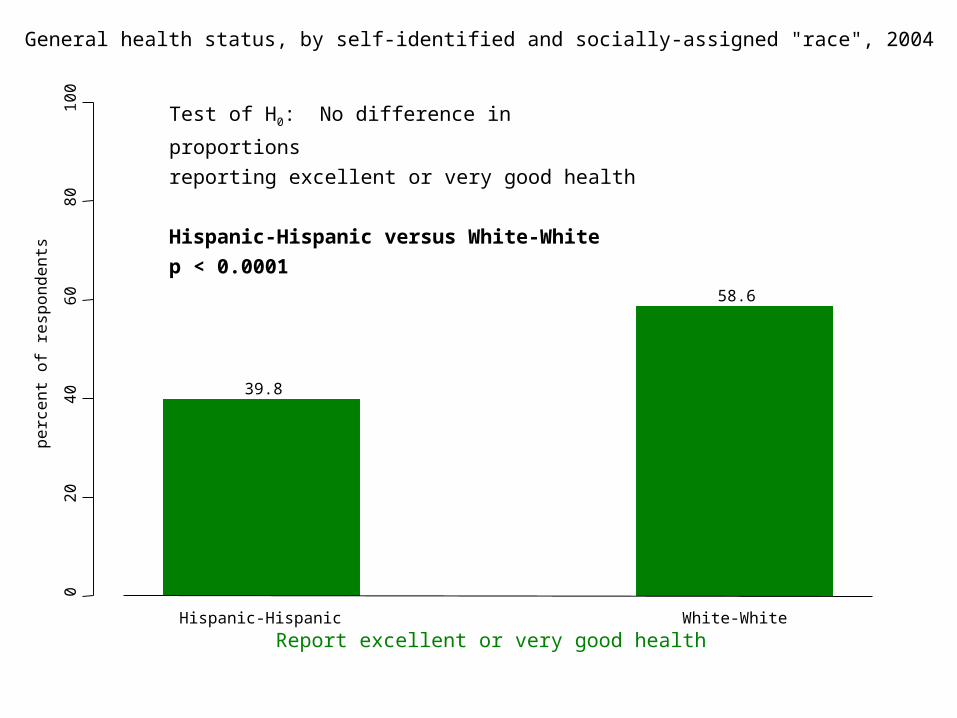
39.8
58.6
pe
rce
nt
of
resp
on
de
nts
Report excellent or very good healthHispanic-Hispanic White-White
General health status, by self-identified and socially-assigned "race", 2004
Test of H0: No difference in proportions
reporting excellent or very good health
Hispanic-Hispanic versus White-White
p < 0.0001
02
04
06
08
01
00
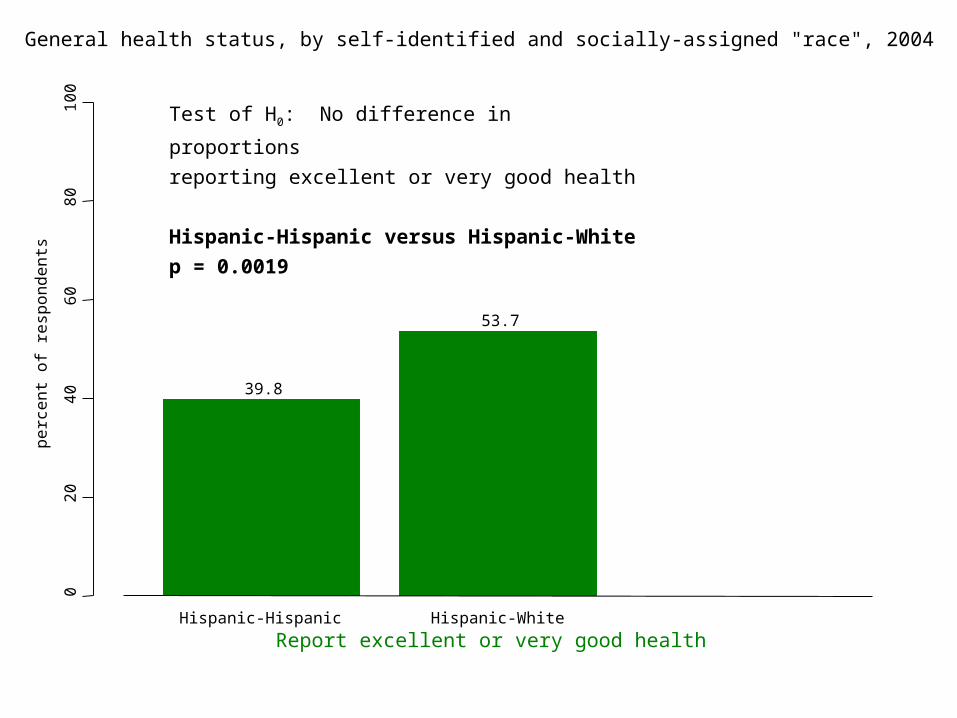
39.8
53.7
pe
rce
nt
of
resp
on
de
nts
Report excellent or very good healthHispanic-Hispanic Hispanic-White
General health status, by self-identified and socially-assigned "race", 2004
Test of H0: No difference in proportions
reporting excellent or very good health
Hispanic-Hispanic versus Hispanic-White
p = 0.0019
02
04
06
08
01
00
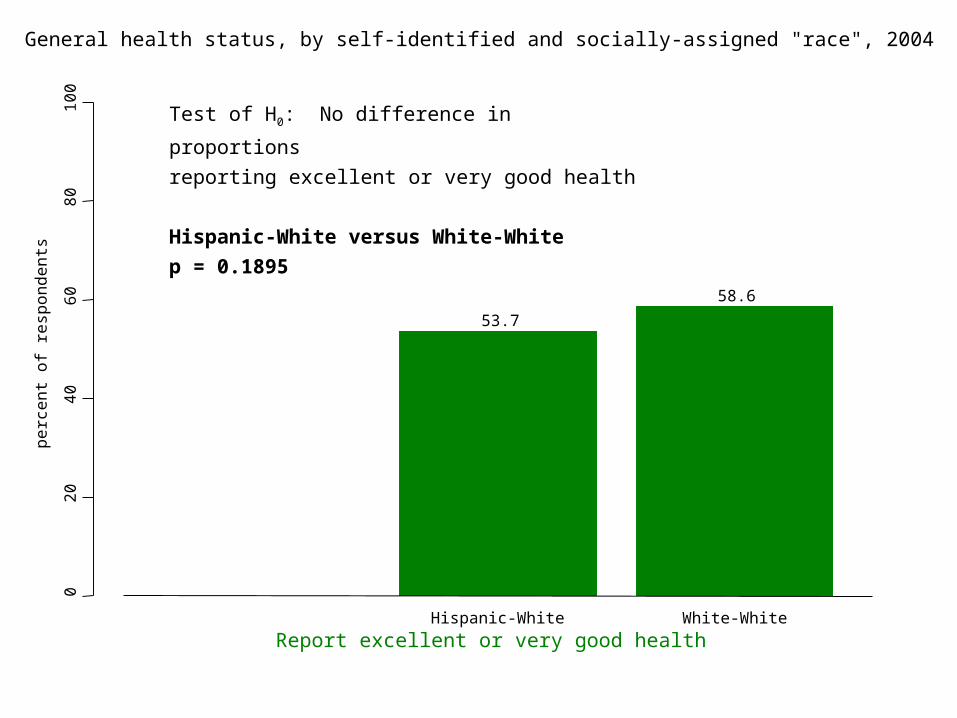
53.7
58.6
pe
rce
nt
of
resp
on
de
nts
Report excellent or very good healthHispanic-White White-White
General health status, by self-identified and socially-assigned "race", 2004
Test of H0: No difference in proportions
reporting excellent or very good health
Hispanic-White versus White-White
p = 0.1895
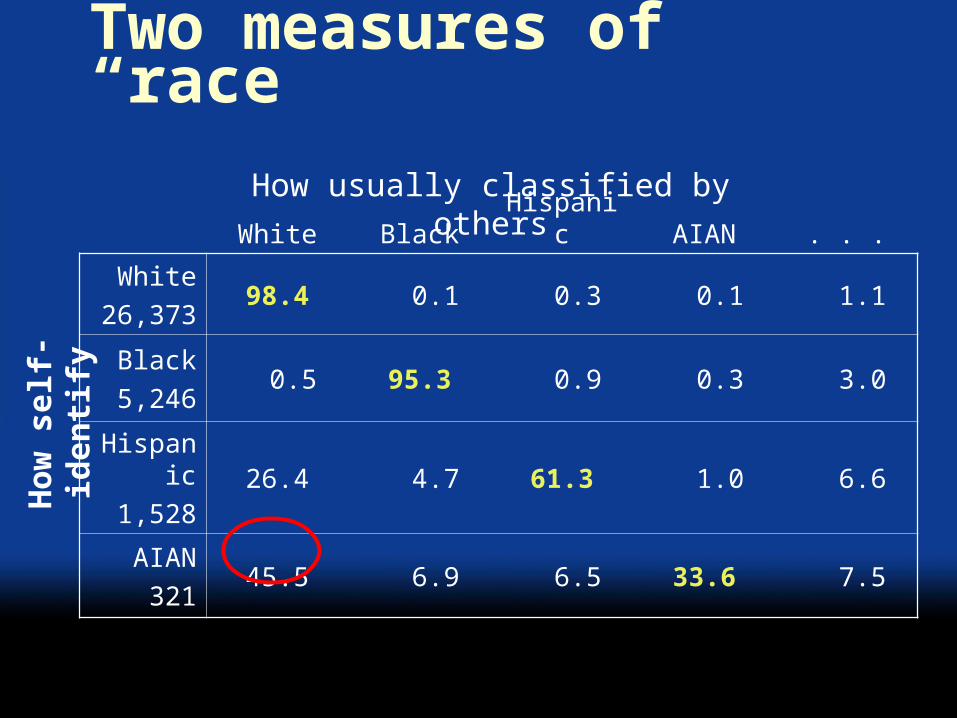
White Black Hispanic AIAN . . .
White
26,37398.4 0.1 0.3 0.1 1.1
Black
5,246 0.5 95.3 0.9 0.3 3.0
Hispanic
1,52826.4 4.7 61.3 1.0 6.6
AIAN
32145.5 6.9 6.5 33.6 7.5
How
self
-id
en
tify
Two measures of “race”
How usually classified by others
White Black Hispanic AIAN . . .
White
26,37398.4 0.1 0.3 0.1 1.1
Black
5,246 0.5 95.3 0.9 0.3 3.0
Hispanic
1,52826.4 4.7 61.3 1.0 6.6
AIAN
32145.5 6.9 6.5 33.6 7.5
How
self
-id
en
tify
Two measures of “race”
How usually classified by others
02
04
06
08
01
00
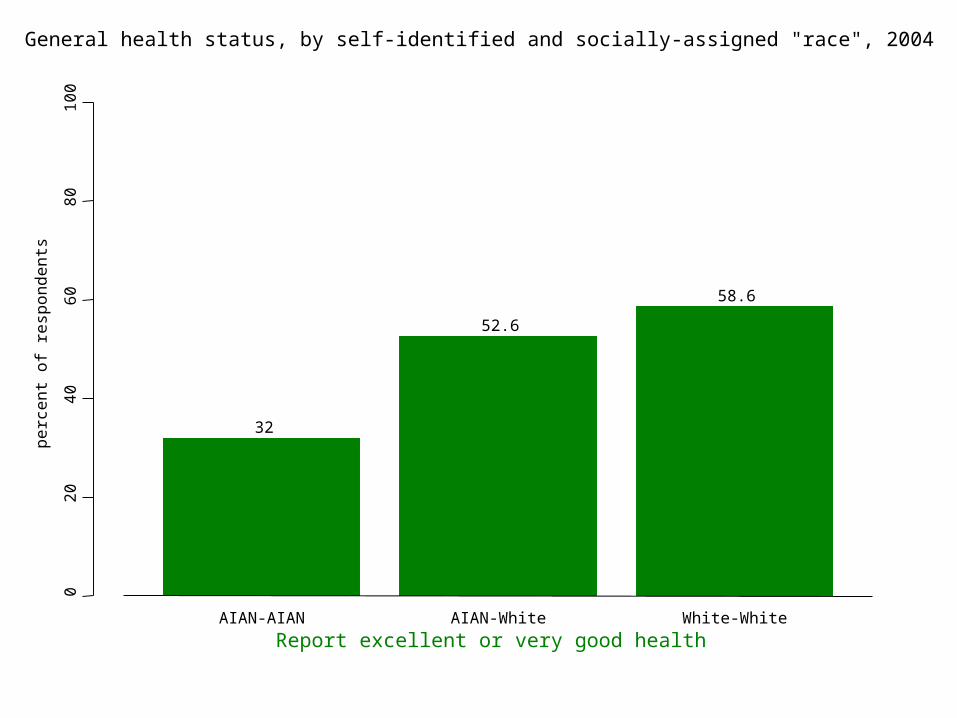
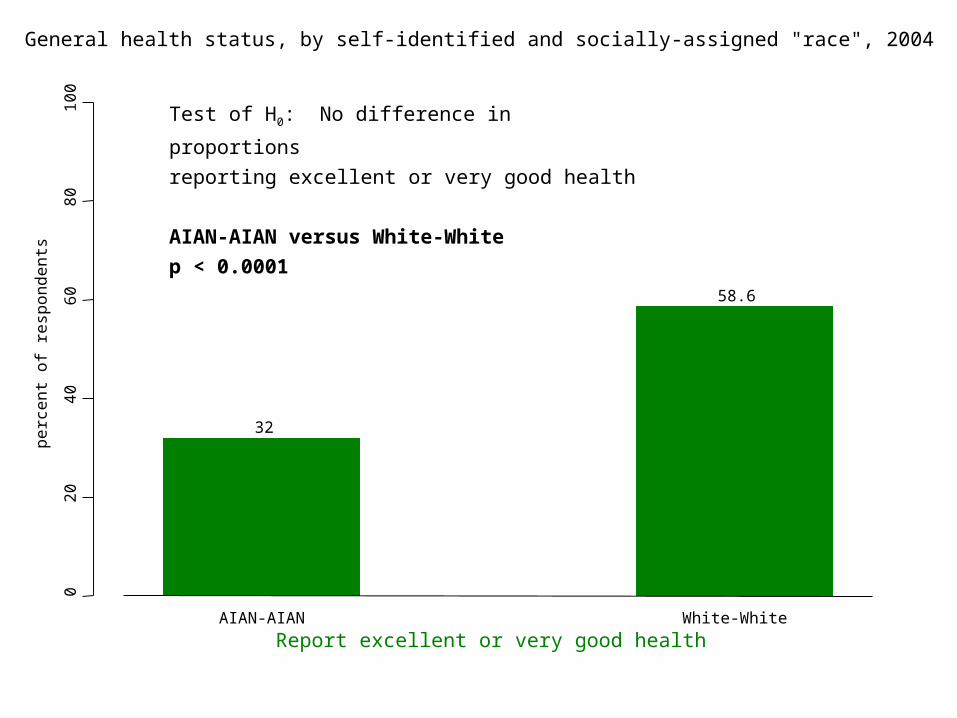
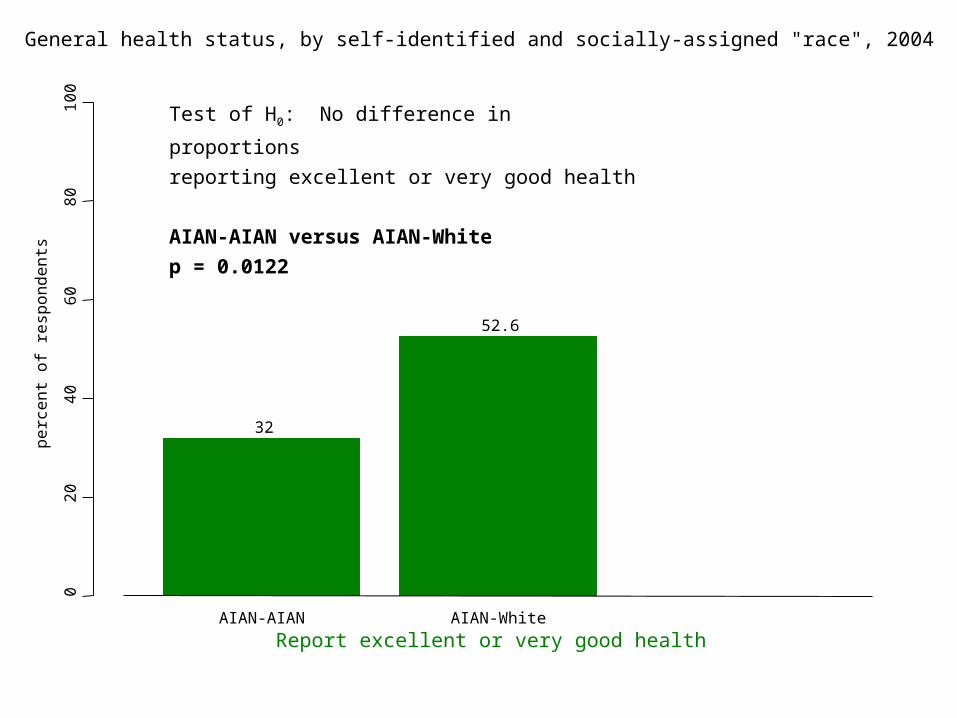
32
52.6
58.6
pe
rce
nt
of
resp
on
de
nts
Report excellent or very good healthAIAN-AIAN AIAN-White White-White
General health status, by self-identified and socially-assigned "race", 2004
02
04
06
08
01
00
32
58.6
pe
rce
nt
of
resp
on
de
nts
Report excellent or very good healthAIAN-AIAN White-White
General health status, by self-identified and socially-assigned "race", 2004
Test of H0: No difference in proportions
reporting excellent or very good health
AIAN-AIAN versus White-White
p < 0.0001
02
04
06
08
01
00
32
52.6
pe
rce
nt
of
resp
on
de
nts
Report excellent or very good healthAIAN-AIAN AIAN-White
General health status, by self-identified and socially-assigned "race", 2004
Test of H0: No difference in proportions
reporting excellent or very good health
AIAN-AIAN versus AIAN-White
p = 0.0122

02
04
06
08
01
00
52.6
58.6
pe
rce
nt
of
resp
on
de
nts
Report excellent or very good healthAIAN-White White-White
General health status, by self-identified and socially-assigned "race", 2004
Test of H0: No difference in proportions
reporting excellent or very good health
AIAN-White versus White-White
p = 0.3070
General health status and “race”“White” social experience associated with
better health Even within the same self-identified “race”/ethnic
group
020
4060
8010
0
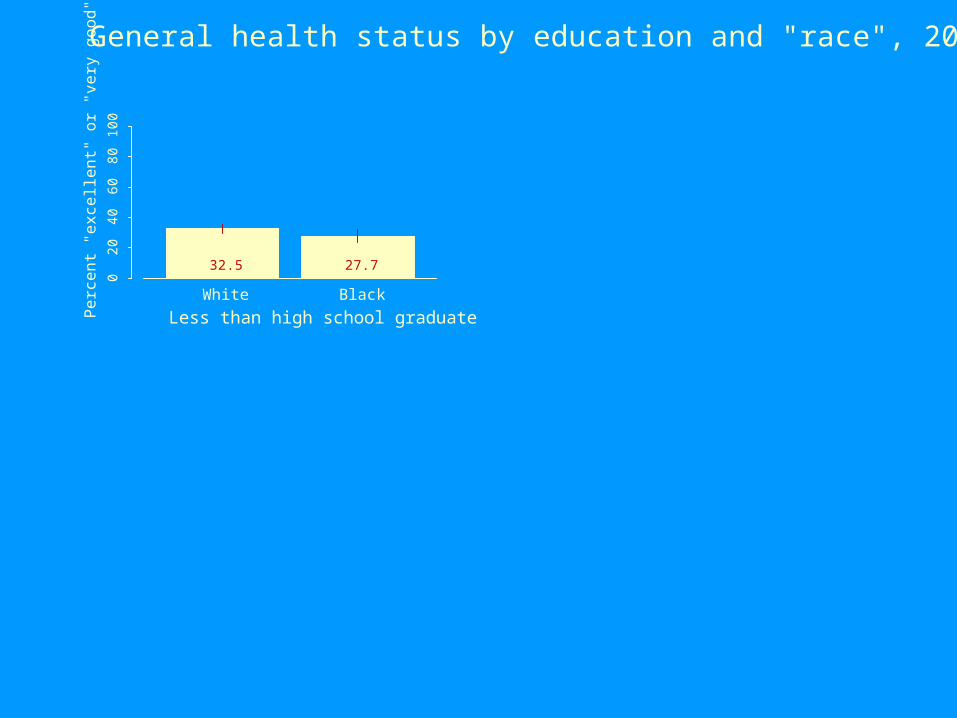
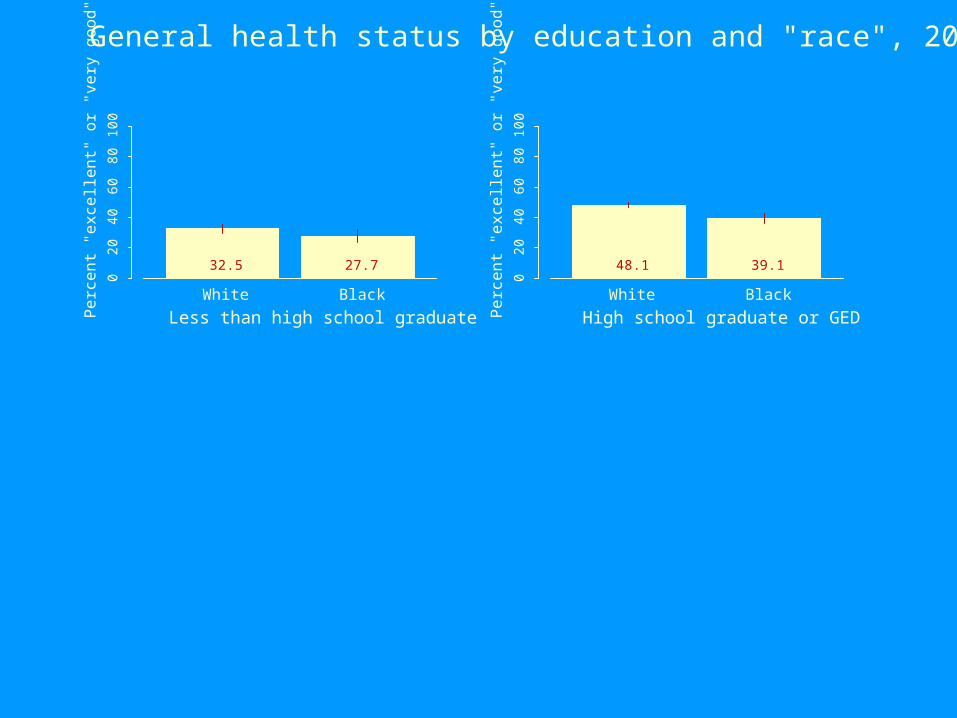
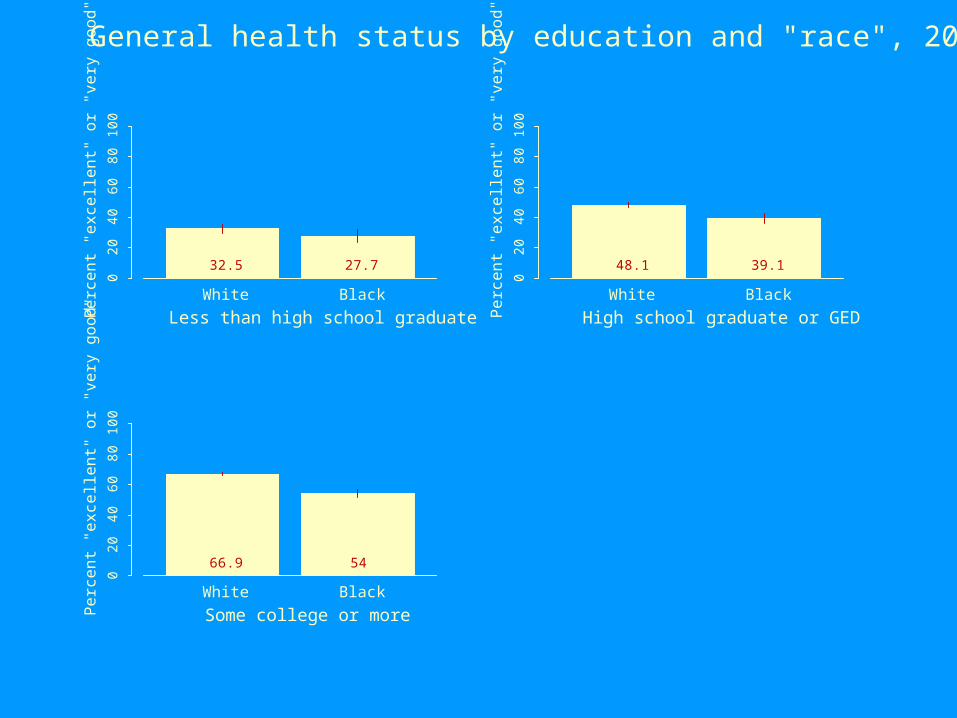
32.5 27.7
White Black
Per
cent
"ex
celle
nt"
or "
very
goo
d"
Less than high school graduate
General health status by education and "race", 2004 BRFSS
020
4060
8010
0
32.5 27.7
White Black
Per
cent
"ex
celle
nt"
or "
very
goo
d"
Less than high school graduate
020
4060
8010
0
48.1 39.1
White Black
Per
cent
"ex
celle
nt"
or "
very
goo
d"
High school graduate or GED
General health status by education and "race", 2004 BRFSS
020
4060
8010
0
32.5 27.7
White Black
Per
cent
"ex
celle
nt"
or "
very
goo
d"
Less than high school graduate
020
4060
8010
0
48.1 39.1
White Black
Per
cent
"ex
celle
nt"
or "
very
goo
d"
High school graduate or GED
020
4060
8010
0
66.9 54
White Black
Per
cent
"ex
celle
nt"
or "
very
goo
d"
Some college or more
General health status by education and "race", 2004 BRFSS
w
w
w
w
w
02
04
06
08
0
Education level
Pe
rce
nt "
exc
elle
nt"
or
"ve
ry g
oo
d"
16+ 13-15 12 9-11 0-8
bb
b
b
b
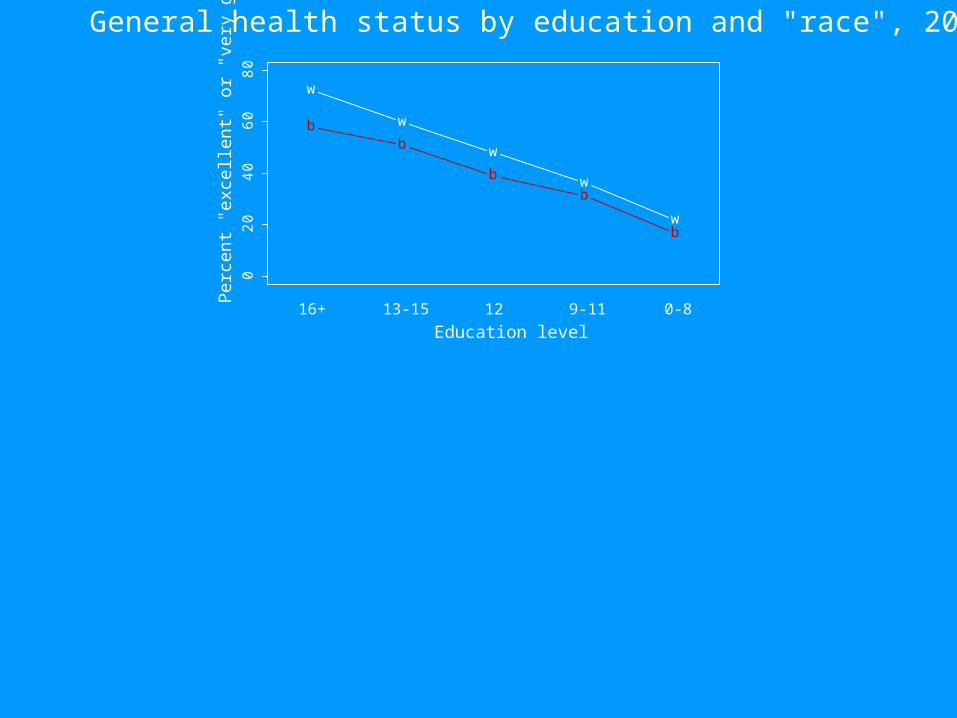
General health status by education and "race", 2004 BRFSS
General health status and “race”“White” social experience associated with
better health Even within the same self-identified “race”/ethnic
group Even within the same educational level

w
w
w
w
w
02
04
06
08
0
Education level
Pe
rce
nt "
exc
elle
nt"
or
"ve
ry g
oo
d"
16+ 13-15 12 9-11 0-8
bb
b
b
b
General health status by education and "race", 2004 BRFSS
w
w
w
w
w
02
04
06
08
0
Education level
Pe
rce
nt "
exc
elle
nt"
or
"ve
ry g
oo
d"
16+ 13-15 12 9-11 0-8
bb
b
b
b0
51
01
52
02
5
16+ 13-15 12 9-11 0-8
Education level
Pe
rce
nt d
istr
ibu
tion
non-blackblack
General health status by education and "race", 2004 BRFSS

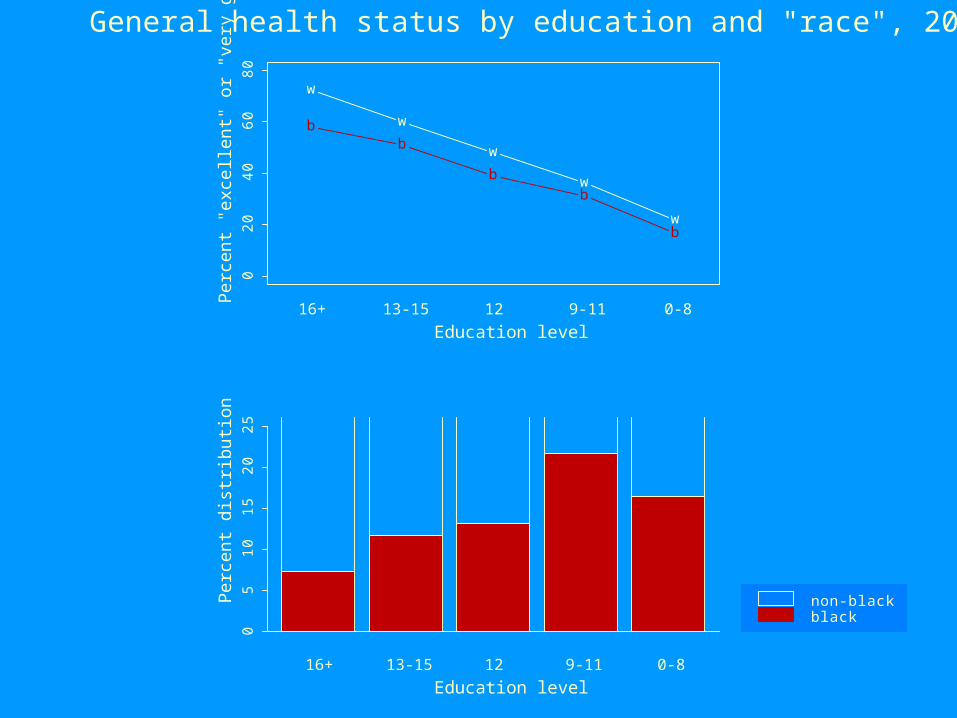
w
w
w
w
w
02
04
06
08
0
Education level
Pe
rce
nt "
exc
elle
nt"
or
"ve
ry g
oo
d"
16+ 13-15 12 9-11 0-8
bb
b
b
b0
51
01
52
02
5
16+ 13-15 12 9-11 0-8
Education level
Pe
rce
nt d
istr
ibu
tion
non-blackblack
General health status by education and "race", 2004 BRFSS
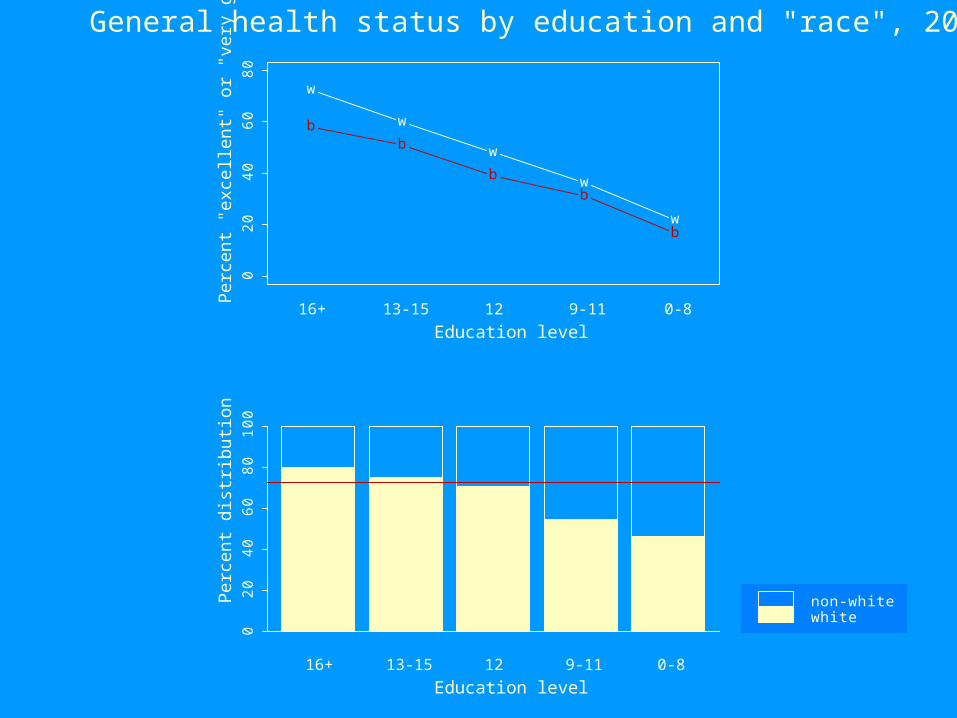
w
w
w
w
w
02
04
06
08
0
Education level
Pe
rce
nt "
exc
elle
nt"
or
"ve
ry g
oo
d"
16+ 13-15 12 9-11 0-8
bb
b
b
b0
20
40
60
80
10
0
16+ 13-15 12 9-11 0-8
Education level
Pe
rce
nt d
istr
ibu
tion
non-whitewhite
General health status by education and "race", 2004 BRFSS
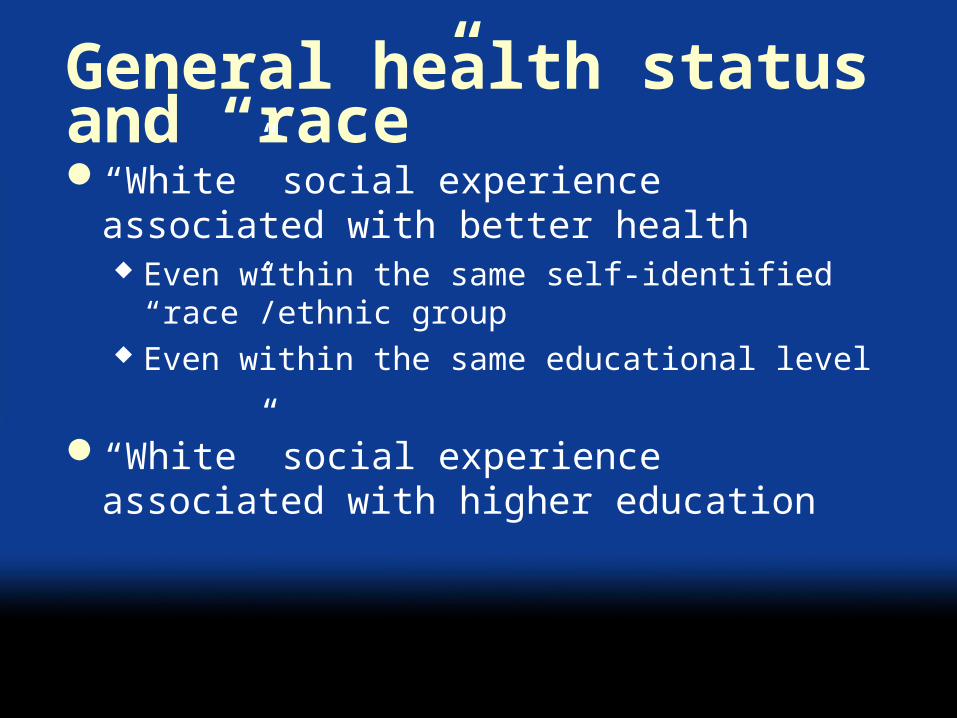
General health status and “race”“White” social experience associated with
better health Even within the same self-identified “race”/ethnic
group Even within the same educational level
“White” social experience associated with higher education
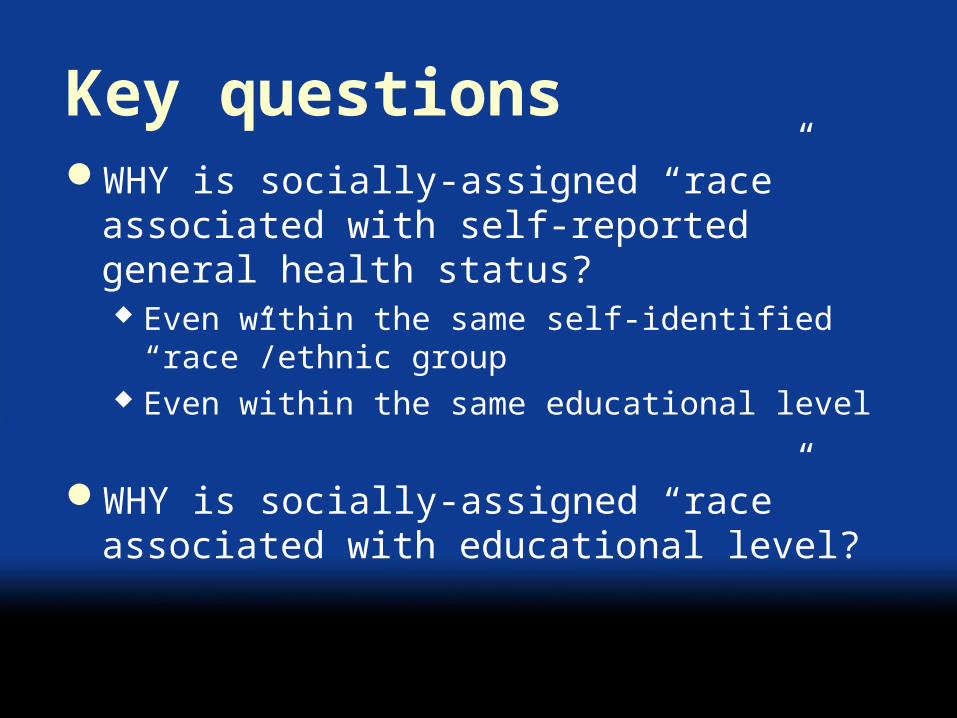
Key questionsWHY is socially-assigned “race” associated
with self-reported general health status? Even within the same self-identified “race”/ethnic
group Even within the same educational level
WHY is socially-assigned “race” associated with educational level?
A system of structuring opportunity and assigning value based on the social interpretation of how we look (“race”) Unfairly disadvantages some individuals and
communities Unfairly advantages other individuals and
communities Saps the strength of the whole society through the
waste of human resources
Racism
Source: Jones CP, Phylon 2003


![KEY PUBLIC HEALTH RESOURCES FOR ANTI- RACISM ACTION: A ...nccdh.ca/images/uploads/comments/Key_public_health_resources_f… · [2016]. What Is Systemic Racism? is a video series from](https://img.pdfslide.us/doc/110x75/5f45100d2071ff437318b02e/key-public-health-resources-for-anti-racism-action-a-nccdhcaimagesuploadscommentskeypublichealthresourcesf.jpg)