Embed Size (px)
Citation preview

Trey Apel
Alumni Student Careers Forum
March 16, 2012
Catastrophe Modeling:
What is it…
…and why you should care.
Plus a few words about getting a job
© 2012 Risk Management Solutions, Inc.
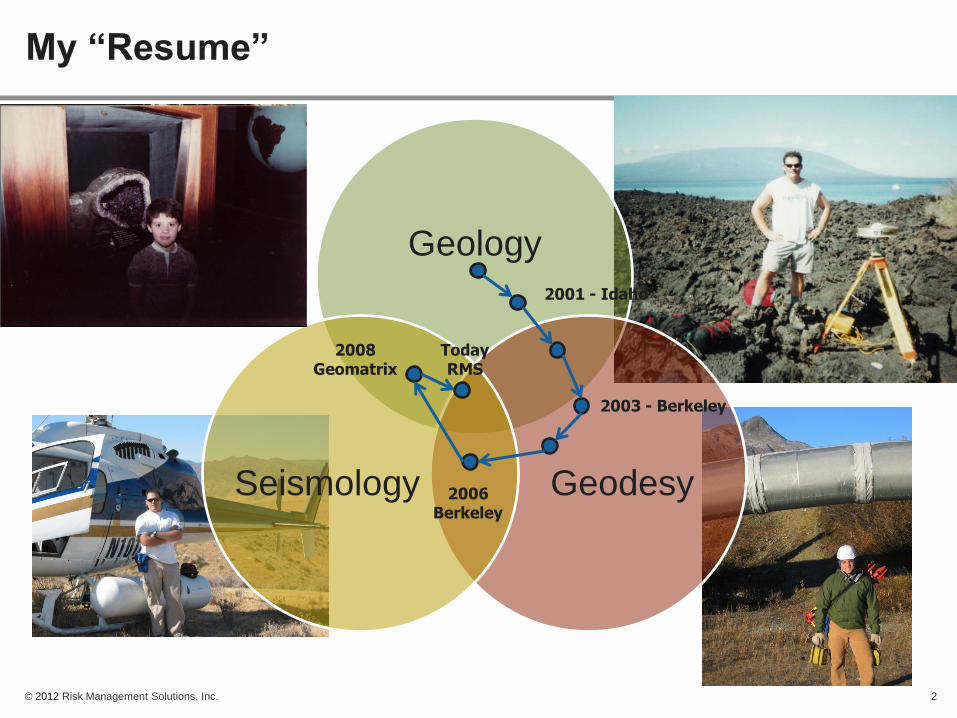
My “Resume”
2
Geology
Geodesy Seismology
2001 - Idaho
2003 - Berkeley
2006 Berkeley
2008 Geomatrix
Today RMS
© 2012 Risk Management Solutions, Inc.
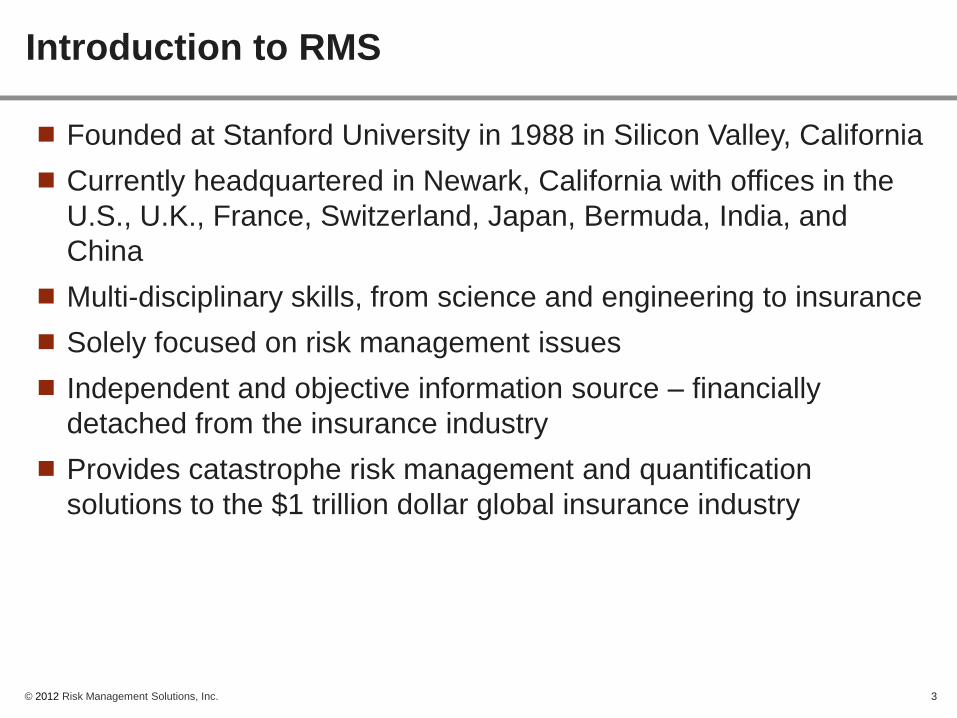
Founded at Stanford University in 1988 in Silicon Valley, California
Currently headquartered in Newark, California with offices in the
U.S., U.K., France, Switzerland, Japan, Bermuda, India, and
China
Multi-disciplinary skills, from science and engineering to insurance
Solely focused on risk management issues
Independent and objective information source – financially
detached from the insurance industry
Provides catastrophe risk management and quantification
solutions to the $1 trillion dollar global insurance industry
Introduction to RMS
3

© 2012 Risk Management Solutions, Inc. 4
“ At RMS, our goal is to help manage catastrophe risk
through the practical application of the most
advanced quantitative risk assessment techniques
available.”
- Hemant Shah, President & CEO

© 2012 Risk Management Solutions, Inc.
RMS Evolution
5
Founded at Stanford University
RiskLink®-ALM for treaty reinsurers;
London office opens
Models cover 40 territories
California
Earthquake model
1988
U.S. Earthquake and Hurricane models
Models cover 12 countries
RiskLink®-DLM
U.S. Hurricane model
Expanded to weather risk
1994 1996 1998 2000 1990 1992 2002 2006
Terrorism & Workers Comp
models
Models cover 42 countries
Purchased by Daily Mail
International Geocoding Accumulation
Updated U.S. Hurricane
model
Updated Europe Windstorm
model
2004 2008
New U.S. & Canada climate hazard models;
data quality solutions
2010
Upgrade of North America Earthquake and significant
expansion of Latin American Earthquake
models
2012
Upgrade and significant expansion of North Atlantic
hurricane models; Upgrade to Europe Windstorm model
Enterprise Grid Computing
© 2012 Risk Management Solutions, Inc.
50 +
31-50
11-30
1-10
Toronto
ChicagoCincinnati
Minneapolis
Denver
MontrealVancouverSeattle
Sydney
Melbourne
Perth
ZurichMilan
MadridLisbon
Athens
Istanbul
Ramat-Gan
Dubai
MunichBudapest
Paris
Rotterdam
Brussels
Copenhagen
Oslo Stockholm
San Francisco
Los Angeles
Hong Kong
Bangalore
SingaporeKuala Lumpur
PhiladelphiaCharlotteAtlanta
Houston Miami
BostonNew York
London
Dublin
Bermuda
San JuanCayman Islands
Barbados
Mexico City
Bogota
Honolulu
Sao Paulo
Tokyo
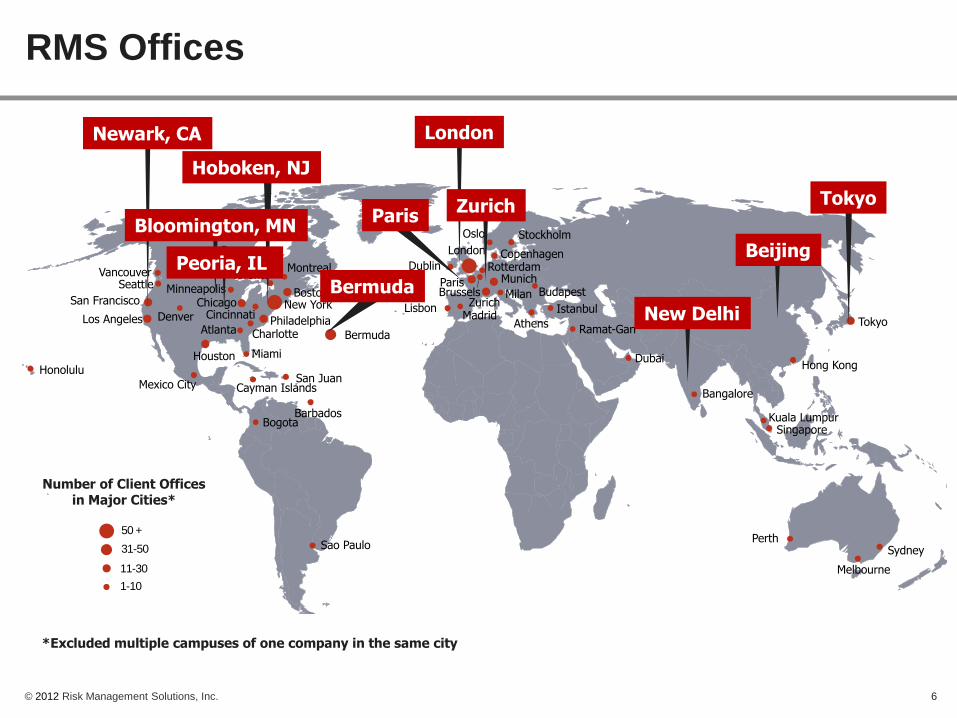
RMS Offices
6
Number of Client Offices in Major Cities*
*Excluded multiple campuses of one company in the same city
Newark, CA
Hoboken, NJ
Bloomington, MN
Peoria, IL
London
Zurich
Beijing
New Delhi
Tokyo
Bermuda
Paris
© 2012 Risk Management Solutions, Inc.
What is Cat Modeling?
7
© 2012 Risk Management Solutions, Inc.
A Risk Solution
Catastrophe – an event causing great and often sudden
damage or suffering
Modeling – process of generating abstract, conceptual
graphical, or mathematical approximations of natural
phenomena
Why model catastrophes?
Because they are devastating and we haven’t observed
enough of them.
8

© 2012 Risk Management Solutions, Inc.
Earthquake Insurance: The Dilemma
Limited historical experience
Large earthquakes typically under-
represented in the historical record
(long return periods)
Insurance companies cannot rely
on past loss experiences to
understand the financial
implications posed by large,
damaging earthquakes
California earthquake insurance
premium collected and losses
paid each year 1970-1993
0
50
100
150
200
250
300
350
400
450
500
550
600
650
1970
1971
1972
1973
1974
1975
1976
1977
1978
1979
1980
1981
1982
1983
1984
1985
1986
1987
1988
1989
1990
1991
1992
1993
Losses Paid
Premium Collected
© 2012 Risk Management Solutions, Inc.
0
1000
2000
3000
4000
5000
6000
7000
8000
1970
1971
1972
1973
1974
1975
1976
1977
1978
1979
1980
1981
1982
1983
1984
1985
1986
1987
1988
1989
1990
1991
1992
1993
1994
Losses Paid
Premium Collected
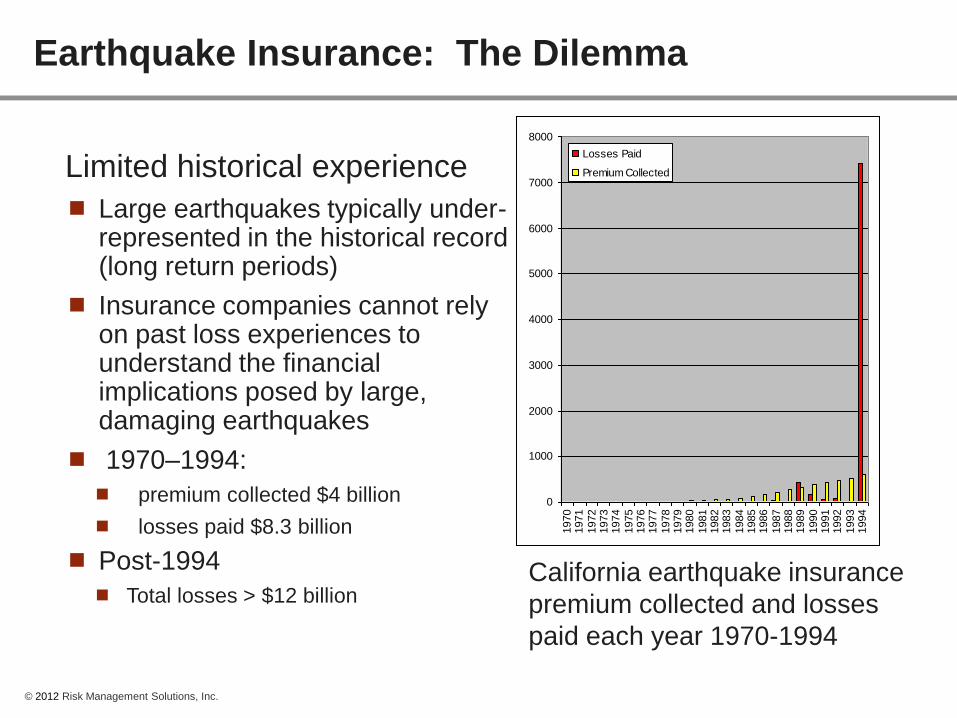
Earthquake Insurance: The Dilemma
California earthquake insurance
premium collected and losses
paid each year 1970-1994
Limited historical experience
Large earthquakes typically under-represented in the historical record (long return periods)
Insurance companies cannot rely on past loss experiences to understand the financial implications posed by large, damaging earthquakes
1970–1994:
premium collected $4 billion
losses paid $8.3 billion
Post-1994
Total losses > $12 billion
© 2012 Risk Management Solutions, Inc. 11
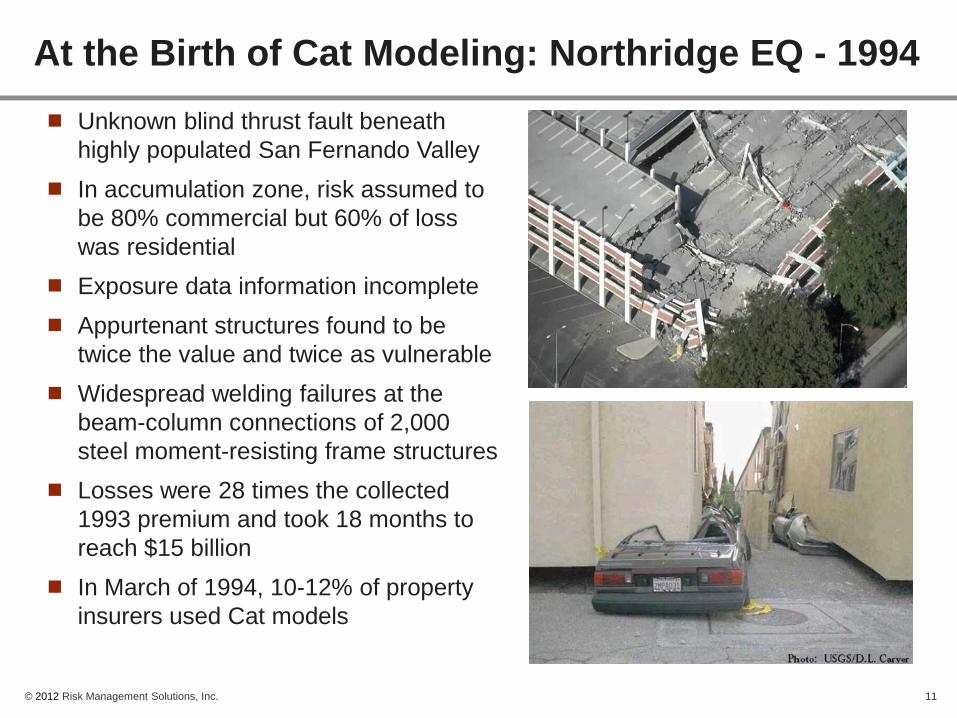
At the Birth of Cat Modeling: Northridge EQ - 1994
Unknown blind thrust fault beneath
highly populated San Fernando Valley
In accumulation zone, risk assumed to
be 80% commercial but 60% of loss
was residential
Exposure data information incomplete
Appurtenant structures found to be
twice the value and twice as vulnerable
Widespread welding failures at the
beam-column connections of 2,000
steel moment-resisting frame structures
Losses were 28 times the collected
1993 premium and took 18 months to
reach $15 billion
In March of 1994, 10-12% of property
insurers used Cat models

© 2012 Risk Management Solutions, Inc. 12
Before Cat Modeling: Hurricane Andrew - 1992
$17 billion in claims from 65% of homeowners
11 insurers went insolvent
The Florida Insurance Guaranty Fund had to issue bonds to cover claims
South Florida insurance rates increased 300% while the rest of state increased 100%
More than 1 million Floridians non renewed
$4.2 billion in capital invested in 12 new reinsurers between Hurricane Andrew and January 1994
– Emergence of new generation of technical reinsurers founded on modeling
© 2012 Risk Management Solutions, Inc. 13
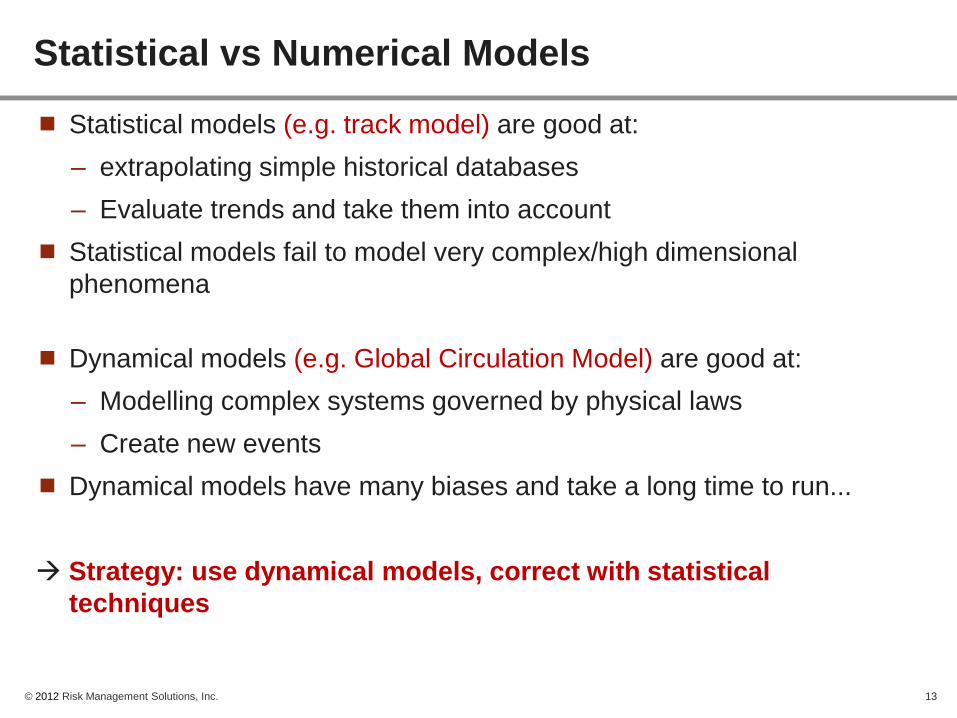
Statistical vs Numerical Models
Statistical models (e.g. track model) are good at:
– extrapolating simple historical databases
– Evaluate trends and take them into account
Statistical models fail to model very complex/high dimensional
phenomena
Dynamical models (e.g. Global Circulation Model) are good at:
– Modelling complex systems governed by physical laws
– Create new events
Dynamical models have many biases and take a long time to run...
Strategy: use dynamical models, correct with statistical
techniques

© 2012 Risk Management Solutions, Inc.
Why are catastrophe risk models a solution?
The historical record of events is not complete and must be
supplemented
Models provide a representation of complex physical
phenomena
Models allow for the calculation of future expected loss and the
quantification of uncertainty around results
Models provide a common framework and/or metric for
describing behavior or results
© 2012 Risk Management Solutions, Inc. 15
“ All models are wrong, but some
prove to be useful.” Prof. George Box (1979)
© 2012 Risk Management Solutions, Inc.
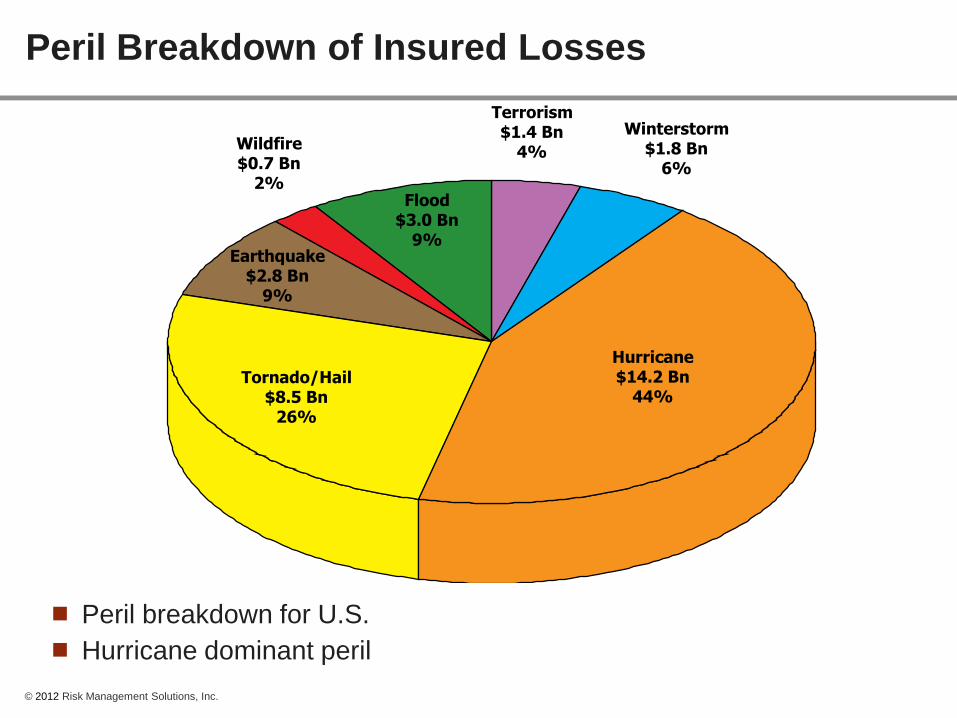
Peril Breakdown of Insured Losses
Hurricane$14.2 Bn
44%Tornado/Hail
$8.5 Bn26%
Flood$3.0 Bn
9%Earthquake
$2.8 Bn9%
Wildfire$0.7 Bn
2%
Winterstorm$1.8 Bn
6%
Terrorism$1.4 Bn
4%
Peril breakdown for U.S.
Hurricane dominant peril

© 2012 Risk Management Solutions, Inc.
Global Catastrophe Modeling Capabilities
Earthquake Hurricane
Severe
Convective
Storm
Windstorm
Europe
Latin
America
Asia
North
America
Middle
East
Oceania
Winter
Storm Flood Terrorism Pandemic Longevity
© 2012 Risk Management Solutions, Inc.
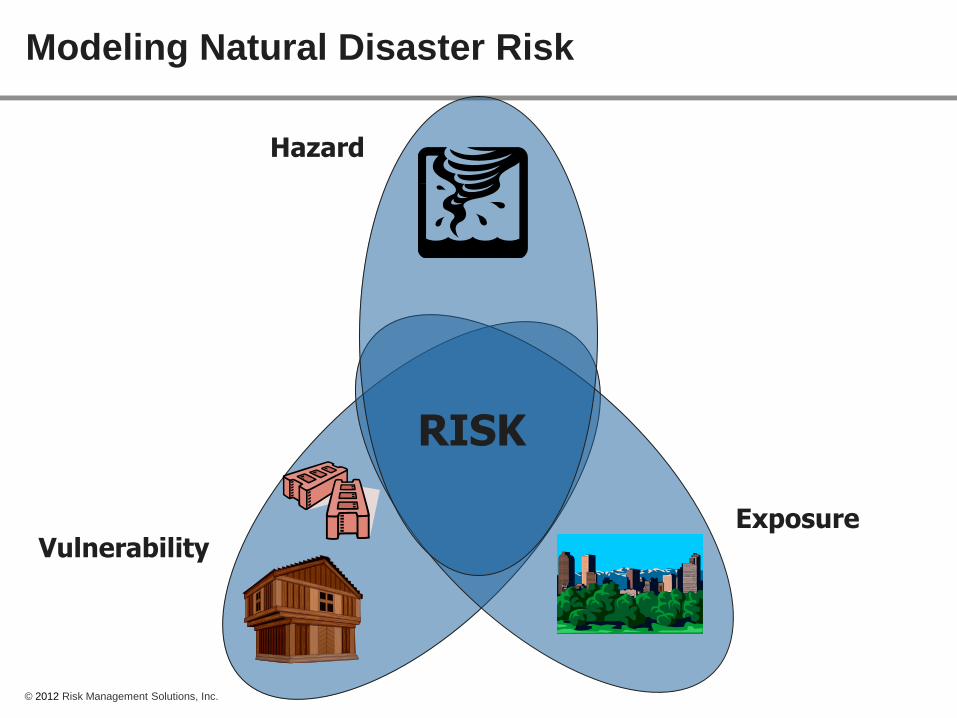
Vulnerability Exposure
Hazard
Modeling Natural Disaster Risk
RISK

© 2012 Risk Management Solutions, Inc.
Modeling Framework
Assess Wind
Speed Calculate
Damage
Define Windstorm
Event
Quantify Financial
Loss
90%$ Loss
Stochastic
Module
Hazard
Module
Vulnerability
Module
Financial
Module
Assess Ground
Motion Calculate
Damage
Define Earthquake
Event
Quantify Financial
Loss
90%$ Loss

© 2012 Risk Management Solutions, Inc.
Hazard
– Stochastic event set: a set of discrete events covering all possible combinations of type (what is it?), location (where is it?), size (how big is it?) & recurrence (how often does it occur?)
– Ground motion: amplitude and frequency content as earthquake attenuates (considering site conditions)
Exposure
– Property at risk at „highest‟ resolution possible, considering construction, occupancy, year built, number of stories for model peril region
Model Components
Exposure
Hazard
20

© 2012 Risk Management Solutions, Inc.
Vulnerability
– Relationship between ground
motion and damage, captured
as a Mean Damage Ratio
(MDR) = Average Loss /
Replacement Value
– Damage by insurance coverage
(building, contents, BI)
Loss
– Event loss distributions,
measuring loss to location,
policy, portfolio losses
– Annual loss distributions,
combining all event losses to
arrive at an annualized
distribution
Model Components (continued)
Vulnerability Loss
21
Exposure
Vulnerability Function for Reinforced Concrete (RC) Building
Ground Motion Measure
Me
an
Da
ma
ge
Ra
tio
Mean
Uncertainty
Distribution
© 2012 Risk Management Solutions, Inc.
An
nu
al
Pro
bab
ilit
y o
f E
xceed
en
ce (
%)
Loss Amount
0
2
4
6
10
8
0 50M 150M 250M
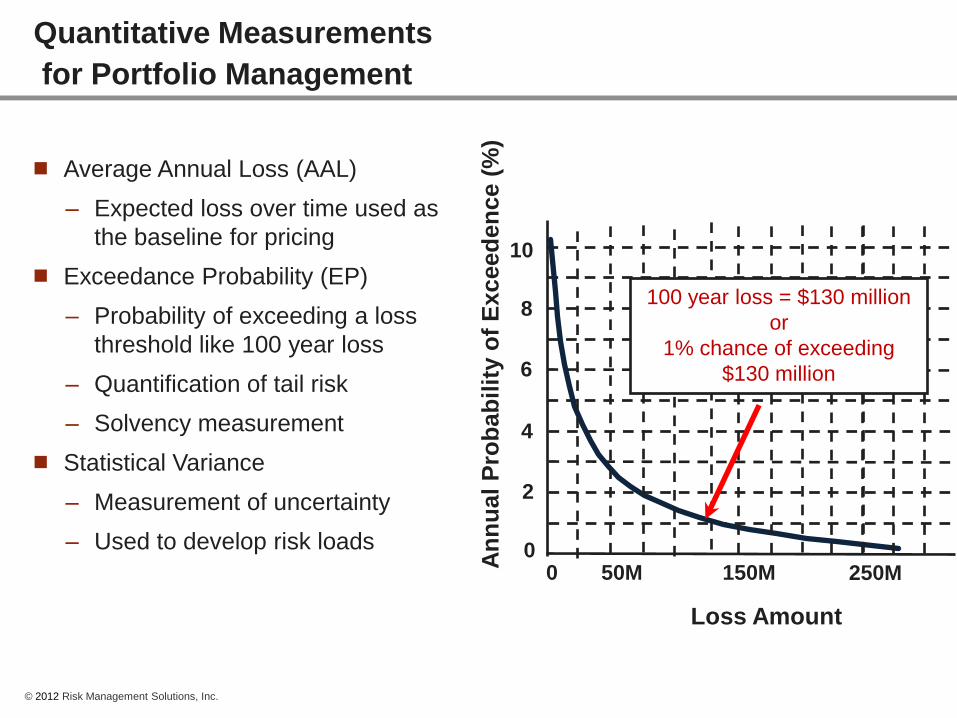
100 year loss = $130 million
or
1% chance of exceeding
$130 million
Quantitative Measurements
for Portfolio Management
Average Annual Loss (AAL)
– Expected loss over time used as
the baseline for pricing
Exceedance Probability (EP)
– Probability of exceeding a loss
threshold like 100 year loss
– Quantification of tail risk
– Solvency measurement
Statistical Variance
– Measurement of uncertainty
– Used to develop risk loads

© 2012 Risk Management Solutions, Inc.
What do I do?
23
© 2012 Risk Management Solutions, Inc.
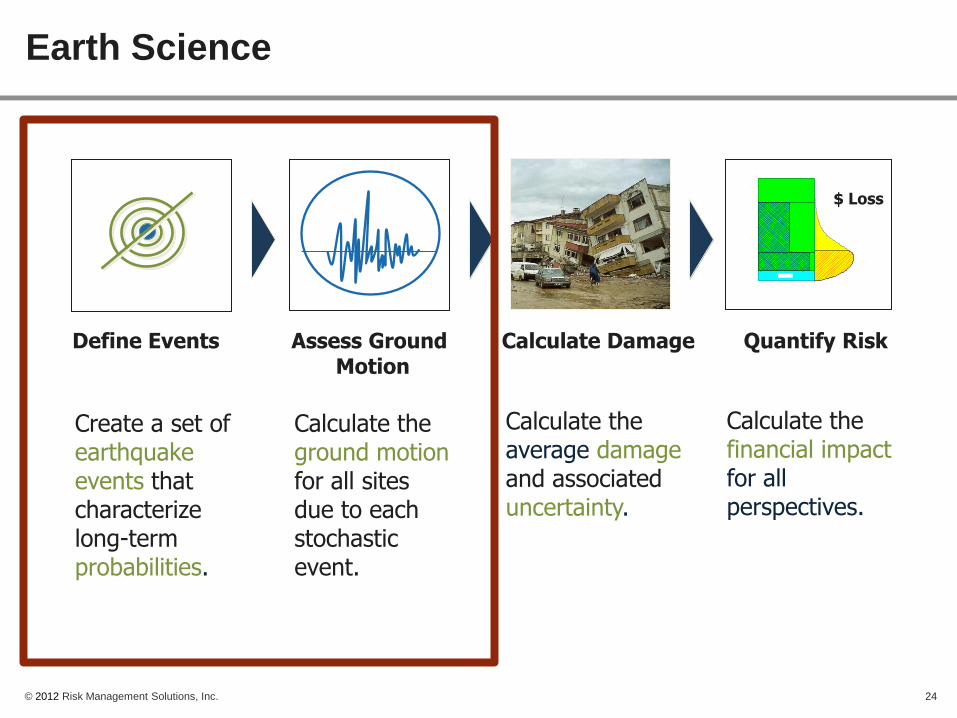
Earth Science
Define Events
90%$ Loss
Assess Ground Motion
Calculate Damage Quantify Risk
Create a set of earthquake events that characterize long-term probabilities.
Calculate the average damage and associated uncertainty.
Calculate the ground motion for all sites due to each stochastic event.
Calculate the financial impact for all perspectives.
24
© 2012 Risk Management Solutions, Inc. 25
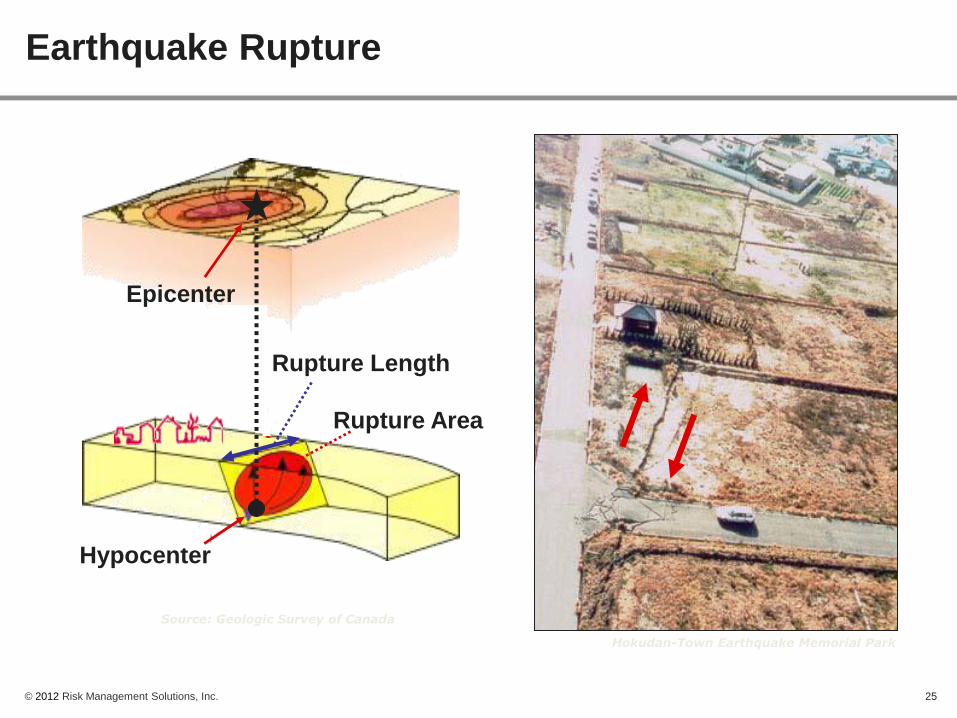
Earthquake Rupture
Hokudan-Town Earthquake Memorial Park
Source: Geologic Survey of Canada
Hypocenter
Epicenter
Rupture Area
Rupture Length
© 2012 Risk Management Solutions, Inc. 26
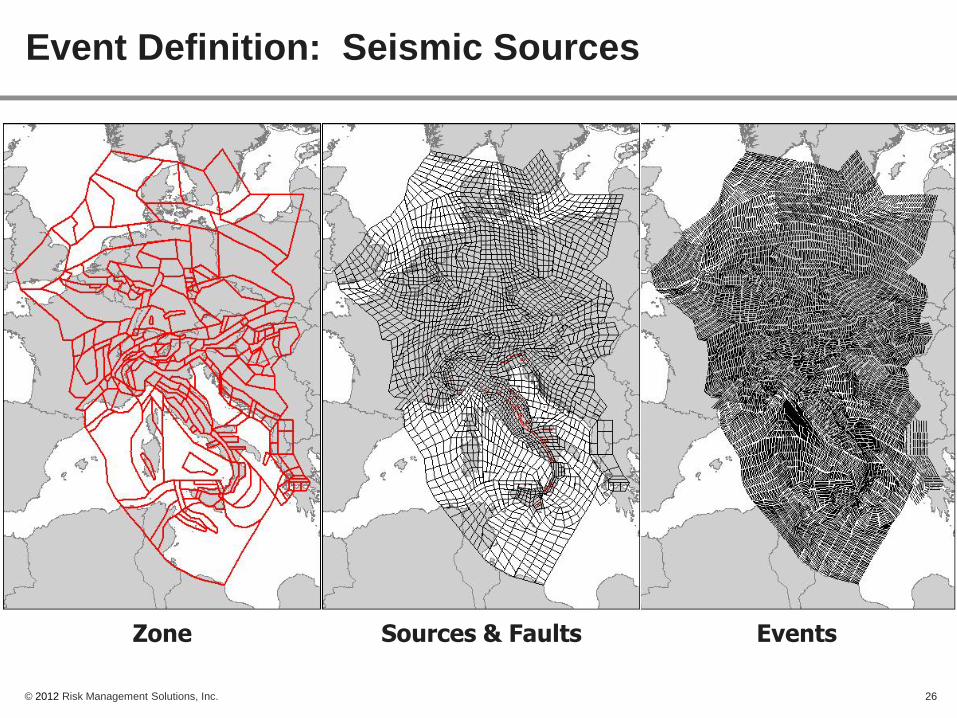
Event Definition: Seismic Sources
Zone Sources & Faults Events
© 2012 Risk Management Solutions, Inc. 27
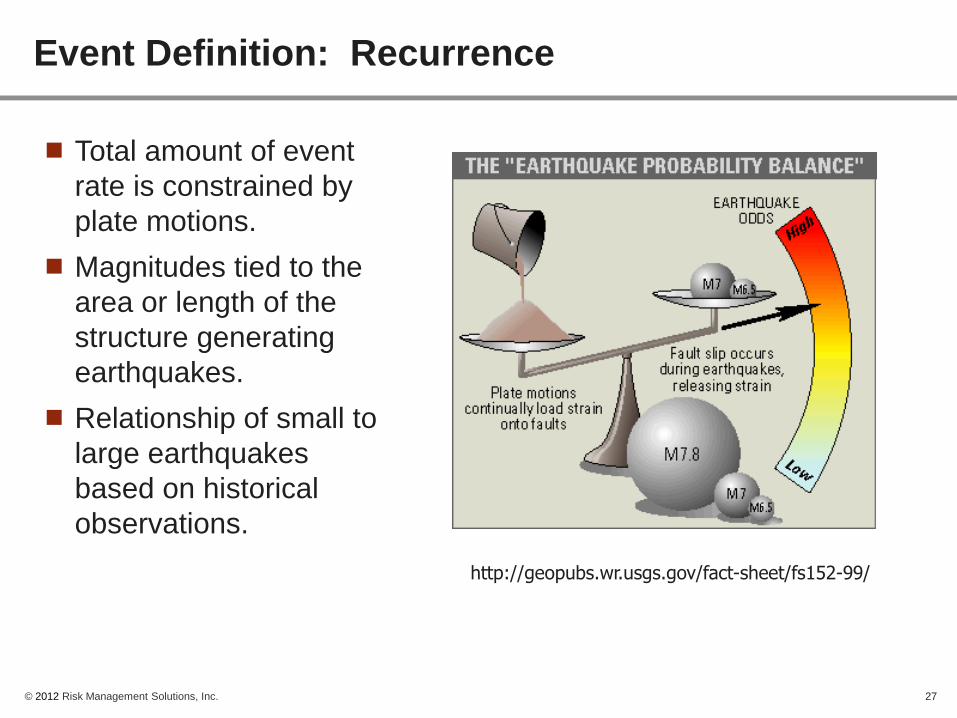
Event Definition: Recurrence
Total amount of event
rate is constrained by
plate motions.
Magnitudes tied to the
area or length of the
structure generating
earthquakes.
Relationship of small to
large earthquakes
based on historical
observations.
http://geopubs.wr.usgs.gov/fact-sheet/fs152-99/

© 2012 Risk Management Solutions, Inc. 28
Peak Ground Acceleration (PGA) Amplitude
Duration
Time
Ground Acceleration Time History
Ground Motion Assessment: Site Response
Key characteristics of earthquake ground motion records:
– Amplitude: How strong?
– Frequency: How periodic?
– Duration: How long?

© 2012 Risk Management Solutions, Inc. 29
Peril Anatomy: Earthquakes
Impacts on locations
Ground shake and
displacement damage buildings.
Tsunami inundation.
Landslides and liquefaction.
Damage to contents caused by
shaking and structural failure.
Sprinkler system failures
(leakage).
Fires following the earthquake.
Lifelines and business
interruption.

© 2012 Risk Management Solutions, Inc.
The March 11, 2011 Tohoku Earthquake Quest for “real-time” hazard maps
30

© 2012 Risk Management Solutions, Inc.
Tectonics and Event Details
31
~90 mm/yr
Pacific Plate Philippine Sea
Plate
Okhotsk Plate
March 11, 2011 MW = 9.0 4th largest ever recorded Rupture Area: 150 km x450 km Max Slip: ~60 meters Max Tsunami Runup: 35 meters How does an event this large and unprecedented affect all other faults around it?

© 2012 Risk Management Solutions, Inc.
Hazard Change Framework
32

© 2012 Risk Management Solutions, Inc.
Focus on Rate Changes
Define Events
90%$ Loss
Assess Ground Motion
Calculate Damage Quantify Risk
Create a set of earthquake events that characterize long-term probabilities.
Calculate the average damage and associated uncertainty.
Calculate the ground motion for all sites due to each stochastic event.
Calculate the financial impact for all perspectives.
33
Earthquake: Mw 7.4 Izmit Turkey 1999
© 2012 Risk Management Solutions, Inc.
Show output (faults with colors)
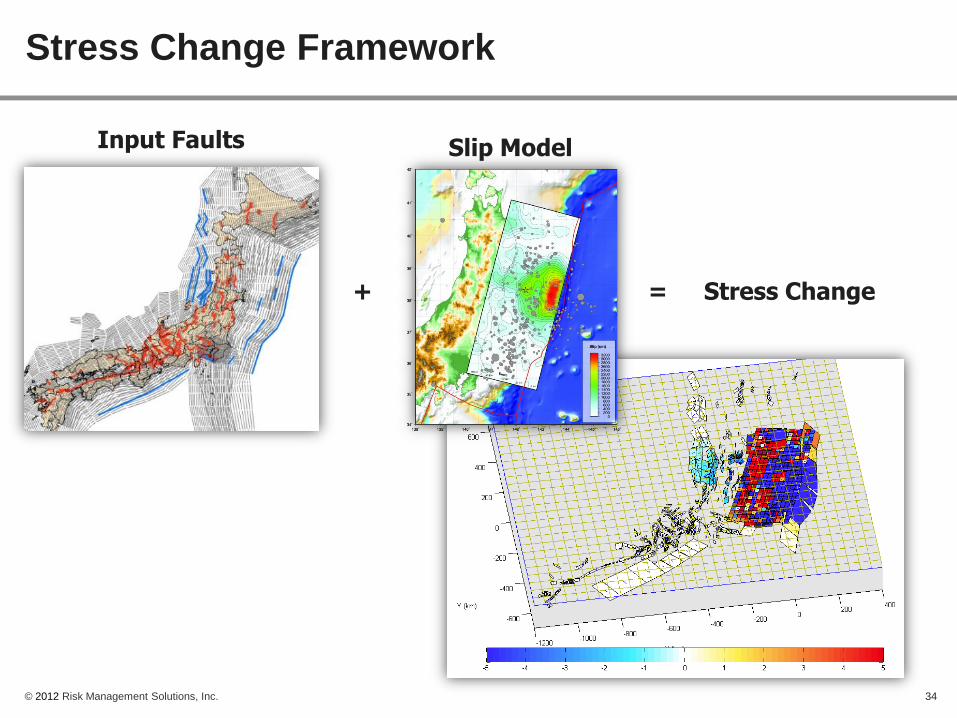
Stress Change Framework
34
Input Faults
+ =
Slip Model
Stress Change

© 2012 Risk Management Solutions, Inc.
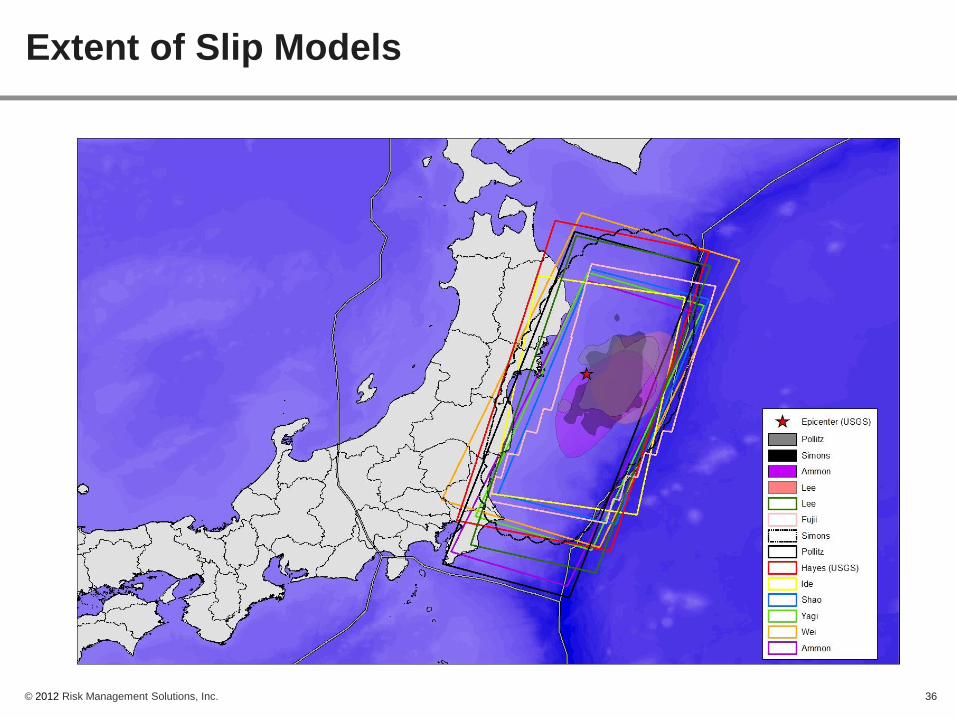
Multiple Slip Models
35
Last Seismic GPS Tsunami Moment
(Nm) Magnitude
(MW) Min Depth
(km) Max Depth
(km) Max Slip
(m) Strike Dip Rake
Simons X X X 3.63E+22 9.0 7.2 75.3 59.8 VAR VAR VAR
Ammon X X No 3.90E+22 9.0 1.0 41.5 41.0 202 12 85
*Wei X X No 4.37E+22 9.0 5.4 47.6 30.0 201 14 VAR
Lee X X No 3.67E+22 9.0 4.7 57.9 56.1 195 14 VAR
Shao X No No 5.80E+22 9.1 7.5 42.0 59.8 199 10 VAR
Ide X No No 4.50E+22 9.0 0.0 42.3 23.8 190 10 90
Hayes X No No 4.90E+22 9.1 7.5 52.5 33.4 195 10 VAR
Yagi X No No 5.70E+22 9.1 5.3 46.9 51.2 200 12 85
Pollitz No X No 3.59E+22 9.0 3.0 57.0 38.0 195 VAR 90
Fujii No No X 3.80E+22 9.0 0.0 48.4 47.9 193 14 81
Fujii No No X 3.80E+22 9.0 0.0 48.4 37.8 193 14 81
*Toda Used Wei et al., 2011 slip model Stress changes reported and published directly
*ERC Stress changes measured from GPS Stress changes reported and published directly
© 2012 Risk Management Solutions, Inc.
Extent of Slip Models
36
© 2012 Risk Management Solutions, Inc.
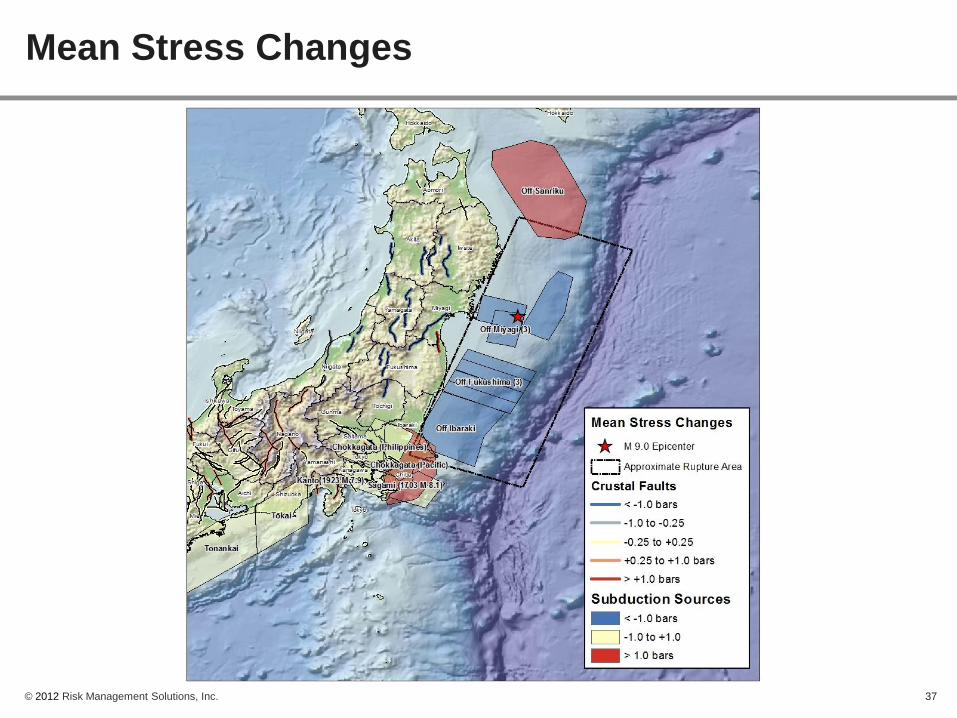
Mean Stress Changes
37
© 2012 Risk Management Solutions, Inc.
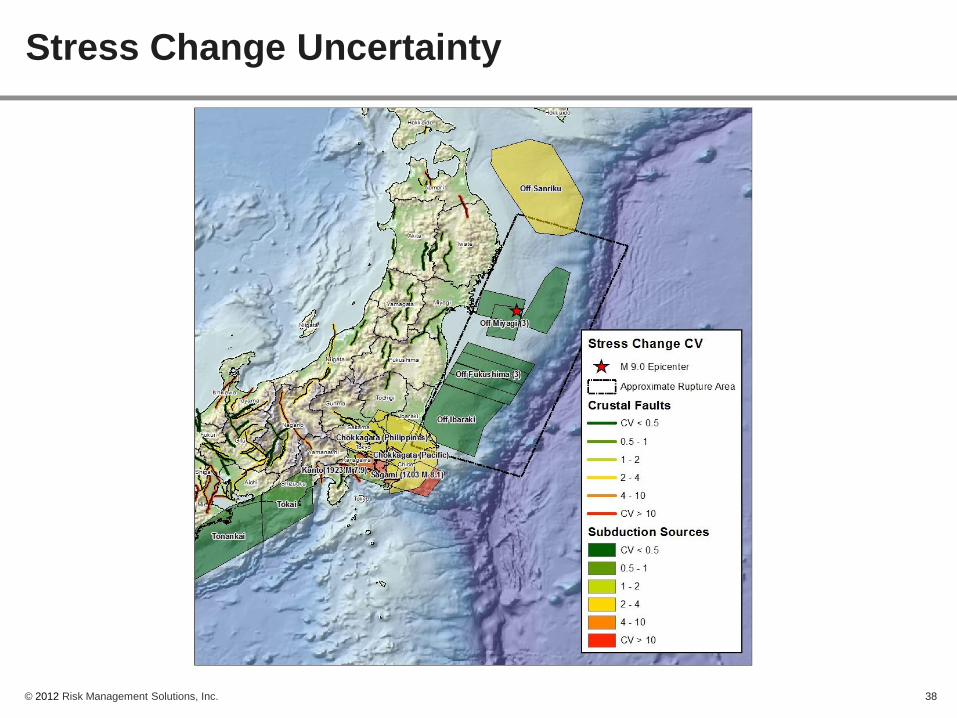
Stress Change Uncertainty
38
© 2012 Risk Management Solutions, Inc.
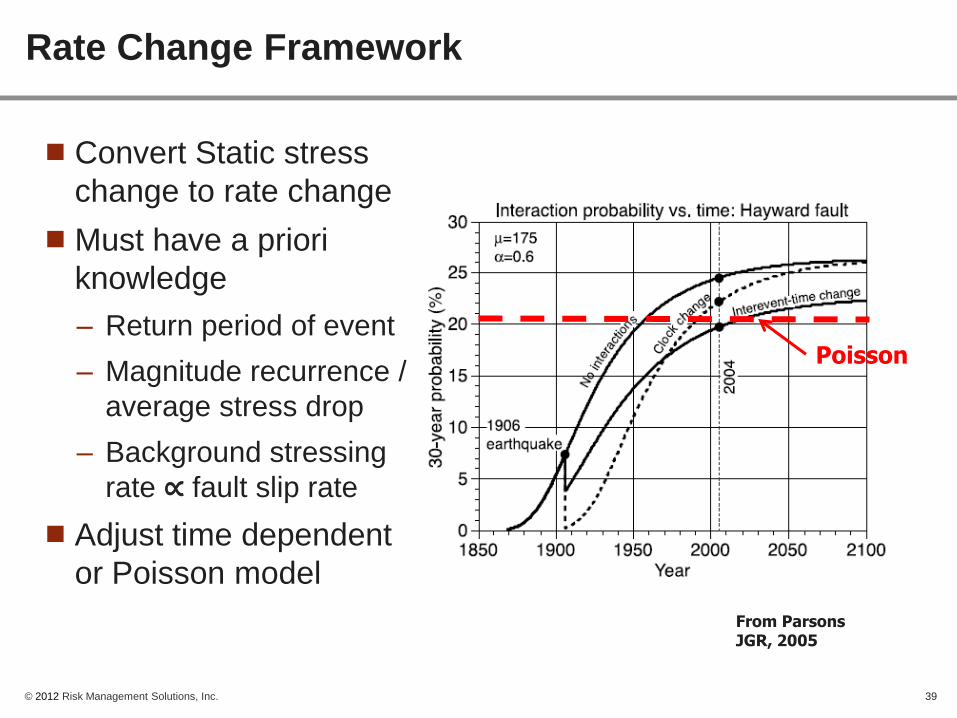
Convert Static stress
change to rate change
Must have a priori
knowledge
– Return period of event
– Magnitude recurrence /
average stress drop
– Background stressing
rate ∝ fault slip rate
Adjust time dependent
or Poisson model
Rate Change Framework
39
From Parsons JGR, 2005
Poisson
© 2012 Risk Management Solutions, Inc.
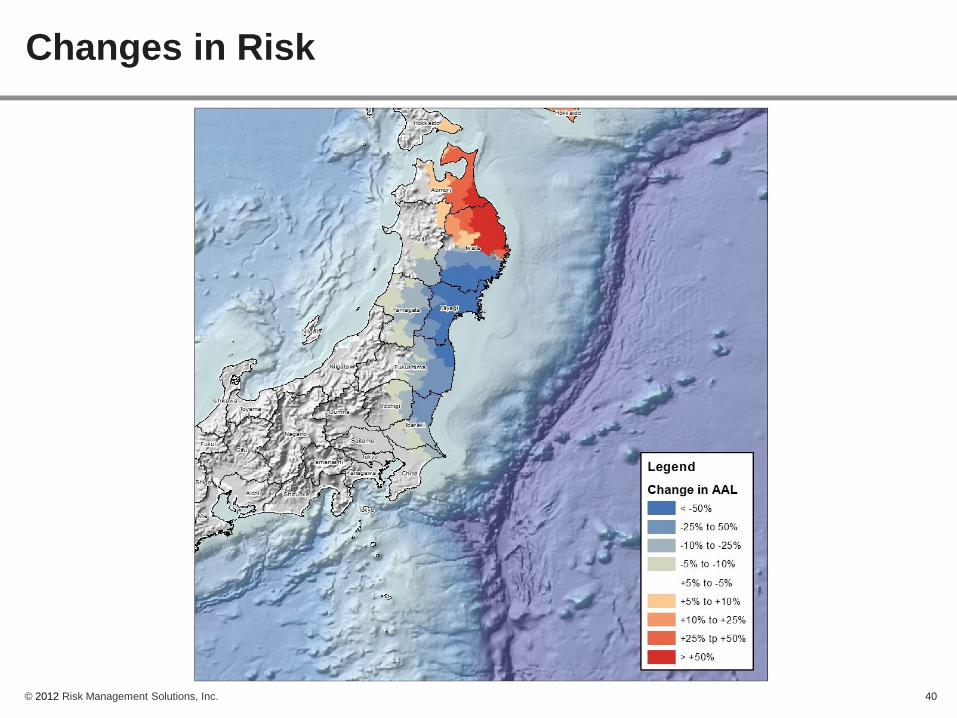
Changes in Risk
40
© 2012 Risk Management Solutions, Inc.
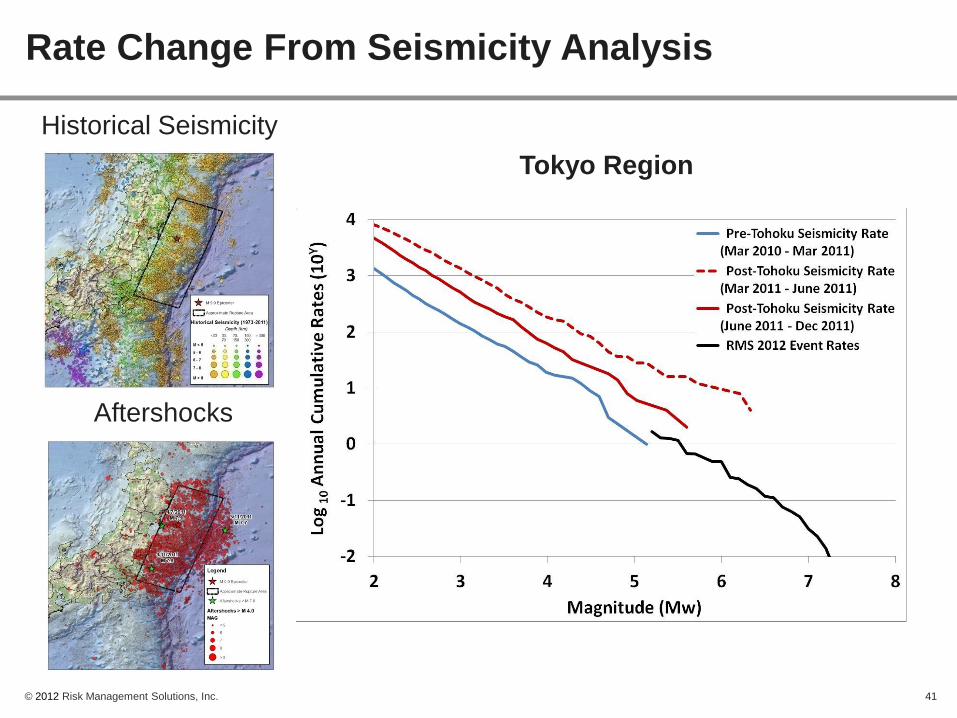
Rate Change From Seismicity Analysis
41
Historical Seismicity
Aftershocks
Tokyo Region

© 2012 Risk Management Solutions, Inc.
Changes in Risk – Incomplete?
42
?
Rate Changes From:
Static Stress Changes
Seismicity Rate Changes
= +
FAULT SLIP RATE VARIABILITY AND
CONSEQUENCES FOR SEISMIC HAZARD AND SEISMIC RISK IN
JAPAN RESULTING FROM STATIC STRESS CHANGES
FOLLOWING THE M9.0 TOHOKU EARTHQUAKE
Edwin Apel
Uncertainty in the Estimation of Earthquake Hazard
Thursday, April 19th 11:30 AM Oral Pacific Salon 3

© 2012 Risk Management Solutions, Inc.
And now for something completely different
The Quest for employment…
…or things I wish someone had told me.
43

© 2012 Risk Management Solutions, Inc.
…just maybe not the one you want…
www.getgeologyjobs.com
LinkedIn – Join groups look for job postings
Check career postings of companies you want to work for
Talk to people that are already employed
What’s the catch?
You may have to relocate
The job might not be your dream (or preferred) job
You‟ll have to take less than you think you‟re worth
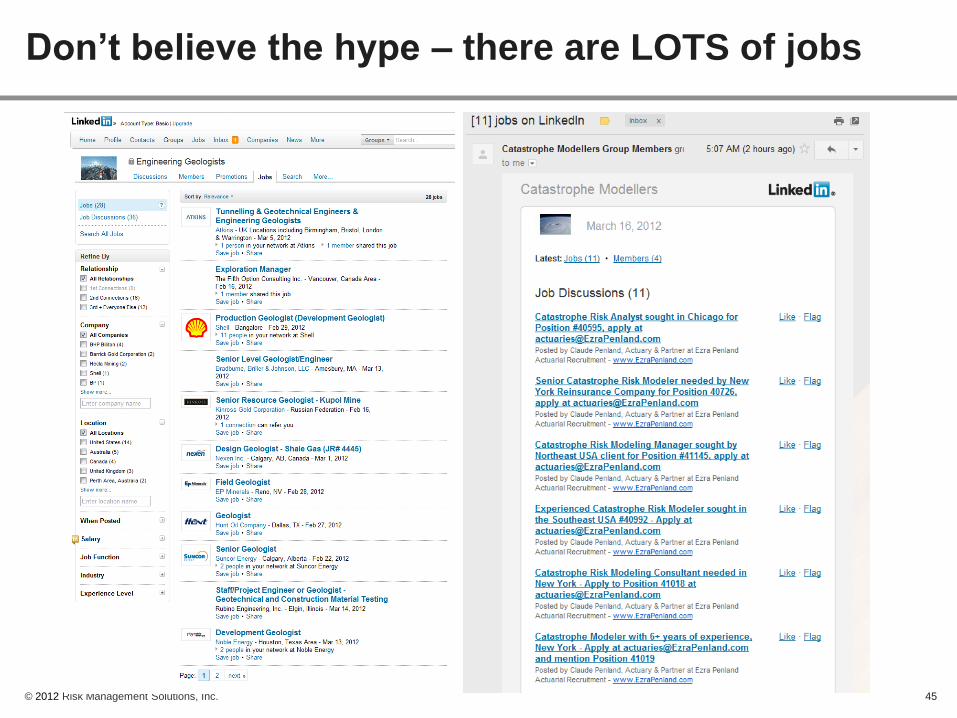
Don’t believe the hype – there are LOTS of jobs
44
© 2012 Risk Management Solutions, Inc.
Don’t believe the hype – there are LOTS of jobs
45

© 2012 Risk Management Solutions, Inc.
Getting a job with only a BS is hard
– BS is like a cell phone, everyone has one
– But a geology degree is like an iPhone
Without advanced degrees you will hit a career ceiling within ~5 years
MS and PhD show specific focus and direction
– Most research Earth Science programs are funded
Don‟t get an advanced degree from the same place as your undergraduate
Pick a graduate program with an end goal in mind
– Graduate school is temporary, think past it
– Does the program help you get you where you want to be
So just “No” and stay in school
46
© 2012 Risk Management Solutions, Inc.
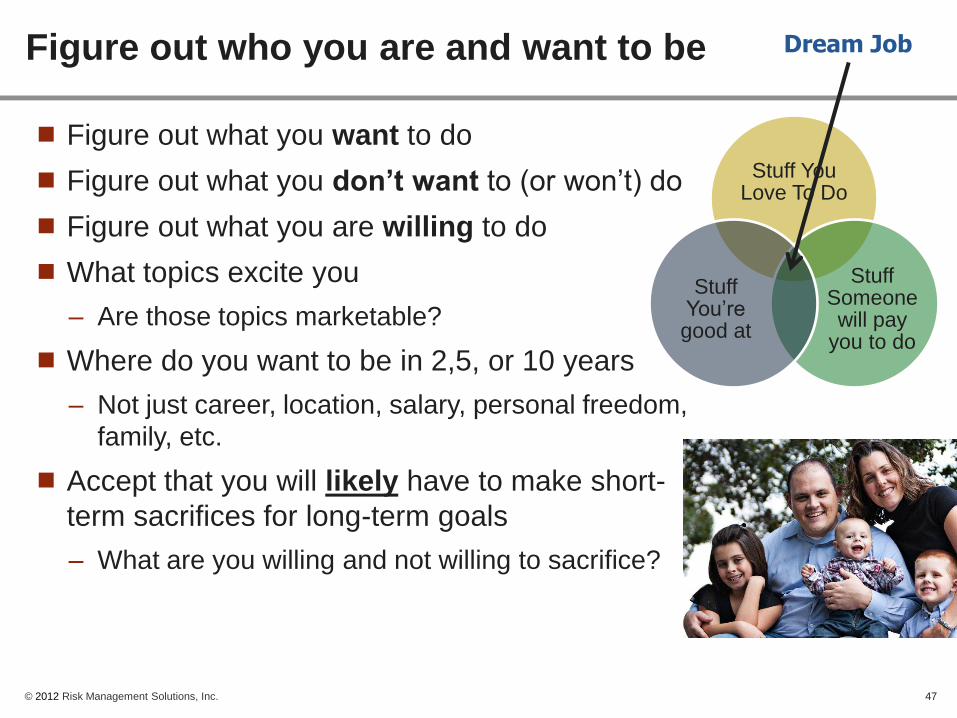
Stuff You Love To Do
Stuff Someone will pay
you to do
Stuff You‟re good at
Figure out what you want to do
Figure out what you don’t want to (or won‟t) do
Figure out what you are willing to do
What topics excite you
– Are those topics marketable?
Where do you want to be in 2,5, or 10 years
– Not just career, location, salary, personal freedom,
family, etc.
Accept that you will likely have to make short-
term sacrifices for long-term goals
– What are you willing and not willing to sacrifice?
Figure out who you are and want to be
47
Dream Job
© 2012 Risk Management Solutions, Inc.
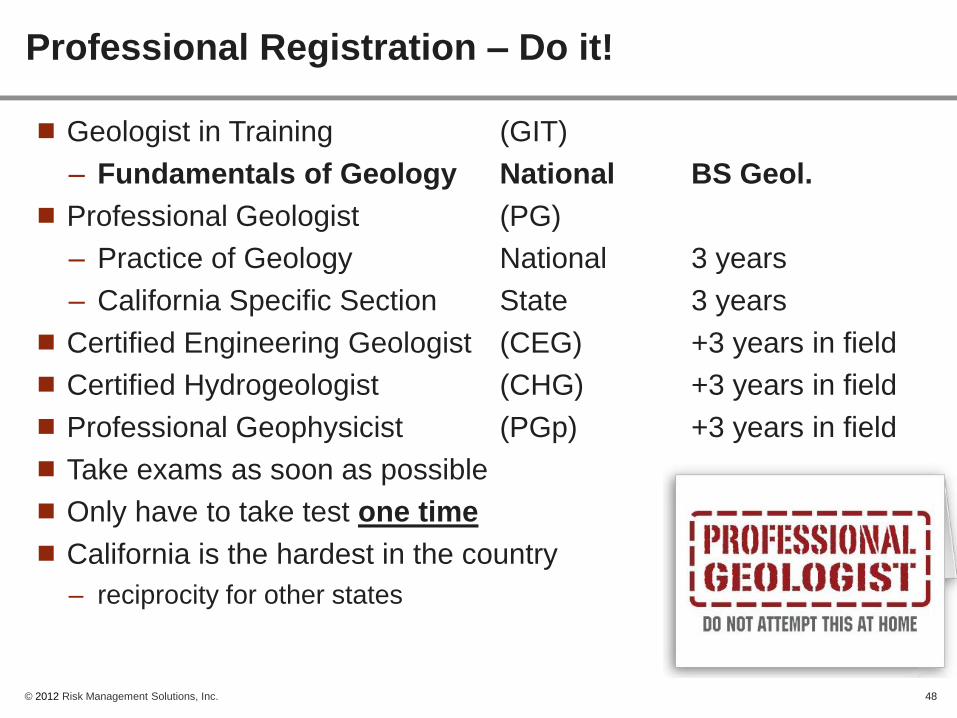
Geologist in Training (GIT)
– Fundamentals of Geology National BS Geol.
Professional Geologist (PG)
– Practice of Geology National 3 years
– California Specific Section State 3 years
Certified Engineering Geologist (CEG) +3 years in field
Certified Hydrogeologist (CHG) +3 years in field
Professional Geophysicist (PGp) +3 years in field
Take exams as soon as possible
Only have to take test one time
California is the hardest in the country
– reciprocity for other states
Professional Registration – Do it!
48

© 2012 Risk Management Solutions, Inc.
Make a Master resume and cover letter with everything on it
– Do NOT create a general resume
– Tailor specific pieces for each application you submit
– Restate parts of the job description in the resume and cover letter
Avoid complete sentences and repetition of words
Try to submit only one page resumes
Make PDFs not word documents
Create a text only version for online submission
Avoid “obnoxious flash”, be careful with graphics
Write a good cover letter
Edit, edit, edit!
Resumes and Cover Letters
49
© 2012 Risk Management Solutions, Inc.
Google yourself (every job you apply for will)
Clean up or make your online profile private
Update your LinkedIn profile make it clean and professional
Don‟t submit and forget, Be proactive!
Network, Network, Network
– 80% of employed people have a job because of who they know
– Alumni
– Meetings, ask people to introduce you
– Friends of friends
Visit companies
Take internships or other unpaid jobs
Getting in the door
50
© 2012 Risk Management Solutions, Inc.
Follow all instructions
Prepare for an interview like you would a test
Don‟t lie about anything
Be organized, prepared, and interested
– Ask questions about the company and people
Pester professionally, stay proactive
Make yourself memorable
– Website, business card, usual hobby
Make it easy to hire you
– Relocateable? YES!
– Ok working weekends? YES!
Getting the job
51
© 2012 Risk Management Solutions, Inc.
Questions?
52