Embed Size (px)
Citation preview

What is Hot and Cold in Cardiac Resuscitation in 2015?
Graham Nichol MD MPH FRCP© Leonard A Cobb Medic One Foundation Endowed
Chair in Prehospital Emergency Care Professor and Director, University of Washington-
Harborview Center for Prehospital Emergency Care University of Washington, Seattle, WA

Nichol Disclosures • Financial Disclosure - Velomedix Inc., Menlo Park, CA. Velocity Pilot Study of Ultrafast
Hypothermia in Patients with ST-Elevation Myocardial Infarction, National Co-PI. *Waived personal compensation.
- NHLBI, Bethesda, MD. Randomized trial of chilled intravenous fluid in field after resuscitation from cardiac arrest. Co-I.
- NHLBI, Bethesda, MD. Resuscitation Outcomes Consortium Coordinating Center. Co-PI.
- Food and Drug Administration, Silver Spring, MD; Cardiac Science Corp, Waukesha, WI; Heartsine Technologies Inc., Newtown, PA; Philips Healthcare Inc., Bothell, WA; Physio-Control Inc., Redmond, WA; ZOLL Inc., Chelmsford, MA. Dynamic AED Registry, PI.
- Travel reimbursement, Abiomed Inc., Danvers, MA.

ILCOR Consensus on Science and AHA Guidelines
• Ongoing international collaboration. • Systematic evaluation of published evidence
to achieve consensus on resuscitation science.
• Rigorous conflict of interest management. • Simultaneous national or regional CPR and
emergency cardiovascular care treatment recommendations.
• ~5 year cycle up to 2015. • Plan to change to continuous review in 2016.

GRADE www.gradeworkinggroup.org
• Common, sensible and transparent approach to grading quality of evidence and strength of recommendations: – Identify question; – Search published literature systematically; – Apply clear inclusion, exclusion criteria; – Identify outcomes of interest; – Assess risk of bias; – Consensus on science and treatment
recommendation.

GRADE Applied to Emergency Cardiac Care
Levels of Evidence Large Randomized Trial Small Randomized Trial
Prospective cohort Case Series
Animal or Mannikin Study

Potential Bias in Randomized Trials
Limitation Example Lack of allocation concealment
Randomization by odd vs. even day
(Bernard N Engl J Med 2002) Lack of blinding ITD + ACD-CPR vs. manual CPR
(Aufderheide Lancet 2011) Incomplete accounting of patients,
outcomes Randomized in field; report survival
from admission to discharge (Castren Circulation 2010)
Selective reporting of outcome Stopping early for benefit
Unvalidated outcome Carryover effect in cluster trial Hostler BMJ 2011

Potential Bias in Observational Studies Limitation Example
Lack of appropriate eligibility criteria
Under or overmatching in case-control Selection of exposed and unexposed
from different cohorts e.g. comparison of PCI after OHCA vs. STEMI
Differential measurement of exposure and outcome
Recall bias in case-control Differential surveillance for outcome in
expose vs. unexposed Confounding Failure to measure or adjust for all
known prognostic factors Hagihara JAMA 2012
Incomplete follow up Nichol Forthcoming 2015

Timeline
• Over 150 reviews completed • Consensus conference Jan 2015 • Public comment Feb 2015 • Planned publication Nov 2015 • Embargoed

Analyze Early versus Analyze Later Stiell and ROC Investigators NEJM 2011

No Difference in Outcomes Stiell and ROC Investigators NEJM 2011
Outcome Measure (%)
Analyze Early
Analyze Later
Difference (%) (95% CI) *
P-value
Transported to ED
53.2 53.2 0.0 (-2.7, 2.7) 1.00
Pulse on arrival ED
25.6 26.3 0.7 (-1.0, 2.4) 0.43
Admitted to hospital
24.7 24.4 -0.2 (-1.6, 1.1) 0.73
Survival to discharge
8.1 8.0 -0.1 (-1.2, 1.1) 0.92
Discharge with MRS < 3
5.9 5.9 -0.2 (-1.1, 0.7) 0.59
* cluster adjusted difference

Duration of Compressions Before Rhythm Analysis Associated with
Survival to Discharge Bradley and ROC Investigators
Resuscitation 2010 S
urvi
val t
o D
isch
arge
(%)

Use 2 min. epochs of CPR

Greater Compression Depth Associated with Greater Survival
Stiell and ROC Investigators Crit Care Med 2012
Surv
ival
to O
ne D
ay (%
)

Chest Compression Rates Associated with Greater Probability of
Return of Spontaneous Circulation Idris and ROC Investigators Circulation 2012

Compression Rate Not Independently Associated with Survival to Discharge
Idris and ROC Investigators Critical Care Med 2015
ROSC Survival to Discharge
OR (95% CI) P Value OR (95% CI) P Value
< 80 comp./min., n=382
1.10 (0.86, 1.40)
0.45 1.31 (0.86, 2.0)
0.22
80 to 99 comp./min., n=2,447
1.03 (0.92, 1.16)
0.56 0.87 (0.71, 1.06)
0.17
100 to 119 comp./min., n=4,762
Reference Group Reference Group
120 to 139 comp./min., n=2,191
1.02 (0.91, 1.15)
0.71 0.89 (0.72, 1.09)
0.26
> 140 comp./min., n=381
0.99 (0.81, 1.21)
0.93 0.79 (0.54, 1.14)
0.20
Global test 0.93
Global test 0.19 Adjusted for age, gender, witnessed status, public location, bystander CPR, initial cardiac rhythm, and site

Compression Rate Association with Survival to Discharge Modified by Depth
Idris and ROC Investigators Critical Care Med 2015 ROSC Survival to Discharge
Adjusted OR (95% CI)
P Value Adjusted OR (95% CI)
P Value
< 80 comp./min., n=335
0.97 (0.74, 1.27)
0.81 0.89 (0.53, 1.5)
0.66
80 to 99 comp./min., n=1,993
0.99 (0.86, 1.13)
0.84 0.73 (0.57, 0.93)
0.01
100 to 119 comp./min., n=2,932
Reference Group Reference Group
120 to 139 comp./min., n=955
0.98 (0.82, 1.16)
0.78 0.63 (0.45, 0.88)
0.007
> 140 comp./min., n=244
1.08 (0.79, 1.47)
0.64 0.95 (0.95, 1.7)
0.86
Global test 0.98
Global test 0.02
Adjusted for age, gender, witnessed status, public location, bystander CPR initial cardiac rhythm, chest compression depth and compression fraction, site

Compression Depth Independently Associated with Survival to Discharge
Stiell and ROC Investigators Circulation 2014
ROSC Survival to Discharge
Adjusted OR (95% CI)
P Value Adjusted OR (95% CI)
P Value
Compression Depth, per 5 mm
1.06 (1.04, 1.08)
<0.001 1.04 (1.0, 1.08)
0.045
Compression Depth Category, mm
< 38 0.70 (0.60, 0.80)
0.69 (0.53, 0.9)
38 to 51
0.86 (0.75, 0.97)
<0.001 1.03 (0.82, 1.31)
<0.001
> 51 Reference Group <0.001
Reference Group <0.001
Within Depth Range 1.27 (1.15, 1.4) <0.001 1.45 (1.20, 1.76) <0.001
Adjusted for age, gender, witnessed status, public location, bystander CPR, initial cardiac rhythm, chest compression rate and compression fraction, time from Call to EMS arrival on scene, device manufacturer and study site.
Perishock Pause Duration Independently Associated with Survival to Discharge Cheskes and ROC Investigators Resuscitation 2014
Unadjusted Odds Ratio (95% CI)
Adjusted Odds Ratio (95% CI)
Median preshock pause > 20 secs.
10 to 19.9 secs.
< 10 secs.
Reference
1.34 (1.09, 1.66)
1.73 (1.36, 2.19)
Reference
1.25 (0.95, 1.65)
1.52 (1.09, 2.11)
Median postshock pause > 10 secs.
5 to 9.9 secs.
< 5 secs.
Reference
1.09 (0.86, 1.37)
2.01 (1.58, 2.55)
Reference
1.02 (0.75, 1.38)
1.34 (0.94, 1.90)
Median perishock pause > 40 secs.
20 to 39.9 secs.
< 20 secs.
Reference
1.22 (0.88, 1.71)
2.17 (1.56, 3.02)
Reference
1.16 (0.76, 1.76)
1.82 (1.17, 2.85) Adjusted for compression rate, compression fraction, site, age, gender, location of arrest, witnessed status, bystander CPR status, response time interval.

Push hard and fast, and minimize interruptions

Mechanical CPR Not Better or Worse than Manual CPR by EMS Providers
Wik and CIRC Trial Investigators, Resuscitation 2014
Individual Randomized Trial Including Adults with OHCA
Autopulse, n=2394
Manual, n=2395
Adjusted OR for survival (95% CI)
Excluded Post Hoc, % 11 11
Adverse Events, % 12 11
Sustained ROSC, % 32 29 0.84 (0.73, 0.96)
Survived to Discharge, % 9 11 0.89 (0.72, 1.10)
Favorable Neuro Status, % 48 44 0.80 (0.47, 1.37)

Mechanical CPR Not Better or Worse than Manual CPR by EMS Providers
Ruberttson and LINC Trial Investigators, JAMA 2014
Individual Randomized Trial Including Adults with OHCA
LUCAS-2, n=1300
Manual, n=1293
Treatment Difference, % (95% CI)
Received LUCAS-2, % 94 96
Excluded Post Hoc, % 5 4
Adverse Events, % 0.5 0.2
Sustained ROSC, % 28 28 0.46 (−3.0 to 3.9) Survived to 4 h after 1st ROSC, % 24 24 −0.05 (−3.3 to 3.2) Survival to Discharge, % 9 9 −0.15 (−2.4 to 2.1) Excellent Neuro Status at Discharge, % 7 5 1.65 (−0.2 to 3.5)

Mechanical CPR Not Better or Worse than Manual CPR by EMS Providers
Perkins and PARAMEDIC Trial Collaborators, Lancet 2015
Pragmatic Cluster Randomized Trial With OHCA Grouped by EMS Vehicle
LUCAS-2, n=1682
Manual, n=2819
Adjusted OR for survival (95% CI)
Received LUCAS-2, % 60 < 1
Adverse events, % 0.7 0
ROSC, % 32 31 0.99 (0.86, 1.14)
Survived to 30 days, % 6 7 0.86 (0.64, 1.15)
Favorable neuro status, % 5 6 0.72 (0.52, 0.99)

Mechanical CPR device not better than manual CPR
in usual care setting; May have role during EMS
transport or bridge to cath lab.

Primary PCI Associated with Improved Outcome After OHCA
Regardless of Presence or Absence of ST Elevation
Dumas Circulation 2010

Emergency coronary angiography and primary PCI has evolving role in care of
patients resuscitated from OHCA

Instant Cooling Reduces Injury After Cardiac Arrest
Kuboyama et al, Critical Care Med 1993
• Dog model of normothermic ventricular fibrillation.
• No flow for 12.5 mins. • Reperfused using cardiopulmonary
bypass for 5 mins. • Defibrillated 3 mins. after start of
bypass. • 22 dogs randomized to:
• Control • Instant cooling with reperfusion to 34°C X 1 h • Cooling 15 mins after reperfusion to 34°C X 1 h
pP<=0.05
Moderate disability Severe disability Coma
Control Instant Delayed

Chilled Saline Fluid IV in Field Did Not Improve Status at Discharge
Kim et al, JAMA 2013

Hypothermia Improves Outcomes Among Those Hospitalized After Resuscitation
from Ventricular Fibrillation Bernard et al, N Engl J Med 2002
Normothermia N=34
Hypothermia N=43
Adjusted Odds Ratio (95% CI)
P value
Normal or minimal disability
26% 49% 5.3 (1.5, 18.8) 0.046
Survival 32% 49% NR 0.15
• Randomly allocated by odd-even day to treatment with hypothermia or normothermia.
• Core temperature to be reduced to 33°C within 2 hours after ROSC by applying cooling packs to head and torso.
• IH to be maintained at that temperature for 12 hours. • Primary outcome survival to hospital discharge to home or to rehabilitation
facility. • Enrollment extended after achieved original sample size to achieve
statistical significance.

Hypothermia Improves Neurologic Outcomes Among Those Hospitalized
After Resuscitation from Ventricular Fibrillation
HACA Study Group, N Engl J Med 2002
Normothermia N=138
Hypothermia N=137
Risk Ratio (95% CI)
P value
Favorable neurological status
39% 55% 1.4 (1.08, 1.81) 0.009
Survival 45% 59% 1.35 (1.05, 1.72) 0.02
• Randomly allocated by envelope to hypothermia or normothermia. • Core temperature to be reduced to 32°C to 34°C within 4 hours by applying
cooling blanket. • IH to be maintained for 24 hours. • Primary outcome survival to hospital discharge with good neurologic
function. • Enrollment slow; study stopped because ran out of money rather than
achieved intended sample size.

Patients in Control Group of HACA Trial Were Febrile
HACA Study Group, N Engl J Med 2002

Large Randomized Trial of Targeted Temperature Management in Patients
Resuscitated from VF, PEA or Witnessed Asystole Nielsen et al, N Engl J Med 2013
• Randomly allocated to 33°C or 36°C for 24 h, started in hospital within 4 h of arrest.
• Surface or endovascular methods.
• Deferred prognosis assessment or withdrawal of care.

No Difference in Survival Between 33ºC Group and 36ºC Group
N Nielsen et al, N Engl J Med 2013

Patient Characteristics and Outcome Differ Between
TTM vs. ROC PRIMED Trials Nielsen and TTM Group
NEJM 2013 Callaway and ROC Investigators
Resuscitation 2014 33°C 36°C Pulses at ED arrival or regained in ED
had induced hypothermia n=473 n=466 n=4,468
Location of Arrest Residence 52 55 Public 42 40 27 Other 7 5
Bystander witnessed 89 90 69 Bystander CPR 73 73 49 First recorded rhythm Shockable 79 81 56
VF 74 77 Pulseless VT 3 3 Shockable by AED 1 1 Perfusing rhythm after bystander initiated defibrillation 2 1
Asystole 12 12 20 PEA 8 6 20 Unknown 2 1 0.1 Survival to Discharge 56 56 41
Patients enrolled in TTM not as sick as usual patient population resuscitated from OHCA; results of TTM may not be generalizable.
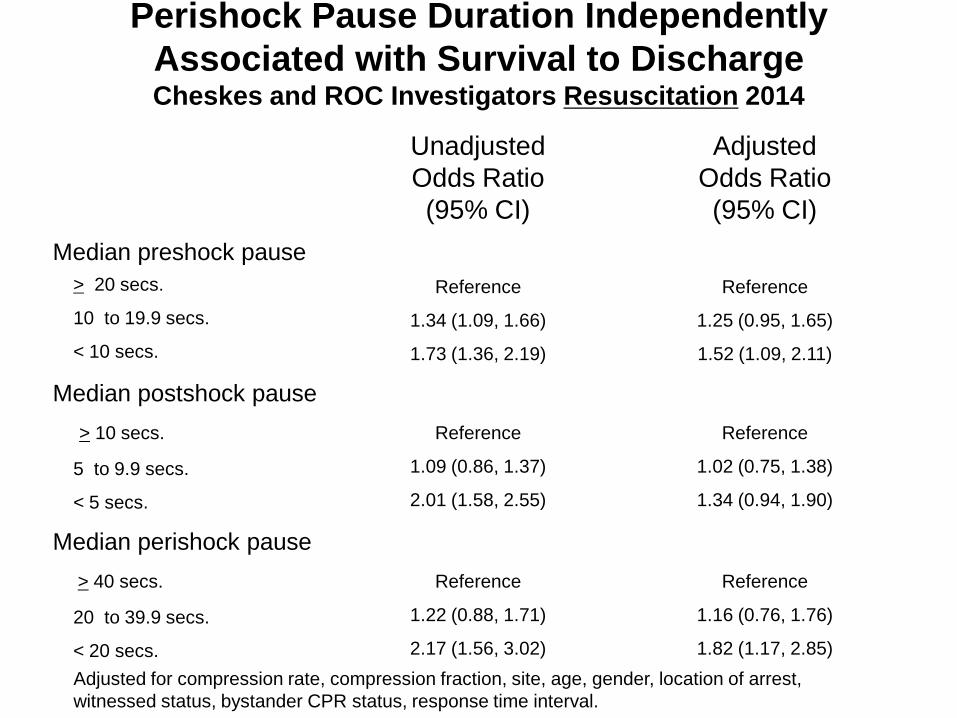
Time to Target vs. Outcome in Randomized Trials of Hypothermia in Adults, Resuscitated from
OHCA, Unconscious and Transported to Hospital
Population Treatment Group
Temperature Target, °C
Time from Onset of Arrest to
Target, mins. Survival
Bernard Out of Hospital VF
Control (n=34) n/a n/a 33
Intervention (n=43) 33°C ~270 49
HACA Witnessed Out-of-hospital VF or
pulseless VT
Control (n=138) n/a n/a 45
Intervention (n=137) 32-34°C ~500 59
Nielsen
Out of hospital VF, PEA or
witnessed PEA ) Intervention
(n=473)
Control (n=466)
36°C
n/a
50
Intervention (n=473)
33°C ~720 46

Propofol Decreases Cerebral Blood Flow Vandesteene Anaesthesia 1988
• Consenting females undergoing elective interverterbral disc surgery.
• Before-after study of anesthesia with: – Nitrous oxide 65% in oxygen
with enflurane 0.5% – Then propofol 21 mg/kg/h X 5
mins. then 12 mg/kg/h X 10 mins. then 6 mg/kg/h X 25 mins.
• CBF measured using inhaled radiolabelled gas.

Propofol Increases Myocardial Injury Yao Chin Med Sci J 2009
• 13 trials randomly allocated 696 patients undergoing coronary artery bypass grafting (~ischemia reperfusion injury) to propofol vs. sevoflurane.
• Sevoflurane group had significantly:
- Greater post-bypass cardiac index (WMD 0.39; 95% CI 0.18 to 0.60; p=0.0003); - Lower troponin index (WMD -0.82; 95% CI -0.87 to -0.85; p=0.0002); - Less myocardial ischemia (OR 0.37; 95% CI 0.16 to 0.83; p=0.02); and - Shorter hospital stay (WMD -0.78; 95% CI -1.00 to -0.56; p<0.0001).

Quality of Post-Resuscitation Care Including IH/TTM Independently Associated with Survival Among Patients Enrolled in ROC PRIMED Trial
Stub and ROC Investigators, Resuscitation, 2015
N=3,252 patients at 111 hospitals
IH/TTM initiated Target temperature 32°-34°C achieved IH/TTM continued for more than 12 hours
Coronary angiography within 24 hours Life sustaining treatment not withdrawn before day 3

Some Patients Take Long Time to Awaken After Resuscitation
Kim et al JAMA 2014

Induced hypothermia to achieve target temperature as
quickly as possible after patients resuscitated from
OOH VF arrive at hospital; may have role in patients with
OHCA associated with other rhythms; IHCA.

Should select concurrent medications carefully when
using IH/TTM; Defer prognosis to allow brain
adequate time to recover.