Embed Size (px)
Citation preview
January 21, 2008 What is happening to the impact of financial deepening
on economic growth?
Peter L. Rousseau Vanderbilt University
Department of Economics Box 1819 Station B, Nashville, TN 37235, USA
and National Bureau of Economic Research [email protected].
Paul Wachtel Stern School of Business
New York University 44 West 4th Street
New York, NY 10012 USA [email protected]
This paper is an extension of a paper prepared for the UNU / WIDER conference on Financial Sector Development for Growth and Poverty Reduction, July 1-2, 2005, Helsinki, Finland. See Economic Growth and Financial Depth: Is the Relationship Extinct Already? WIDER Discussion paper DP2005/10.

1
What is happening to the impact of financial deepening on economic growth?
By Peter L. Rousseau and Paul Wachtel
Although the finance-growth relationship is now firmly entrenched in the empirical
literature, we show that it is not as strong in more recent data as it was in the original
studies with data for the period from 1960 to 1989. We consider several explanations.
First, we find that the incidence of financial crises is related to the dampening of the
effect of financial deepening on growth. Excessive financial deepening or too rapid
growth of credit may have led to both inflation and weakened banking systems which in
turn gave rise to growth-inhibiting financial crises. Excessive financial deepening may
also be a result of widespread financial liberalizations in the late 1980s and early 1990s in
countries that lacked the legal or regulatory infrastructure to exploit financial
development successfully. However, we find little indication that liberalizations played
an important direct in reducing the effect of finance. Similarly, there is little evidence
that the growth of equity markets in recent years has substituted for debt financing and
led to a reduced role of financial deepening on growth.
Keywords: finance-growth nexus, rolling regression, robustness, cross-country growth
JEL Codes: E44, G10, O40
2
1. Introduction
Among the strongest elements of the modern economists’ canon is that financial
sector development has a significant impact on economic growth. A generation ago,
economists like Goldsmith (1969)1 and McKinnon (1973) began to draw attention to the
benefits of financial structure development and financial liberalization. In 1991 (p. 12)
McKinnon could write with confidence that:
“Now, however, there is widespread agreement that flows of saving and investment should be voluntary and significantly decentralized in an open capital market at close to equilibrium interest rates.”
Since the 1990s, a burgeoning empirical literature has illustrated the importance of
financial sector development for economic growth. Despite the growing consensus,
however, we find that the link between finance and growth in cross-country panel data
has weakened considerably over time. At the very time that financial sector liberalization
spread around the world, the influence of financial sector development on economic
growth has diminished.
The seminal empirical work that established the growth-finance link is King and
Levine (1993), which extended the cross-country framework introduced in Barro (1991)
by adding financial variables such as the ratios of liquid liabilities or claims on the
private sector to gross domestic product (GDP) to the standard growth regression. They
found a robust, positive, and statistically significant relationship between initial financial
conditions and subsequent growth in real per capita incomes for a cross-section of about
80 countries. In the subsequent decade numerous empirical studies expanded upon this,
using both cross-country and panel data sets for the post-1960 period.2
In this paper we reexamine the core cross-country panel result and find that the
impact of financial deepening on growth is not as strong with more recent data as it
appeared in the original panel studies with data for the period from 1960 to 1989. We
1 Goldsmith, for example, found a positive relationship between economic growth and financial development using a comparative approach with data for thirty-five countries over the period from 1860 to 1963. 2 Levine (1997) surveys the literature through the mid-1990s, and Levine (2005) offers a comprehensive treatment of the many contributions that have followed. See also Temple (1999).

3
consider various explanations for this clear shift. First, we suggest that financial
deepening has a positive effect on growth if not done to excess. Rapid and excessive
deepening, as manifested in a credit boom, can be problematic even in the most
developed markets because it can both weaken the banking system and bring inflationary
pressures. We test this hypothesis by looking at the finance-growth nexus among
countries that have or have not experienced financial sector crises. We find that once
crisis episodes are removed, the finance-growth relationship remains intact. Its
weakening over time thus seems to be a result of an increased incidence of crises in later
years.
Our second and related hypothesis is that the widespread liberalization of financial
markets that occurred in the late 1980s and early 1990s made financial deepening less
effective. This is reminiscent of Robert Lucas’s (1975) critique of econometric policy
evaluation advanced three decades ago. Policies that have promoted and/or forced
increases in financial depth over the past two decades may have altered the basic
structural relationship between finance and growth. This could occur if the observed
benefits of financial deepening led many countries to liberalize before the associated
legal and regulatory institutions were sufficiently well developed. As a consequence, the
impact of financial deepening on growth would become smaller. Our evidence does not
indicate that recent liberalizations are responsible for the breakdown of the finance-
growth link. However, there may be an indirect link since premature financial
development can lead to financial crises that have real effects.
Third, we examine the role of global equity markets that have grown in importance
and prominence in the years over which the finance-growth relationship disappeared.
However, we do not find any evidence to suggest that equity market growth has
substituted for the role of credit markets and banks in particular.
We also examine some sample composition effects. For example, we distinguish
between developed and developing countries. Although the finance growth relationship
is somewhat stronger among developed countries, the decline in the impact of finance on
growth in recent years is found in both groups.
Further we look at several estimation techniques in order to be confident of the
robustness of our major finding, the virtual disappearance of the finance-growth
4
relationship in recent data. The finance-growth literature uses various estimation
approaches because of the difficulty in adequately controlling for endogeneity. We
examine pure cross-section estimates, panels of five-year average growth rates, and
dynamic panels in order to show that our basic result is robust to choice of estimation
technique.
Although the finance-growth nexus has become firmly entrenched, this is not the first
study to question its importance. Economists as disparate as Joan Robinson and Robert
Lucas have expressed doubts about the link.3 In addition, some authors have been less
than enthusiastic about the strength of the recently established empirical consensus and
there are indications that the relationship varies and lacks robustness.4
A few earlier papers have noted that the relationship between financial deepening and
growth varies considerably across countries (e.g. Demetriades and Hussein 1996;
Rousseau and Wachtel 1998; Arestis, Demetriades, and Luintel 2001). Rousseau and
Wachtel (2002) show that the relationship varies with the inflation rate; financial
deepening does not affect growth when annual inflation is above a threshold of about 13
percent. Rioja and Valev (2004) also show that the relationship varies with the level of
economic development. Specifically, deepening has a larger impact on growth with a
moderate level of financial sector development. However, none of the earlier studies has
provided an explanation for why the relationship has weakened over time.
A recent paper by Loayza and Ranciere (2006) addresses the dual role of financial
deepening discussed above. They distinguish between the short run impact of credit
expansions on growth and the long run positive impact of financial deepening on growth.
The short run effect is sometimes negative, particularly during episodes of financial
crisis. Our approach to this dual role of finance is somewhat different. First, we
investigate how banking crises and liberalizations affect the impact of financial
deepening on growth. Second, we relate these phenomena to the secular decline in the
3 Lucas (1988) suggests that the role of finance is “over-stressed” and Robinson (1952, p. 80) asserts that “where enterprise leads, finance follows.” 4 The titles of some recent papers express the growing skepticism: e.g. “How much do we really know about growth and finance?” Wachtel (2003) and “Finance causes growth: Can we be so sure?” Manning (2003).

5
impact of financial deepening observed in the classical cross-country panel regression
framework.
The next section describes the data and the by now standard approach to panel
estimates of growth equations. In Section 3 we present baseline estimates and show that
the finance-growth nexus has weakened over time. In Section 4 we examine the
hypotheses suggested above regarding the possible causes of the decline in the effect of
financial deepening on growth. Section 5 presents some additional evidence on the
relationship between the strength of the finance-growth link and the levels of economic
development and financial depth in a country. Our conclusions are in Section 6.
2. Data and methodology
Our study includes cross sectional and panel data on financial and macroeconomic
indicators for 84 countries over the period from 1960 to 2004.5 Data are from the 2007
edition of the World Bank’s World Development Indicators database. The selection of
countries is based on data availability from this source. To ensure comparability with
King and Levine’s original study and others, we use three familiar measures of financial
development, namely the ratios to GDP of liquid liabilities (M3), liquid liabilities less
narrow money (M3 less M1), and credit allocated to the private sector. M3 as a percent
of GDP has become a standard measure of financial depth and an indicator of the overall
size of financial intermediary activity in cross-country studies. M3 less M1 removes the
pure transactions asset and the credit measure isolates intermediation to the private sector
from credit allocated to government or state enterprises.
5 The 84 countries are Algeria, Argentina, Australia, Austria, Bangladesh, Barbados, Belgium, Bolivia, Brazil, Cameroon, Canada, Central African Republic, Chile, Colombia, Costa Rica, Cote d’Ivoire, Denmark, Dominican Republic, Ecuador, Egypt, El Salvador, Fiji, Finland, France, Gambia, Ghana, Greece, Guatemala, Guyana, Haiti, Honduras, Iceland, India, Indonesia, Iran, Ireland, Israel, Italy, Jamaica, Japan, Jordan, Kenya, Republic of Korea, Lesotho, Luxembourg, Malawi, Malaysia, Malta, Mauritius, Mexico, Morocco, Nepal, Netherlands, New Zealand, Nicaragua, Niger, Nigeria, Norway, Pakistan, Panama, Papua New Guinea, Paraguay, Peru, Philippines, Portugal, Rwanda, Senegal, Sierra Leone, South Africa, Spain, Sri Lanka, Sudan, Sweden, Switzerland, Syrian Arab Republic, Thailand, Trinidad and Tobago, Togo, Turkey, United Kingdom, United States, Uruguay, Venezuela, and Zimbabwe.

6
King and Levine’s version of the Barro growth regression, and the starting point for
our analysis, has the form
Yit = α0 + αFit + βX it + uit, (1)
where Yit is the growth rate of real per capita GDP, Fit is a measure of financial sector
development, and Xit is a set of baseline explanatory variables that have been shown
empirically to be robust determinants of growth. The X variables include the log of initial
real per capita GDP, which should capture the tendency for growth rates to converge
across countries and over time, and the log of the initial secondary school enrollment rate,
which should reflect the extent of investment in human capital. We include the ratio of
trade (i.e., imports plus exports) to GDP and the ratio of government final consumption to
GDP as additional explanatory variables.
Following King and Levine, we start with cross sectional estimates where the
dependent variable is the average annual growth rate over our entire data period (i.e.,
1960-2004). To reduce any simultaneity bias that might result from the influence of
economic growth on the development of the financial sector, we use initial values from
the start of the cross section for all explanatory variables in the regression. Following the
subsequent literature, we also exploit the time series variation in the data by estimating
equation (1) with a panel of 5-year averages. In these regressions we use instrumental
variables to reduce any simultaneity bias. Specifically, we attempt to extract the
predetermined component of the financial variable by using its initial value (in each 5-
year average) along with the initial values of government expenditure and trade as
percentages of GDP as instruments in each regression equation. All panel estimates
include time period fixed effects. Finally, we will also present estimates with system
GMM dynamic panel estimation techniques that have become common in the literature.6
Our fundamental result, that the finance growth relationship weakened dramatically, is
robust to the choice of estimation approach.
6 Our use of the “System GMM” estimator parallels that introduced to the finance-growth literature by Levine, Loayza, and Beck (2000). We complement this with a small sample correction of the standard errors as described in Windmeijer (2005).

7
3. The decline in the finance-growth relationship
Table 1 contains results from the baseline cross section growth equations for each of
the three measures of financial depth for the full data period, 1960-2004, and two
subperiods. The first subperiod, 1960-89, coincides with the time period analyzed by
King and Levine and others that established the consensus results that have become so
important. The results for 1960-89 and for the full period are largely consistent with this
consensus.7 For the 1960-89, the coefficients on the financial variables are all positive
and significant at the 5 percent level; the same is true for the full period except for the
ratio of private credit to GDP. The contrast with the second subperiod is dramatic; none
of the finance variables is significant in the cross section for 1990-2004. The coefficients
on the log of initial real GDP is negative and statistically significant for the 1960-89 and
1960-2004 periods, which is consistent with the notion of beta convergence, but they are
not significant for 1990-2004. The positive and significant coefficients on the log of the
initial secondary school enrollment rate in all specifications suggest that human capital
investment matters for growth. The other control variables - government expenditure and
trade as percentages of GDP - are not always significant in these cross section results but
robustness tests (not shown) indicate that their presence or absence does not have much
effect on the finance coefficients.
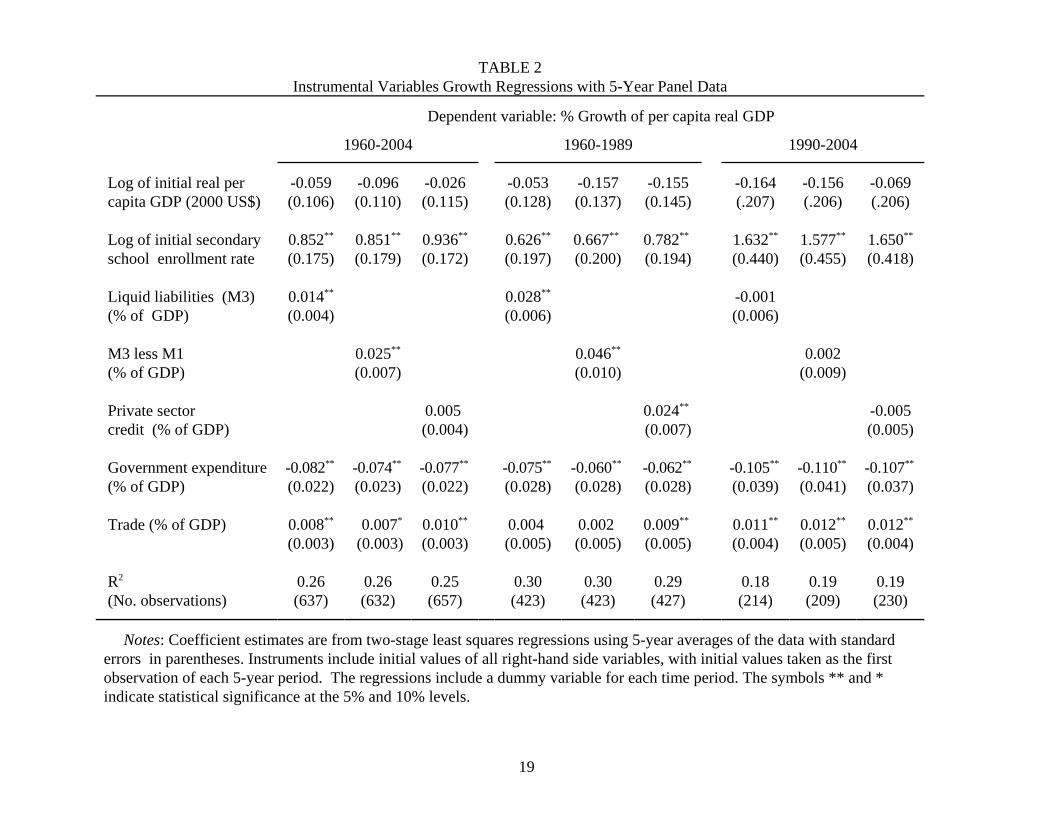
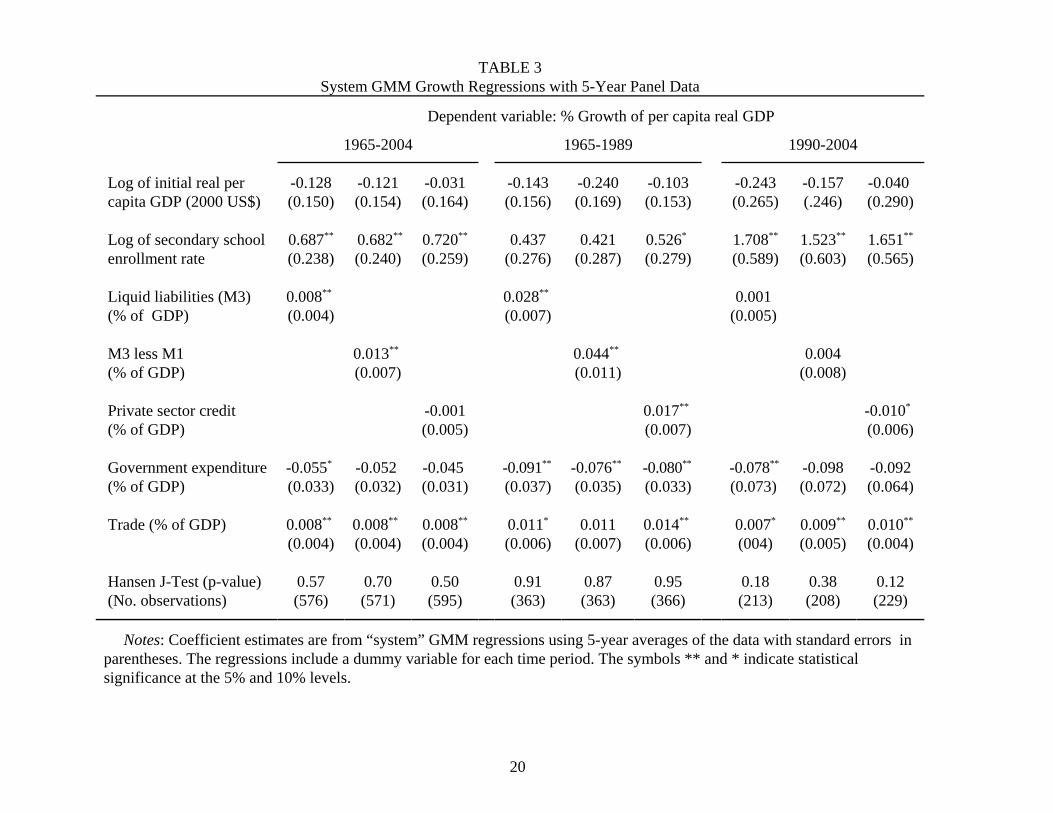
The dramatic difference between the initial and recent time periods found in the cross
section estimates of Table 1 is repeated when we look at panels with five-year averages
estimated with both standard two-stage least squares and with dynamic system GMM.
Tables 2 and 3 present these same equations estimated with the alternative techniques.
With all three estimation approaches, the effect of financial depth on growth, which is
always significant in the first 30-year period, disappears in the next 15. Whereas all of the
finance coefficients are significant at the 5 percent level in the early time period, none are
significant in the more recent data and the coefficients fall to near zero
To examine further the differences over time in the effect of financial depth on
7 The slight differences in these results from earlier published work with the same data definitions arise because later editions of the World Bank’s World Development Indicators, such as the one that we use from 2007, provide some observations for earlier years that were missing from previous editions.

8
growth, we estimated the baseline equation separately with the cross section of data from
each 5-year period. That is, from 1960 to 2004 there are nine cross sections. Instrumental
variable regressions with each of the three measures of financial depth are summarized in
Table 4 which shows only the finance coefficients from each cross section regression.8
The coefficient on M3 as a percent of GDP is positive and statistically significant for
five successive time periods running from 1965 to 1989 but insignificant in the earlier
and subsequent periods. The same is true for the coefficients on M3 less M1 with the
exception of one time period in the 1980s when the coefficient is not quite significant. In
contrast, the coefficient on the private credit ratio is only significantly different from zero
in two time periods. But the coefficient on private sector credit is clearly positive
(averaging .025) from the late 1960s until 1989 and then falls to zero or below. The
coefficient on the M3 ratio falls to zero from 1990 on, as does the coefficient on M3 less
M1. Chow tests for the regressions in each table reject the hypothesis of coefficient
stability across the nine time periods at the 1 percent level.
These tables provide a clear story. The effect of finance on growth is a disappearing
phenomenon. In the next section we examine several hypotheses that might explain the
result.
4. Understanding the changes in the finance-growth relationship
In this section we relate changes in the finance-growth relationship to the hypotheses
stated in the introduction (section 1). We start by relating the finance effect to the
incidence of financial crises. The disappearance of the finance effect on growth over time
may be related to the incidence of financial crises since such episodes are often
associated with too-rapid financial deepening. There is a thin line between financial
deepening that comes from the expansion of financial intermediary activity and financial
deepening that is the consequence of a credit boom. In the first instance increased
intermediation is likely to be growth enhancing, while in the second instance credit
standards deteriorate, nonperforming loans proliferate and a banking crisis ensues. The
effect of financial deepening on growth disappears in a financial crisis and the incidence
8 The equations estimated include all the control variables used in Tables 1-3.

9
of financial crises increased in the late 1980s. Thus, the reduced effect of finance on
growth may be due to the increased incidence of financial crises.
We investigate this hypothesis by isolating episodes of financial crisis and examining
the impact of financial deepening on growth in non-crisis episodes. We use the
identification and dating prepared by Caprio and Klingebiel (2003) for systemic banking
and financial crises around the world. Of the 84 countries in our sample, 45 have
experienced at least one major crisis. We characterize a 5-year country observation as a
crisis period if the country was in crisis at any time during the period. The table below
shows the number of countries in crisis at any time during each 5 year period.
60-64 65-69 70-74 75-79 80-84 85-89 90-94 95-99 00-04 Major crisis 0 0 1 4 16 25 23 24 15 Minor crisis 0 0 1 3 5 15 22 15 8
Instrumental variable estimates of the baseline growth equations that allow the
finance coefficient to vary when there is either a major or minor financial crisis are
shown in Table 5. Each equation shows the finance variable for all observations and then
the finance variable interacted with dummies for crisis episodes. The size of the
coefficient on the finance variable indicates the impact of finance on growth in non-crisis
observations. These effects are all positive, statistically significant, and larger than the
corresponding coefficients in Table 2, which does not account for crisis episodes. The
interaction with the major crisis dummy indicates the difference in the finance effect
when a country is in crisis. In every case, the finance effect is significantly smaller at the
5 percent level when there is a financial crisis. In fact, the impact of financial deepening
in these crisis periods is often near zero. The minor crisis episodes also have a negative
impact on the finance coefficients but the changes are small and not statistically
significant.
Since excessive credit creation can lead to instability and crisis, and financial
liberalization is usually associated with the rapid development of financial institutions,
capital flows, and increases in liquid liabilities, the disappearance of the finance effect on
growth over time could also be related to the rapid liberalization of financial markets in
many countries in the latter period. In particular, policy makers have busily touted the

10
benefits of liberalization of financial markets and the growth of financial institutions
throughout the 1980s and 1990s. However, the increases in financial depth in many
countries took place without the requisite development of lending expertise, mechanisms
for monitoring, and supervisory and regulatory skills. So the relationships observed in
the early data may have disappeared as efforts to liberalize financial markets became
widespread.
In order to explore the impact of liberalizations we use the dating of equity market
liberalizations in Bekaert, Harvey and Lundblad (2005). They use a variety of sources to
date an important element of financial sector liberalization, the liberalization of access by
foreigners to the domestic equity market. This classification scheme can be applied to
virtually all of the countries in our sample, and it turns out that a large number of
countries experienced liberalization, although most of the liberalization occurred within a
rather short period of time in the late 1980s and the early 1990s. Thus, we can associate
our 5-year average growth observations with the liberalization status of the country. We
separate our observations into four groups indicating whether a country was always
liberalized, never liberalized, the pre-liberalization periods of countries that liberalized,
and the corresponding post liberalization observations.
Instrumental variable estimates of the base line growth equations that allow the
finance coefficient to vary with the country’s liberalization status are shown in Table 6.
Each equation shows the finance variable for all observations and then the finance
variable interacted with dummies for three of the liberalization groups (the always-
liberalized group is omitted). Thus, the coefficients on the interaction variables are
differences in the finance effect from the effect for always-liberalized countries. The
signs of the interaction coefficients offer some indication that the finance effect is larger
in never liberalized countries and smaller in countries prior to liberalization, but they are
never significantly different from zero. Of course, it might be difficult to identify the
effect of liberalizations on the finance-growth relationship because the liberalization itself
often promotes growth. Indeed, Bekaert, Harvey and Lundblad find that that equity
market liberalizations increase growth rates by a full percentage point. Further, it might
be hard to distinguish a liberalization effect from the effect of time since all the post-

11
liberalization observations occur later in our sample and time period fixed effects are
included in all of the equations. 9
Next, equity markets have grown in size and importance around the world in just the
years in which the effect of financial deepening on growth seems to have disappeared. It
therefore is reasonable to suggest that equity market financing has acted as a substitute
for credit market financing so that the impact of financial deepening has been mitigated
in recent years by the increasing role of equity markets. The positive impact of equity
markets on growth has been demonstrated with panel data sets like ours by Levine and
Zervos (1998) and Rousseau and Wachtel (2000). In order to investigate this hypothesis
we define a broad financing measure which is the sum of M3 and the market
capitalization of the stock market as a ratio to GDP.10 The stock market data is not
widely available until the 1980s and even then is not available for every country.
Nevertheless we estimated the baseline equation for the countries that were available for
each cross section after 1980 with the broad financing measure. The table below shows
the coefficients on the broad financing measure from each cross section with its standard
error in parentheses and the number of countries. The finance effect is present though
not quite statistically significant in the 1980s but disappears afterwards even when the
equity and credit markets are considered together.
1980-84 1985-89 1990-94 1995-99 2000-04
Broad finance 0.018 0.010 -0.003 -0.002 0.002
(.013) (.009) (.006) (.004) (.005)
No. countries 39 44 51 61 45
9 For example, an additional explanation might be that there are distinct characteristics of the two decades, the 1970s and 1980s, that made the financial ratios seem to cause growth at that time but not otherwise. Those decades are dominated by the oil shocks and periods of high inflation in many countries. It could well be that greater financial depth is associated with growth because these countries were better able to withstand the large nominal shocks that characterized the period. This would in fact be a benefit of deeper financial institutions but would not imply that increases in financial depth cause growth. 10 The data on stock market capitalization are from the World Development Indicators database and worksheets underlying Rousseau and Wachtel (2000).

12
The conclusion to be drawn from these tests is clear. The decline in the finance
coefficients over time is not an inexplicable or transitory time effect. The coefficients are
smaller in recent years because of the increased incidence of financial and banking crises.
Financial deepening promotes growth as long as it is not excessive. Once excessive
growth of money and credit leads to a crisis in the banking system, the benefits of
financial deepening disappear until the crisis is cleaned up. The change in the finance
effect is not due to liberalization as measured by financial sector openness and it is not
due to the increasingly important role of equity markets.
5. Additional evidence
In this section we examine sample composition effects that might affect the
relationship between finance and growth. To begin we distinguish between developed
and developing countries using the World Bank’s classification and estimate the baseline
growth equation for each group. Table 7 shows the panel estimates for both country
groups for the initial sample period (1960-89) and the subsequent period (1990-2004)
with the M3 as a percentage of GDP as the finance variable. The finance effect is
significant for both in the earlier period though it is larger for the developed countries. In
the later period it is much smaller for the developed countries and disappears for the
undeveloped countries.
The effect of both time and level of development on the finance coefficient can be
related to changes in the per capita income of the countries in the sample. In order to
examine this, we used a rolling regression technique to investigate the relationship
between per capita income and the finance effect more closely.11 In results not shown
here, we find that for very low income countries (income below 3,000 year 2000 USD);
the effect of financial deepening is positive but not significant. The effect is imprecisely
estimated because in many of these countries increased financial depth might be due to
11 The rolling regression techniques was first applied to study of the finance-growth nexus by Rousseau and Wachtel (2002). In that paper we showed that the cross-sectional relationship between finance and growth vanished in high inflation environments.

13
directed finance and poor lending standards. However, in the middle income range (from
$3,000 to $12,000), there seems to be clear evidence of a finance growth relationship.
The relationship disappears among very high income countries. These results indicate
that the finance growth nexus appears to be stronger in certain economic environments.
Countries with moderately developed financial sectors or countries with middle levels of
per capita income have a stronger and significant impact of financial deepening on
economic growth.
We also use the rolling regression technique to investigate the relationship between
the level of financial development and the impact of finance with IV panel regressions for
the baseline equation and the M3 ratio as the finance variable.12 Figure 1 shows the
evolution of the finance coefficient for 20-country rolling windows; the solid line gives
the estimated coefficients and 5 percent confidence intervals are given by the dotted lines.
The countries are ordered by the average level of financial depth (after adjusting for
global time effects) and rolled in as the ratio of M3 to GDP increases.
The initial regression includes the 20 countries with the lowest levels of financial
depth and rolls in additional countries and rolls out the initial countries one by one so that
each coefficient is estimated with a 20-country window. Thus, the coefficients depicted in
Figure 1 reflect the effects of finance on growth among countries with relatively similar
levels of financial sector development. The horizontal axis measures the average ratio of
M3 to GDP among the 20 countries corresponding to each particular point estimate.
The results are striking; financial deepening matters when the M3 to GDP ratio is
around the middle of the observed range (about 40%). The 20-country window that
corresponds with this peak positive effect includes M3 to GDP ratios that range from
32% to nearly 60%. Among the financially less developed countries the coefficient is
usually negative, is quite variable, and is imprecisely measured. Among the financially
most developed countries the coefficient is about zero but rising slowly with the level of
financial depth; although finance differs a lot among these countries it has little
relationship to growth.

14
6. Conclusion
We examine the robustness of some now-classic findings on the cross-country
relationship between financial development and economic growth, and found that the
finance-growth relationship that was estimated with data from the 1960s to the 1980s
simply disappeared over the subsequent fifteen years. One might conclude that the
underlying relationship that is so widely used is simply unstable and that with additional
data it might well reappear. Alternatively, we investigate some simple hypotheses that
might explain the time effects.
First, we test whether the incidence of domestic banking and financial crises affects
the impact of deepening. Here the evidence is very strong. Financial deepening has a
strong impact on growth throughout the sample period as long as a country can avoid a
financial crisis. In crisis episodes, which are more often than not due to excessive
deepening, the benefits of financial deepening, not surprisingly, disappear.
Second, we test to see whether an affect analogous to the Lucas critique is at work. In
the context of our problem, it would imply that financial deepening causes growth as long
as the relationship is not exploited. We use international equity market opening as an
indicator of liberalization and the effort to develop financial markets. We find that the
effect of financial deepening does not weaken when liberalizations occur.
Third, we test to see whether the disappearance of the finance effect is due to the
omission of the role of equity markets on growth. This is of particular concern because
of the increasing role of equity markets in many countries in the recent years. We do not
find any indication that our result is due to the absence of equity markets. Although
market capitalization is not available for all of the countries in our sample, when it is
included the effect of finance broadly defined still declines after the 1980s.
All of this does not detract from the basic point that at one time countries with higher
levels of financial development tended to have higher growth rates than those with lower
levels of financial development. The question of how these countries acquired large
financial sectors and how they may have served as engines of growth, however, remains
imperfectly understood. Did finance emerge due to the presence of deeper institutional
fundamentals that had a direct impact on growth as Acemoglu, Johnson, and Robinson
12 The overall estimate for the entire sample is given in Table 1.

15
(2001) suggest? Or is Joan Robinson correct that growth is the prime mover behind
financial development? Our study, while by no means arguing that financial factors is no
longer important for economic development, serves simply as a reminder that the link
between finance and growth is more complex than the simple relationships suggest. It
would appear that deepening needs to be accompanied by appropriate policies for
financial sector reform and regulation. Thus, the systematic study of the financial
development experiences of individual countries becomes all the more critical as the next
step in furthering our understanding of the nexus.
References
Acemoglu, D., S. Johnson, and J. A. Robinson. “The Colonial Origins of Economic Development: An Empirical Investigation.” American Economic Review, 91, 2001, 1369-1401.
Arestis, P., P. O. Demetriades, and K. B. Luintel. “Financial Development and Economic Growth: The Role of Stock Markets,” Journal of Money, Credit, and Banking, 33, 2001, 16-41.
Barro, R. J. “Economic Growth in a Cross Section of Countries.” Quarterly Journal of Economics, 106, 1991, 407-43.
Bekaert, G., C. R. Harvey, and C. Lundblad. “Does Financial Liberalization Spur
Growth?” Journal of Financial Economics, 77, 2005, 3-55. Caprio, G., and D. Klingebiel. “Episodes of Systemic and Borderline Financial Crises.”
Mimeo, World Bank, 2003. Demetriades, P. O., and K. A. Hussein. “Does Financial Development Cause Economic
Growth? Time Series Evidence from Sixteen Countries.” Journal of Development Economics, 51, 1996, 387-411.
Goldsmith, R. W. Financial Structure and Development. New Haven, CT: Yale
University Press, 1969.
King, R. G., and R. Levine, “Finance and Growth: Schumpeter Might Be Right.” Quarterly Journal of Economics, 108, 1993, 717-37.
Levine, R. “Financial Development and Economic Growth: Views and Agenda.” Journal of Economic Literature, 35, 1997, 688-726.

16
Levine, R. “Finance and Growth: Theory and Evidence,” in Handbook of Economic Growth, Volume 1A, edited by P. Aghion and S. N. Durlauf. Amsterdam: Elsevier North Holland, 2005, 865-934.
Levine, R., N. Loayza, and T. Beck. “Financial Intermediation and Growth: Causality and Causes.” Journal of Monetary Economics, 46 (2000), 31-77.
Levine, R., and S. Zervos. “Stock Markets, Banks, and Economic Growth.” American
Economic Review, 88, 1998, 537-58. Loayza, N. V., and R. Ranciere. “Financial Development, Financial Fragility, and
Growth.” Journal of Money, Credit, and Banking, 38, 2006, 1051-76. Lucas, R. E., Jr. “Econometric Policy Evaluation: A Critique.” Carnegie-Rochester
Series on Public Policy, 1, 1975, 19-46.
Lucas, R. E., Jr. “On the Mechanics of Economic Development.” Journal of Monetary Economics 22, 1988, 3-42.
Manning, M. J. “Finance Causes Growth: Can We Be So Sure?” Contributions to Macro- economics, 3, 2003, http://www.bepress.com/bejm/contributions/vol3/iss1/art12.
McKinnon, R. I. Money and Capital in Economic Development. Washington, DC: The
Brookings Institution, 1973.
McKinnon, R. I. The Order of Economic Liberalization. Baltimore and London: The Johns Hopkins University Press, 1991.
Rioja, F., and N. Valev. “Does One Size Fit All? A Reexamination of the Finance and
Growth Relationship.” Journal of Development Economics, 74, 2004, 429-47.
Robinson, J. “The Generalization of the General Theory,” in The Rate of Interest and Other Essays. London: Macmillan, 1952.
Rousseau, P. L., and P. Wachtel. “Financial Intermediation and Economic Performance: Historical Evidence from Five Industrialized Economies.” Journal of Money, Credit and Banking, 30, 1998, 657-78.
Rousseau, P. L., and P. Wachtel. “Equity Markets and Growth: Cross-Country Evidence on Timing and Outcomes, 1980-1995.” Journal of Banking and Finance, 24, 2000, 1933-57.
Rousseau, P. L., and P. Wachtel, “Inflation Thresholds and the Finance-Growth Nexus.” Journal of International Money and Finance, 21, 2002, 277-93.

17
Temple, J. “The New Growth Evidence” Journal of Economic Literature, 37, 1999, 112-56.
Wachtel, P. “How Much Do We Really Know about Growth and Finance?” Federal
Reserve Bank of Atlanta Economic Review, 88, 2003, 33-47. Windmeijer, F. “A Finite Sample Correction for the Variance of Linear Efficient Two-
Step GMM Estimators.” Journal of Econometrics, 126, 2005, 25-51.

18
TABLE 1OLS Growth Regressions with Pure Cross Section Data
Dependent variable: % Growth of per capita real GDP
1960-2004 1960-1989 1990-2004
Log of initial real per capita GDP (2000 US$)
-0.583**
(0.178)-0.641**
(0.178)-0.611**
(0.186) -0.552**
(0.181)-0.645**
(0.199)-0.565**
(0.216)-0.041(0.226)
-0.159(.226)
-0.077 (0.231)
Log of initial secondary school enrollment rate
1.311** (0.389)
1.346**
(0.411) 1.570** (0.347)
0.987**
(0.342)1.067**
(0.359)1.370**
(0.327) 1.430** (0.462)
1.374** (0.464)
1.444** (0.417)
Initial liquid liabilities (M3) (% of GDP)
0.026**
(0.009) 0.042**
(0.010)-0.003 (0.006)
Initial M3 less M1 (% of GDP)
0.032** (0.016)
0.058** (0.017)
0.007(0.010)
Initial private sector credit (% of GDP)
0.013(0.011)
0.027**
(0.013)-0.001(0.006)
Initial government expenditure (% of GDP)
0.042(0.053)
0.075 (0.053)
0.051 (0.046)
0.077(0.048)
0.113**
(0.051)0.075* (0.044)
-0.123** (0.051)
-0.120**
(0.055)-0.120**
(0.045)
Initial trade (% of GDP)
-0.008 (0.006)
-0.008 (0.006)
-0.002(0.004)
-0.020**
(0.009)-0.019**
(0.010)-0.005 (0.006)
0.012*
(.005) 0.009* (0.005)
0.010**
(0.004)
R2
(No. observations)0.42(77)
0.44(70)
0.44(83)
0.38(75)
0.35(68)
0.39(80)
0.36(74)
0.35(70)
0.37(83)
Notes: Coefficient estimates are from OLS regressions with standard errors in parentheses. Growth rates are averagedacross each data period and all explanatory variables are measured at the start of the period. The symbols ** and * indicatestatistical significance at the 5% and 10% levels.
19
TABLE 2Instrumental Variables Growth Regressions with 5-Year Panel Data
Dependent variable: % Growth of per capita real GDP
1960-2004 1960-1989 1990-2004
Log of initial real per capita GDP (2000 US$)
-0.059(0.106)
-0.096(0.110)
-0.026(0.115)
-0.053(0.128)
-0.157(0.137)
-0.155(0.145)
-0.164(.207)
-0.156(.206)
-0.069(.206)
Log of initial secondary school enrollment rate
0.852** (0.175)
0.851** (0.179)
0.936** (0.172)
0.626** (0.197)
0.667** (0.200)
0.782** (0.194)
1.632** (0.440)
1.577** (0.455)
1.650** (0.418)
Liquid liabilities (M3) (% of GDP)
0.014** (0.004)
0.028** (0.006)
-0.001(0.006)
M3 less M1 (% of GDP)
0.025** (0.007)
0.046** (0.010)
0.002(0.009)
Private sector credit (% of GDP)
0.005 (0.004)
0.024** (0.007)
-0.005(0.005)
Government expenditure (% of GDP)
-0.082** (0.022)
-0.074** (0.023)
-0.077** (0.022)
-0.075** (0.028)
-0.060** (0.028)
-0.062** (0.028)
-0.105** (0.039)
-0.110** (0.041)
-0.107** (0.037)
Trade (% of GDP)
0.008** (0.003)
0.007*
(0.003) 0.010** (0.003)
0.004 (0.005)
0.002 (0.005)
0.009** (0.005)
0.011** (0.004)
0.012** (0.005)
0.012** (0.004)
R2
(No. observations)0.26(637)
0.26(632)
0.25(657)
0.30(423)
0.30(423)
0.29(427)
0.18(214)
0.19(209)
0.19(230)
Notes: Coefficient estimates are from two-stage least squares regressions using 5-year averages of the data with standarderrors in parentheses. Instruments include initial values of all right-hand side variables, with initial values taken as the firstobservation of each 5-year period. The regressions include a dummy variable for each time period. The symbols ** and *indicate statistical significance at the 5% and 10% levels.
20
TABLE 3System GMM Growth Regressions with 5-Year Panel Data
Dependent variable: % Growth of per capita real GDP
1965-2004 1965-1989 1990-2004
Log of initial real per capita GDP (2000 US$)
-0.128(0.150)
-0.121(0.154)
-0.031(0.164)
-0.143(0.156)
-0.240(0.169)
-0.103(0.153)
-0.243(0.265)
-0.157(.246)
-0.040 (0.290)
Log of secondary school enrollment rate
0.687** (0.238)
0.682**
(0.240) 0.720** (0.259)
0.437(0.276)
0.421(0.287)
0.526* (0.279)
1.708** (0.589)
1.523** (0.603)
1.651** (0.565)
Liquid liabilities (M3) (% of GDP)
0.008** (0.004)
0.028** (0.007)
0.001 (0.005)
M3 less M1 (% of GDP)
0.013** (0.007)
0.044** (0.011)
0.004(0.008)
Private sector credit (% of GDP)
-0.001(0.005)
0.017** (0.007)
-0.010* (0.006)
Government expenditure (% of GDP)
-0.055* (0.033)
-0.052 (0.032)
-0.045 (0.031)
-0.091** (0.037)
-0.076** (0.035)
-0.080** (0.033)
-0.078** (0.073)
-0.098(0.072)
-0.092(0.064)
Trade (% of GDP)
0.008** (0.004)
0.008** (0.004)
0.008**
(0.004)0.011*
(0.006)0.011
(0.007)0.014** (0.006)
0.007*
(004) 0.009** (0.005)
0.010**
(0.004)
Hansen J-Test (p-value) (No. observations)
0.57(576)
0.70(571)
0.50(595)
0.91(363)
0.87(363)
0.95(366)
0.18(213)
0.38(208)
0.12(229)
Notes: Coefficient estimates are from “system” GMM regressions using 5-year averages of the data with standard errors inparentheses. The regressions include a dummy variable for each time period. The symbols ** and * indicate statisticalsignificance at the 5% and 10% levels.

21
TABLE 4Summary of Instrumental Variables Growth Regressions with Individual 5-Year Cross Sections
Dependent variable: % Growth of per capita real GDP
1960-64 1965-69 1970-74 1975-79 1980-84 1985-89 1990-94 1995-99 2000-04
Liquid liabilities (M3) (% of GDP)
-0.005(0.019)
0.044** (0.013)
0.029** (0.013)
0.040** (0.016)
0.029* (0.015)
0.020*
(0.012)-0.000(0.012)
-0.001(0.008)
0.002(0.008)
M3 less M1 (% of GDP)
-0.002(0.030)
0.062** (0.020)
0.041* (0.022)
0.043* (0.025)
0.046 (0.031)
0.062** (0.020)
0.012(0.021)
-0.001(0.015)
0.003(0.011)
Private sector credit (% of GDP)
0.009(0.024)
0.034* (0.019)
0.024 (0.018)
0.022 (0.020)
0.011 (0.017)
0.036** (0.013)
-0.003(0.011)
-0.005(0.007)
0.001(0.007)
Notes: Coefficient estimates are for the financial variables listed in the left column of the table from separate two-stageleast squares regressions using 5-year averages of the data with standard errors in parentheses. The growth regressionsummarized in each cell includes initial income, secondary education, government expenditure, and trade as controls alongwith the single financial variable listed. Instruments include initial values of all right-hand side variables, with initial valuestaken as the first observation of each 5-year period. The regressions include a dummy variable for each time period. Thesymbols ** and * indicate statistical significance at the 5% and 10% levels.

22
TABLE 5Instrumental Variables Growth Regressions with 5-Year Panel Data
by Crisis Status, 1960-2004
Dependent variable: % Growth of per capita real GDP
Financial Variable: M3(% GDP)
M3-M1 (% GDP)
Credit (% GDP)
Log of initial real per capita GDP (2000 US$)
-0.073(0.105)
-0.103 (0.110)
-0.091(0.116)
Log of secondary school enrollment rate
0.817** (0.175)
0.845** (0.179)
0.940** (0.171)
Finance 0.020**
(0.004) 0.029** (0.007)
0.012** (0.004)
Finance x major financial crisis
-0.017**
(0.005) -0.020**
(0.009) -0.015**
(0.005)
Finance x minor financial crisis
-0.006 (0.006)
-0.007 (0.010)
-0.008 (0.006)
Government expenditure (% of GDP)
-0.085**
(0.022)-0.078**
(0.023)-0.079**
(0.022)
Trade (% of GDP)
0.006* (0.003)
0.006* (0.004)
0.009**
(0.003)
R2
(No. observations)0.27(637)
0.26(632)
0.26(657)
Notes: Coefficient estimates are from two-stage least squares regressions using 5-year averages of the data with standard errors in parentheses. Instruments includeinitial values of all right-hand side variables, with initial values taken as the firstobservation of each 5-year period. The regressions include a dummy variable foreach time period. The symbols ** and * indicate statistical significance at the 5%and 10% levels.

23
TABLE 6Instrumental Variables Growth Regressions with 5-Year Panel Data
by Liberalization Status, 1960-2004
Dependent variable: % Growth of per capita real GDP
Financial Variable: M3 (% GDP)
M3-M1 (% GDP)
Credit (% GDP)
Log of initial real per capita GDP (2000 US$)
-0.036(0.107)
-0.076(0.112)
0.007(0.117)
Log of secondary school enrollment rate
0.816** (0.178)
0.837** (0.180)
0.935** (0.174)
Finance 0.014**
(0.004) 0.023** (0.007)
0.005 (0.004)
Finance x never liberalized
0.005 (0.005)
0.009 (0.007)
-0.001 (0.004)
Finance x pre-liberalization
0.001 (0.006)
-0.005 (0.009)
-0.005 (0.007)
Finance x post liberalization
0.003 (0.006)
0.006 (0.008)
0.003 (0.006)
Government expenditure (% of GDP)
-0.090** (0.022)
-0.081** (0.023)
-0.080** (0.022)
Trade (% of GDP)
0.008** (0.003)
0.006* (0.004)
0.010** (0.003)
Exclude liberalization variables (p-value) 0.79 0.45 0.79
R2
(No. observations)0.26(630)
0.27(619)
0.25(646)
Notes: Coefficient estimates are from two-stage least squares regressions using 5-yearaverages of the data with standard errors in parentheses. Instruments include initial valuesof all right-hand side variables, with initial values taken as the first observation of each 5-year period. The regressions include a dummy variable for each time period. The symbols** and * indicate statistical significance at the 5% and 10% levels.

24
TABLE 7Instrumental Variables Growth Regressions with 5-Year Panel Data
for Developed and Less Developed Countries
Dependent variable: % Growth of per capita real GDP
Developed Less Developed
1960-2004
1960-1989
1990-2004
1960-2004
1960-1989
1990-2004
Log of initial real per capita GDP (2000 US$)
-0.426**
(0.209)-0.418*
(0.254)-0.650(0.411)
-0.585**
(0.210)-0.552**
(0.256)-0.354(0.392)
Log of secondary school enrollment rate
0.569** (0.236)
0.407(0.267)
1.435** (0.625)
1.624** (0.333)
1.447**
(0.371) 2.371** (1.075)
Liquid liabilities (M3) (% of GDP)
0.035**
(0.010)0.045**
(0.017)0.019
(0.014) 0.008**
(0.004)0.019**
(0.005)-0.006 (0.005)
Government expenditure (% of GDP)
-0.112**
(0.036)-0.103**
(0.047)-0.127* (0.070)
-0.068**
(0.030)-0.067*
(0.040)-0.122** (0.048)
Trade (% of GDP)
-0.001 (0.006)
-0.006(0.008)
0.004(0.008)
0.013** (0.004)
0.013**
(0.006)0.016**
(0.005)
R2 (No. observations)
0.21(360)
0.24(238)
0.17(122)
0.32(277)
0.36(185)
0.22(92)
Notes: Coefficient estimates are from two-stage least squares regressions using 5-yearaverages of the data with standard errors in parentheses. Instruments include initial values ofall right-hand side variables, with initial values taken as the first observation of each 5-yearperiod. The regressions include a dummy variable for each time period. The symbols ** and *indicate statistical significance at the 5% and 10% levels.
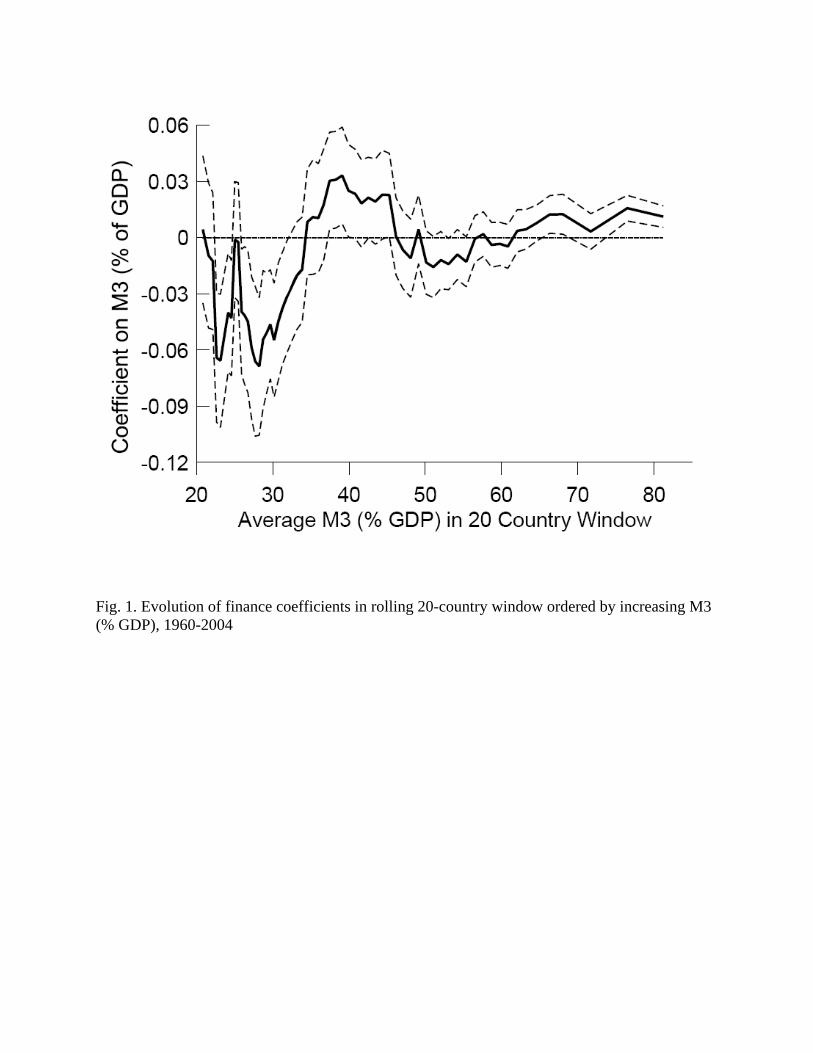
Fig. 1. Evolution of finance coefficients in rolling 20-country window ordered by increasing M3 (% GDP), 1960-2004