Embed Size (px)
Citation preview
What is bias and how can it affect the outcomes from research?
Caroline A. Sabin Dept. Infection and Population Health UCL, Royal Free Campus London, UK
Bias
• Bias occurs when there is a systematic difference between the results from a study and the true state of affairs
• Bias is often introduced when a study is being designed, but can be introduced at any stage
• Appropriate statistical methods can reduce the effect of bias, but may not eliminate it totally
• Increasing the sample size does not reduce bias
• Preferable to design the study in order to avoid bias in the first place

Bias
Many forms of bias exist – these can broadly be categorised as forms of:
- Selection bias - patients included in the study are not representative of the population to which the results will be applied; or
- Information bias - occurs during data collection when measurements on exposure and/or outcomes are incorrectly recorded in a systematic manner
Selection bias
Ascertainment bias Attrition bias (loss-to-follow-up) Healthy entrant effect Response bias Survivorship bias* Confounding*
Survivorship bias
Occurs when survival is compared in patients who do/do not receive an intervention, when this becomes available sometime in the future
To receive the intervention, patients must survive until its introduction; anyone dying prior to this time will not receive it
It will appear that those who receive the intervention have particularly good survival compared to those who do not receive it
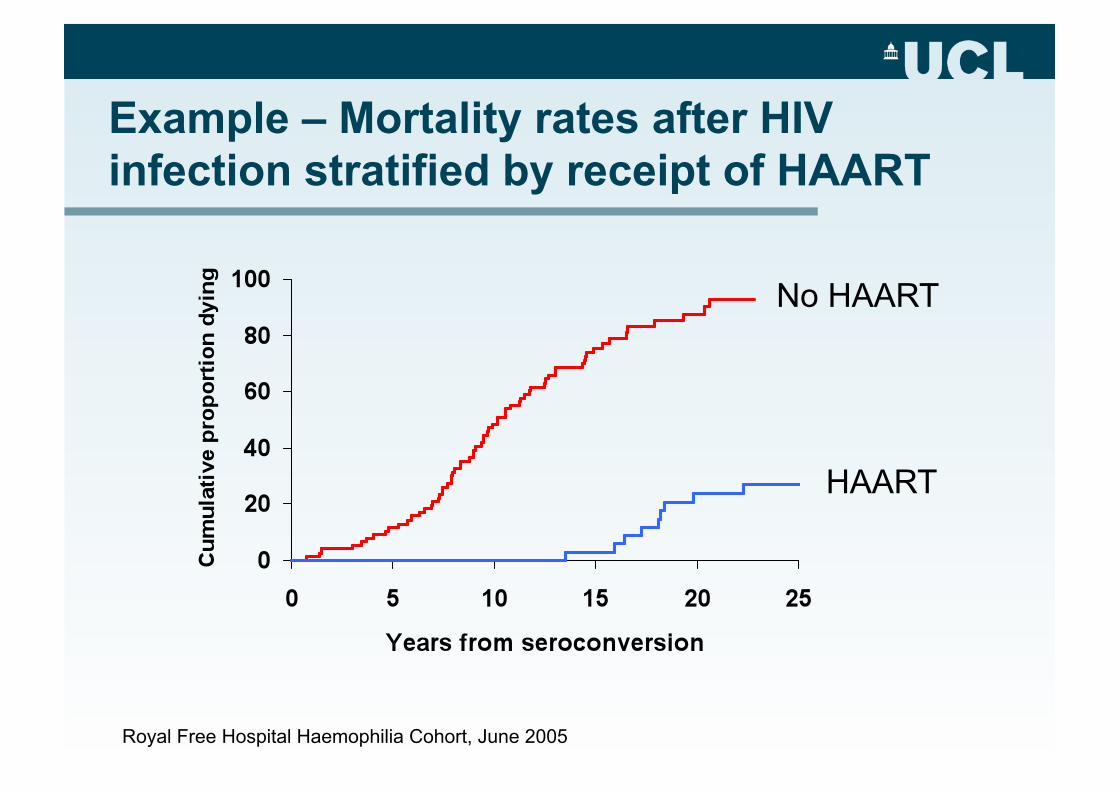
Example – Mortality rates after HIV infection stratified by receipt of HAART
No HAART
HAART
Royal Free Hospital Haemophilia Cohort, June 2005
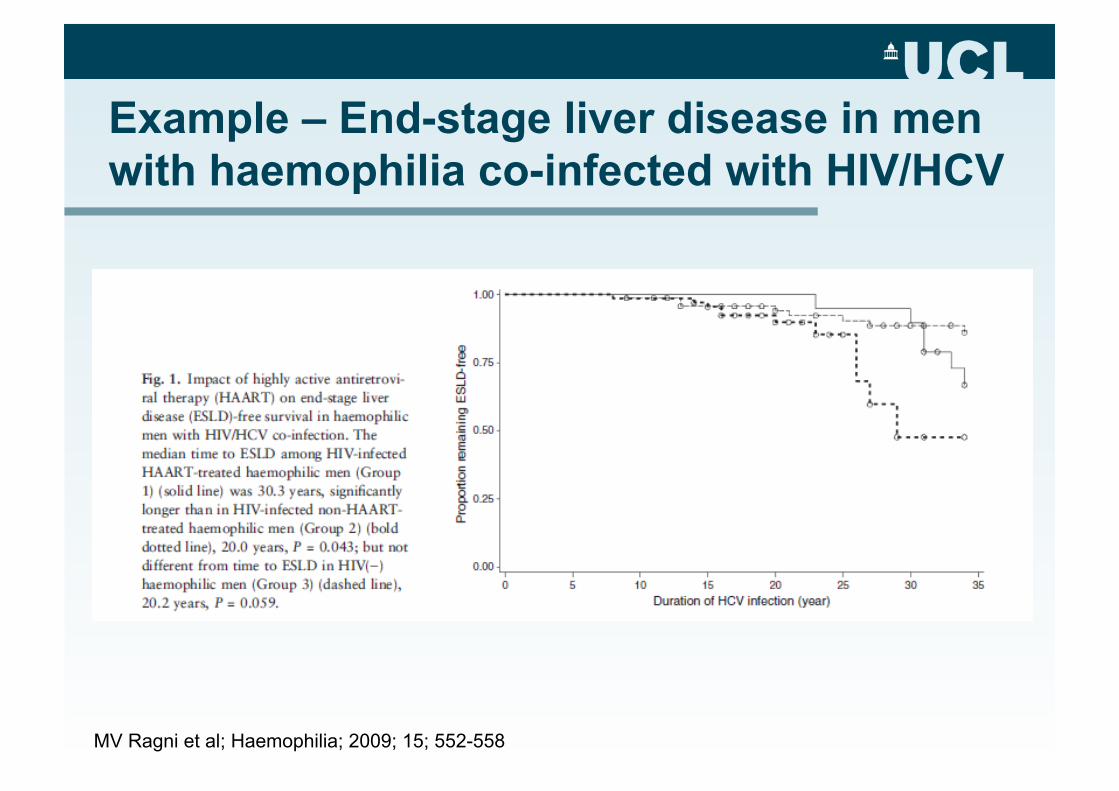
Example – End-stage liver disease in men with haemophilia co-infected with HIV/HCV
MV Ragni et al; Haemophilia; 2009; 15; 552-558
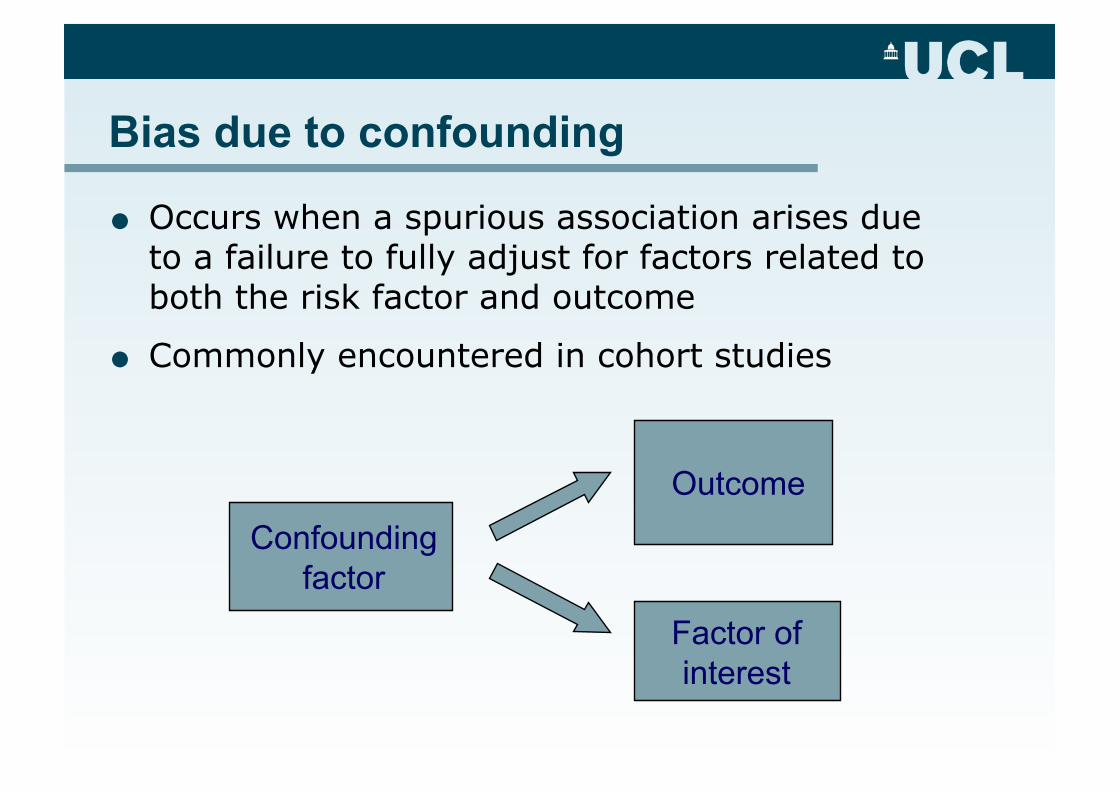
Bias due to confounding
Occurs when a spurious association arises due to a failure to fully adjust for factors related to both the risk factor and outcome
Commonly encountered in cohort studies
Confounding factor
Outcome
Factor of interest
Confounding – treatment comparisons
The reason why some patients were treated with one regimen and others with a different one is often unknown
Whilst one treatment may appear to be associated with a better outcome, these other factors may explain the better outcome in these patients
Often referred to as ‘channelling bias’ in this context
Example - Abacavir (ABC) and MI
• The D:A:D Study reported a significant association between recent exposure to ABC and the development of MI
• Adjusted rate ratio: 1.90, 95% CI 1.47-2.45
• Finding was unexpected as ABC was perceived to be a ‘cardio-friendly’ option; in some clinics, ABC was preferentially used in those with existing cardiovascular risks
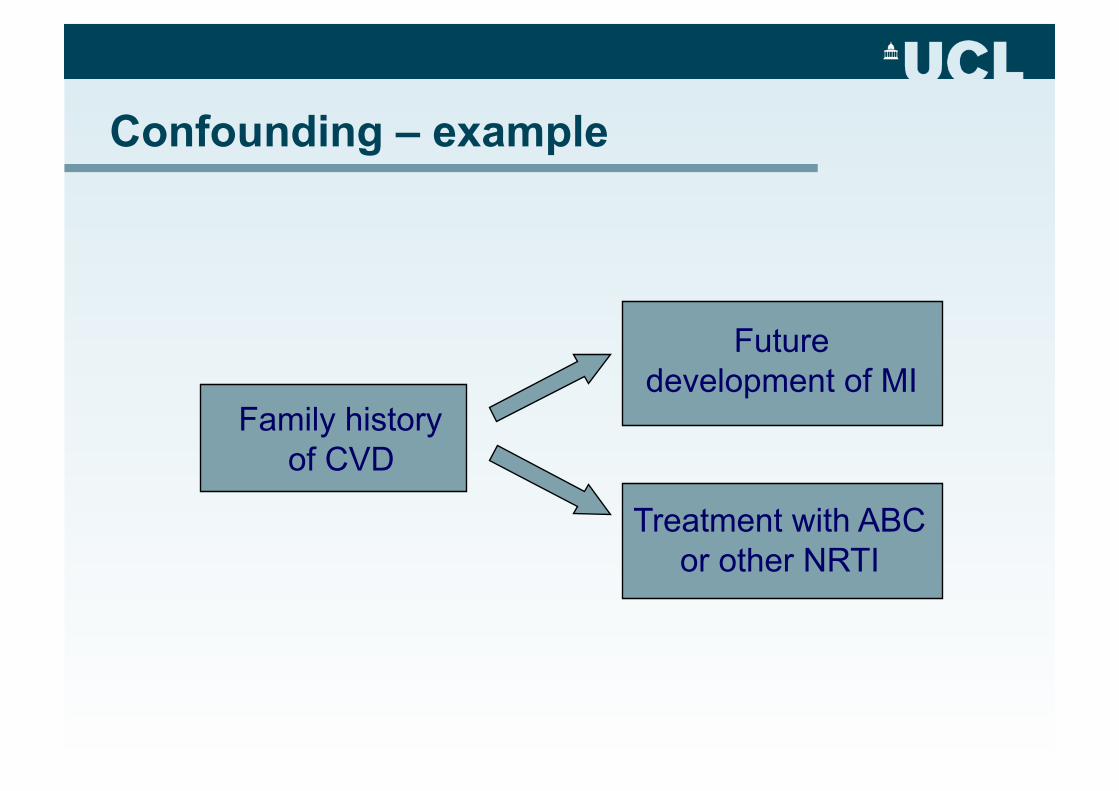
Confounding – example
Family history of CVD
Future development of MI
Treatment with ABC or other NRTI
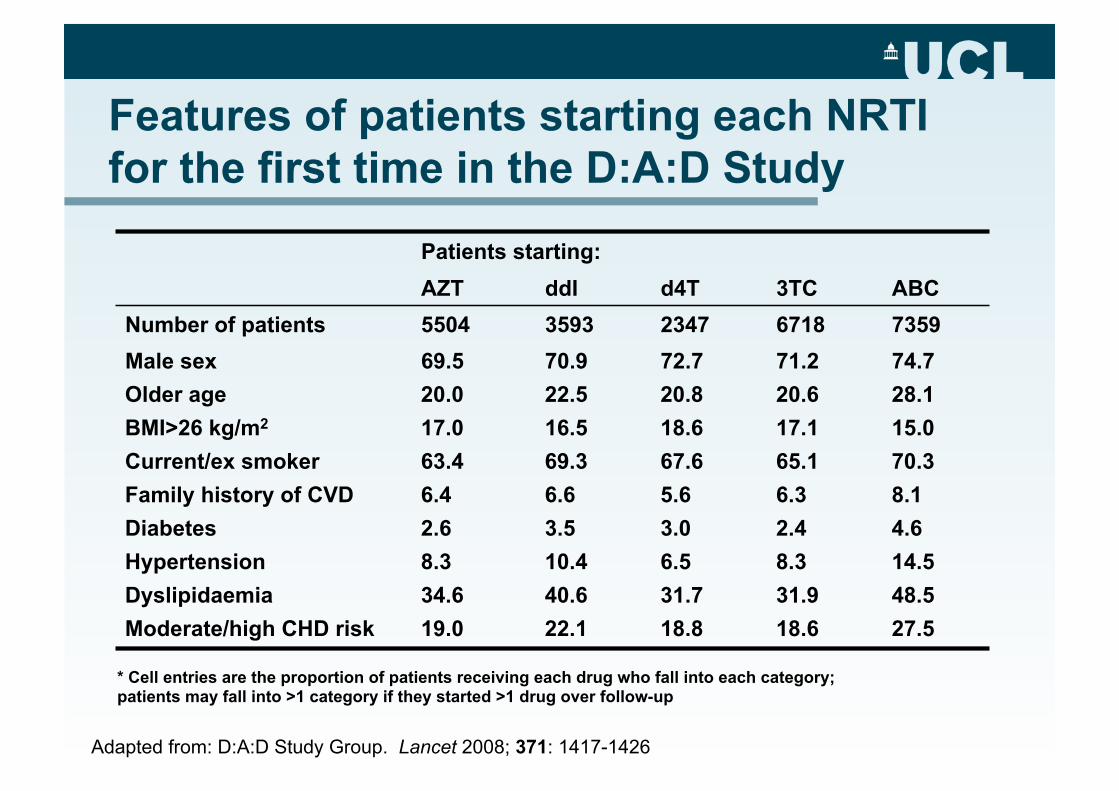
Features of patients starting each NRTI for the first time in the D:A:D Study
Patients starting: AZT ddI d4T 3TC ABC
Number of patients 5504 3593 2347 6718 7359 Male sex 69.5 70.9 72.7 71.2 74.7 Older age 20.0 22.5 20.8 20.6 28.1 BMI>26 kg/m2 17.0 16.5 18.6 17.1 15.0 Current/ex smoker 63.4 69.3 67.6 65.1 70.3 Family history of CVD 6.4 6.6 5.6 6.3 8.1 Diabetes 2.6 3.5 3.0 2.4 4.6 Hypertension 8.3 10.4 6.5 8.3 14.5 Dyslipidaemia 34.6 40.6 31.7 31.9 48.5 Moderate/high CHD risk 19.0 22.1 18.8 18.6 27.5
* Cell entries are the proportion of patients receiving each drug who fall into each category; patients may fall into >1 category if they started >1 drug over follow-up
Adapted from: D:A:D Study Group. Lancet 2008; 371: 1417-1426
Dealing with confounding
• We use statistical methods (e.g. multivariable regression, propensity scores) to remove the effects of confounding
• Estimates from these models describe the relationship between a drug and a toxicity, after removing the effects of known confounders
• Whilst this approach is usually successful, all methods will give biased results if unmeasured (or unknown) confounding remains
Channelling bias in D:A:D?
• Findings unlikely to be explained by channelling bias as:
- Association was significant after adjusting for known CVD risks
- Association was reduced in those who discontinued ABC, suggesting effect was reversible
- No association apparent for stroke, although likely to be similar channelling
- No association apparent for tenofovir, although likely to be similar channelling
Information bias
Central tendency bias Lead-time bias* Measurement bias Misclassification bias Observer bias Regression dilution bias Regression to the mean Reporting bias Publication bias* Missing data*
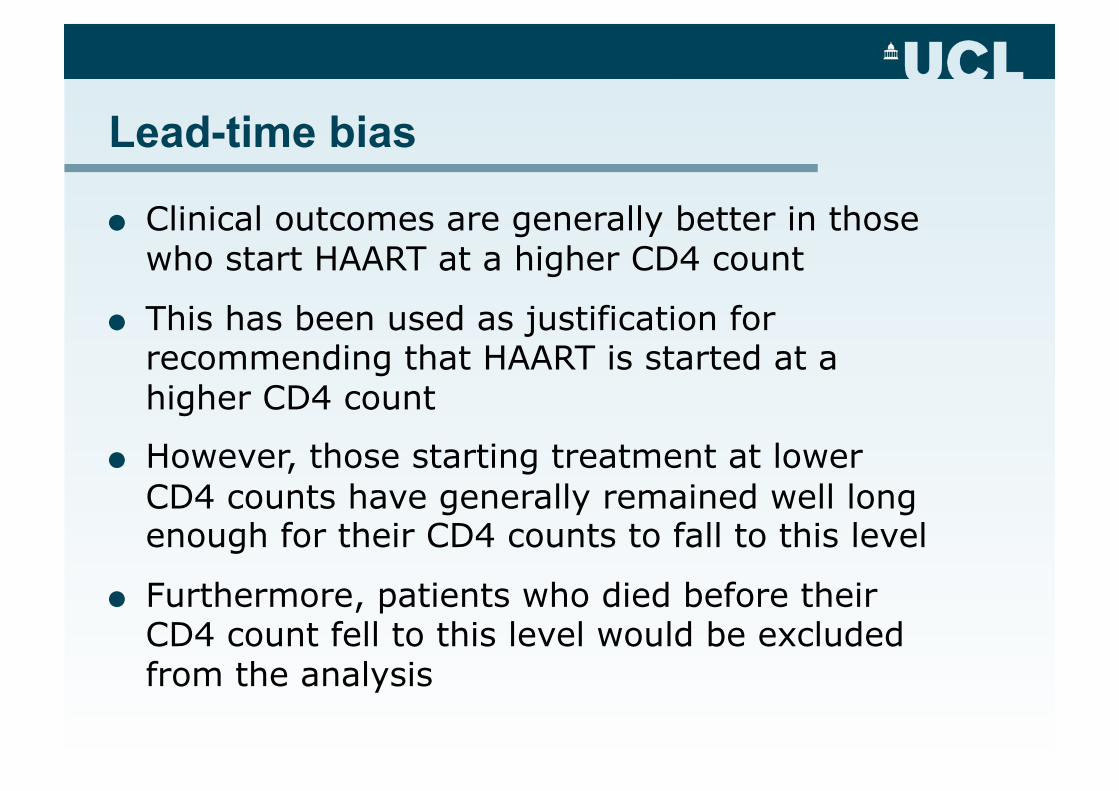
Lead-time bias
Clinical outcomes are generally better in those who start HAART at a higher CD4 count
This has been used as justification for recommending that HAART is started at a higher CD4 count
However, those starting treatment at lower CD4 counts have generally remained well long enough for their CD4 counts to fall to this level
Furthermore, patients who died before their CD4 count fell to this level would be excluded from the analysis
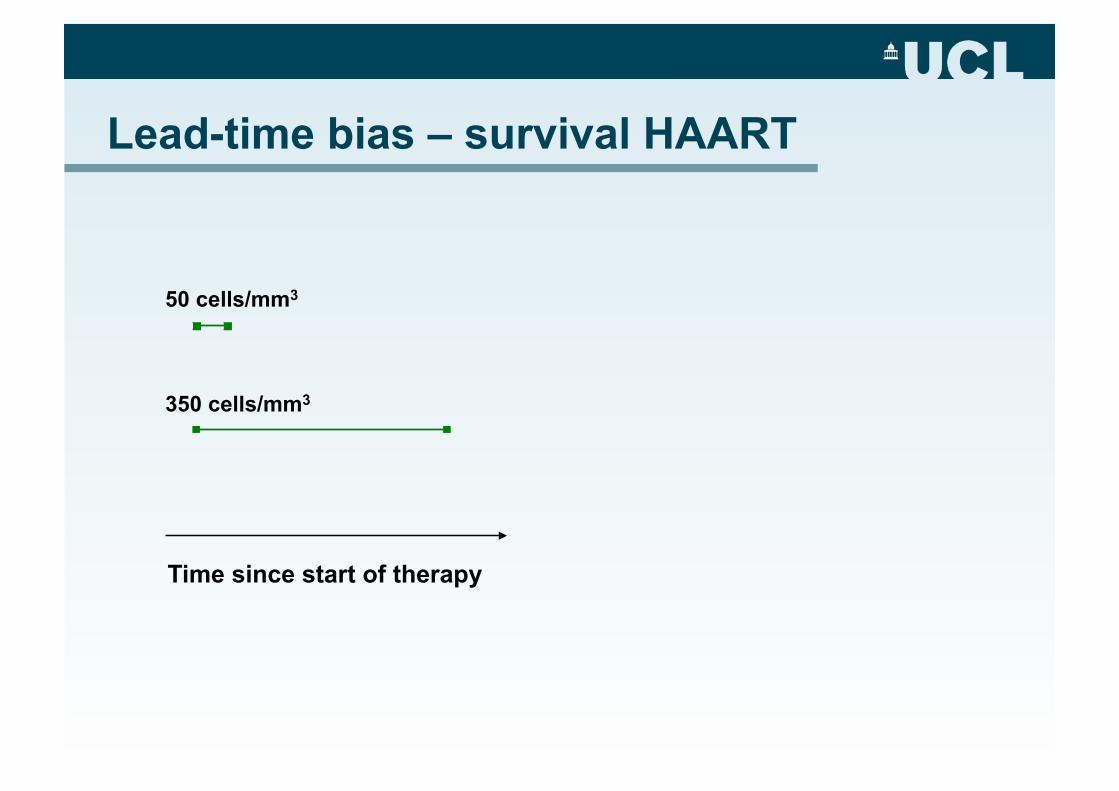
Lead-time bias – survival HAART
Time since start of therapy
50 cells/mm3
350 cells/mm3
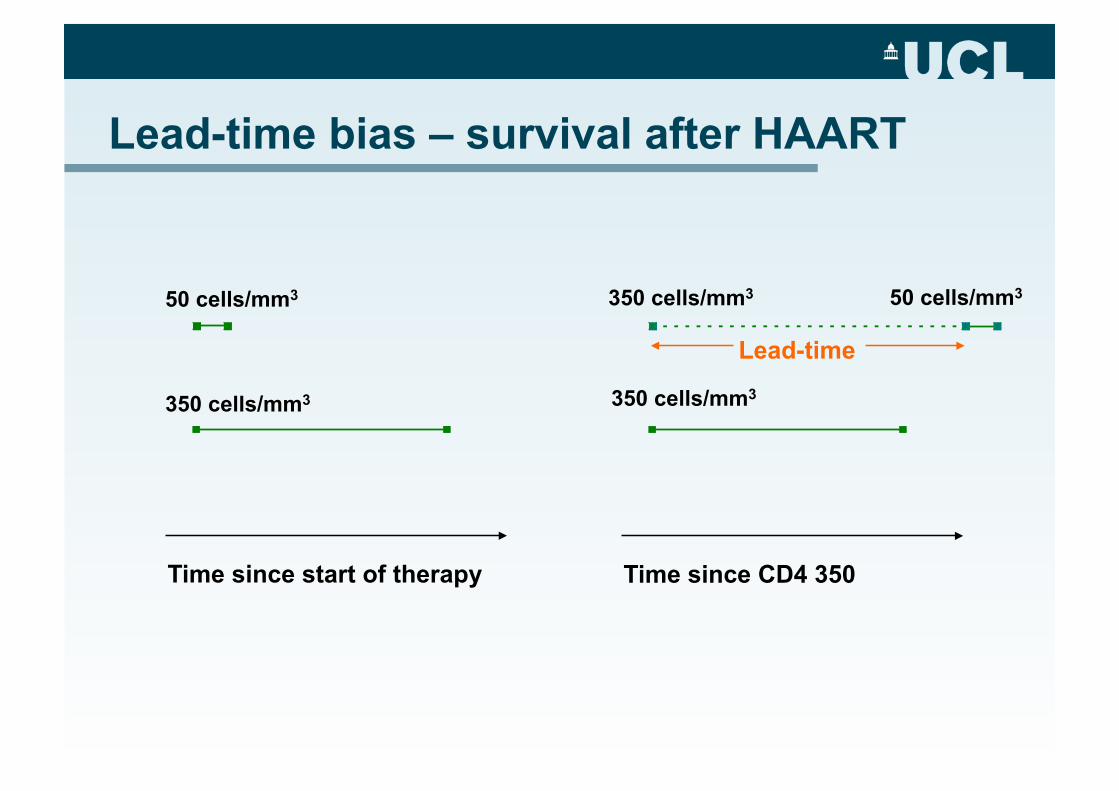
Lead-time bias – survival after HAART
Time since start of therapy
50 cells/mm3
350 cells/mm3
Time since CD4 350
50 cells/mm3
350 cells/mm3
Lead-time
350 cells/mm3
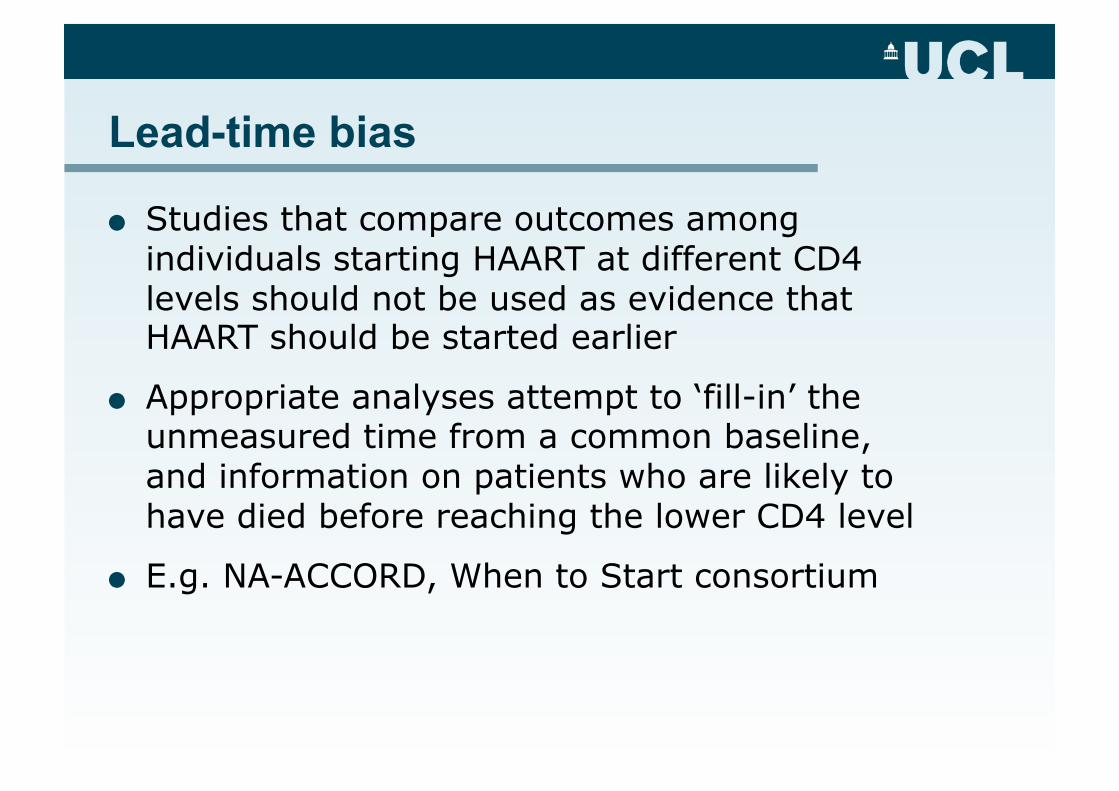
Lead-time bias
Studies that compare outcomes among individuals starting HAART at different CD4 levels should not be used as evidence that HAART should be started earlier
Appropriate analyses attempt to ‘fill-in’ the unmeasured time from a common baseline, and information on patients who are likely to have died before reaching the lower CD4 level
E.g. NA-ACCORD, When to Start consortium
Publication bias
Studies showing significant results are more likely to be published than those showing non-significant results
Bias is generally less marked when the study is large
When performing a systematic review it is important to obtain information on all studies performed, whether or not they have been published (e.g. abstracts, all journals including non-English language ones)
Dealing with bias due to missing data
• Data are often missing in observational databases
• This doesn’t reflect poor patient management, but reflects changing trends in patient monitoring as well as restricted access to laboratory data
• If data are missing ‘at random’, then analyses that exclude these patients will lack power
• If the data are not missing randomly, then the results of analyses may be biased
• Multiple imputation methods can be used
Example – dealing with bias in cohorts
• We wished to describe the risk of hepatotoxicity in patients treated with nevirapine (NVP) compared to those treated with efavirenz (EFV)
• As NVP treatment has already been associated with an increased risk of hepatotoxicity, it is likely that patients with high baseline ALTs will be treated with an alternative drug
• This may confound any relationships with outcome – we must ‘adjust’ for the baseline ALT in any analysis
Is NVP associated with a higher rate of liver abnormalities than EFV?
• Eligible patients: all ARV-naïve patients in UK CHIC who started treatment with either NVP (n=1785) or EFV (n=4338) from 1/1/2000 to 1/1/2006 (n=6123)
• Data from patients receiving NVP+EFV (n=24) shown for comparison
• Outcome variable: First ALT>200 IU after starting HAART
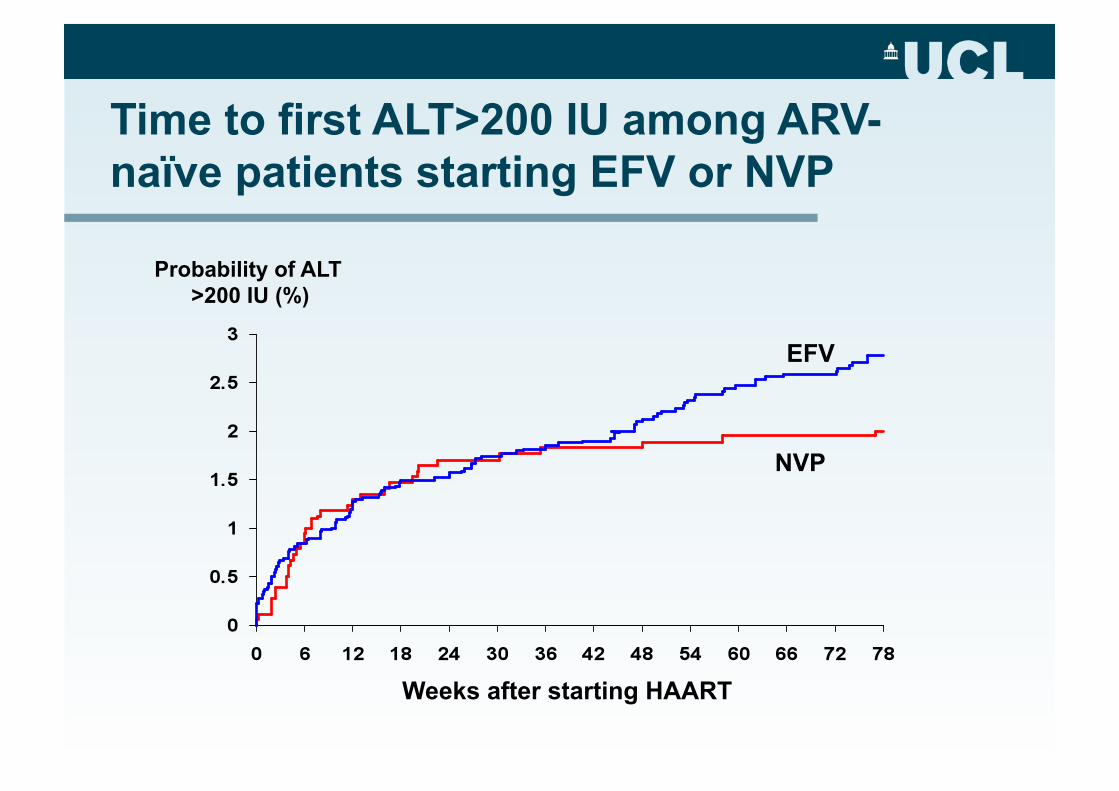
Time to first ALT>200 IU among ARV-naïve patients starting EFV or NVP
EFV
NVP
Probability of ALT >200 IU (%)
Weeks after starting HAART
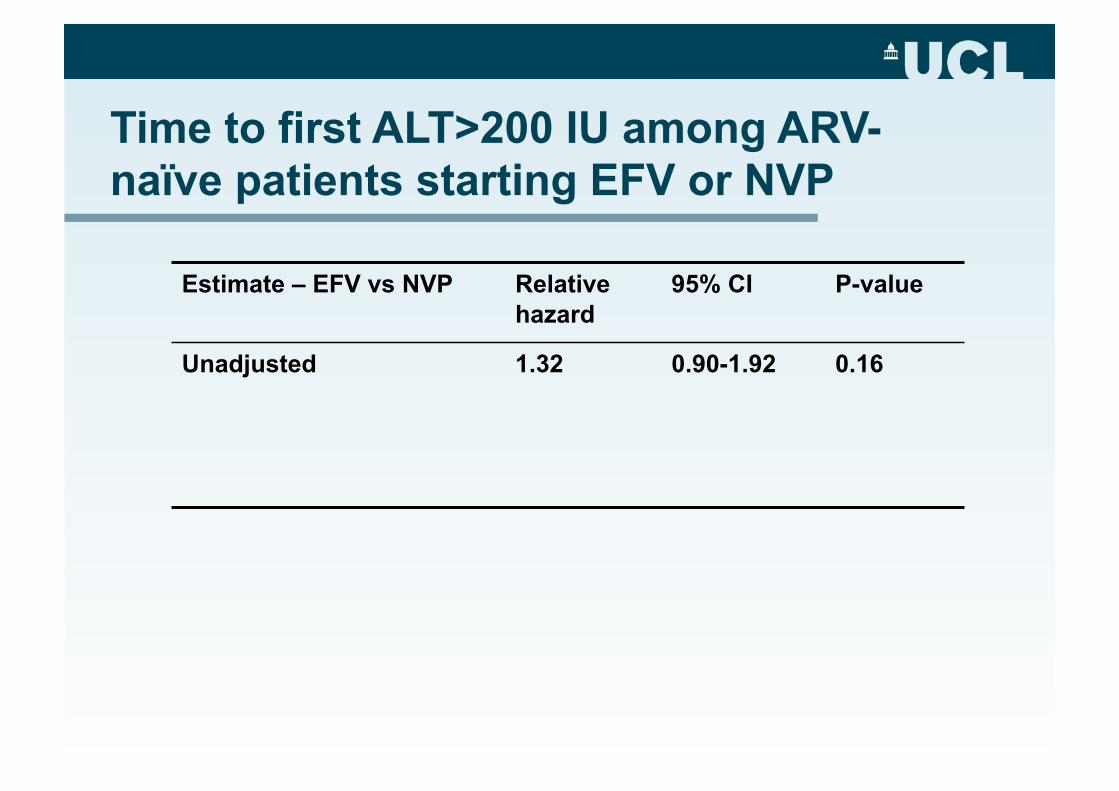
Time to first ALT>200 IU among ARV-naïve patients starting EFV or NVP
Estimate – EFV vs NVP Relative hazard
95% CI P-value
Unadjusted 1.32 0.90-1.92 0.16
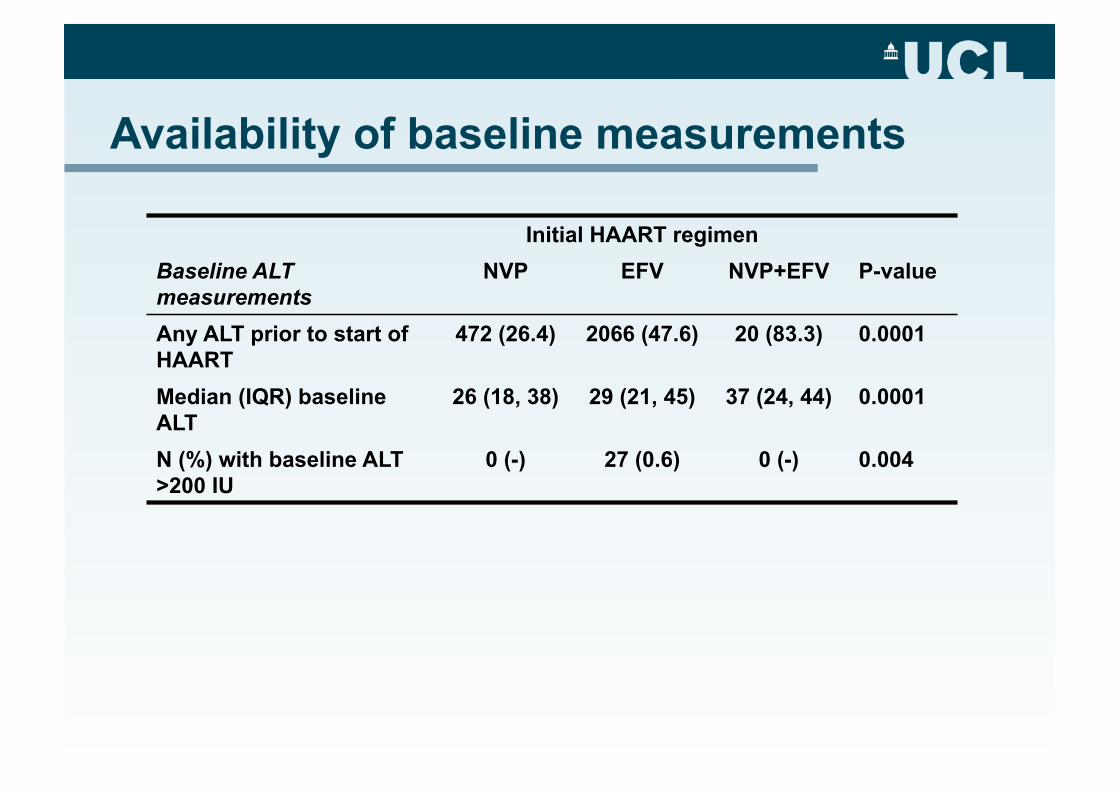
Availability of baseline measurements
Initial HAART regimen Baseline ALT measurements
NVP EFV NVP+EFV P-value
Any ALT prior to start of HAART
472 (26.4) 2066 (47.6) 20 (83.3) 0.0001
Median (IQR) baseline ALT
26 (18, 38) 29 (21, 45) 37 (24, 44) 0.0001
N (%) with baseline ALT >200 IU
0 (-) 27 (0.6) 0 (-) 0.004
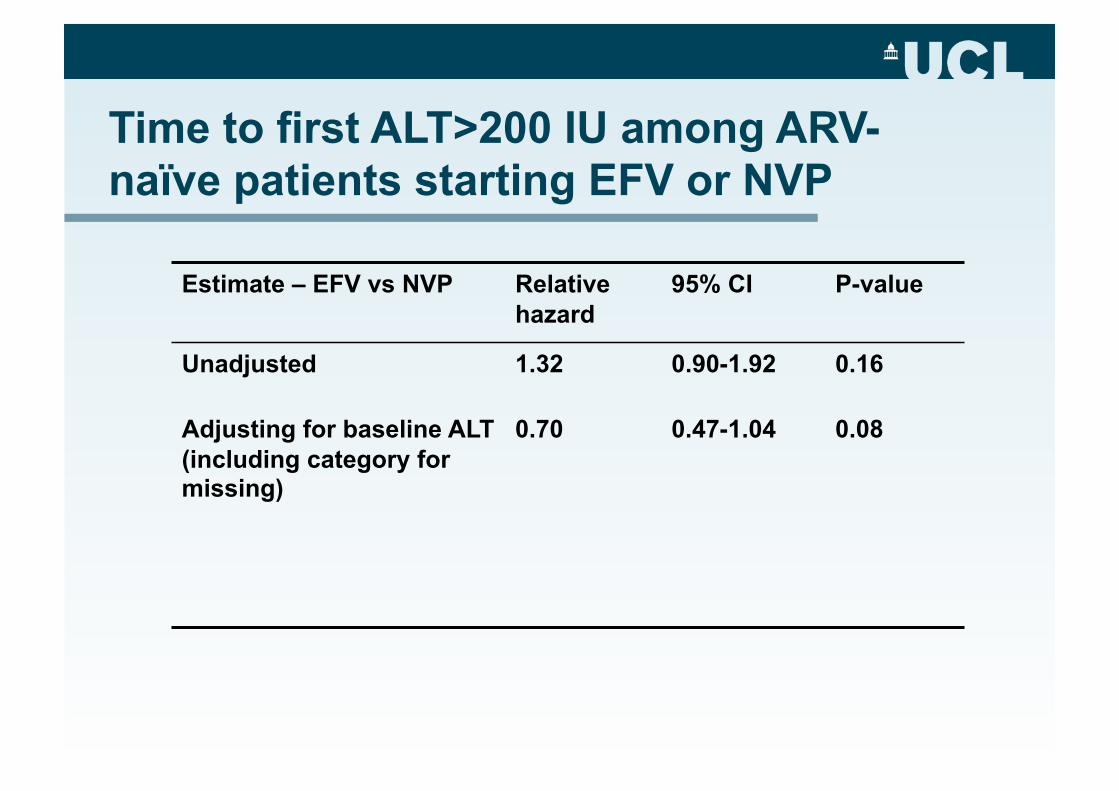
Estimate – EFV vs NVP Relative hazard
95% CI P-value
Unadjusted 1.32 0.90-1.92 0.16
Adjusting for baseline ALT (including category for missing)
0.70 0.47-1.04 0.08
Time to first ALT>200 IU among ARV-naïve patients starting EFV or NVP
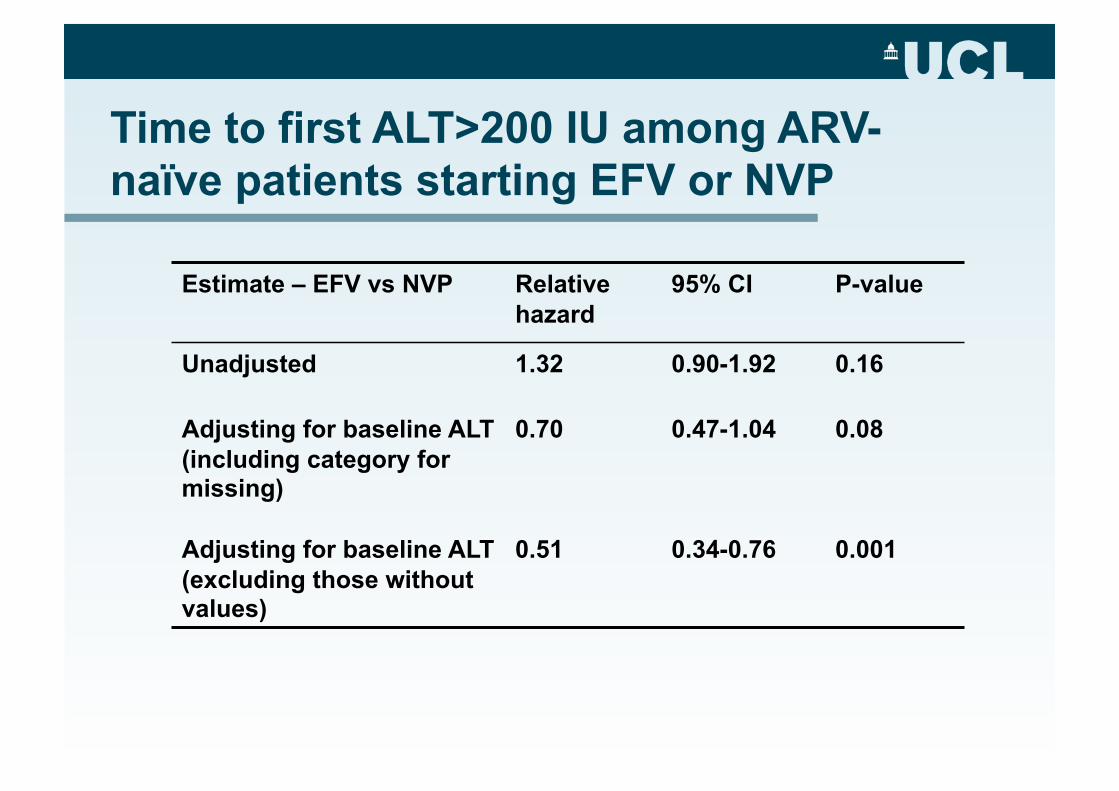
Estimate – EFV vs NVP Relative hazard
95% CI P-value
Unadjusted 1.32 0.90-1.92 0.16
Adjusting for baseline ALT (including category for missing)
0.70 0.47-1.04 0.08
Adjusting for baseline ALT (excluding those without values)
0.51 0.34-0.76 0.001
Time to first ALT>200 IU among ARV-naïve patients starting EFV or NVP
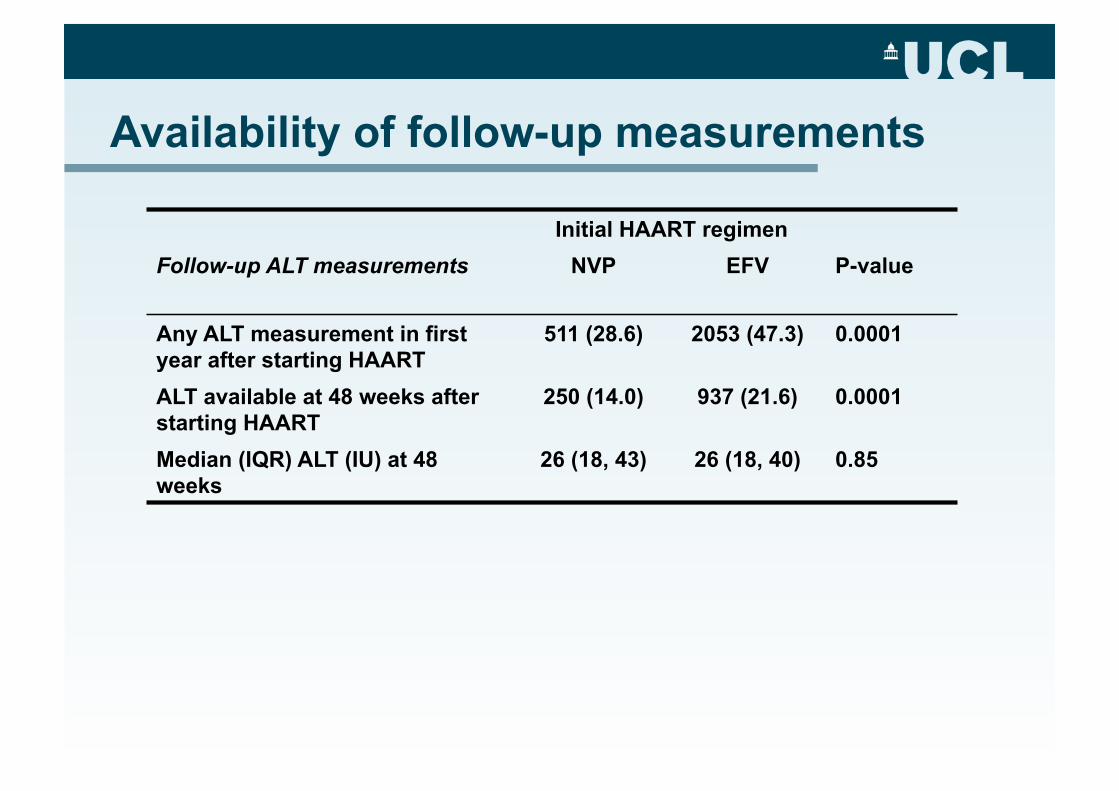
Availability of follow-up measurements
Initial HAART regimen Follow-up ALT measurements NVP EFV P-value
Any ALT measurement in first year after starting HAART
511 (28.6) 2053 (47.3) 0.0001
ALT available at 48 weeks after starting HAART
250 (14.0) 937 (21.6) 0.0001
Median (IQR) ALT (IU) at 48 weeks
26 (18, 43) 26 (18, 40) 0.85
Summary
If possible, should design studies to minimise the opportunities for bias
During analysis, must question whether bias may have been introduced at any stage (e.g. through loss-to-follow-up, missing data, differential follow-up, etc.)
Appropriate statistical methods may be used to minimise the impact of bias, but are unlikely to remove it fully