Embed Size (px)
Citation preview

February 5, 2018
The Packaging Conference
What Is America Drinking?U.S. Market Trends

-2- Copyright © 2018 Beverage Marketing Corp.
Unique Beverage Industry Expertise for Providing “Added-Value” to Selected Clients
Beverage Marketing Capabilities
Cutting Edge Insights: New Age Emergence, Multiple Beverage Competition, Specialty Beer Opportunity, Bottled Water Dominance, Hyper-Category Competition, Micro-
Marketing Age
Beverage Marketing Corporation utilizes an integrated model for providing information, analysis and advice to beverage industry clients

-3- Copyright © 2018 Beverage Marketing Corp.
Beverage Marketing Capabilities
All data in this presentation is supplied by:
With a special packaging module is by:

-4- Copyright © 2018 Beverage Marketing Corp.
The Shifting Beverage Landscape
Market Overview
Key Trends
Category Updates
Projections
Agenda

-5- Copyright © 2018 Beverage Marketing Corp.
Beverage Headlines
Liquid refreshment beverage market grew for fourth consecutive year in 2017 after flat performance in 2013; however, growth was slower in 2017 than in 2016
Carbonated soft drinks (CSDs) continued modest sales declines in 2017, and have now decreased annually for more than a decade
Bottled water widened its gap over CSDs as the largest beverage category in the U.S., driven primarily by the single-serve PET segment
Niche categories continue to outperform traditional mass-market categories with exception of bottled water
Wine and spirits led alcohol growth in 2017, and beer experienced essentially flat performance once again
State of the Industry – The Good and the Bad
1
2
3
4
5
The Shifting Beverage Landscape

-6- Copyright © 2018 Beverage Marketing Corp.
Unemployment Rate2000 – 2017
2012 2017
2.7%
1.9%
0.5%0.1%
2.8%
0.8%
3.1%
4.0%
-1.2%
4.0%
5.0%
2.3%2.0%
2.6%
2.0%
0.9%0.8%
1.4%
3.5%
1.9%
1.2%
3.1%3.2%
Q1 Q2 Q3 Q4 Q1 Q2 Q3 Q4 Q1 Q2 Q3 Q4 Q1 Q2 Q3 Q4 Q1 Q2 Q3 Q4 Q1 Q2 Q3
2013 2014 2015 2016
4.0%4.7%
5.8%6.0%
5.5%5.1%
4.6% 4.6%
5.8%
9.3%9.6%
9.0%
8.1%7.4%
6.2%
5.3%4.9%
4.4%
'00 '01 '02 '03 '04 '05 '06 '07 '08 '09 '10 '11 '12 '13 '14 '15 '16 '17
Quarterly GDP Change2011 – Q3 2017
The Shifting Beverage Landscape
The economy continues to move in a positive direction with improved GDP growth and lower unemployment, a key to successful beverage market performance
Source: Beverage Marketing Corporation; Bureau of Economic Analysis, Department of Commerce, Department of Labor

-7- Copyright © 2018 Beverage Marketing Corp.
Annual U.S. Consumer Sentiment Index1995 – 2017
Source: Thompson Reuters/University of Michigan
The Shifting Beverage Landscape
Consumer sentiment surpassed pre-recession levels in 2015 for the first time, but and increased modestly in 2017 after dipping in 2016
92 94103 105 106 108
89 90 8895 89 87 86
64 66 73 6876 79 84
93 9297
1995 1996 1997 1998 1999 2000 2001 2002 2003 2004 2005 2006 2007 2008 2009 2010 2011 2012 2013 2014 2015 2016 2017
-8- Copyright © 2018 Beverage Marketing Corp.
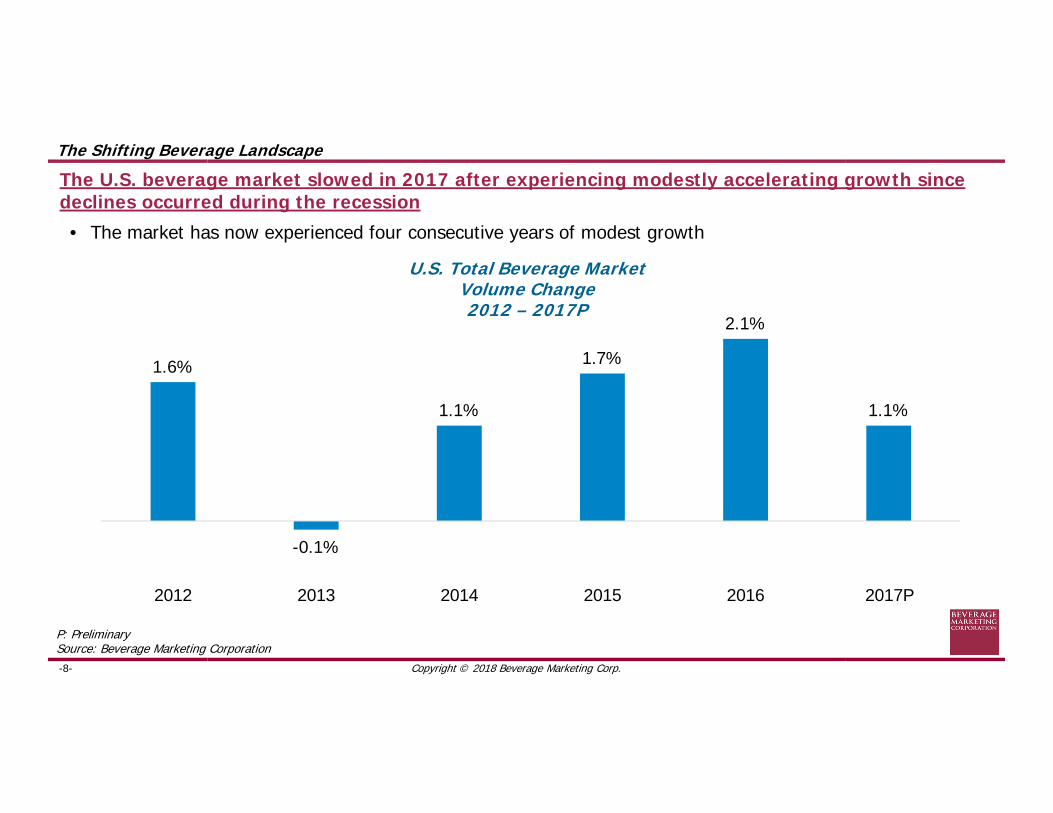
U.S. Total Beverage MarketVolume Change2012 – 2017P
P: PreliminarySource: Beverage Marketing Corporation
1.6%
-0.1%
1.1%
1.7%
2.1%
1.1%
2012 2013 2014 2015 2016 2017P
The U.S. beverage market slowed in 2017 after experiencing modestly accelerating growth since declines occurred during the recession
• The market has now experienced four consecutive years of modest growth
The Shifting Beverage Landscape

-9- Copyright © 2018 Beverage Marketing Corp.
U.S. Total Beverage MarketChange in Volume and Wholesale Dollars
2012 – 2017P
Revenues have grown consistently, and outpace volume performance due primarily to price increases, trend toward premiumization, and packaging mix shifts
1.3%
-0.1%
1.1%
1.7%
2.1%
1.1% 1.2%
3.4%
1.6%
2.7%2.3% 2.1% 2.1%
2.4%
2012 2013 2014 2015 2016 2017P 12/17P CAGR
Volume Change Wholesale Dollar Change
The Shifting Beverage Landscape
P: PreliminarySource: Beverage Marketing Corporation

-10- Copyright © 2018 Beverage Marketing Corp.
Key Factors Impacting 2017 Beverage Performance Slowdown
The Shifting Beverage Landscape
Nearly all beverage categories experienced a slowdown, especially in Q2 and Q3 of this year
Strong comparables from 2016
Modestly higher gas prices
C-store channel slowdown, possibly caused by slightly higher gas prices
Political uncertainty
More stay-at-home eating
Increased volume through difficult-to-track outlets like taprooms and coffee cafes
1
6
2
5
3
4

-11- Copyright © 2018 Beverage Marketing Corp.
In 2017, refreshment beverages performed best while other categories experienced weak performance and tap water declined
2.2%
0.1%
-0.8%
-1.7%
Refreshment Beverages Beverage Alcohol Traditional Beverages Tap Water
U.S. Beverage MarketVolume Change
2017P
The Shifting Beverage Landscape
P: PreliminarySource: Beverage Marketing Corporation
• Bottled Water• CSD• Energy Drinks• Fruit Bevs• RTD Coffee• RTD Tea• Sports Drinks• VA Water
• Hot Coffee• Hot Tea• Milk
• Beer• Spirits• Wine

-12- Copyright © 2018 Beverage Marketing Corp.
Estimated Tap WaterVolume Growth2000 – 2017P
-0.5%
-6.6%
-4.0% -5.3%-9.4% -11.5%
-2.6%
23.5%20.0%
1.3%5.5%
-2.7%
6.2%
-0.6%-5.2%
-10.7%
-1.7%
'00/01 '01/02 '02/03 '03/04 '04/05 '05/06 '06/07 '07/08 '08/09 '09/10 '10/11 '11/12 '12/13 '13/14 '14/15 '15/16 '16/17(P)
The Shifting Beverage Landscape
One reflection of a healthy beverage industry is the decline of tap water, and tap water consumption has been trending down in recent years
• Tap water consumption declined only modestly in 2017
P: PreliminarySource: Beverage Marketing Corporation

-13- Copyright © 2018 Beverage Marketing Corp.
Decade Comparison 2007 – 2017P
Which Categories Gained, Which Lost Volume?
4.5%
3.6%
7.5%
1.3%
1.8%
11.2%
-2.2%
-1.8%
0.9%
Category Millions of Gallons 2007/17P CAGR
350
2,998-2,382
-759
94
100
183
514
4,898
Total LRB
CSD
Fruit Beverages
RTD Coffee
Value-Added Water
Sports Drinks
Energy Drinks
RTD Tea
Bottled Water
Bottled water gained the most volume over the last 10 years while CSDs lost the mostThe Shifting Beverage Landscape
P: PreliminarySource: Beverage Marketing Corporation

-14- Copyright © 2018 Beverage Marketing Corp.
Traditional Key Consumer Drivers Are Evolving
Health and wellness Balanced nutrition
Premiumization Both LRBs and alcohol
Variety Flavors, seasonals, hybrids
Packaging Convenient and proprietary
1
The Shifting Beverage Landscape
4
2
3

-15- Copyright © 2018 Beverage Marketing Corp.
Health and Wellness RTD Categories in U.S. Beverage MarketVolume Share
SEGMENT Health & Wellness* All Other** TOTAL MARKET5-YR CAGR +3.6% -1.0% +0.7%
The Shifting Beverage Landscape
Health and wellness is a key market driver. Beverage categories with health and wellness attributes are outperforming those without
• Additionally, threats of sugar taxes may accelerate this trend toward better-for-you products
* Includes bottled water, milk, 100% juice, RTD tea, dairy alternatives, meal replacement drinks, value-added water, coconut water, kombucha, sports drinks, energy drinks and protein drinks** Includes CSDs, coffee (including RTD), tea (excluding RTD), fruit drinks, beer, wine, spirits and tap water P: PreliminarySource: Beverage Marketing Corporation
Health & Wellness*36.1%
Health & Wellness*41.4%
All Other**63.9%
All Other**58.6%
2012
2017P

-16- Copyright © 2018 Beverage Marketing Corp.
U.S. Liquid Refreshment Beverage MarketCalories Per Capita Per Day
1990 – 2017P
212.5
251.6 263.0243.7 238.0 230.3 222.7 214.8 212.1 208.0 204.9 200.7 200.2 200.2 200.9 198.0
1990 1995 2000 2005 2006 2007 2008 2009 2010 2011 2012 2013 2014 2015 2016 2017(P)
The Shifting Beverage Landscape
Caloric intake from refreshment beverages has been steadily declining over the last decade
• The growth of bottled water and lower-calorie options have contributed to the caloric decline, along with a concerted push by the industry
P: PreliminarySource: Beverage Marketing Corporation

-17- Copyright © 2018 Beverage Marketing Corp.
The Shifting Beverage Landscape
Premiumization: Both alcohol and non-alcoholic categories are going more premium. Consumers are trading up to more expensive products that they believe offer better overall quality or benefits

-18- Copyright © 2018 Beverage Marketing Corp.
New Beverage Product IntroductionsThousands of SKUs
2001 – 2016
1.7 1.6 2.0
2.92.6 2.6
3.2
3.8
2.7
3.9 4.0 4.44.7 4.5 4.3 4.4
2001 2002 2003 2004 2005 2006 2007 2008 2009 2010 2011 2012 2013 2014 2015 2016
The Shifting Beverage Landscape
New product introductions have risen since 2001 due to the emergence of new categories and heightened consumer demand for variety
Source: Beverage Marketing Corporation; Mintel

-19- Copyright © 2018 Beverage Marketing Corp.
HPP Juice
Cold Brew Coffee
Plant-based Water
Kombucha
Select Offerings and Categories of Today’s Emerging Beverages
Coconut Water
The Shifting Beverage Landscape
Beyond traditional mainstream categories and newer niche categories, a host of emerging categories have entered the market and most boast health and wellness attributes and/or promise specific functional benefits

-20- Copyright © 2018 Beverage Marketing Corp.
Dairy Alternatives
Probiotic Matcha
Select Offerings and Categories of Today’s Emerging Beverages
Protein/Sustenance
Premium Mixers
The Shifting Beverage Landscape
Emerging beverages have provided excitement to the marketplace although not all segments will prove successful in the long run

-21- Copyright © 2018 Beverage Marketing Corp.
The Shifting Beverage Landscape
Proprietary packaging: Growth in niche categories has propelled demand for unique packaging that makes a statement on the retail shelf

-22- Copyright © 2018 Beverage Marketing Corp.
The Shifting Beverage Landscape
Smaller packaging sizes have been a source of innovation and also help contribute to reduced caloric intake

-23- Copyright © 2018 Beverage Marketing Corp.
Beverage Packaging Share by Package Type*Billions of Packaging Units
SEGMENT Plastics Cans Glass Paper Pouches Aseptic TOTAL5-YR CAGR +4.8% -0.9% +0.6% -2.2% -4.2% -0.9% +1.4%
The Shifting Beverage Landscape
Cans, plastic and glass comprise more than 90% of the beverage packaging universe
• Over the last five years, plastic has seen the most growth due mostly to the success of the bottled water category
* Includes Milk, does not include Beer kegs Source: Beverage Marketing Corporation
Plastic36.4%
Plastic42.9%
Cans40.1%
Cans35.7%
Glass15.0%
Glass14.4%
Paper6.1%
Paper5.1%
Pouches1.3%
Pouches1.0%
Aseptic1.0%
Aseptic0.9%
2012
2017P
-24- Copyright © 2018 Beverage Marketing Corp.
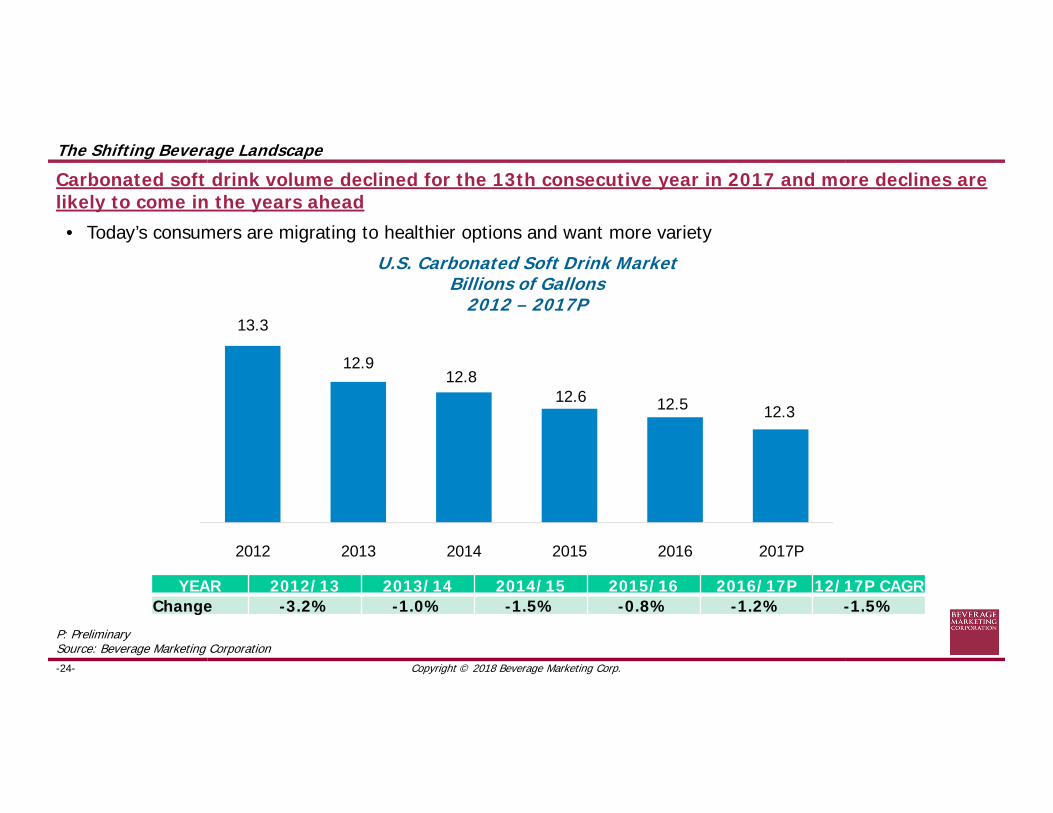
U.S. Carbonated Soft Drink MarketBillions of Gallons
2012 – 2017P13.3
12.912.8
12.6 12.5 12.3
2012 2013 2014 2015 2016 2017P
YEAR 2012/13 2013/14 2014/15 2015/16 2016/17P 12/17P CAGRChange -3.2% -1.0% -1.5% -0.8% -1.2% -1.5%
The Shifting Beverage Landscape
Carbonated soft drink volume declined for the 13th consecutive year in 2017 and more declines are likely to come in the years ahead
• Today’s consumers are migrating to healthier options and want more variety
P: PreliminarySource: Beverage Marketing Corporation

-25- Copyright © 2018 Beverage Marketing Corp.
Stevia/Erythritol Stevia/Erythritol Stevia/Erythritol
Sugar/Stevia Sugar/Stevia Stevia
The Shifting Beverage Landscape
Search for zero-calorie sweeteners continue; ideal sweetener should be natural, stable, in good supply, cost effective, and taste like sugar

-26- Copyright © 2018 Beverage Marketing Corp.
The Shifting Beverage Landscape
Besides natural zero-calorie sweeteners, marketers are seeking novel ways to engage the carbonated beverage consumer – some times with products outside the CSD category

-27- Copyright © 2018 Beverage Marketing Corp.
Broader product portfolio in a range of formats appeals to array of consumer need states
Heightened focus on high-margin, high-growth segments such as RTD coffee and tea
Enhanced nationwide distribution capabilities combining each company’s strengths
Proven and experienced beverage industry management team
$600 million in annual cost savings by 2021
12
34
5
The Shifting Beverage Landscape
The acquisition of DPSG by Keurig provides a range of synergies
Source: Beverage Marketing Corporation
But also poses some questions and challenges
Is strategic rationale sound?
Can new company manage complexity of integration seamlessly?
1
2

-28- Copyright © 2018 Beverage Marketing Corp.
The Shifting Beverage Landscape
The acquisition of DPSG by Keurig helps to fill in product portfolio voids
DPSG and Keurig Product Portfolios
1McKinsey Retail Dollar Estimates for 2011 to 2016, based on Beverage Digest, Nielsen and Euromonitor; US + Canada; excludes non-packaged formats (e.g. CSD Fountain, Coffee Shop Retail locations

-29- Copyright © 2018 Beverage Marketing Corp.
Heightened consumer demand for healthier refreshment and variety
Legislation and messaging from government and regulatory agencies
Tax threats aimed at reducing consumption
Negative commentary from medical studies
Steady drumbeat of negative press
1
2
3
4
5
The Shifting Beverage Landscape
Consumer health and variety demands negatively impact CSD consumption. CSD category performance is further impacted by other external factors that contribute to consumption declines
Source: Beverage Marketing Corporation

-30- Copyright © 2018 Beverage Marketing Corp.
U.S. Bottled Water MarketBillions of Gallons
2012 – 2017P
9.7 10.210.9
11.812.8
13.7
2012 2013 2014 2015 2016 2017P
YEAR 2012/13 2013/14 2014/15 2015/16 2016/17P 12/17P CAGRChange +4.8% +7.4% +8.0% +8.5% +6.7% +7.1%
The Shifting Beverage Landscape
Bottled water has experienced healthy growth each year since the recession
• The category is aided by its positioning as the ultimate health beverage
• The category now is now the largest beverage category in the U.S.
P: PreliminarySource: Beverage Marketing Corporation

-31- Copyright © 2018 Beverage Marketing Corp.
U.S. Retail PET Water MarketBranded vs. Private Label
SEGMENT PRIVATE LABEL BRANDED TOTAL5-YR CAGR +12.5% +3.8% +7.7%
The Shifting Beverage Landscape
Private label PET water accounts for virtually half of the single-serve market today
P: PreliminarySource: Beverage Marketing Corporation
Branded59.5%
Branded50.4%
Private Label40.5%
Private Label49.6%
2012
2017P

-32- Copyright © 2018 Beverage Marketing Corp.
The Shifting Beverage Landscape
Sparkling water is on fire – fastest growing segment in the bottled water category

-33- Copyright © 2018 Beverage Marketing Corp.
Enhanced Waters
PH Balanced Water Plant WaterEssence Water Space Age Water
The Shifting Beverage Landscape
Similar to craft soda, from a small base, enhanced waters of all types are now proliferating and gaining traction in all parts of the country
• These premium value, craft type waters are adding additional benefits to consumers’ water experience beyond vitamins and minerals

-34- Copyright © 2018 Beverage Marketing Corp.
Projected Water & CSD GrowthMillions of Gallons
2011 – 2021P
0
3000
6000
9000
12000
15000
18000
2011 2012 2013 2014 2015 2016P 2017P 2018P 2019P 2020P 2021P
Bulk, HOD, Vended, Sparkling, Imported Waters
Premium Retail PET Waters
CSDs10-Yr CAGR: -1.4%
Enhanced Water
Flavored Water
The Shifting Beverage Landscape
Bottled water became the leading beverage catetgory in the U.S. on a volume basis in 2016, surpassing CSDs and widened its volume gap in 2017
• As CSDs continue to decline and bottled water continues to grow, the gap between the two categories is only likely to widen even more
• On a dollar basis, CSDs continue to be larger than bottled water however
P: ProjectedSource: Beverage Marketing Corporation

-35- Copyright © 2018 Beverage Marketing Corp.
The Shifting Beverage Landscape
Consumers
Shopping
Product
Technology
• Using digital to articulate needs
• Fulfill needs
• Aids in safety of product
Voice
• Shop faster
• Swift convenience
• Authenticity
• Some personalization
• Wellness as status symbol vs material things
• Younger consumers have voice in purchase decision
• Older consumers are articulate ambassadors
Summary
The ability of beverage companies to address global consumer trends will impact their performances in the future
• Consumer trends can be placed in four bucketsGlobal Consumer Trends
Source: Beverage Marketing Corporation; Euromonitor International
-36- Copyright © 2018 Beverage Marketing Corp.
$1B
High Growth
Low Growth
$500M
20%
0%
-5%
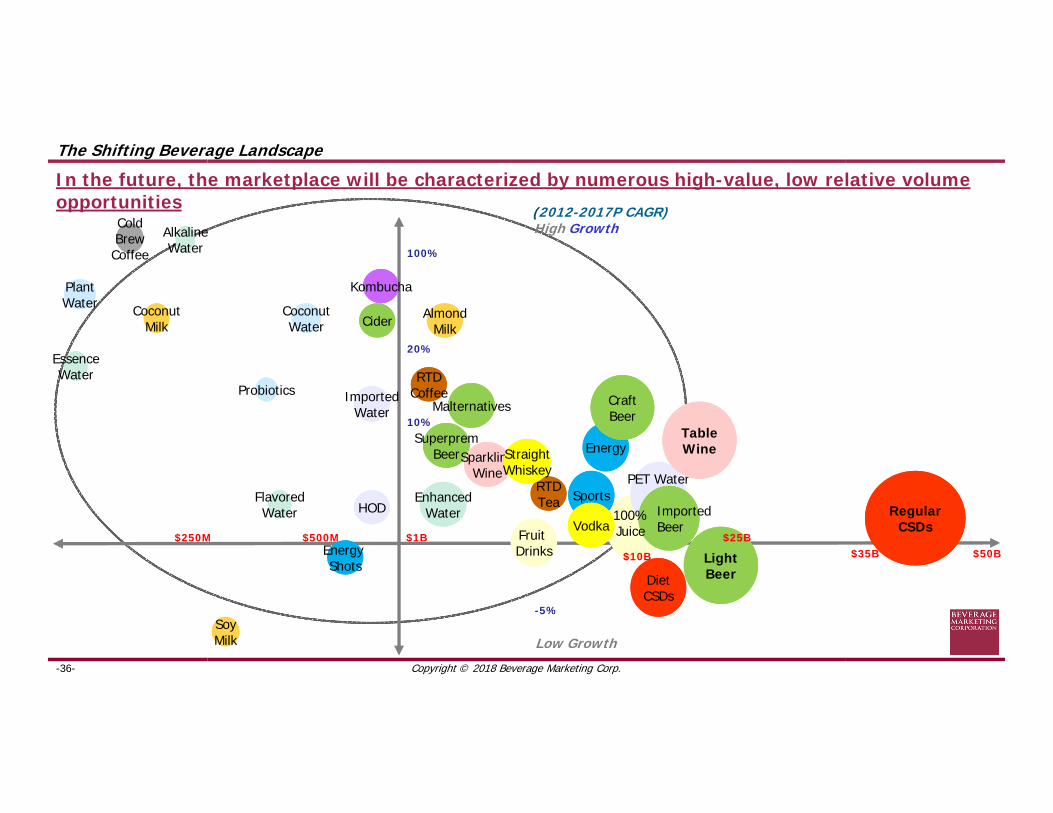
(2012-2017P CAGR)
$250M$35B $50B
10%
The Shifting Beverage Landscape
In the future, the marketplace will be characterized by numerous high-value, low relative volume opportunities
RegularCSDs
HOD
ImportedWater
EnhancedWater
FlavoredWater
EssenceWater
AlkalineWater 100%
PET Water
Fruit Drinks $10B
DietCSDs
Sports
Energy
RTDCoffee
RTDTea
SoyMilk
AlmondMilk
CoconutMilk Cider
CraftBeer
Malternatives
ImportedBeer
100% Juice
LightBeer
$25B
SuperpremBeer
TableWineSparkling
WineStraightWhiskey
Vodka
Kombucha
CoconutWater
Probiotics
PlantWater
ColdBrewCoffee
Energy Shots

Thank You
• Strategic Associates
• Research
• Advisors
Beverage Marketing Corporation