Embed Size (px)
Citation preview
program
Is it safe to go swimming? Monitoring has shown that wet weather, and resultant
contaminated stormwater, can adversely affect local
water quality for both swimming and boating.
Council has developed a ‘real time’ swimming risk
indicator system based on water salinity data collected
from five water quality monitoring buoys.
Check out the swimming risk indicator
at hornsby.nsw.gov.au/waterquality
Help prevent stormwater pollution!Do your bit … STOP car wash detergent, paint, excess
garden fertilisers and pesticides, grass clippings,
cigarette butts and any other litter from ending
up in our gutters, stormwater drains and local creeks.
Remember... the drain is just for rain
Natural Resources BranchHornsby Shire Council 296 Pacific Highway, HornsbyPO Box 37, Hornsby NSW 1630
Telephone 9847 68748.30am-5pm Monday to Friday
hornsby.nsw.gov.au/water
Ph
oto
by: Daniel N
olan
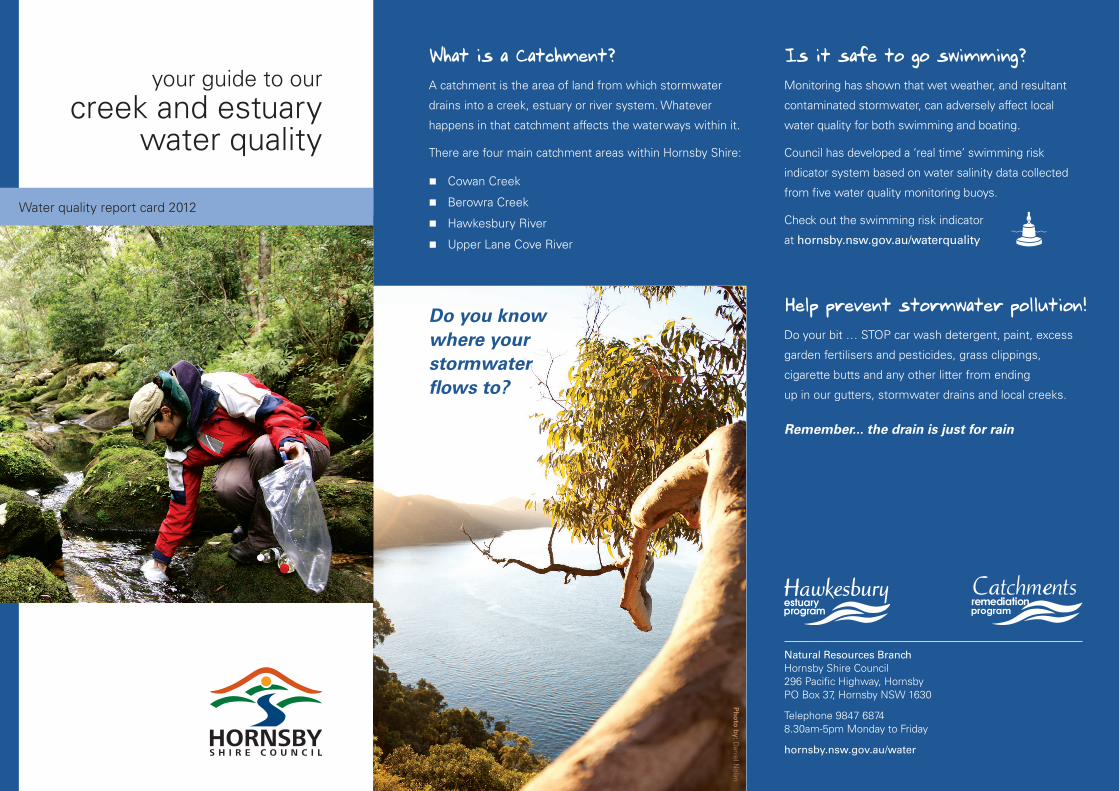
What is a Catchment?A catchment is the area of land from which stormwater
drains into a creek, estuary or river system. Whatever
happens in that catchment affects the waterways within it.
There are four main catchment areas within Hornsby Shire:
�� Cowan Creek
�� Berowra Creek
�� Hawkesbury River
�� Upper Lane Cove River
Do you know where your stormwater flows to?
your guide to ourcreek and estuary
water quality
Water quality report card 2012
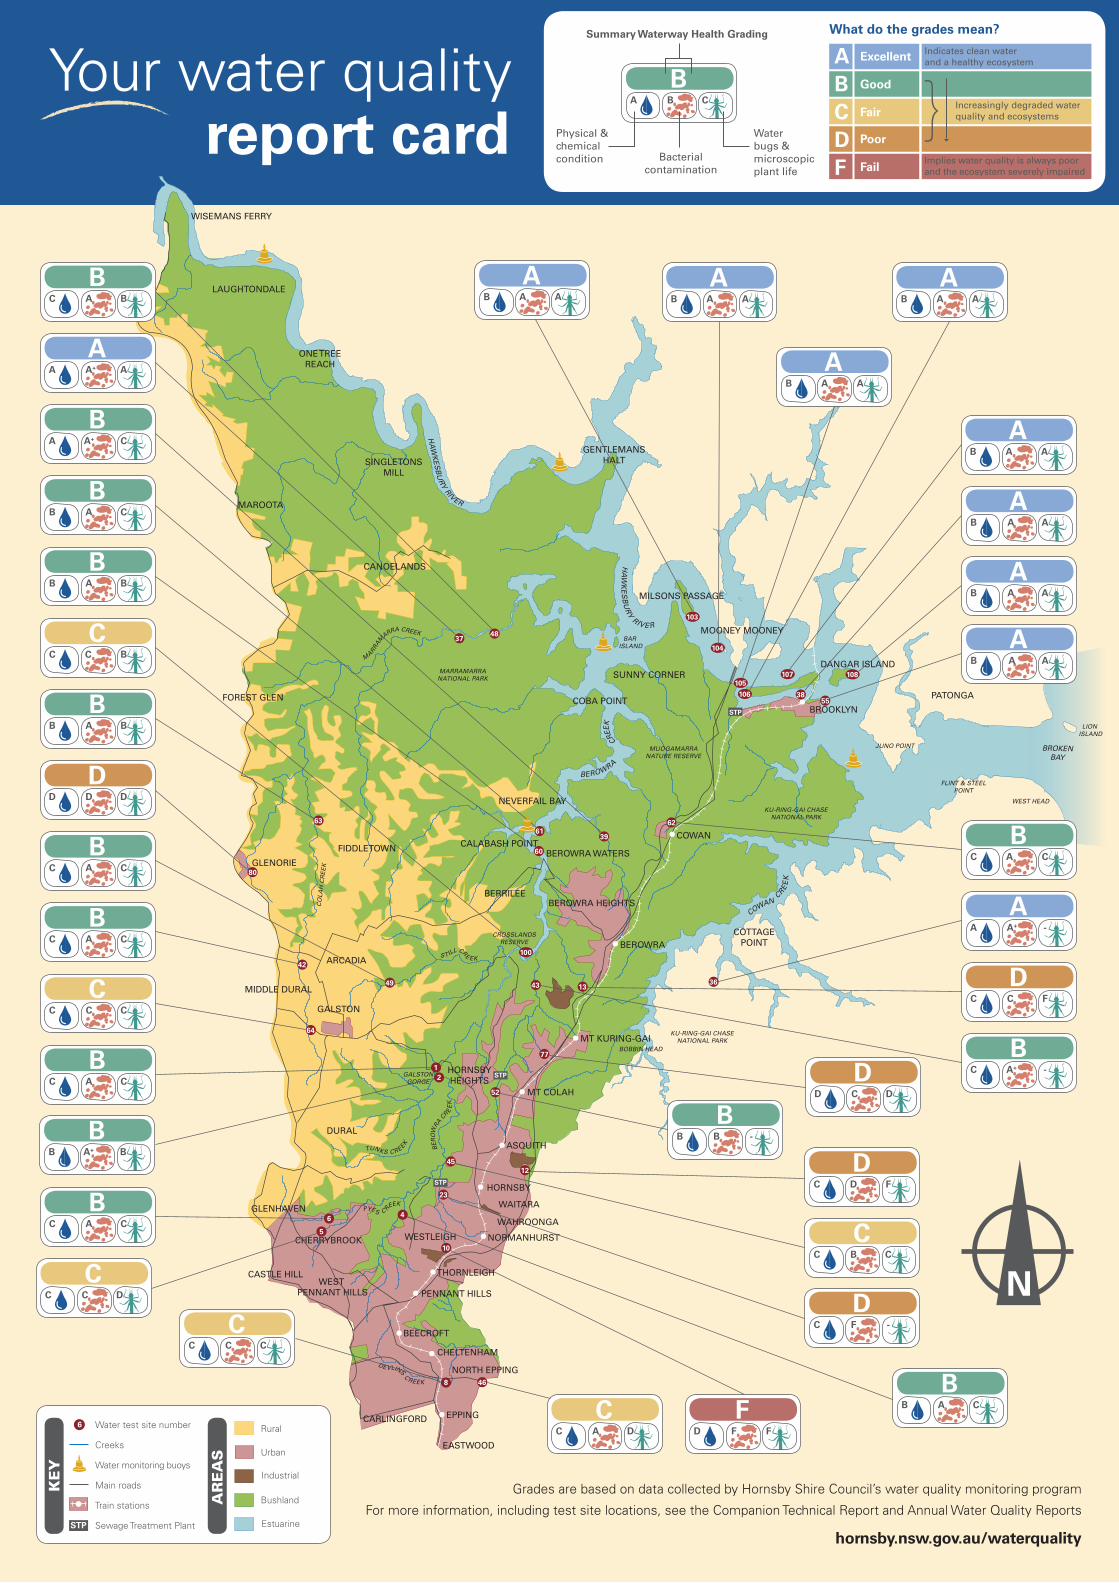
Findings (see centrefold Water Quality Report Card)
�� National Park ‘reference’ creeks (test sites 36 and 37) and estuarine test sites have the best water quality
�� Generally fair to poor water quality is found just downstream of our developed urban and rural areas
�� The most polluted water is sampled around our industrial estates (test sites 10, 12 and 13)
�� During heavy rain, water quality decreases because water becomes contaminated with suspended solids, nutrients and bacteria washed off the catchment
�� Wet weather can cause a higher incidence of sewer overflows
�� Very few creeks within Hornsby Shire are not impacted in some way by human development
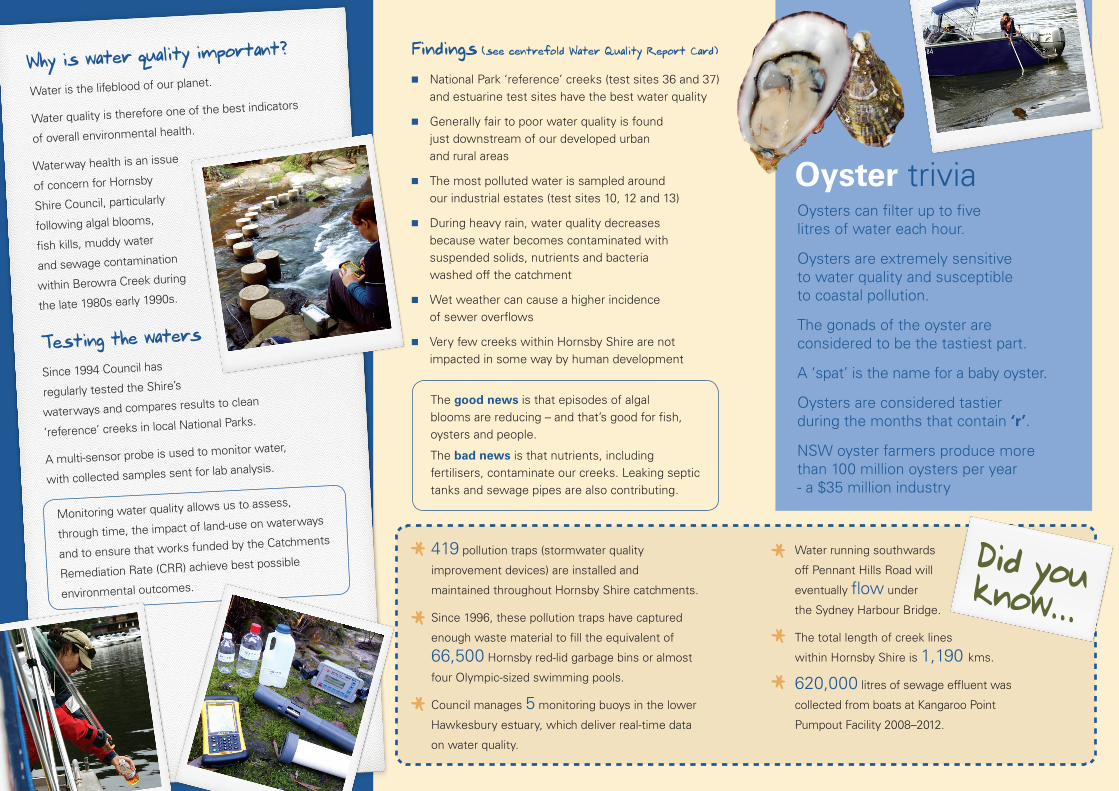
Why is water quality important?
Water is the lifeblood of our planet.
Water quality is therefore one of the best indicators
of overall environmental health.
Waterway health is an issue
of concern for Hornsby
Shire Council, particularly
following algal blooms,
fish kills, muddy water
and sewage contamination
within Berowra Creek during
the late 1980s early 1990s.
Testing the waters
Since 1994 Council has
regularly tested the Shire’s
waterways and compares results to clean
‘reference’ creeks in local National Parks.
A multi-sensor probe is used to monitor water,
with collected samples sent for lab analysis.
419 pollution traps (stormwater quality
improvement devices) are installed and
maintained throughout Hornsby Shire catchments.
Since 1996, these pollution traps have captured
enough waste material to fill the equivalent of
66,500 Hornsby red-lid garbage bins or almost
four Olympic-sized swimming pools.
Council manages 5 monitoring buoys in the lower
Hawkesbury estuary, which deliver real-time data
on water quality.
Water running southwards
off Pennant Hills Road will
eventually flow under
the Sydney Harbour Bridge.
The total length of creek lines
within Hornsby Shire is 1,190 kms.
620,000 litres of sewage effluent was
collected from boats at Kangaroo Point
Pumpout Facility 2008–2012.
*
*
*
*
*
Monitoring water quality allows us to assess,
through time, the impact of land-use on waterways
and to ensure that works funded by the Catchments
Remediation Rate (CRR) achieve best possible
environmental outcomes.
Did you know...
The good news is that episodes of algal blooms are reducing – and that’s good for fish, oysters and people.
The bad news is that nutrients, including fertilisers, contaminate our creeks. Leaking septic tanks and sewage pipes are also contributing.
Oysters can filter up to five litres of water each hour.
Oysters are extremely sensitive to water quality and susceptible to coastal pollution.
The gonads of the oyster are considered to be the tastiest part.
A ‘spat’ is the name for a baby oyster.
Oysters are considered tastier during the months that contain ‘r’.
NSW oyster farmers produce more than 100 million oysters per year - a $35 million industry
Oyster trivia
*
WISEMANS FERRY
108
MARRAM
ARRA CREEK
EASTWOOD
EPPINGCARLINGFORD
CHELTENHAM
NORTH EPPING
BEECROFT
CASTLE HILLWEST
PENNANT HILLS
CHERRYBROOK
GLENHAVEN
PENNANT HILLS
THORNLEIGH
NORMANHURST
WAITARA
WAHROONGA
HORNSBY
DURAL
MIDDLE DURAL
GLENORIE
MOONEY MOONEY
SUNNY CORNER
LAUGHTONDALE
SINGLETONSMILL
HA
WK
ESB
URY RIVER
GALSTON
ARCADIA
HORNSBYHEIGHTS
ASQUITH
MT COLAH
MT KURING-GAI
BEROWRA
BEROWRA HEIGHTS
BEROWRA WATERS
BERRILEE
CALABASH POINT
NEVERFAIL BAY
COWAN
BROOKLYN
CANOELANDS
MAROOTA
COBA POINT
BEROWRA
CREE
K
WESTLEIGH
ONE TREEREACH
GENTLEMANSHALT
FOREST GLEN
BAR ISLAND
HA
WK
ES
BU
RY R IVE R
MILSONS PASSAGE
DANGAR ISLAND
JUNO POINTMUOGAMARRANATURE RESERVE
KU-RING-GAI CHASENATIONAL PARK
COTTAGEPOINT
MARRAMARRANATIONAL PARK
FIDDLETOWN
CO
LAH
CR
EE
K
GALSTONGORGE
PATONGA
FLINT & STEELPOINT
WEST HEAD
LION ISLAND
CREE
K
COWAN
KU-RING-GAI CHASENATIONAL PARK
BOBBIN HEAD
CROSSLANDSRESERVE
BER
OW
RA C
R EE
K
TUNKS CREEK
PYES C REEK
DEVLINS CREEK
S TILL CR
E EK
BROKENBAY
4837
103
104
105
106 3855
107
36
62
3961
60
8 46
6
5
4
12
10
23
1245
52
77
80
63
42
64
100
49 43 13
Bushland
Water test site number
Main roads
Creeks
Estuarine
Rural
Urban
Industrial
N
Your water quality
BB A+ B
BC A C
CC C C
BC A C
BC A C
DD D D
BB A B
BC A C
CC C D
CC C C
CC A D
FD F F
BB A C
BB B -
AA A+ A
BC A B
BB A C
BB A B
BA A+ C
CC C B
BC A+ -
DC C F
AA A+ -
BC A C
AB A A
AB A A
AB A A
AB A A
AB A A
AB A A
AB A A
AB A A
Water monitoring buoys
BA B C
report card
Summary Waterway Health Grading
Physical &chemicalcondition Bacterial
contamination
Water bugs & microscopic plant life
What do the grades mean?
KEY
AREAS
Train stations
6
DC F -
CC B C
DC D F
DD C D
Grades are based on data collected by Hornsby Shire Council’s water quality monitoring program
For more information, including test site locations, see the Companion Technical Report and Annual Water Quality Reports
hornsby.nsw.gov.au/waterquality
Excellent
Good
Fair
Poor
Fail
STP
Sewage Treatment PlantSTP
STP
STP
Indicates clean water and a healthy ecosystem
Implies water quality is always poor and the ecosystem severely impaired
} Increasingly degraded water quality and ecosystems
ABCDF