Embed Size (px)
Citation preview

What I learned by Doing Capitalism
Dr William H Janeway Director of Magnet Systems, Nuance Communications, O'Reilly Media
Author, Doing Capitalism in the Innovation Economy: Markets, Speculation and the State
Professor Dimitri Vayanos Professor of Finance and Director of the Paul Woolley Centre for the Study of Capital Market
Dysfunctionality, LSE
Professor Craig Calhoun Chair, LSE
LSE public lecture
Suggested hashtag for Twitter users: #LSEJaneway
What I Learned by Doing Capitalism
William H. Janeway
London School of Economics
11 October 2012
2
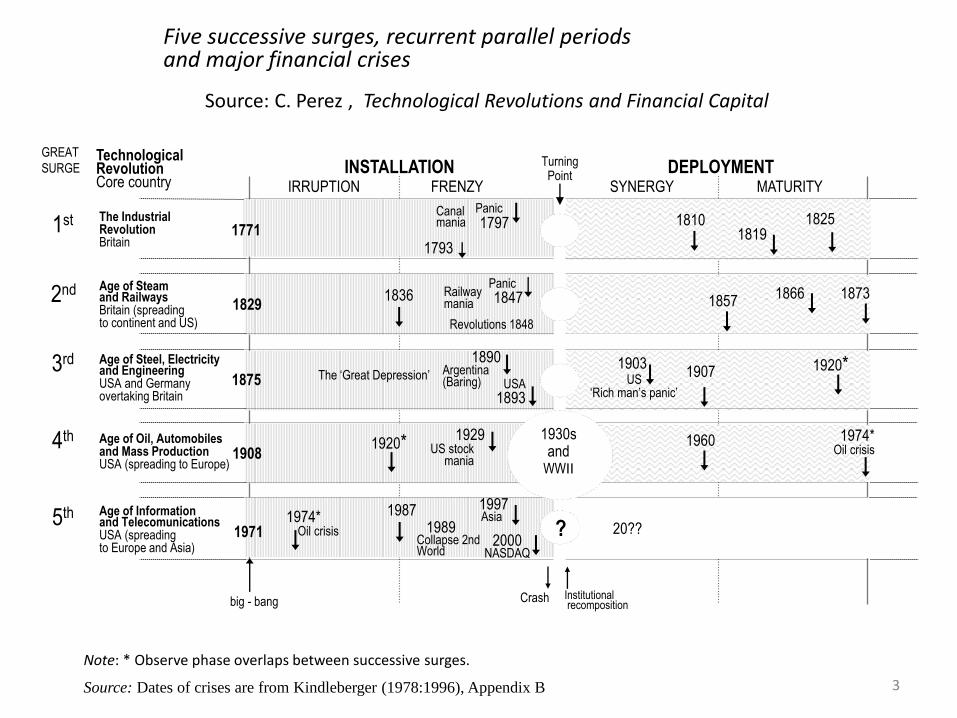
Five successive surges, recurrent parallel periods and major financial crises
Crash Institutional recomposition
The Industrial Revolution Britain
Age of Steam and Railways Britain (spreading to continent and US)
Age of Steel, Electricity and Engineering USA and Germany overtaking Britain
Age of Oil, Automobiles and Mass Production USA (spreading to Europe)
Age of Information and Telecomunications USA (spreading to Europe and Asia)
1829
1875
20??
Turning Point
1771
1908
1971
big - bang
INSTALLATION DEPLOYMENT IRRUPTION FRENZY SYNERGY MATURITY
Technological Revolution Core country
1st
2nd
3rd
4th
5th
GREAT
SURGE
Canal mania 1797
Panic 1810
1819 1825
1793
Railway mania 1847
Panic
Revolutions 1848
1866 1873 1836 1857
1907 The ‘Great Depression’
1890 Argentina (Baring) USA
1893
1920* 1903 US
‘Rich man’s panic’
1929 1960 1920* US stock mania
1974* Oil crisis
1930s and
WWII
1987 1997
Collapse 2nd World
Asia
2000 NASDAQ
1974* Oil crisis 1989 ?
Source: Dates of crises are from Kindleberger (1978:1996), Appendix B
Note: * Observe phase overlaps between successive surges.
3
Source: C. Perez , Technological Revolutions and Financial Capital
4
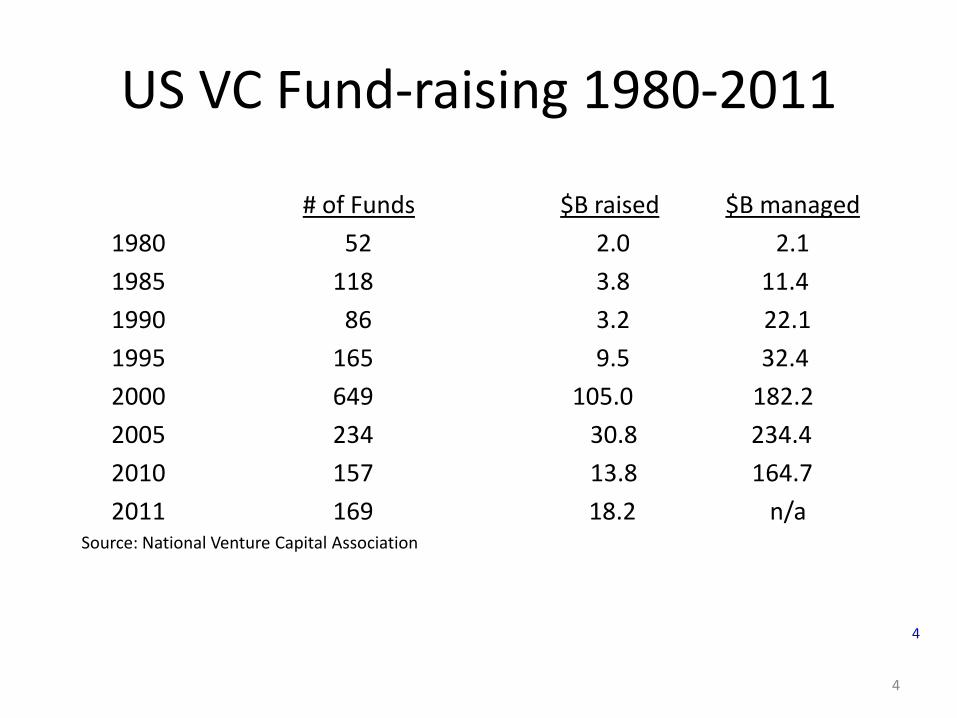
US VC Fund-raising 1980-2011
# of Funds $B raised $B managed
1980 52 2.0 2.1
1985 118 3.8 11.4
1990 86 3.2 22.1
1995 165 9.5 32.4
2000 649 105.0 182.2
2005 234 30.8 234.4
2010 157 13.8 164.7
2011 169 18.2 n/a Source: National Venture Capital Association
4
5 5
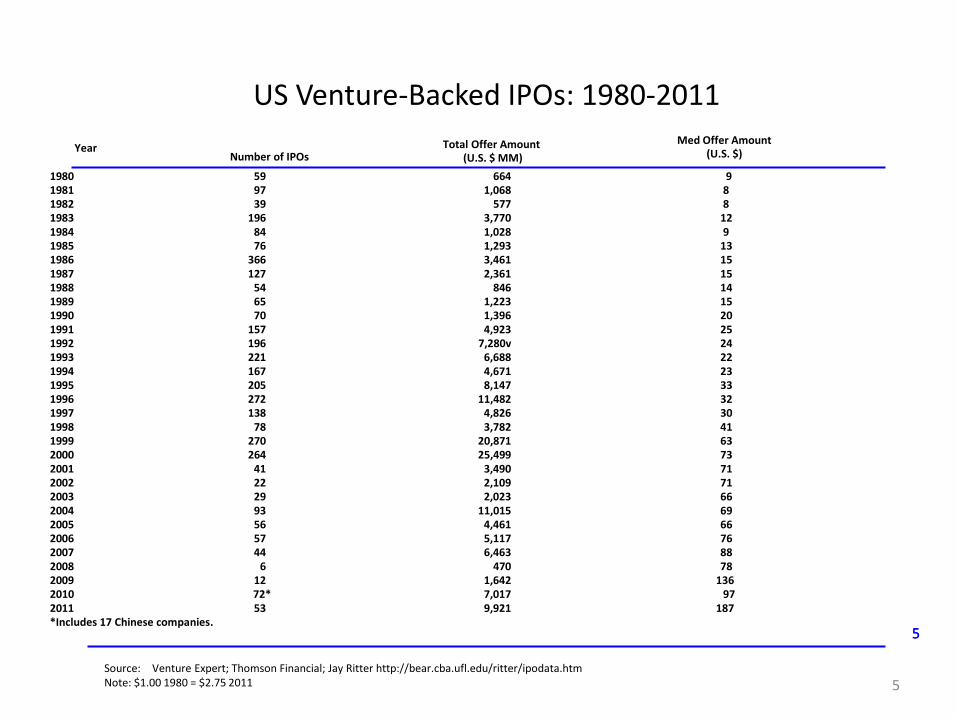
1980 59 664 9 1981 97 1,068 8 1982 39 577 8 1983 196 3,770 12 1984 84 1,028 9 1985 76 1,293 13 1986 366 3,461 15 1987 127 2,361 15 1988 54 846 14 1989 65 1,223 15 1990 70 1,396 20 1991 157 4,923 25 1992 196 7,280v 24 1993 221 6,688 22 1994 167 4,671 23 1995 205 8,147 33 1996 272 11,482 32 1997 138 4,826 30 1998 78 3,782 41 1999 270 20,871 63 2000 264 25,499 73 2001 41 3,490 71 2002 22 2,109 71 2003 29 2,023 66 2004 93 11,015 69 2005 56 4,461 66 2006 57 5,117 76 2007 44 6,463 88 2008 6 470 78 2009 12 1,642 136 2010 72* 7,017 97 2011 53 9,921 187 *Includes 17 Chinese companies.
US Venture-Backed IPOs: 1980-2011
Number of IPOs Total Offer Amount
(U.S. $ MM)
Source: Venture Expert; Thomson Financial; Jay Ritter http://bear.cba.ufl.edu/ritter/ipodata.htm Note: $1.00 1980 = $2.75 2011
Med Offer Amount (U.S. $) Year
5
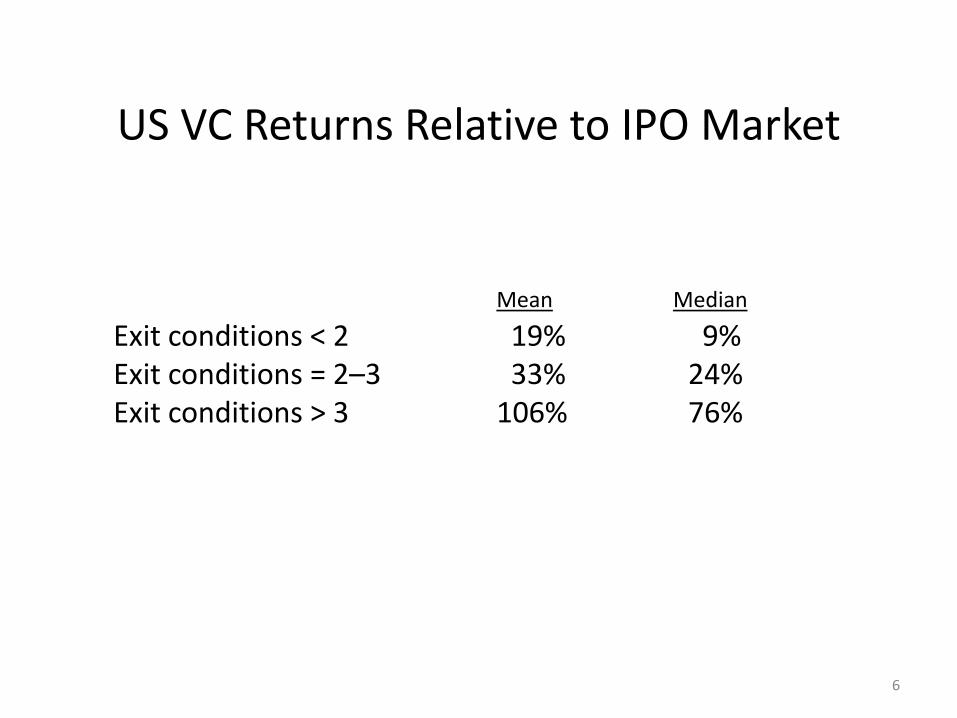
US VC Returns Relative to IPO Market
Exit conditions < 2 19% 9% Exit conditions = 2–3 33% 24% Exit conditions > 3 106% 76%
Mean Median
6
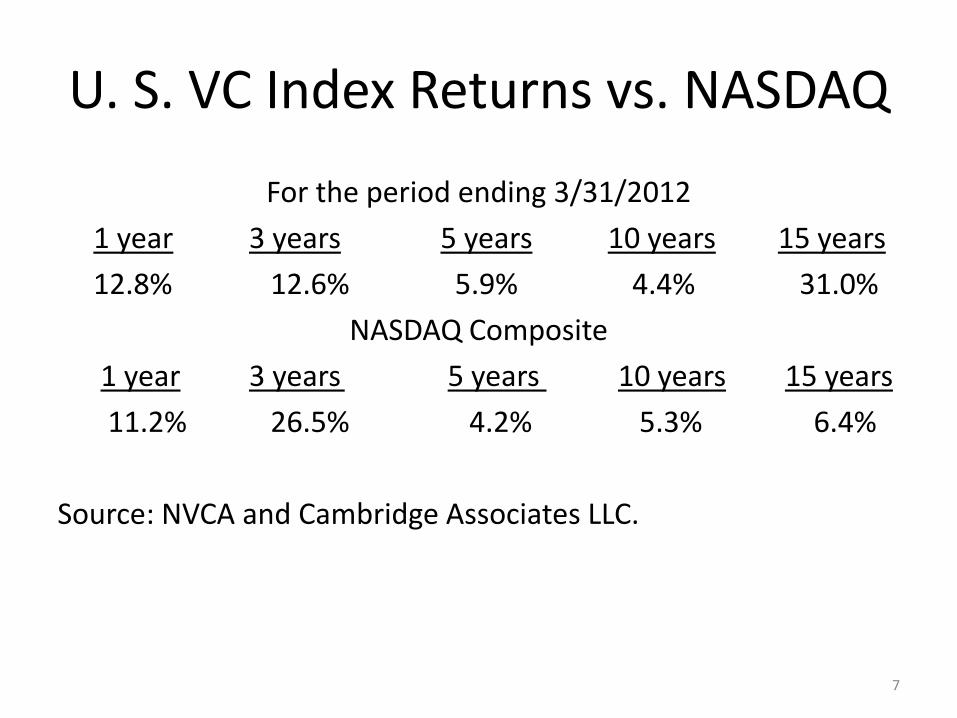
U. S. VC Index Returns vs. NASDAQ
For the period ending 3/31/2012
1 year 3 years 5 years 10 years 15 years
12.8% 12.6% 5.9% 4.4% 31.0%
NASDAQ Composite
1 year 3 years 5 years 10 years 15 years
11.2% 26.5% 4.2% 5.3% 6.4%
Source: NVCA and Cambridge Associates LLC.
7
Mark Heesen, President NVCA (January 2012)
“This past year we saw more venture capital money raised by essentially the same number of firms, a sign that consolidation within the industry is continuing. We also continued to invest more money in companies than we raised from our investors. Both of these trends—if they continue—suggest that the level and breadth of venture investment is starting to recalibrate to reflect a concentration of capital in the hands of fewer investors. Our cottage industry is indeed getting smaller still and that will impact the startup ecosystem over time.”
8
9 9
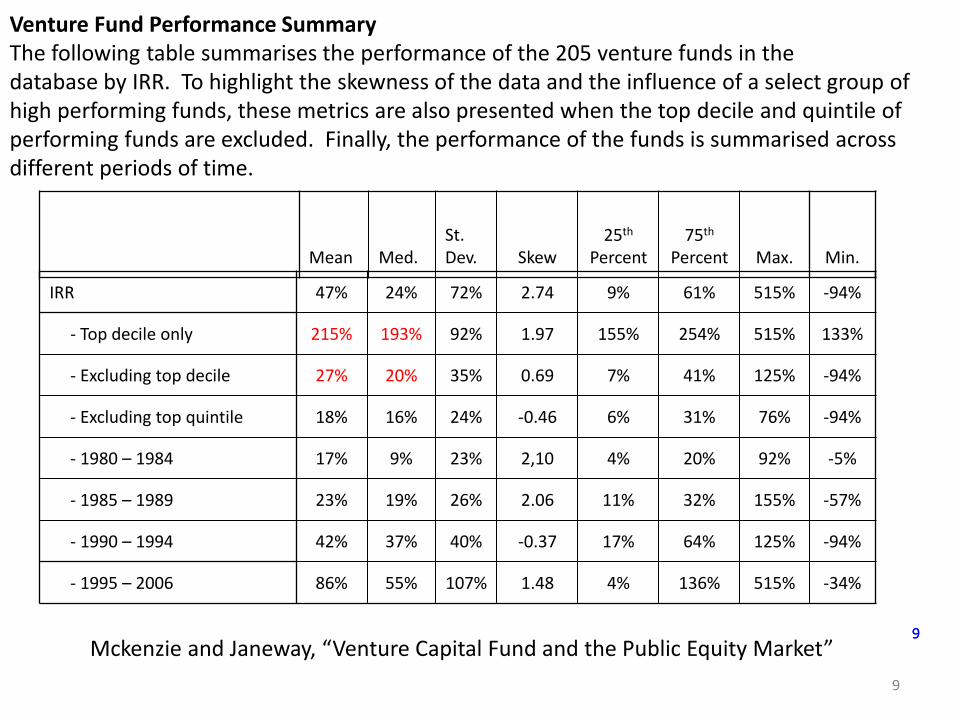
IRR 47% 24% 72% 2.74 9% 61% 515% -94%
- Top decile only 215% 193% 92% 1.97 155% 254% 515% 133%
- Excluding top decile 27% 20% 35% 0.69 7% 41% 125% -94%
- Excluding top quintile 18% 16% 24% -0.46 6% 31% 76% -94%
- 1980 – 1984 17% 9% 23% 2,10 4% 20% 92% -5%
- 1985 – 1989 23% 19% 26% 2.06 11% 32% 155% -57%
- 1990 – 1994 42% 37% 40% -0.37 17% 64% 125% -94%
- 1995 – 2006 86% 55% 107% 1.48 4% 136% 515% -34%
Venture Fund Performance Summary The following table summarises the performance of the 205 venture funds in the database by IRR. To highlight the skewness of the data and the influence of a select group of high performing funds, these metrics are also presented when the top decile and quintile of performing funds are excluded. Finally, the performance of the funds is summarised across different periods of time.
Mean Med. St. Dev.
Skew
25th
Percent 75th
Percent Max. Min.
9
Mckenzie and Janeway, “Venture Capital Fund and the Public Equity Market”
10 10
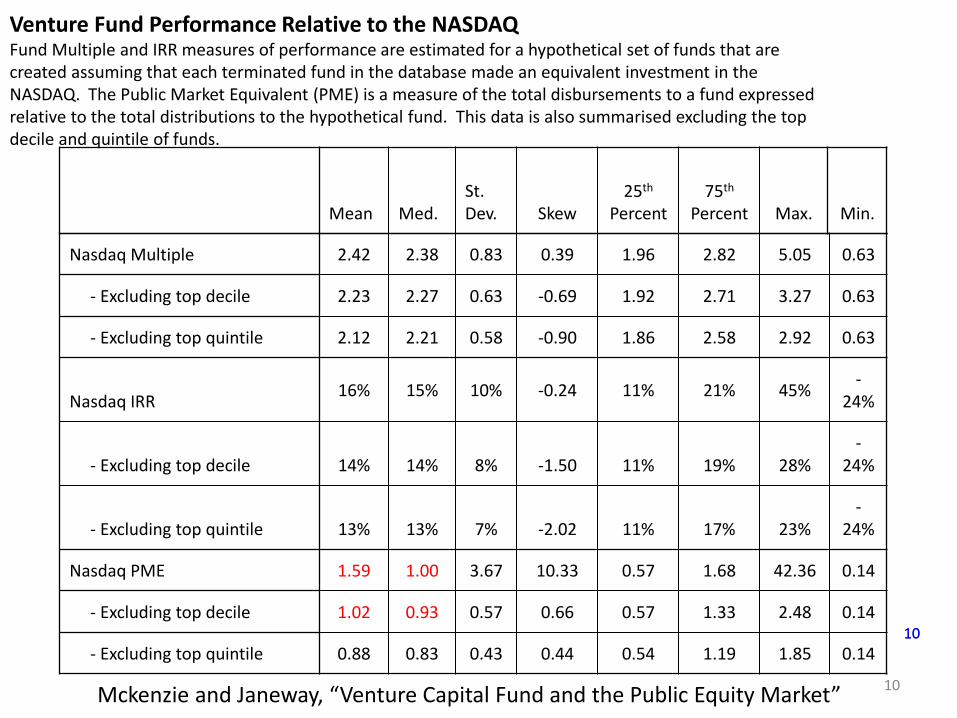
Venture Fund Performance Relative to the NASDAQ Fund Multiple and IRR measures of performance are estimated for a hypothetical set of funds that are created assuming that each terminated fund in the database made an equivalent investment in the NASDAQ. The Public Market Equivalent (PME) is a measure of the total disbursements to a fund expressed relative to the total distributions to the hypothetical fund. This data is also summarised excluding the top decile and quintile of funds.
Nasdaq Multiple 2.42 2.38 0.83 0.39 1.96 2.82 5.05 0.63
- Excluding top decile 2.23 2.27 0.63 -0.69 1.92 2.71 3.27 0.63
- Excluding top quintile 2.12 2.21 0.58 -0.90 1.86 2.58 2.92 0.63
Nasdaq IRR 16% 15% 10% -0.24 11% 21% 45%
-24%
- Excluding top decile 14% 14% 8% -1.50 11% 19% 28%
-24%
- Excluding top quintile 13% 13% 7% -2.02 11% 17% 23%
-24%
Nasdaq PME 1.59 1.00 3.67 10.33 0.57 1.68 42.36 0.14
- Excluding top decile 1.02 0.93 0.57 0.66 0.57 1.33 2.48 0.14
- Excluding top quintile 0.88 0.83 0.43 0.44 0.54 1.19 1.85 0.14
Mean Med. St. Dev.
Skew
25th
Percent 75th
Percent Max. Min.
10 Mckenzie and Janeway, “Venture Capital Fund and the Public Equity Market”
“’WE HAVE MET THE ENEMY… AND HE IS US,’ Lessons from Twenty Years of the Kauffman Foundation’s Investments in Venture Capital Funds and The Triumph of Hope over Experience”
“The Kauffman Foundation investment team analyzed our twenty-year history of venture investing experience in nearly 100 VC funds with some of the most notable and exclusive partnership “brands” and concluded that the Limited Partner (LP) investment model is broken. Limited Partners—foundations, endowments, and state pension funds—invest too much capital in underperforming venture capital funds on frequently mis-aligned terms.”
11
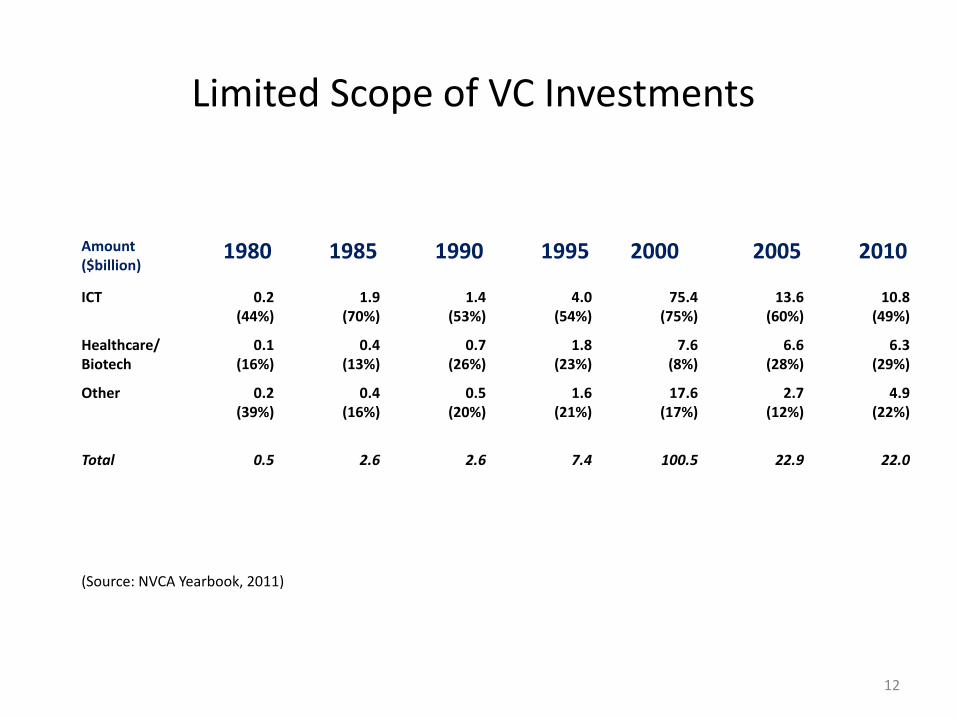
Limited Scope of VC Investments
Amount ($billion)
1980 1985 1990 1995 2000 2005 2010
ICT 0.2 (44%)
1.9 (70%)
1.4 (53%)
4.0 (54%)
75.4 (75%)
13.6 (60%)
10.8 (49%)
Healthcare/ Biotech
0.1 (16%)
0.4 (13%)
0.7 (26%)
1.8 (23%)
7.6 (8%)
6.6 (28%)
6.3 (29%)
Other 0.2 (39%)
0.4 (16%)
0.5 (20%)
1.6 (21%)
17.6 (17%)
2.7 (12%)
4.9 (22%)
Total 0.5 2.6 2.6 7.4 100.5 22.9 22.0
(Source: NVCA Yearbook, 2011)
12
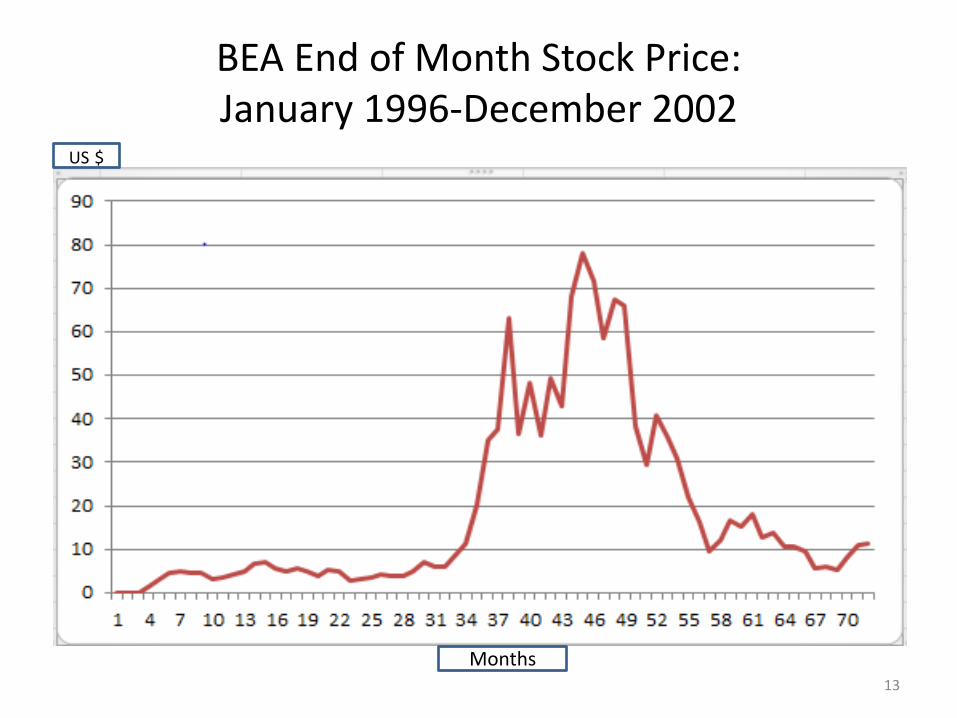
BEA End of Month Stock Price: January 1996-December 2002
13
Months
US $
“No One Knows Enough…”
“In the vast majority of cases, the prospects of investment projects—the stream of future returns—cannot be understood in standard probabilistic terms . . . This is obviously true for investments in innovative products and processes for which estimates of returns cannot be based solely on the profit history of existing products and processes. (R. Frydman and M. Goldberg, Beyond Mechanical Markets: Asset Price Swings, Risk, and the Role of the State, pp. 41-2)
14
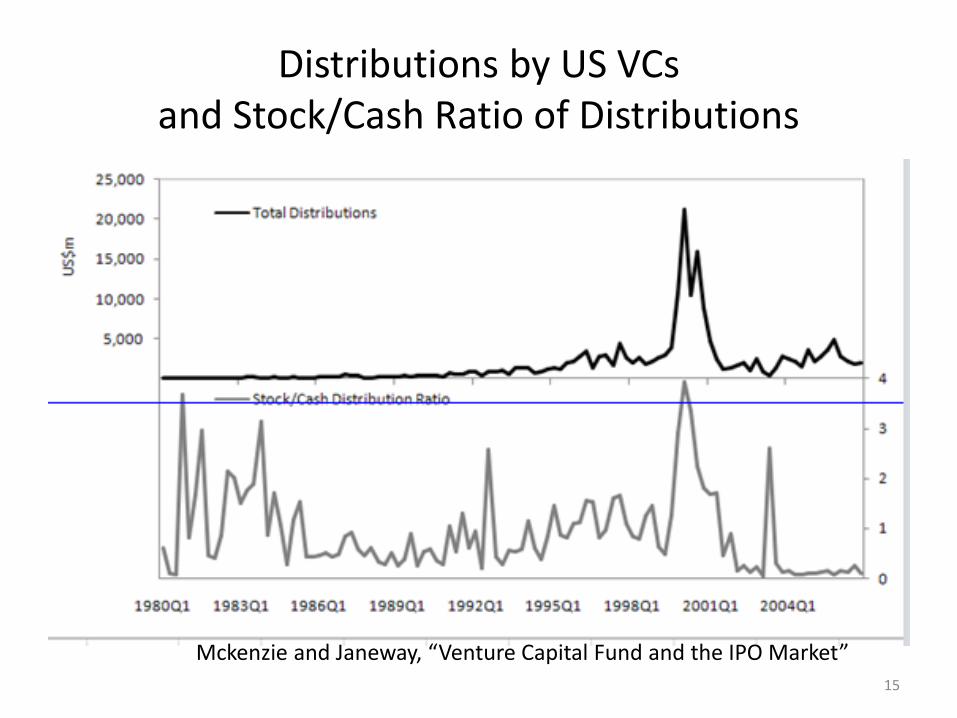
Distributions by US VCs and Stock/Cash Ratio of Distributions
15
IPO Mckenzie and Janeway, “Venture Capital Fund and the IPO Market”
What is “Rational” Behavior?
“A rational, profit-seeking individual understands that the world around her will change in non-routine ways. She simply cannot afford to believe that, contrary to her experience, she has found a “true” over-arching forecasting strategy, let alone that everyone else has found it as well.” (R. Frydman and M. Goldberg, Beyond Mechanical Markets: Asset Price Swings, Risk, and the Role of the State, p. 27)
16
Keynes’s Bridge
“The daily revaluations of the Stock Exchange . . . inevitably exert a decisive influence on the rate of current investment. For there is no sense in building a new enterprise at a cost greater than that at which a similar existing enterprise can be purchased; while there is an inducement to spend on a new project what may seem an extravagant sum, if it can be floated off on the Stock Exchange at an immediate profit. Thus certain classes of investment are governed by the average expectation of those who deal on the Stock Exchange as revealed in the price of shares, rather than by the genuine expectation of the professional entrepreneur.” (The General Theory, p. 151)
17
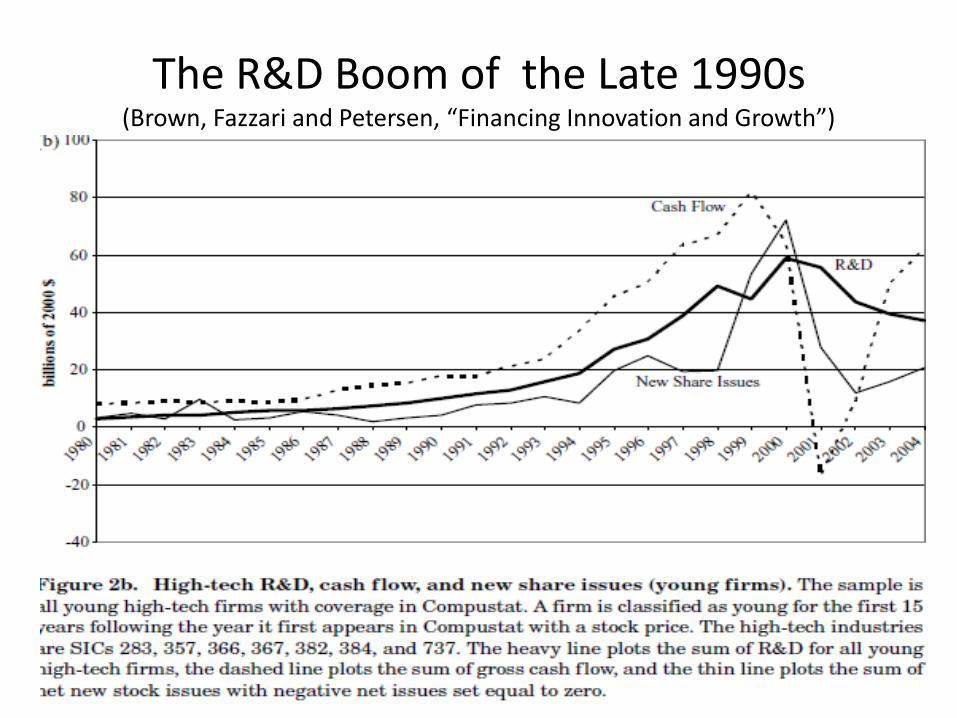
The R&D Boom of the Late 1990s (Brown, Fazzari and Petersen, “Financing Innovation and Growth”)
18
Keynes’ Provocation
“If the Treasury were to fill old bottles with bank-notes, bury them at suitable depths in disused coalmines which are then filled up to the surface with town rubbish, and leave it to private enterprise on well-tried principles of laissez-faire to dig the notes up again, . . . there need be no more unemployment and, with the help of the repercussions, the real income of the community, and its capital wealth also, would probably become a good deal greater than it actually is. It would, indeed, be more sensible to build houses and the like; but if there are political and practical difficulties in the way of this, the above would be better than nothing.”
(The General Theory, p. 129)
19
Keynes’ Rueful Reflection
“It is, it seems, politically impossible for a capitalist democracy to organize expenditure on the scale necessary to make the grand experiment which would prove my case—except in war conditions.” (The New Republic, 1940)
What I learned by Doing Capitalism
Dr William H Janeway Director of Magnet Systems, Nuance Communications, O'Reilly Media
Author, Doing Capitalism in the Innovation Economy: Markets, Speculation and the State
Professor Dimitri Vayanos Professor of Finance and Director of the Paul Woolley Centre for the Study of Capital Market
Dysfunctionality, LSE
Professor Craig Calhoun Chair, LSE
LSE public lecture
Suggested hashtag for Twitter users: #LSEJaneway