Embed Size (px)
Citation preview
Capitalware's MQ Technical Conference v2.0.1.6
What happened to my Transaction?
Barry D. LamkinExecutive IT [email protected]
Capitalware's MQ Technical Conference v2.0.1.6
Transaction Tracking - APM¡ Transaction Tracking is a major part of Application
Performance Monitoring
¡ To ensure SLA compliance, monitoring transaction performance is essential for finding and fixing problems before they impact customer satisfaction.
¡ You need a consolidated view for monitoring resources and activities within your enterprise so performance issues can be detected early and resolved quickly.
¡ When a problem is detected, is it possible to drill-down to diagnose the root cause of the bottleneck so a solution can be implemented?
Capitalware's MQ Technical Conference v2.0.1.6
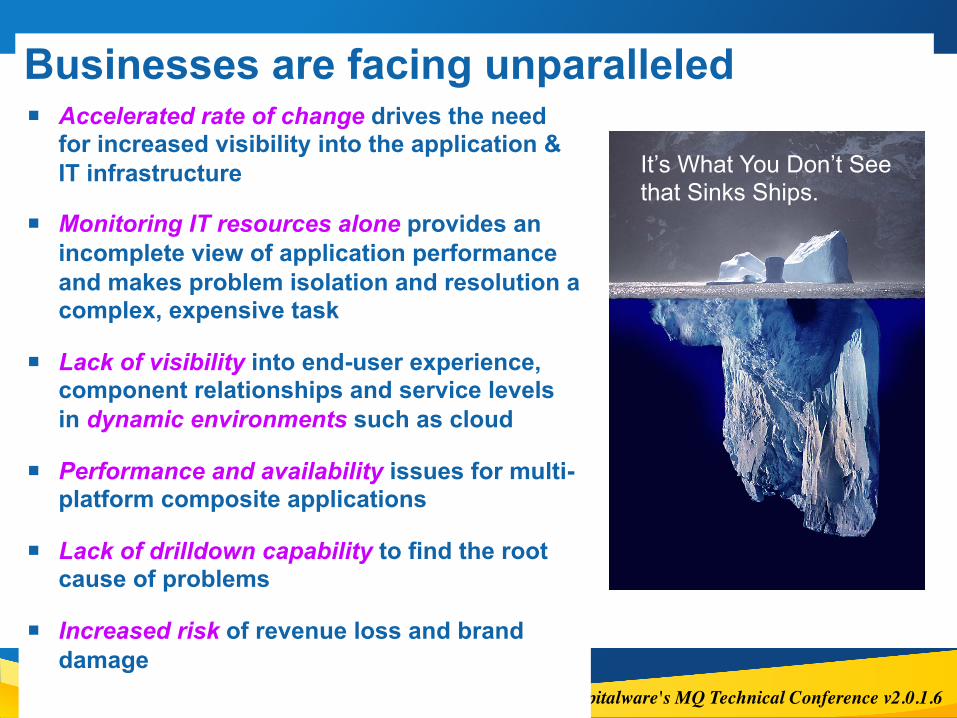
Businesses are facing unparalleled challenges¡ Accelerated rate of change drives the need
for increased visibility into the application & IT infrastructure
¡ Monitoring IT resources alone provides an incomplete view of application performance and makes problem isolation and resolution a complex, expensive task
¡ Lack of visibility into end-user experience, component relationships and service levels in dynamic environments such as cloud
¡ Performance and availability issues for multi-platform composite applications
¡ Lack of drilldown capability to find the root cause of problems
¡ Increased risk of revenue loss and brand damage
It’s What You Don’t See that Sinks Ships.
Capitalware's MQ Technical Conference v2.0.1.64
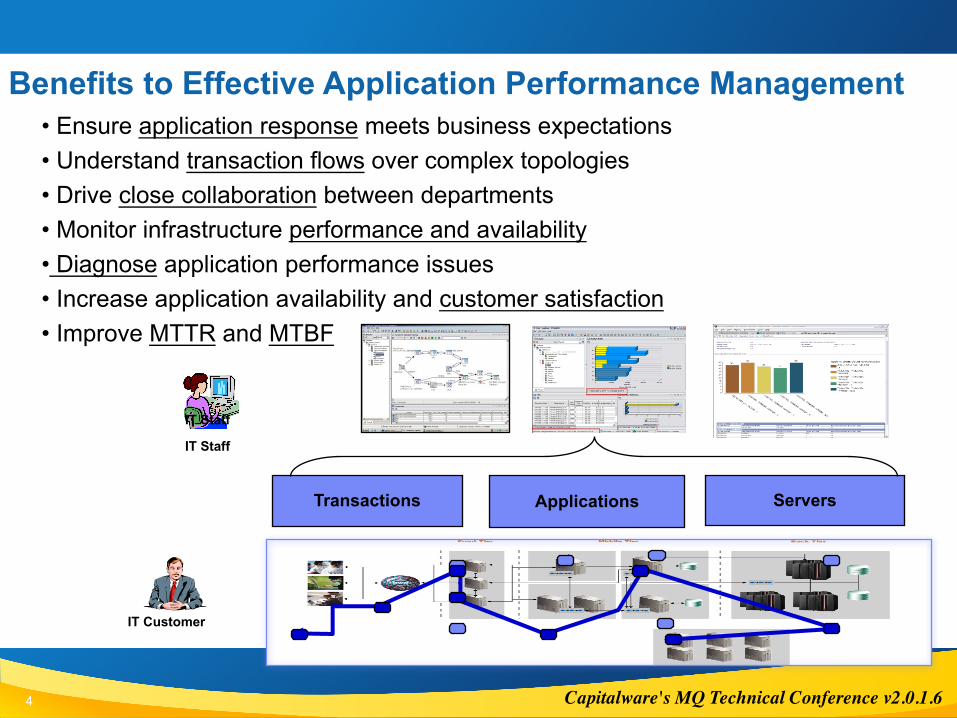
Transactions ServersApplications
IT Customer
IT Staff
IT Staff
• Ensure application response meets business expectations• Understand transaction flows over complex topologies• Drive close collaboration between departments• Monitor infrastructure performance and availability• Diagnose application performance issues• Increase application availability and customer satisfaction• Improve MTTR and MTBF
Benefits to Effective Application Performance Management
Capitalware's MQ Technical Conference v2.0.1.6
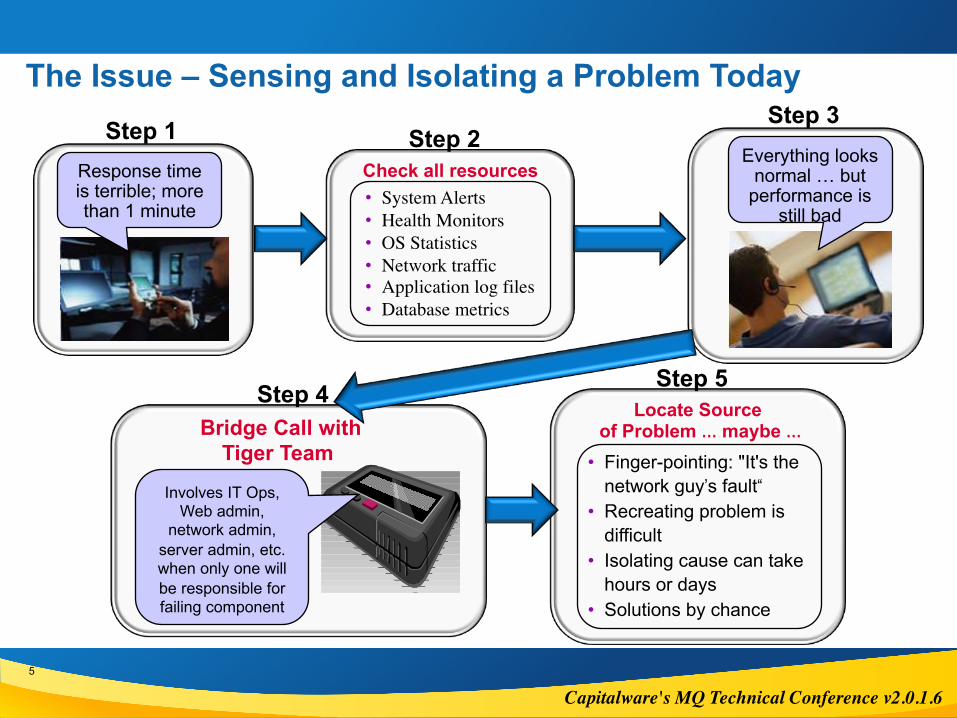
The Issue – Sensing and Isolating a Problem Today
5
Check all resources• System Alerts• Health Monitors• OS Statistics• Network traffic• Application log files• Database metrics
Locate Source of Problem … maybe …
• Finger-pointing: "It's the network guy’s fault“
• Recreating problem is difficult
• Isolating cause can take hours or days
• Solutions by chance
Everything looks normal … but
performance is still bad
Response time is terrible; more than 1 minute
Bridge Call withTiger Team
Involves IT Ops, Web admin,
network admin, server admin, etc. when only one will be responsible for failing component
Step 1 Step 2Step 3
Step 4 Step 5

Capitalware's MQ Technical Conference v2.0.1.6
Customer Value – Demonstrating ROI
Every customer case will be different … …what do you lose each year due to poor performance?
Capitalware's MQ Technical Conference v2.0.1.6
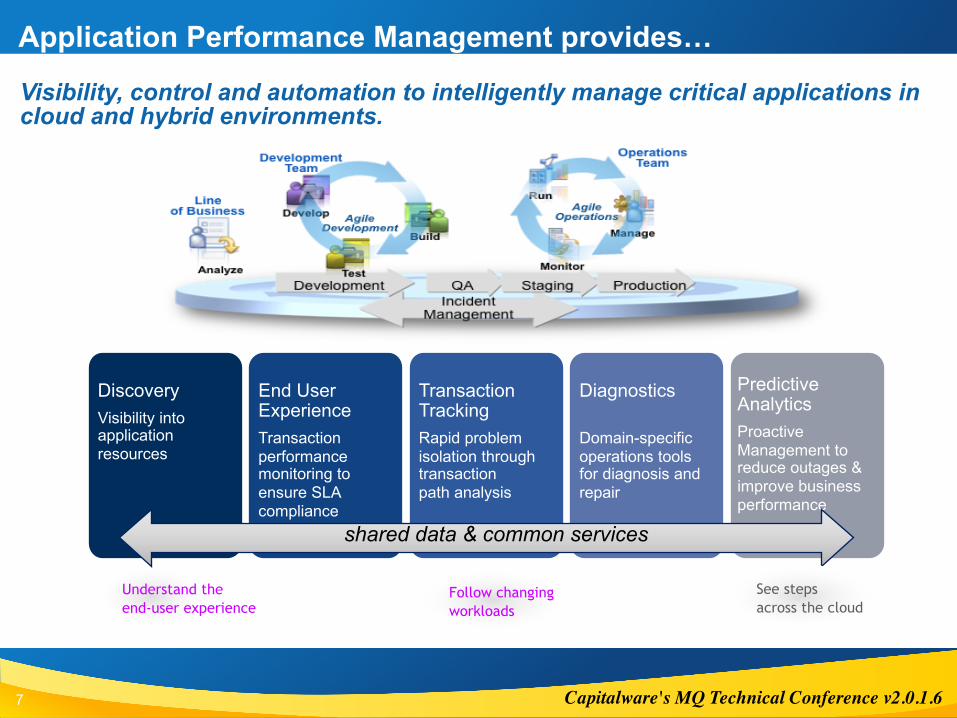
Understand the end-user experience
Follow changing workloads
DiscoveryVisibility into application resources
End User ExperienceTransaction performance monitoring to ensure SLA compliance
Transaction TrackingRapid problem isolation through transaction path analysis
Diagnostics
Domain-specific operations tools for diagnosis and repair
Predictive AnalyticsProactive Management to reduce outages & improve business performance
shared data & common services
See steps across the cloud
Visibility, control and automation to intelligently manage critical applications in cloud and hybrid environments.
Application Performance Management provides…
7
Capitalware's MQ Technical Conference v2.0.1.6
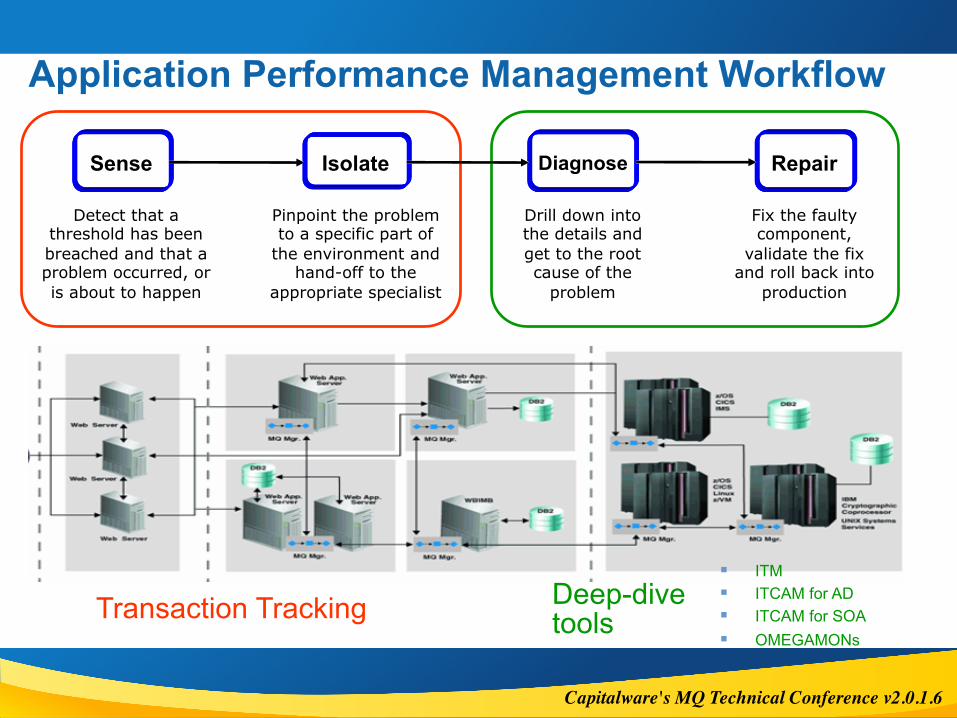
Detect that a threshold has been breached and that a problem occurred, or is about to happen
Sense DiagnoseIsolate Repair
Pinpoint the problem to a specific part of
the environment and hand-off to the
appropriate specialist
Drill down into the details and get to the root cause of the
problem
Fix the faulty component,
validate the fix and roll back into
production
Application Performance Management Workflow
Transaction Tracking Deep-dive tools
§ ITM§ ITCAM for AD§ ITCAM for SOA§ OMEGAMONs
Capitalware's MQ Technical Conference v2.0.1.6
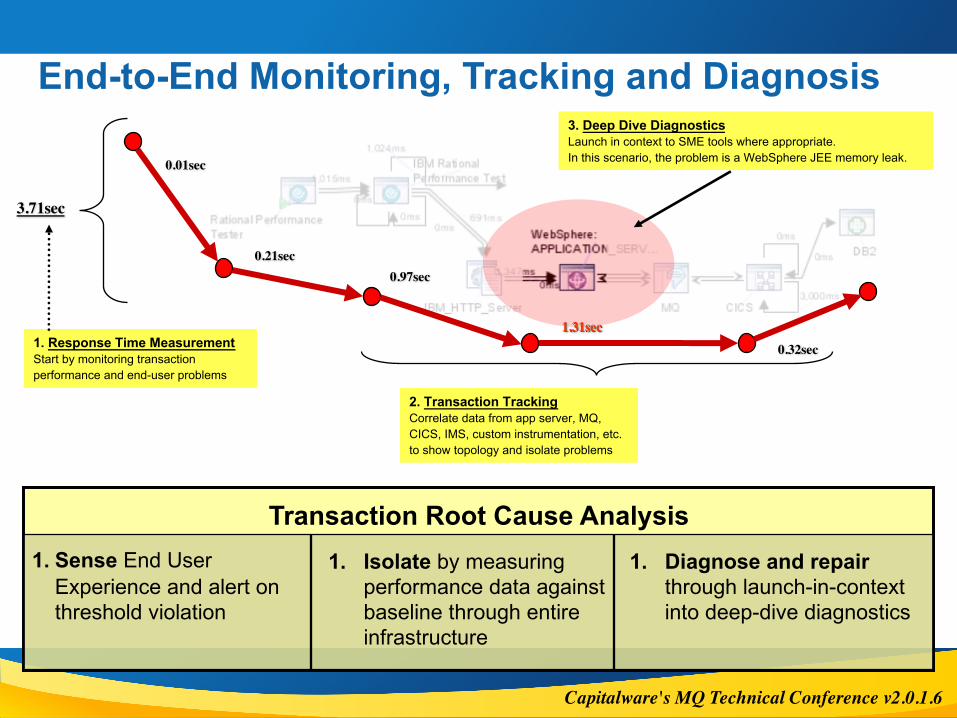
End-to-End Monitoring, Tracking and Diagnosis
Transaction Root Cause Analysis1. Diagnose and repair
through launch-in-context into deep-dive diagnostics
0.97sec
1.31sec
0.01sec
0.21sec
0.32sec
3.71sec
1. Response Time MeasurementStart by monitoring transaction performance and end-user problems
2. Transaction TrackingCorrelate data from app server, MQ, CICS, IMS, custom instrumentation, etc. to show topology and isolate problems
1. Sense End User Experience and alert on threshold violation
1. Isolate by measuring performance data against baseline through entire infrastructure
1.31sec
3. Deep Dive DiagnosticsLaunch in context to SME tools where appropriate.In this scenario, the problem is a WebSphere JEE memory leak.
Capitalware's MQ Technical Conference v2.0.1.6
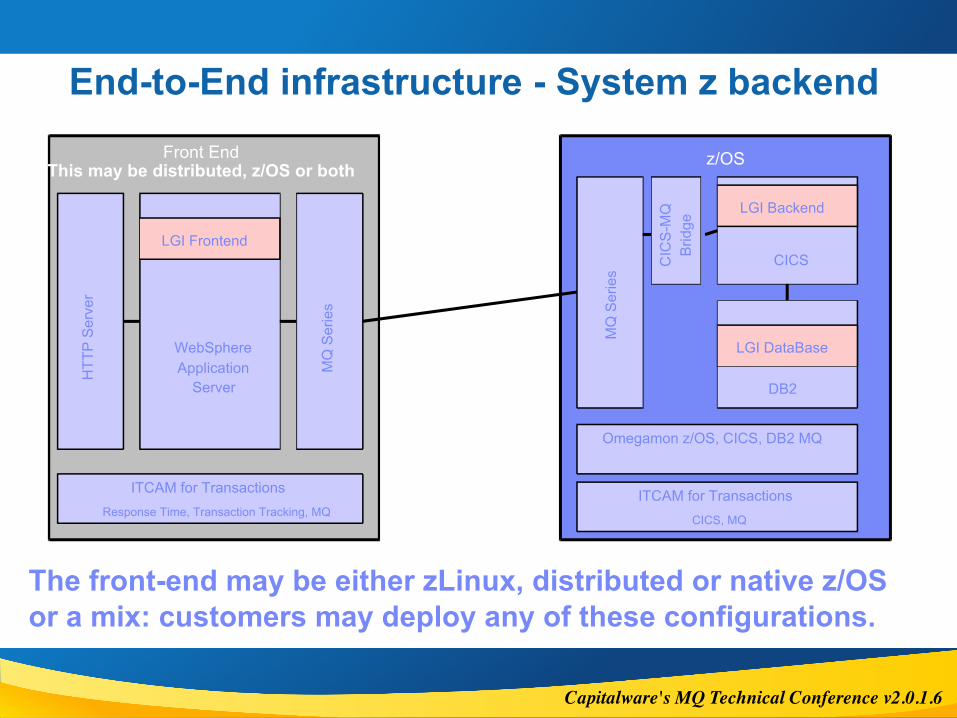
End-to-End infrastructure - System z backendFront End
This may be distributed, z/OS or both z/OS
WebSphere Application
Server
CICS
DB2
Omegamon z/OS, CICS, DB2 MQ
MQ
Ser
ies
CIC
S-M
Q
Brid
ge
MQ
Ser
ies
HTT
P Se
rver
ITCAM for TransactionsResponse Time, Transaction Tracking, MQ
LGI Frontend
LGI Backend
LGI DataBase
ITCAM for TransactionsCICS, MQ
The front-end may be either zLinux, distributed or native z/OS or a mix: customers may deploy any of these configurations.
Capitalware's MQ Technical Conference v2.0.1.6
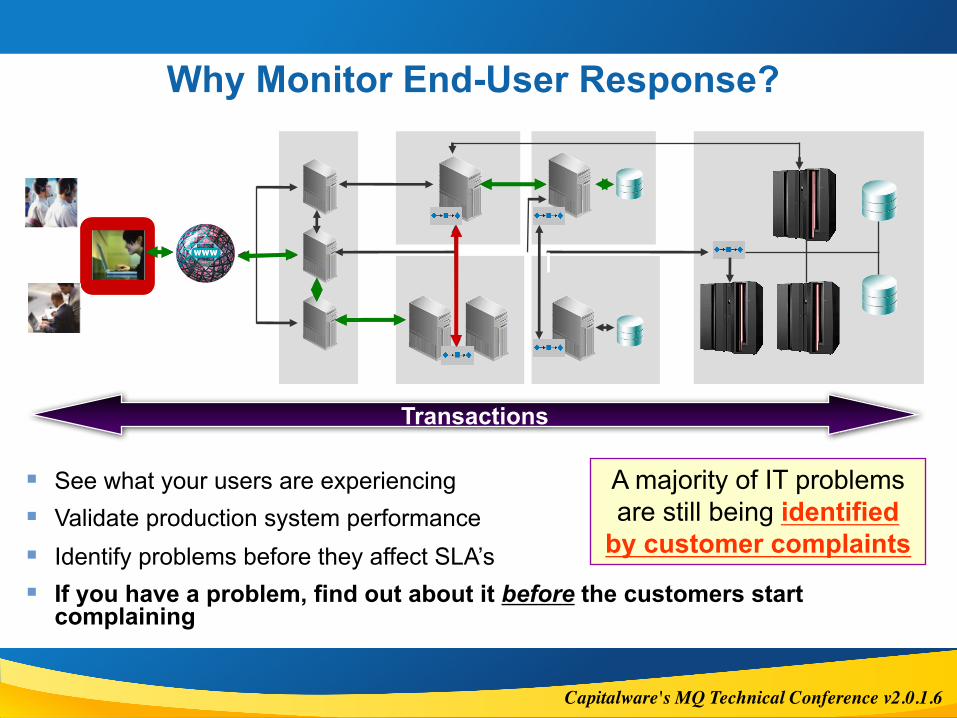
Transactions
Why Monitor End-User Response?
§ See what your users are experiencing§ Validate production system performance§ Identify problems before they affect SLA’s§ If you have a problem, find out about it before the customers start
complaining
A majority of IT problems are still being identified
by customer complaints
Capitalware's MQ Technical Conference v2.0.1.6
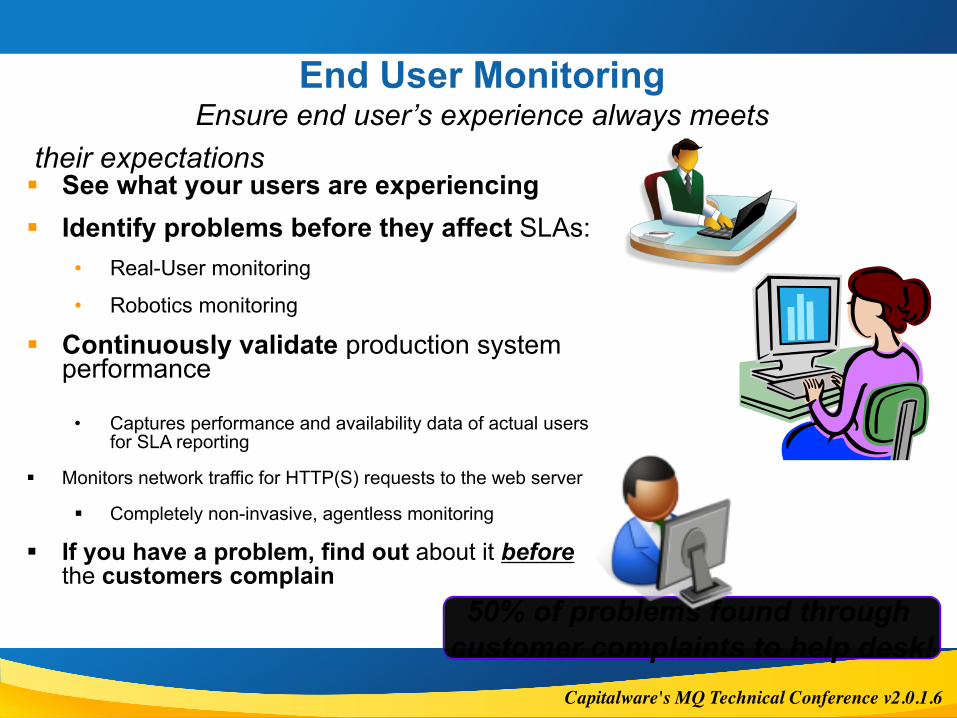
End User MonitoringEnsure end user’s experience always meets
their expectations§ See what your users are experiencing§ Identify problems before they affect SLAs:
• Real-User monitoring
• Robotics monitoring
§ Continuously validate production system performance
• Captures performance and availability data of actual users for SLA reporting
§ Monitors network traffic for HTTP(S) requests to the web server
§ Completely non-invasive, agentless monitoring
§ If you have a problem, find out about it beforethe customers complain
50% of problems found through customer complaints to help desk!

Capitalware's MQ Technical Conference v2.0.1.6
Agentless Real-User (Passive) MonitoringMonitor every end user’s experience
• See what your users are experiencing and immediately identify problems
• Agentless – no impact to production machines
• User/session tracking – observe individual user experience
• Multi-protocol support (beyond HTTP/S)
Capitalware's MQ Technical Conference v2.0.1.6
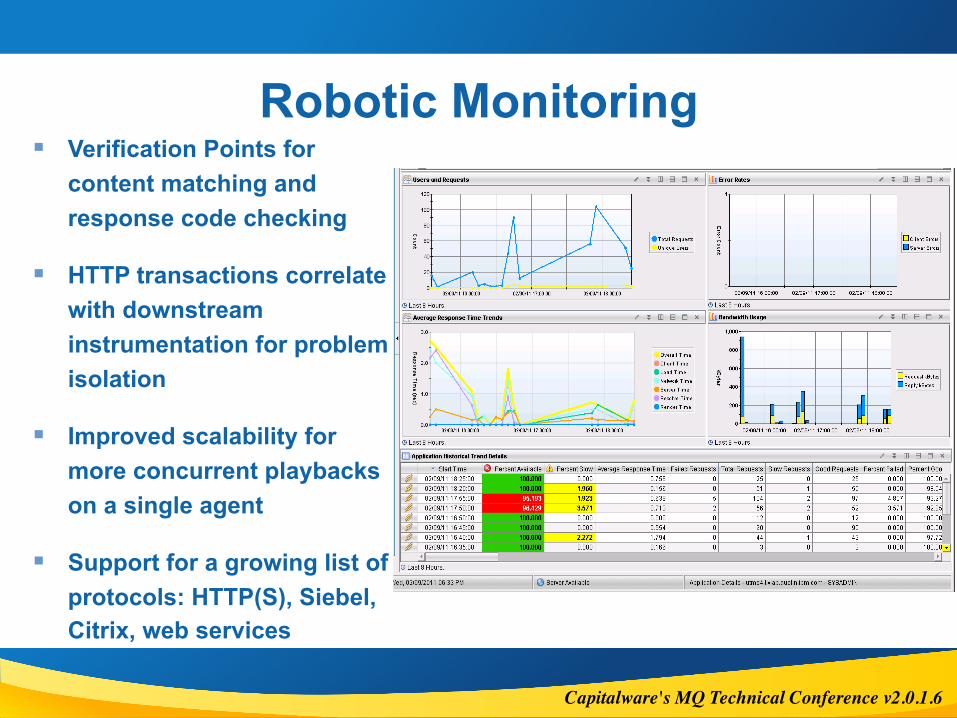
Robotic Monitoring§ Verification Points for
content matching and response code checking
§ HTTP transactions correlate with downstream instrumentation for problem isolation
§ Improved scalability for more concurrent playbacks on a single agent
§ Support for a growing list of protocols: HTTP(S), Siebel, Citrix, web services
Capitalware's MQ Technical Conference v2.0.1.6
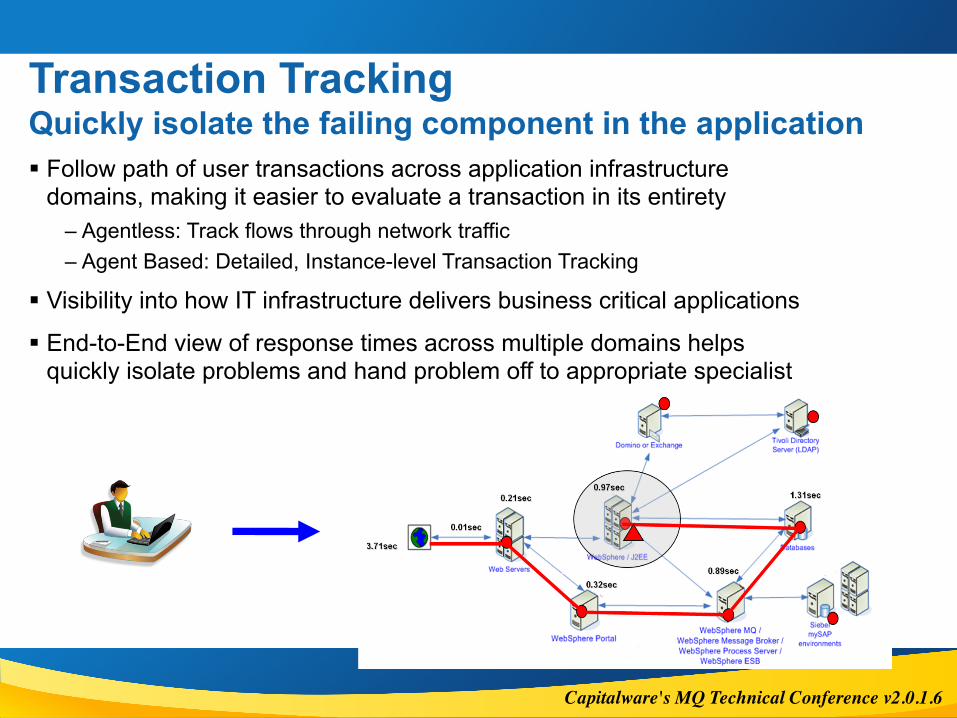
Transaction TrackingQuickly isolate the failing component in the application§ Follow path of user transactions across application infrastructure
domains, making it easier to evaluate a transaction in its entirety– Agentless: Track flows through network traffic – Agent Based: Detailed, Instance-level Transaction Tracking
§ Visibility into how IT infrastructure delivers business critical applications
§ End-to-End view of response times across multiple domains helps quickly isolate problems and hand problem off to appropriate specialist
Capitalware's MQ Technical Conference v2.0.1.6
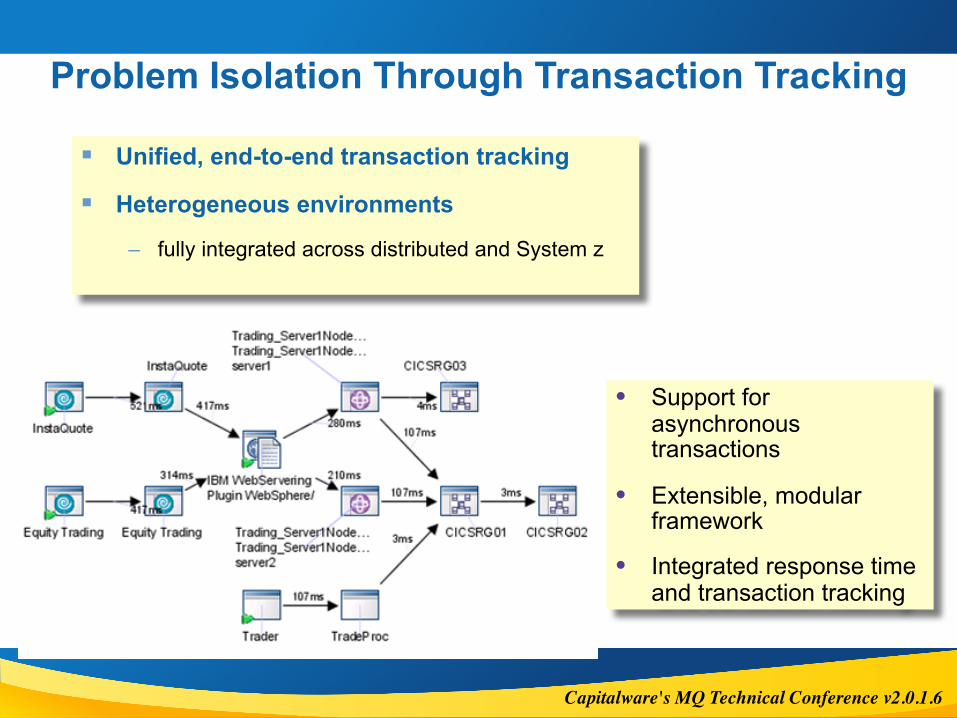
Problem Isolation Through Transaction Tracking
§ Unified, end-to-end transaction tracking
§ Heterogeneous environments
– fully integrated across distributed and System z
• Support for asynchronous transactions
• Extensible, modular framework
• Integrated response time and transaction tracking
Capitalware's MQ Technical Conference v2.0.1.6
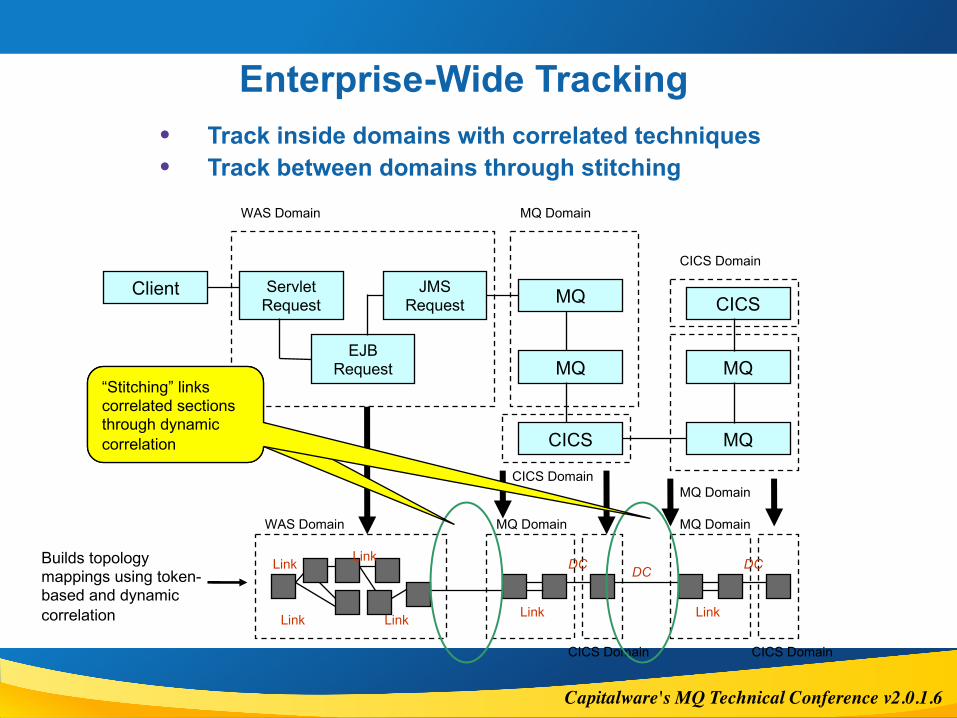
Enterprise-Wide Tracking• Track inside domains with correlated techniques• Track between domains through stitching
Client Servlet Request
JMS Request MQ
MQ
MQ
MQ
CICS
EJB Request
CICS
WAS Domain MQ Domain
CICS Domain
CICS Domain
MQ Domain
WAS Domain MQ Domain MQ Domain
CICS Domain CICS Domain
DCDC DCBuilds topology mappings using token-based and dynamic correlation Link Link LinkLink
LinkLink
Link correlated sections with dynamic correlation
“Stitching” links correlated sections through dynamic correlation
Capitalware's MQ Technical Conference v2.0.1.6
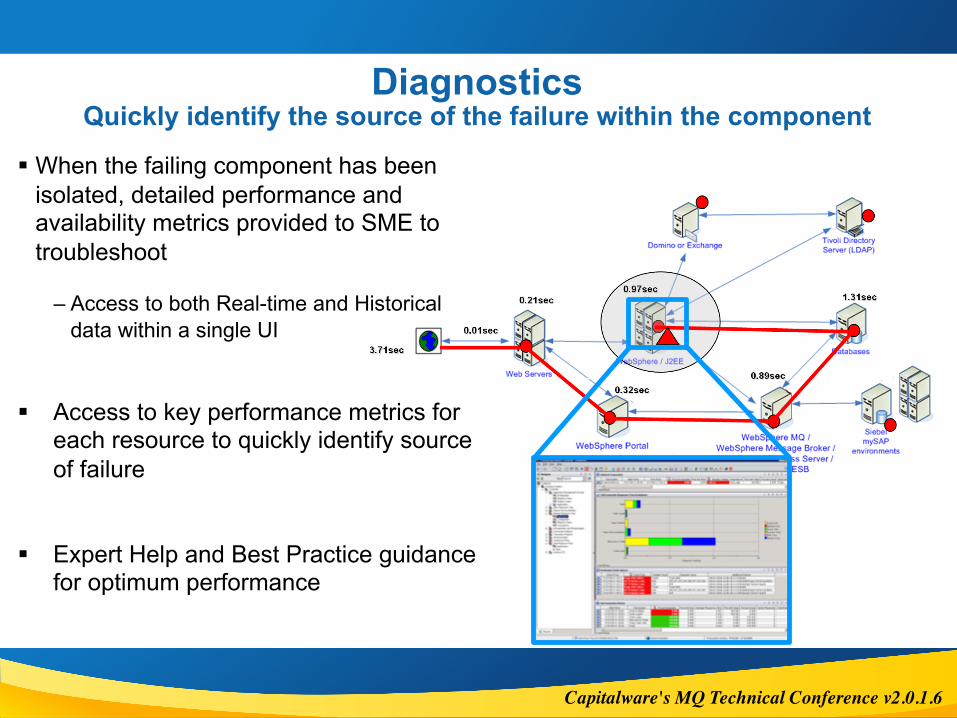
DiagnosticsQuickly identify the source of the failure within the component
§ When the failing component has been isolated, detailed performance and availability metrics provided to SME to troubleshoot
– Access to both Real-time and Historicaldata within a single UI
§ Access to key performance metrics for each resource to quickly identify sourceof failure
§ Expert Help and Best Practice guidance for optimum performance

Capitalware's MQ Technical Conference v2.0.1.6
Transaction Tracking Topology
Red “hot spot” indicates bottleneck
Synchronous transactions
Green arrow indicates start node

Capitalware's MQ Technical Conference v2.0.1.6
Transaction Tracking – Topology Workspace Views
§ There are 4 topology workspace views available in the TEP.
– Server:• A topology showing monitored servers (Sysplex name/SMFID or
shortname).
– Component• A topology showing the monitored components (Eg: WAS, CTG, CICS,
IMS, Connect IMS, WMQ).
– Application:• A topology showing monitored applications (jobnames, STC names,
subsystem names).
– Transactions• A topology showing the monitored transactions (Eg: CICS transaction
name, IMS transaction name, WAS jsp).
Capitalware's MQ Technical Conference v2.0.1.621
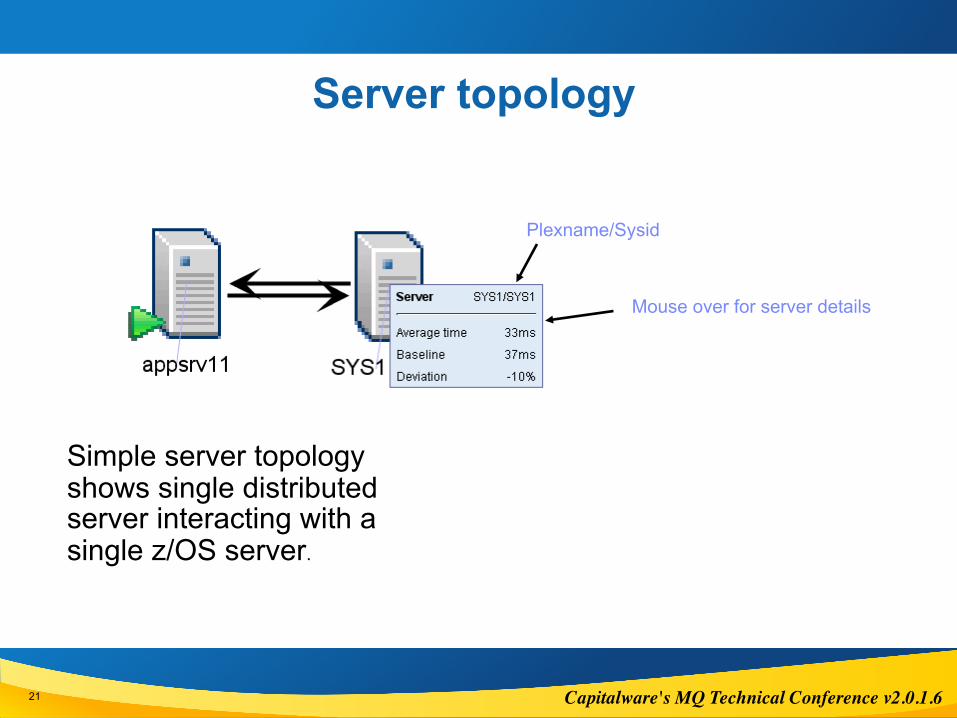
Server topology
Simple server topology shows single distributed server interacting with a single z/OS server.
Mouse over for server details
Plexname/Sysid
Capitalware's MQ Technical Conference v2.0.1.6
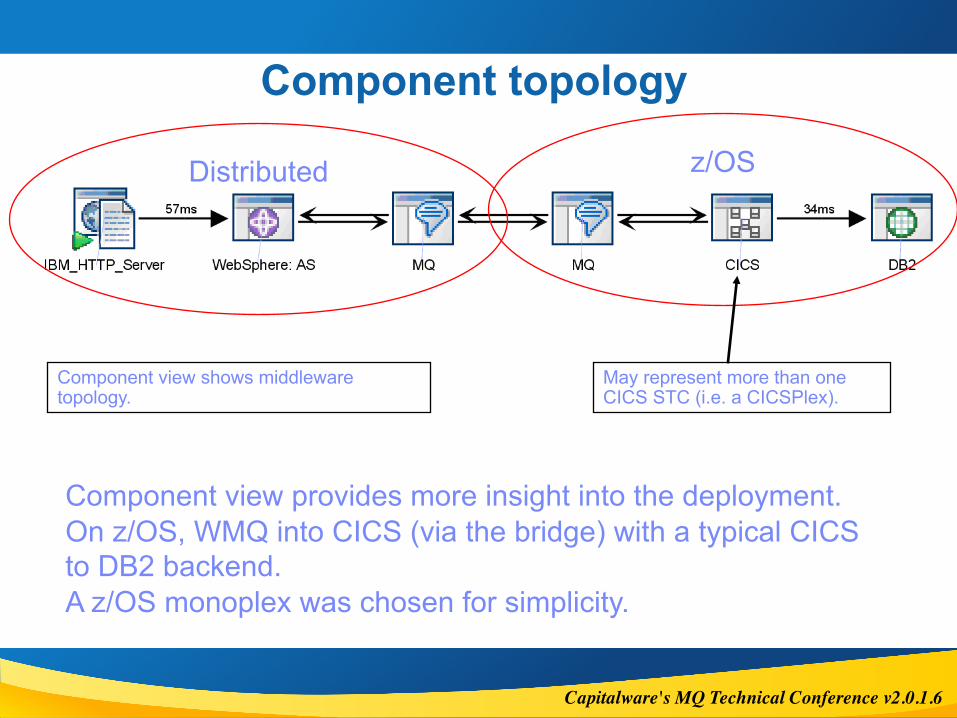
Component topology
Distributed z/OS
Component view shows middleware topology.
May represent more than one CICS STC (i.e. a CICSPlex).
Component view provides more insight into the deployment. On z/OS, WMQ into CICS (via the bridge) with a typical CICS to DB2 backend. A z/OS monoplex was chosen for simplicity.
Capitalware's MQ Technical Conference v2.0.1.6
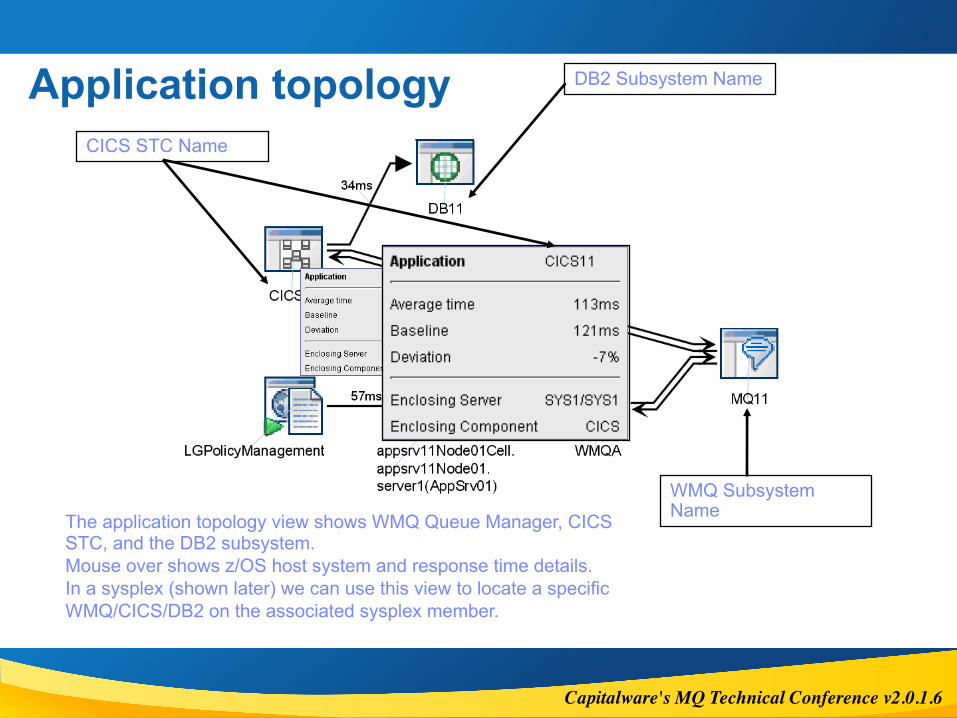
Application topology DB2 Subsystem Name
CICS STC Name
WMQ Subsystem NameThe application topology view shows WMQ Queue Manager, CICS
STC, and the DB2 subsystem.Mouse over shows z/OS host system and response time details.In a sysplex (shown later) we can use this view to locate a specific WMQ/CICS/DB2 on the associated sysplex member.
Capitalware's MQ Technical Conference v2.0.1.6
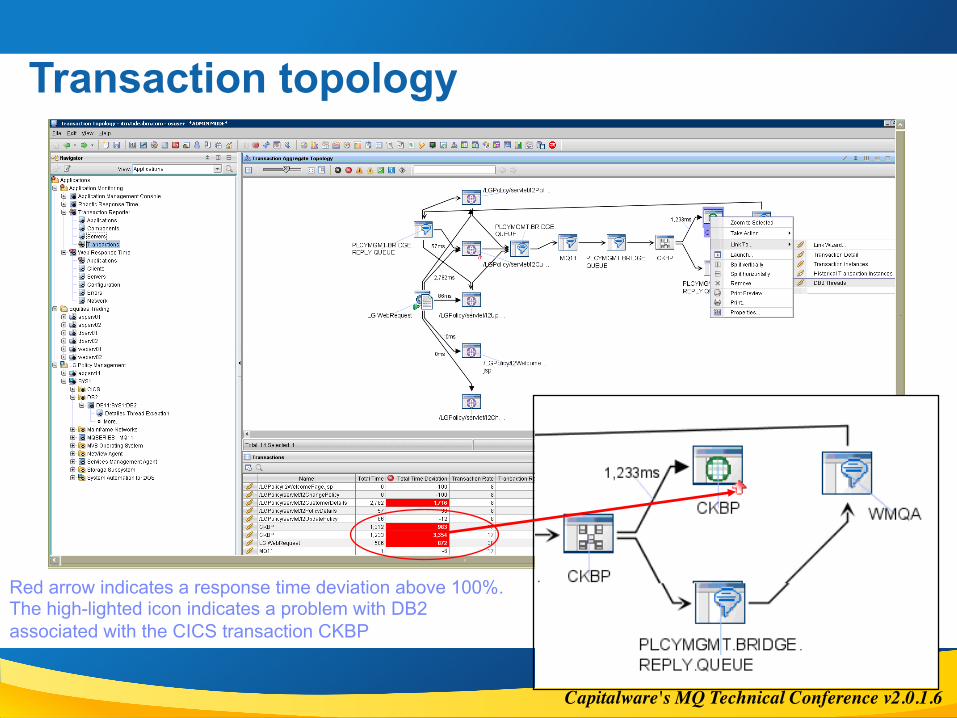
Transaction topology
Red arrow indicates a response time deviation above 100%. The high-lighted icon indicates a problem with DB2 associated with the CICS transaction CKBP
Capitalware's MQ Technical Conference v2.0.1.6
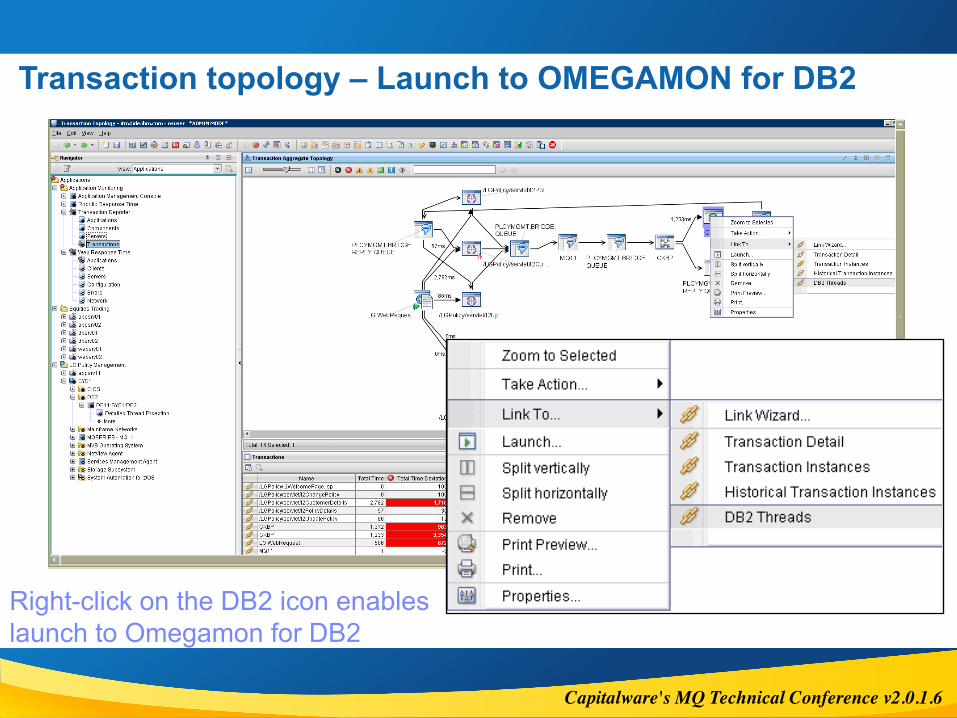
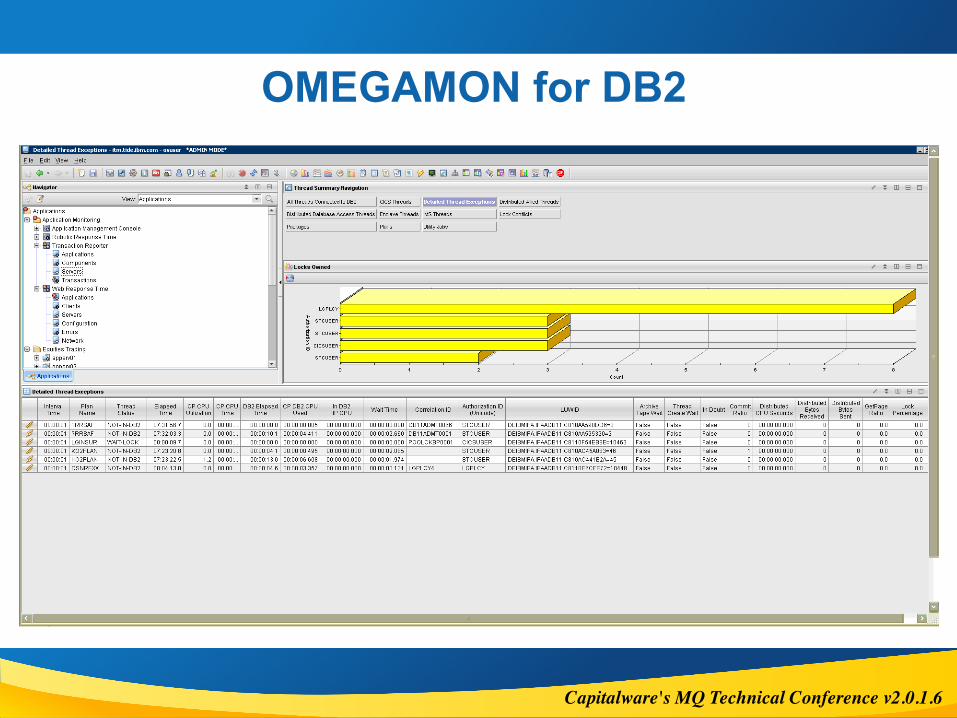
Transaction topology – Launch to OMEGAMON for DB2
Right-click on the DB2 icon enables launch to Omegamon for DB2
Capitalware's MQ Technical Conference v2.0.1.6
OMEGAMON for DB2
Capitalware's MQ Technical Conference v2.0.1.627
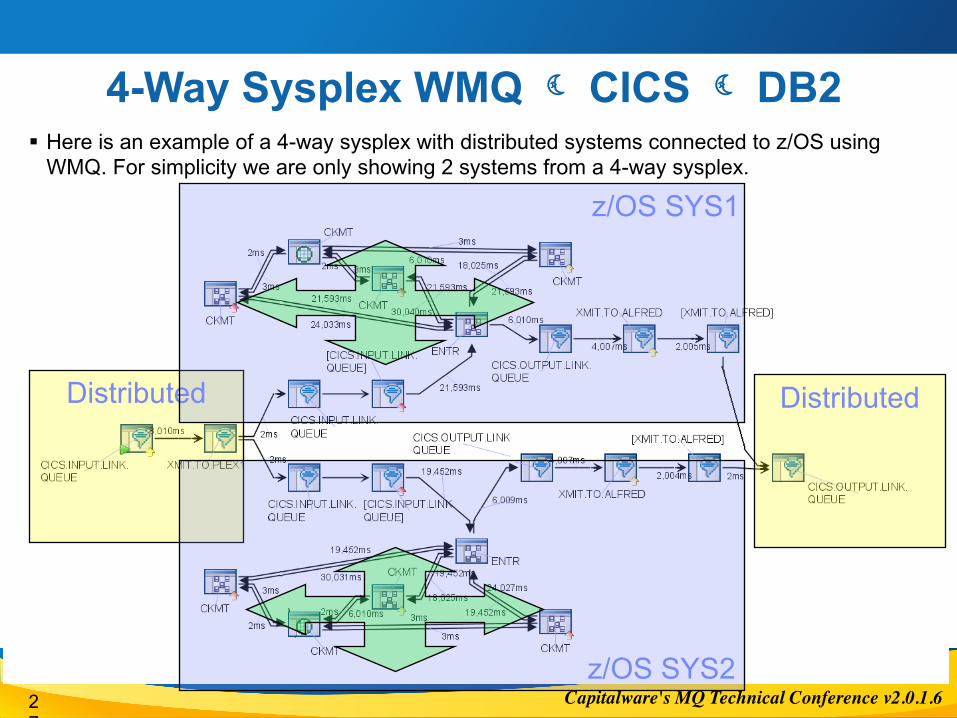
4-Way Sysplex WMQ à CICS à DB2§ Here is an example of a 4-way sysplex with distributed systems connected to z/OS using
WMQ. For simplicity we are only showing 2 systems from a 4-way sysplex.
Distributed Distributed
z/OS SYS1
z/OS SYS2

Capitalware's MQ Technical Conference v2.0.1.628
4-Way Sysplex WMQ à CICS à DB2§ The distributed application drives CICS and DB2 on the host. The red arrow shows the path
of a WMQ message originating on a distributed system and flowing through to the z/OS sysplex.
Distributed Distributed
z/OS SYS1
z/OS SYS2
The message is created and put to a remote queue (CICS.INPUT.LINK.QUEUE) on the distributed system. WMQ moves the message to z/OS via the xmit queue (XMIT.TO.PLEX1).
Capitalware's MQ Technical Conference v2.0.1.629
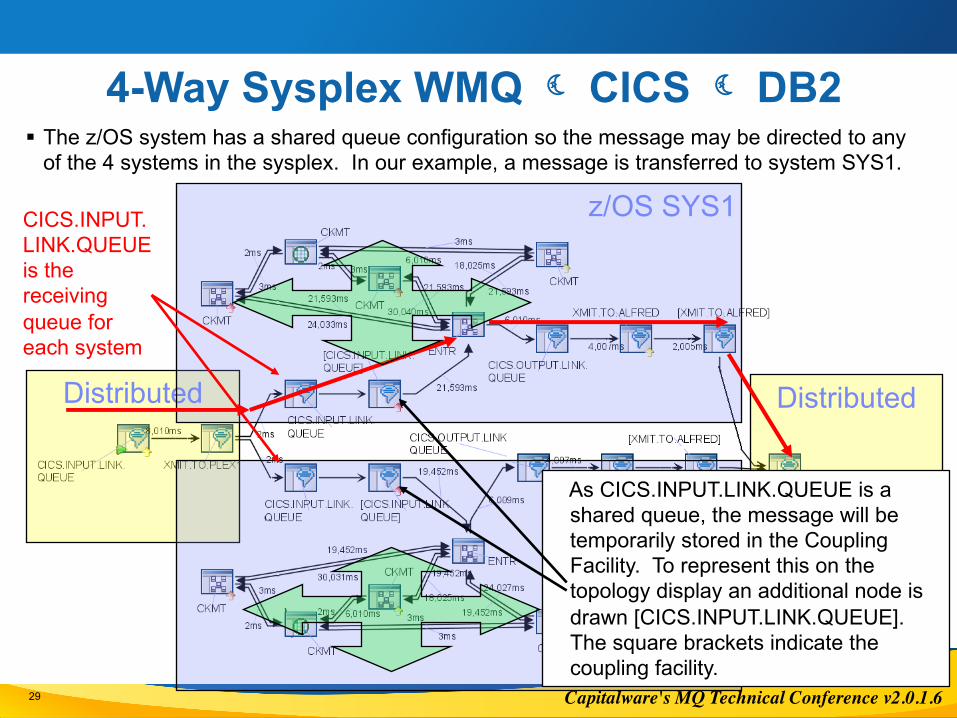
4-Way Sysplex WMQ à CICS à DB2§ The z/OS system has a shared queue configuration so the message may be directed to any
of the 4 systems in the sysplex. In our example, a message is transferred to system SYS1.
Distributed Distributed
z/OS SYS1
z/OS SYS2
As CICS.INPUT.LINK.QUEUE is a shared queue, the message will be temporarily stored in the Coupling Facility. To represent this on the topology display an additional node is drawn [CICS.INPUT.LINK.QUEUE]. The square brackets indicate the coupling facility.
CICS.INPUT.LINK.QUEUE is the receiving queue for each system
Capitalware's MQ Technical Conference v2.0.1.6
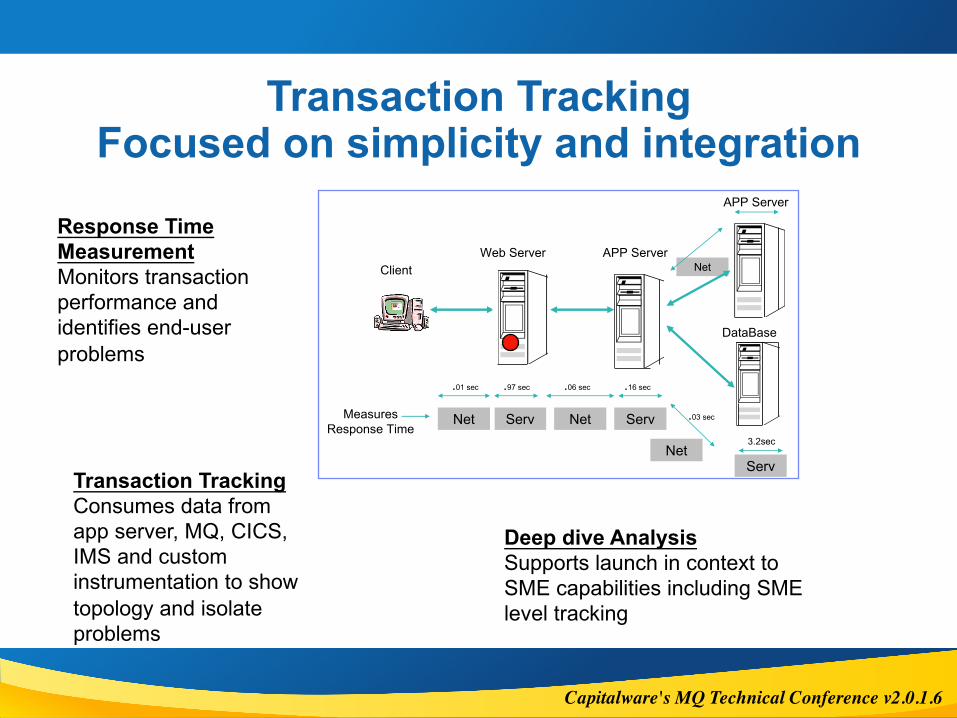
Transaction Tracking Focused on simplicity and integration
Net
Net Serv Net Serv
ServNet
ClientWeb Server APP Server
DataBase
APP Server
Measures Response Time
.01 sec .97 sec .06 sec .16 sec
.03 sec
3.2sec
Response Time MeasurementMonitors transaction performance and identifies end-user problems
Transaction TrackingConsumes data from app server, MQ, CICS, IMS and custom instrumentation to show topology and isolate problems
Deep dive AnalysisSupports launch in context to SME capabilities including SME level tracking
4.4 sec
Capitalware's MQ Technical Conference v2.0.1.6
Summary¡ End User Monitoring is critical
� Real User Monitoring� Synthetic Transaction Monitoring
¡ Transaction Tracking in today’s complex environments is critical
¡ Performance needs to include all platforms/systems� Leads to closer collaboration between departments
¡ Standardize on tooling on each platform
¡ Standardize on metrics provided & measured where possible
¡ Standardize on a single pane of glass application view
¡ Standardize on dashboard design
¡ Applications should not go into production without adequate monitoring

Capitalware's MQ Technical Conference v2.0.1.6
Questions & Answers