Embed Size (px)
Citation preview

2008
-14
Swis
s Na
tion
al B
ank
Wor
king
Pap
ers
What Drives the Swiss Franc?Samuel Reynard

The views expressed in this paper are those of the author(s) and do not necessarilyrepresent those of the Swiss National Bank. Working Papers describe research in progress.Their aim is to elicit comments and to further debate.
ISSN 1660-7716 (printed version)ISSN 1660-7724 (online version)
© 2008 by Swiss National Bank, Börsenstrasse 15, P.O. Box, CH-8022 Zurich
What Drives the Swiss Franc?
Samuel Reynard∗
Swiss National Bank
Abstract
This paper analyzes the behavior of the Swiss franc (CHF) over the past 35years. It relates the evolution of the CHF exchange rates to economic funda-mentals like the relative competitiveness of the Swiss export sector, accumu-lated current accounts, interest rate differentials and oil prices. Some factorslike the introduction of the euro, a relative increase in Swiss domestic pro-ductivity and higher oil prices seem to have modified the CHF behavior inthe last decade, but more data will be needed to draw definitive conclusions.The paper relies on different data sources and assesses potential exchange ratedeterminants under different angles. Overall, measurement and econometricissues would make it difficult to determine a unique econometric specificationor specific values for equilibrium exchange rates.JEL classification: F31; F32Keywords: Swiss franc; exchange rates; fundamentals
∗Swiss National Bank, Research Unit, Boersenstrasse 15, 8022 Zurich, Switzerland. Phone: +4144 631 3216. Email: [email protected]. The views expressed in this paper are my own anddo not necessarily reflect those of the Swiss National Bank. I am grateful to Katrin Assenmacher-Wesche, Philipp Hildebrand, Thomas Jordan, Jean-Pierre Roth, Nicolas Stoffels, an anonymousreferee and SNB seminar participants for helpful comments and discussions, and to Matthias Kur-mann for invaluable research assistance. Bernd Schnatz, Tobias Blattner, Ricardo Pereira andAlberto Gonzales Pandiella from the ECB external developments and external statistics divisionskindly provided to me data used in Maeso-Fernandez, Osbat, and Schnatz (2001) as well as themethodology to update the dataset.
1
1. Introduction
This paper assesses the potential factors influencing the evolution of the Swiss franc
exchange rates. As no encompassing theoretical framework exists in the literature,
I use an empirical approach coined in the literature as the Behavioral Equilibrium
Exchange Rate (BEER) approach, and analyze what drives the evolution of CHF
relative to the euro, the US dollar and the 24 main trading partners of Switzerland.
Many factors can potentially drive currency developments. This paper discusses
the main factors usually considered in the vast empirical literature on exchange rates
and for which reliable data is available. It is thus a descriptive analysis that tries to
characterize and relate main CHF developments to selected economic variables, and
does not attempt to address monetary policy questions or to provide a framework for
exchange rate forecasting.
I start in section 2 by displaying the behavior of the different Swiss franc real
exchange rates. Then, in section 3, I discuss potential determinants of the Swiss
franc and present econometric results. I distinguish between relative tradable and
non-tradable good price movements, and argue that different CHF exchange rates
can be characterized differently in that respect. Direct and indirect evidence on
Balassa-Samuelson effects, the most common argument to explain relative tradable
vs. non-tradable good price developments, are then presented and related to real
exchange rate movements in light of historical and structural developments in order
to shed some light on the evolution of CHF exchange rates. I then discuss and
quantify the effects of other main factors usually studied in the empirical exchange
rate literature, like accumulated current accounts, interest rate differentials and oil
prices.
2
The introduction of the euro has represented a major event in the currency market,
especially for Switzerland in the middle of the European continent. Section 4 presents
recent changes in CHF fluctuations following the introduction of the euro, suggesting
some structural changes in CHF dynamics. Finally, the last section provides some
conclusions. The analysis suggests that some factors like the introduction of the euro,
a relative increase in Swiss domestic productivity and higher oil prices seem to have
affected the behavior of the Swiss franc over the past ten year, but more data will be
needed to draw definitive conclusions.
2. Long-term behavior of the Swiss franc real exchange rates
2.1. Exchange rate concepts and definitions
The main exchange rate concept, relevant for exporters as well as policy makers,
is the real exchange rate. Let e be the nominal exchange rate, expressed as units of
foreign currency for one Swiss franc, i.e. an increase in e represents an appreciation
of the Swiss franc, and let the real exchange rate be
q = e+ pC − p∗C , (1)
where pC is the consumer price index (CPI) and a star denotes a foreign variable.
Lower-case variables are logarithms.
Two types of exchange rates will be analyzed. First, I compute an effective ex-
change rate relative to 24 trading partners of Switzerland, using average overall trade
weights that take into account third-market effects (see appendix). These overall
weights incorporate both export and import patterns. Accounting for third-market
3
effects means that the weights’ computation captures the competition faced by Swiss
exporters in foreign markets from both domestic producers and exporters from third
countries. For example, it measures the competition faced by Swiss exporters from
German producers both in Germany and in other countries where German exporters
are present. The second exchange rate considered is the CHF/euro exchange rate,
where the same third-market effects weighting scheme (but with only euro area coun-
tries) as described above is used. I will also analyze the behavior of the CHF/dollar
exchange rate.
2.2. Real exchange rates evolution
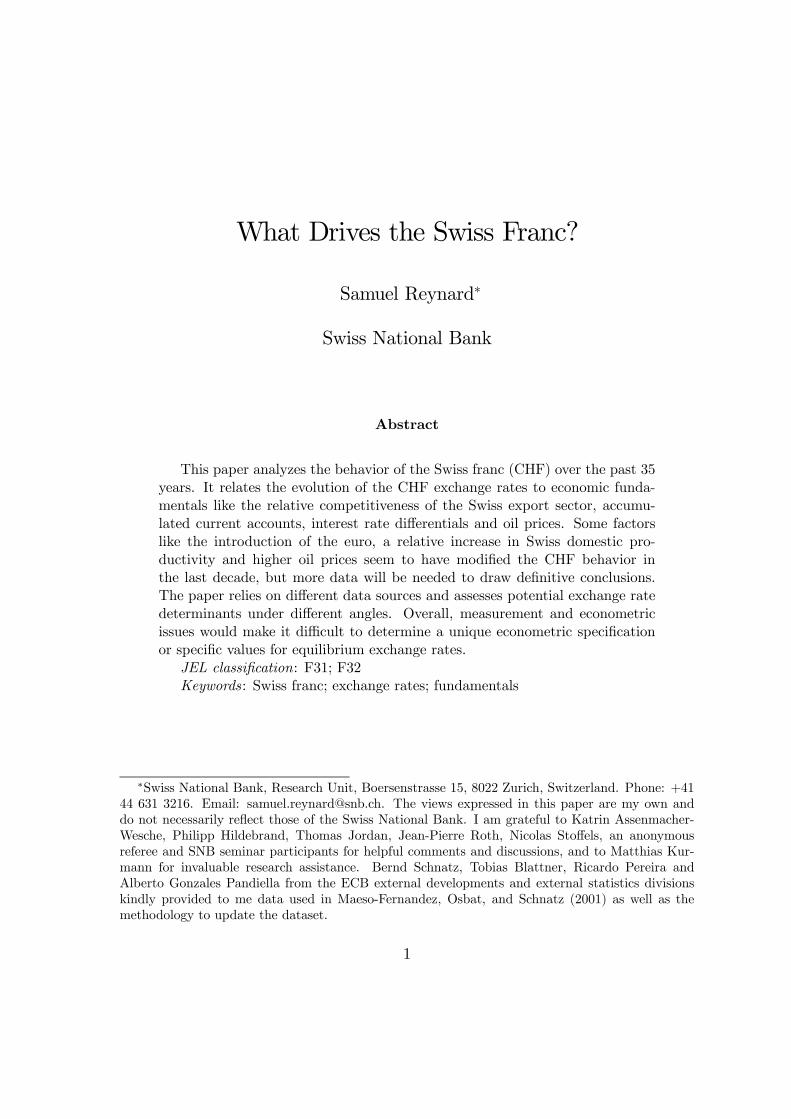
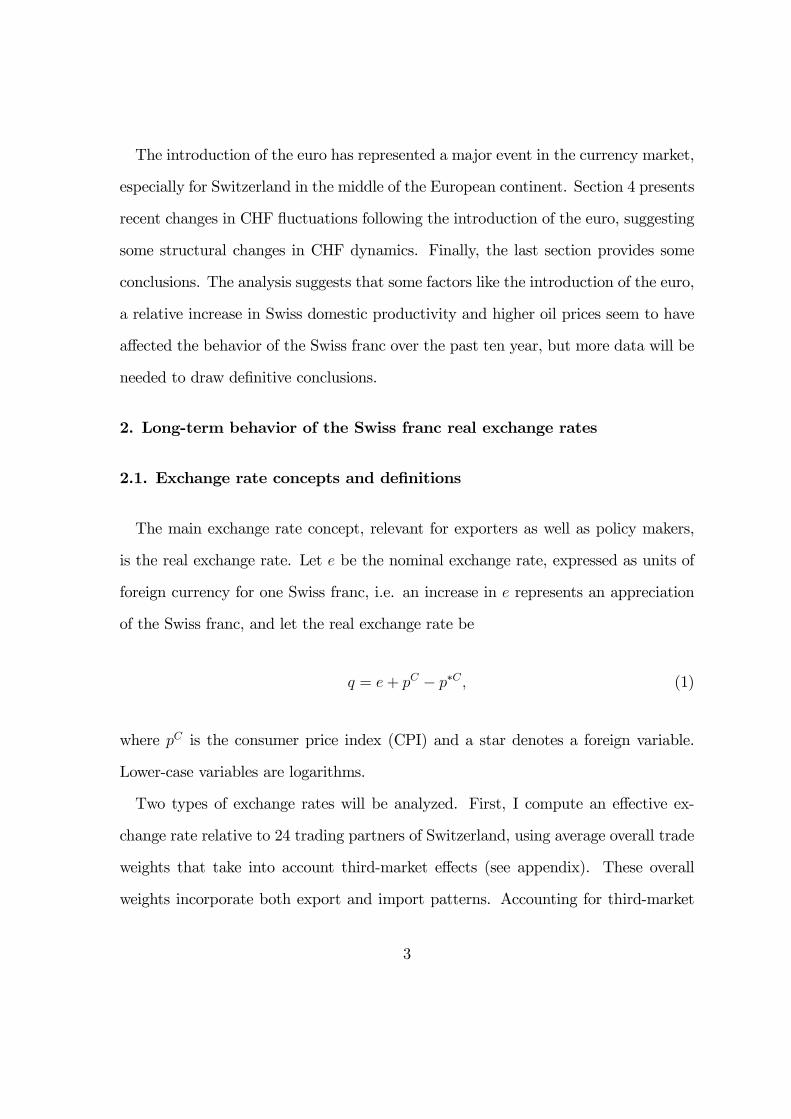
The behavior of the Swiss franc (CHF) real exchange rates (RER) relative to the
German mark (DM), where the irrevocable exchange rate euro/DM is used since 1999,
the euro, the US dollar (US$), and to the currencies of Switzerland’s 24 main trading
partners are displayed in Figure 1, since the beginning of the floating period in 1973.
Data sources are described in the appendix.
The Swiss real exchange rate thus exhibits different behavior depending on the
currency considered. It displays an upward trend (appreciation) relative to European
currencies and relative to its main trading partners in general (effective RER), but
there is no clear long-term trend relative to the US dollar. Causes of these different
evolutions will be analyzed below.
3. Determinants of Swiss franc trends and fluctuations
This section analyzes the potential factors influencing the evolution of the Swiss
franc.
4
-.9
-.8
-.7
-.6
-.5
-.4
-.3
1975 1980 1985 1990 1995 2000 2005
DM/CHF RER
1.5
1.6
1.7
1.8
1.9
2.0
1975 1980 1985 1990 1995 2000 2005
€/CHF RER
-.9
-.8
-.7
-.6
-.5
-.4
-.3
-.2
-.1
.0
1975 1980 1985 1990 1995 2000 2005
US$/CHF RER
1.2
1.3
1.4
1.5
1.6
1.7
1.8
1975 1980 1985 1990 1995 2000 2005
Effective RER
Fig. 1. Swiss Franc Real Exchange Rates
3.1. Purchasing power parity
According to the Purchasing Power Parity (PPP) theory, the real exchange rate
should fluctuate around a constant. FromFigure 1 above, this is obviously not the case
for the euro/CHF nor for the effective real exchange rates. The real exchange rates
of the Swiss franc relative to these currencies are appreciating over time. Assuming a
constant exchange rate, as it is done when the PPP methodology is used to compute
equilibrium exchange rates, is thus inappropriate to assess the equilibrium value of
the euro/CHF or the effective exchange rate of the Swiss franc.
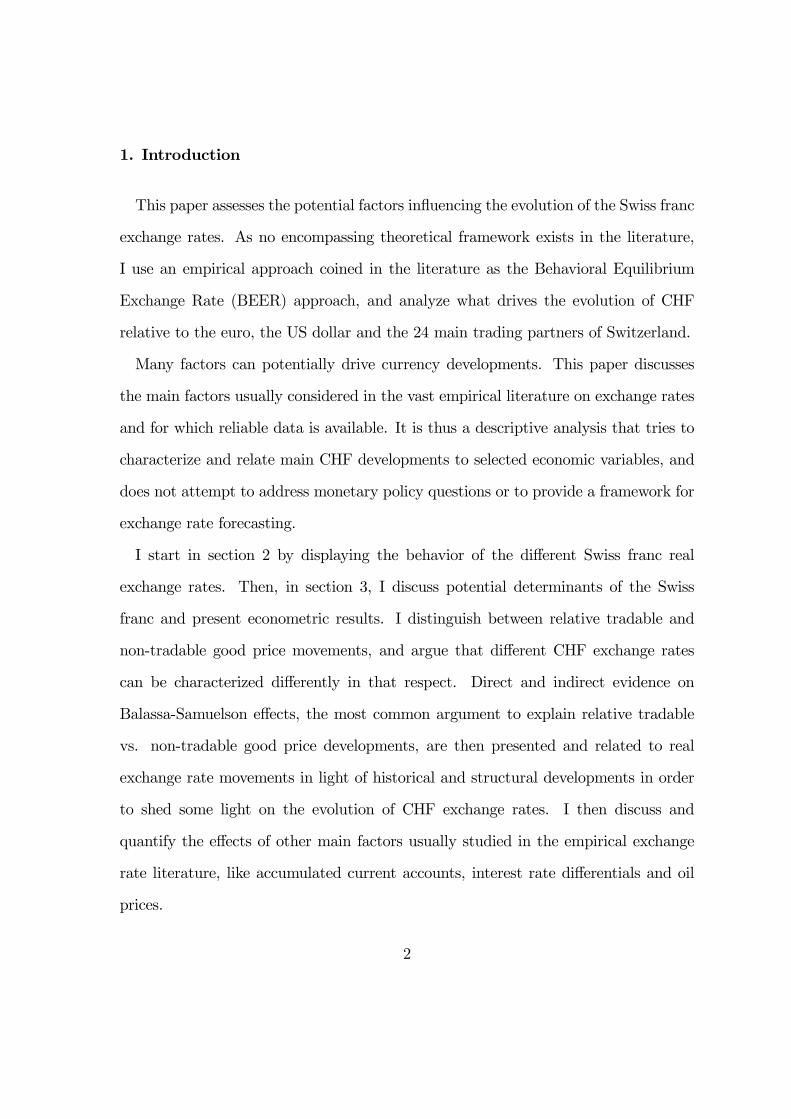
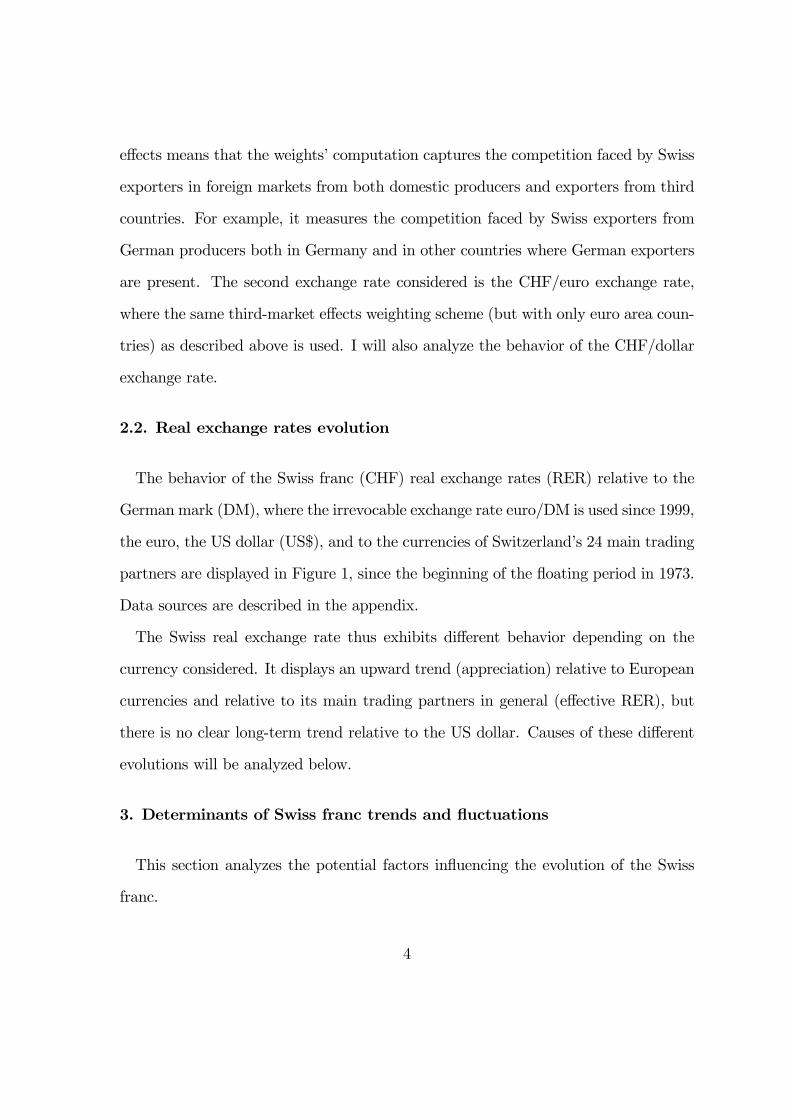
Figure 2 further illustrates this point by displaying the nominal exchange rate
5
euro/CHF and PPP computed with basis periods in 1980 and 1990. As time passes,
1
1.5
2
2.5
3
3.5
419
74
1975
1976
1977
1978
1979
1980
1981
1982
1983
1984
1985
1986
1987
1988
1989
1990
1991
1992
1993
1994
1995
1996
1997
1998
1999
2000
2001
2002
2003
Nominal Exchange Rate CHF/Euro PPP 1980 PPP 1990
Fig. 2. Nominal Exchange Rate (CHF/Euro) and PPP
the Swiss franc appears increasingly over-valued. Even if we take the mean of the
sample as the basis value or another method to determine the exchange rate equation
constant, a trend-appreciating currency would always appear over-valued at the end
of the sample if PPP is used.
We thus need to understand the causes of the trend real appreciation of the Swiss
franc that makes PPP break down for the euro/CHF exchange rate but not for the
US$/CHF, given that the US$/CHF exchange rate does not exhibit a trend.
There are several reasons why PPP might not hold, for any currency1. For example,
consumers’ preferences differ from one country to another, and so do their consump-
tion baskets and CPI. Moreover, there are transportation and adjustment costs that
1For a critical review of equilibrium exchange rate theories and methods, see e.g. Driver andWestaway (2004) and Égert, Halpern and MacDonald (2006).
6
make the law of one price for tradable goods break down. And also importantly, the
law of one price might fail as countries are trading differentiated products and price
discrimination occurs between countries’ markets.
The most severe deviation from PPP might however come from a divergence be-
tween prices of non-tradable goods and services between countries. We can express
the consumer price index pC as a weighted average of tradable pT and non-tradable
pNT good prices; assuming the same share across countries, we get
pC = αpT + (1− α) pNT
and
p∗C = αp∗T + (1− α) p∗NT .
Using equation (1), we then obtain
q = e+£αpT + (1− α) pNT
¤− £αp∗T + (1− α) p∗NT¤,
and, re-arranging,
q = e+ p∗T − pT + (1− α)£¡p∗NT − p∗T
¢− ¡pNT − pT¢¤.
The real exchange rate can thus be decomposed as the real exchange rate of tradable
goods qT and the relative evolution of the tradable vs. non-tradable good prices qNT/T
of the countries considered,
q = qT + qNT/T ,
were qT = e+ p∗T − pT and qNT/T = (1− α)£¡p∗NT − p∗T
¢− ¡pNT − pT¢¤.
7
The main question is then to find out whether the real exchange rate is mostly
driven by deviations from the law of one price (PPP) for tradable goods, or by per-
sistent changes in the relative tradable vs. non-tradable goods price ratio. Two
questions should be addressed in the empirical analysis. First, we need to know
whether variations in relative prices qNT/T are significant or not. And if so, we want
to assess at which frequency these relative prices are relevant for the evolution of
the real exchange rate, i.e. whether relative prices drive the real exchange rate for
relatively short-term fluctuations or for long-term trends.
Analyzes of other industrialized currencies have usually shown that the relative
price ratio qNT/T is not significant. In fact, this ratio is significant only for a few
developing countries. However, in contrast, as shown in the analysis below, the ratio
qNT/T is highly significant in CHF equations and explains substantial fluctuations of
the CHF relative to other currencies, both in the short and long run. This relative
price ratio in fact explains major as well as minor fluctuations for CHF/euro exchange
rate, but only long-term trends for the CHF/dollar exchange rate. The PPP for trad-
able goods thus holds at different frequencies: US dollar tradable PPP deviations are
much more substantial and persistent and explain major exchange rate fluctuations;
in contrast, euro tradable PPP deviations are small and relatively short-lived (2-5
years), and major CHF/euro exchange rate fluctuations are explained by the relative
price ratio qNT/T .
Different factors can drive the qNT/T ratio. The most common explanation is the
Balassa-Samuelson (BS) effect. I will argue below that it is the most plausible cause,
based on divergent evolutions of euro and US dollar exchange rate developments
relative to the Swiss franc, on the evolution of the current account, as well as on the
8
effects of historical facts like the German reunification on the joint behavior of the BS
proxy and the real exchange rate. Moreover, as shown in section 3.2.2, the BS effect
is supported by direct sectorial productivity evidence in the 1990s, although recent
developments of direct and indirect evidence diverge.
After determining that it is the relative non-tradable/tradable price ratio that
mainly drives the CHF/euro exchange rate, I then look at factors potentially affecting
the purchasing power parity of tradable goods, like accumulated current accounts and
oil prices, which cause exchange rate movements in order to re-equilibrate the balance
of payment.
3.2. Balassa-Samuelson effect
A potential cause of departing from PPP is the Balassa-Samuelson (BS) effect (see
Balassa, 1964, and Samuelson, 1964), through which a country with relatively fast
increases in productivity in its export sector experiences a real appreciation via an
increase in relative prices of non-tradable to tradable goods and services.
3.2.1. Indirect measurement
As direct evidence on sectorial productivity is not available for the whole period
considered, consider first an indirect measure (BS), i.e. the relative ratio of the Con-
sumer Price Index (CPI) to the Producer Price Index (PPI) for the countries con-
sidered. The proxy can be written as (CPI/PPI) / (CPI∗/PPI∗), where a star (*)
represents a weighted average of the trading partners considered. The CPI contains
more non-tradable goods and services than does the PPI, thus this ratio represents
a proxy for the relative evolution of the prices of non-tradable to tradable goods and
9
services. A country with relatively higher productivity increases in its export sector
experiences a relatively higher price increase in its domestic sector, and thus an in-
creasing CPI/PPI ratio. The proxy should therefore account for deviations from PPP
due to the BS effect.
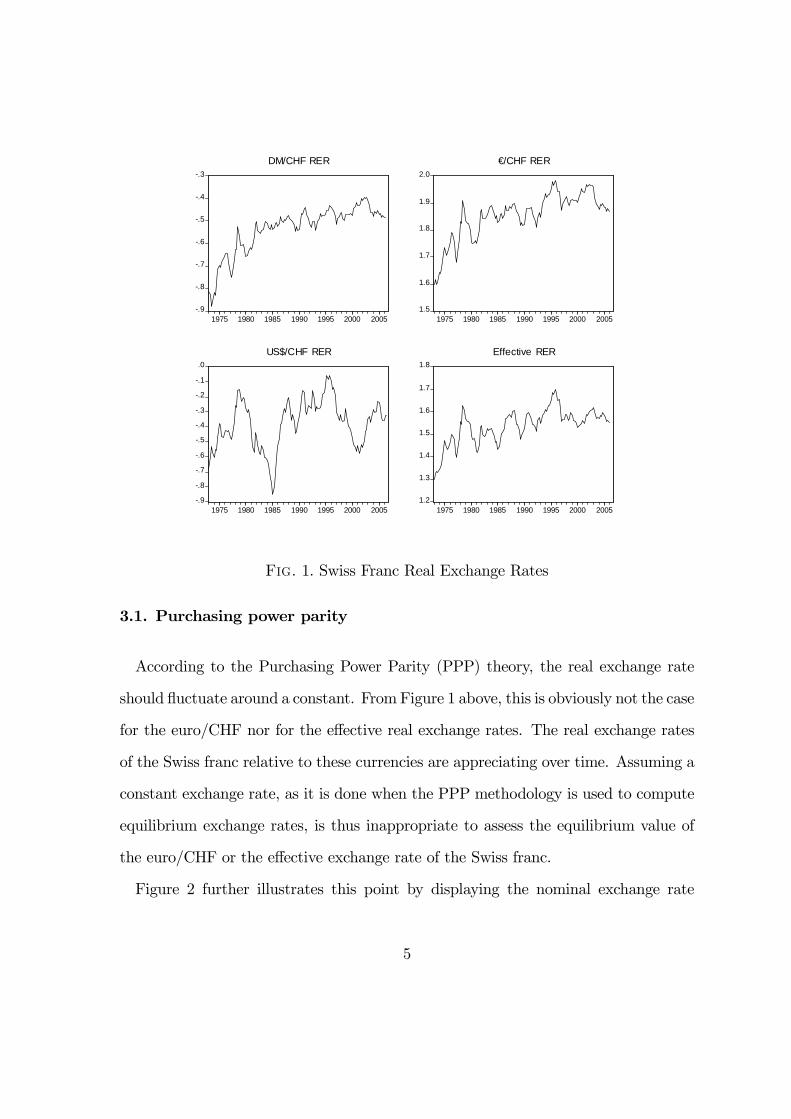
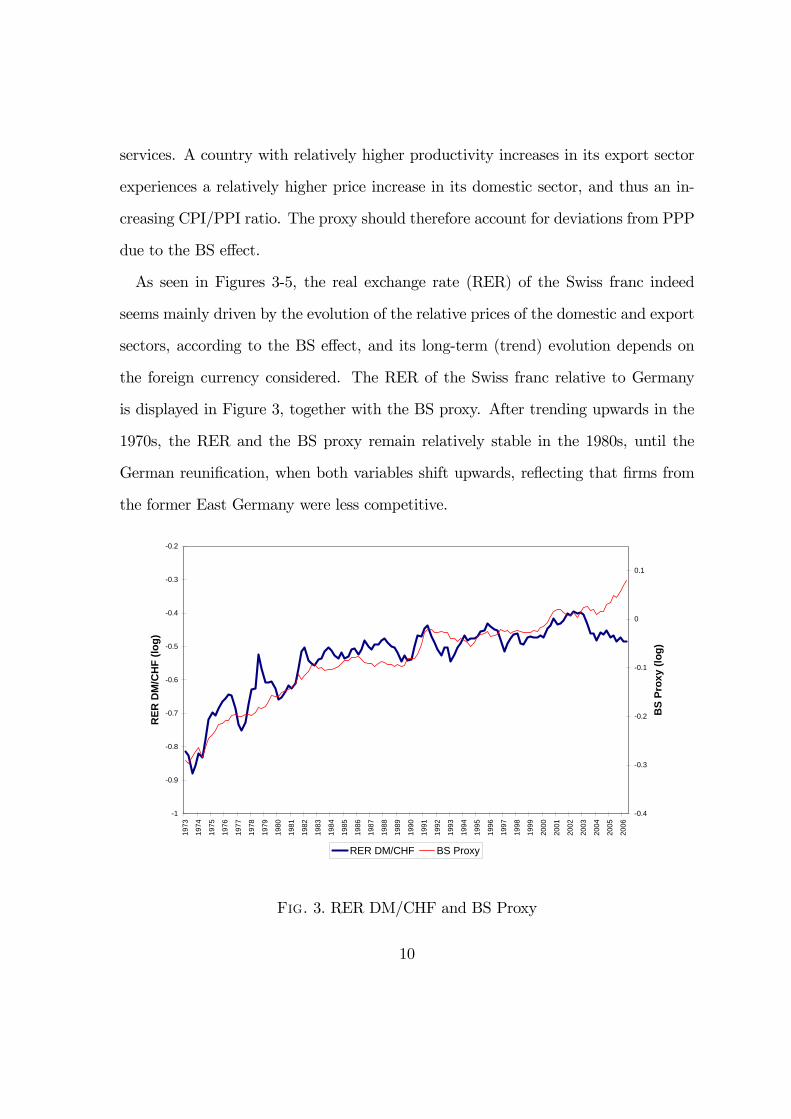
As seen in Figures 3-5, the real exchange rate (RER) of the Swiss franc indeed
seems mainly driven by the evolution of the relative prices of the domestic and export
sectors, according to the BS effect, and its long-term (trend) evolution depends on
the foreign currency considered. The RER of the Swiss franc relative to Germany
is displayed in Figure 3, together with the BS proxy. After trending upwards in the
1970s, the RER and the BS proxy remain relatively stable in the 1980s, until the
German reunification, when both variables shift upwards, reflecting that firms from
the former East Germany were less competitive.
-1
-0.9
-0.8
-0.7
-0.6
-0.5
-0.4
-0.3
-0.2
1973
1974
1975
1976
1977
1978
1979
1980
1981
1982
1983
1984
1985
1986
1987
1988
1989
1990
1991
1992
1993
1994
1995
1996
1997
1998
1999
2000
2001
2002
2003
2004
2005
2006
RER
DM
/CH
F (lo
g)
-0.4
-0.3
-0.2
-0.1
0
0.1
BS
Prox
y (lo
g)
RER DM/CHF BS Proxy
Fig. 3. RER DM/CHF and BS Proxy
10
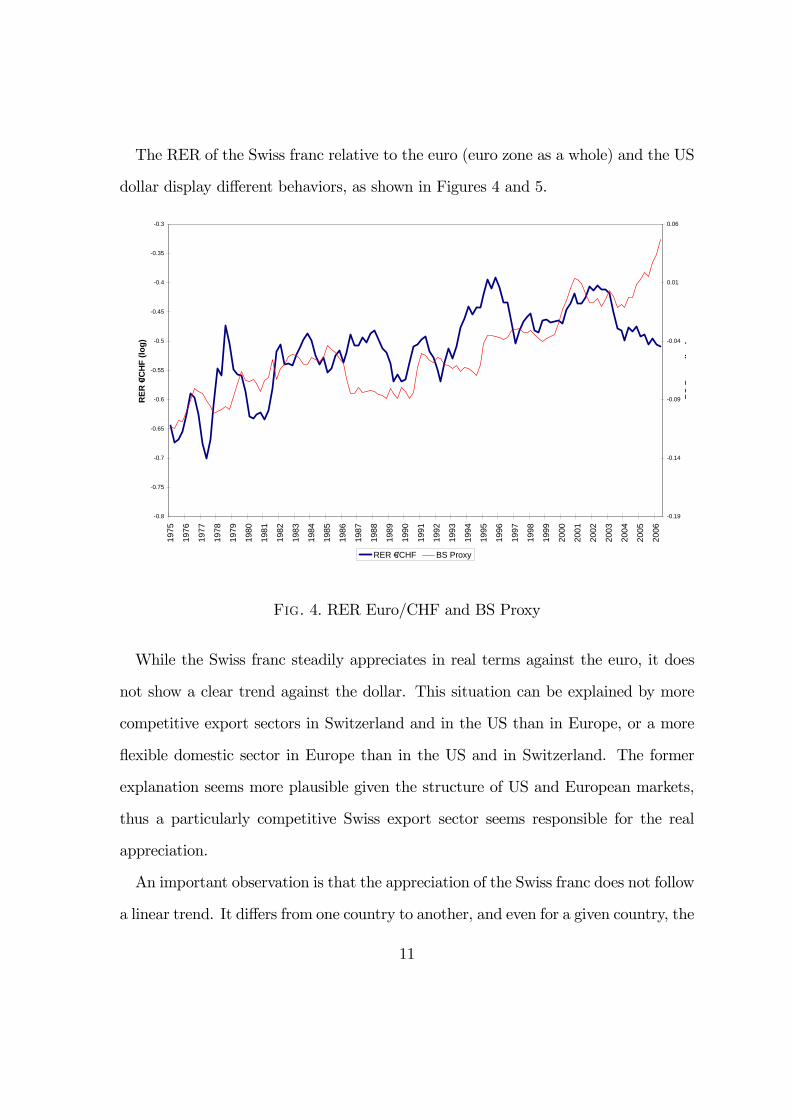
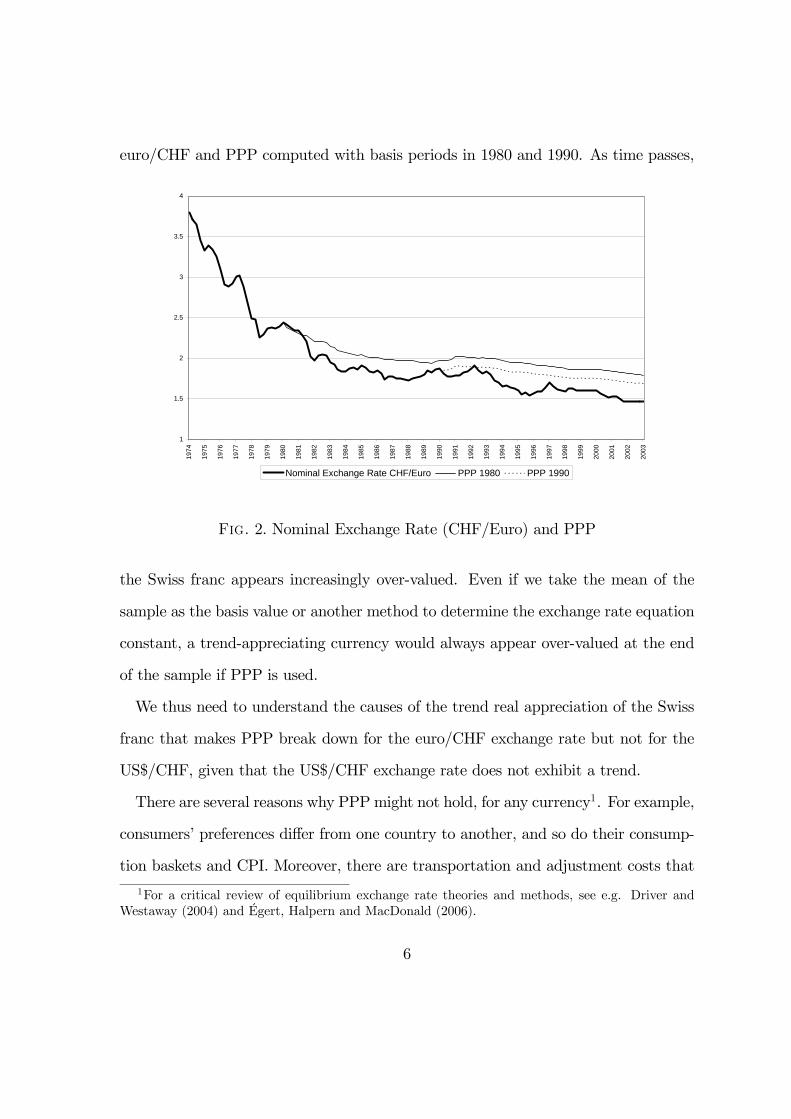
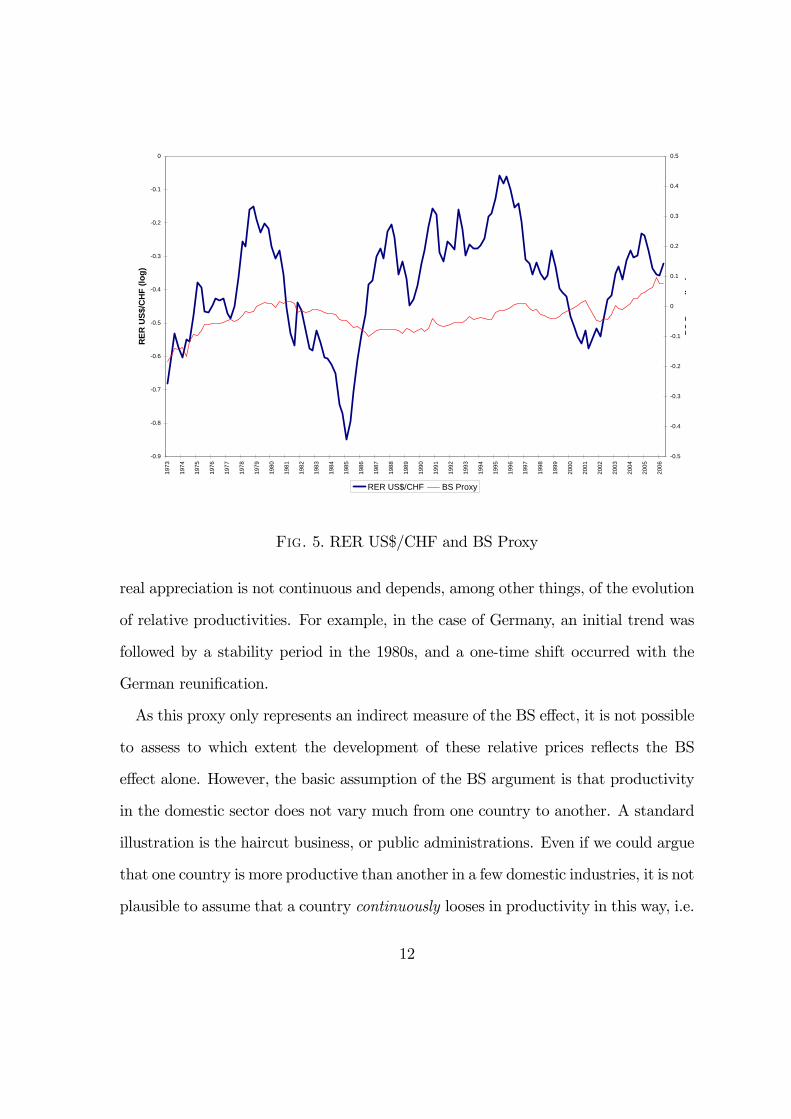
The RER of the Swiss franc relative to the euro (euro zone as a whole) and the US
dollar display different behaviors, as shown in Figures 4 and 5.
-0.8
-0.75
-0.7
-0.65
-0.6
-0.55
-0.5
-0.45
-0.4
-0.35
-0.3
1975
1976
1977
1978
1979
1980
1981
1982
1983
1984
1985
1986
1987
1988
1989
1990
1991
1992
1993
1994
1995
1996
1997
1998
1999
2000
2001
2002
2003
2004
2005
2006
RER
€/C
HF
(log)
-0.19
-0.14
-0.09
-0.04
0.01
0.06
BS
P(l
)
RER €/CHF BS Proxy
Fig. 4. RER Euro/CHF and BS Proxy
While the Swiss franc steadily appreciates in real terms against the euro, it does
not show a clear trend against the dollar. This situation can be explained by more
competitive export sectors in Switzerland and in the US than in Europe, or a more
flexible domestic sector in Europe than in the US and in Switzerland. The former
explanation seems more plausible given the structure of US and European markets,
thus a particularly competitive Swiss export sector seems responsible for the real
appreciation.
An important observation is that the appreciation of the Swiss franc does not follow
a linear trend. It differs from one country to another, and even for a given country, the
11
-0.9
-0.8
-0.7
-0.6
-0.5
-0.4
-0.3
-0.2
-0.1
0
1973
1974
1975
1976
1977
1978
1979
1980
1981
1982
1983
1984
1985
1986
1987
1988
1989
1990
1991
1992
1993
1994
1995
1996
1997
1998
1999
2000
2001
2002
2003
2004
2005
2006
RER
US$
/CH
F (lo
g)
-0.5
-0.4
-0.3
-0.2
-0.1
0
0.1
0.2
0.3
0.4
0.5
BS
P(l
)
RER US$/CHF BS Proxy
Fig. 5. RER US$/CHF and BS Proxy
real appreciation is not continuous and depends, among other things, of the evolution
of relative productivities. For example, in the case of Germany, an initial trend was
followed by a stability period in the 1980s, and a one-time shift occurred with the
German reunification.
As this proxy only represents an indirect measure of the BS effect, it is not possible
to assess to which extent the development of these relative prices reflects the BS
effect alone. However, the basic assumption of the BS argument is that productivity
in the domestic sector does not vary much from one country to another. A standard
illustration is the haircut business, or public administrations. Even if we could argue
that one country is more productive than another in a few domestic industries, it is not
plausible to assume that a country continuously looses in productivity in this way, i.e.
12
that the relative Swiss domestic sector productivity growth rate has been relatively
decreasing in the past 30 years, especially given the state of domestic competitiveness
of Switzerland main trading partners. Direct as well as indirect evidence of a BS effect
for the CHF/DM exchange rate has been documented in Aebersold and Brunetti
(1998). Moreover, as pointed out by Genberg and Kadareja (2001), the strong Swiss
current account position suggests no loss of competitiveness and supports the BS
explanation based on productivity differentials.
Another important fact is that the CHF/euro exchange rate evolves closely with
the BS proxy, even in the short-run, meaning that deviations from tradable PPP is
small and short-lived. In contrast deviations from tradable PPP are substantial and
persistent for the US dollar. The competitiveness of the export sector is thus more
often and significantly distorted with respect to the dollar zone than with respect to
the euro zone.
The situation of the mid-1990s can be assessed with the above graphs. The mid-
1990s was a particularly turbulent time on foreign exchange markets, with specu-
lative attacks on the European monetary system. From Figure 3, which displays
the DM/CHF exchange rate, the CHF does not appear to have been misaligned at
that time, whereas a relative strong CHF appears from Figure 4, which displays the
euro/CHF exchange rate, during this period. This thus seems to reflect the fact that,
during the 1990s, the apparent strong Swiss franc was due to weak (undervalued) Eu-
ropean currencies, which were under speculative attacks, rather than an overvaluation
of the Swiss franc itself.
13
3.2.2. Direct measurement
This section provides direct evidence on the factors driving the Balassa-Samuelson
(BS) effect. It shows a recent stabilization of the BS effect with respect to the euro
and a recent inversion of the effect with respect to the US dollar.
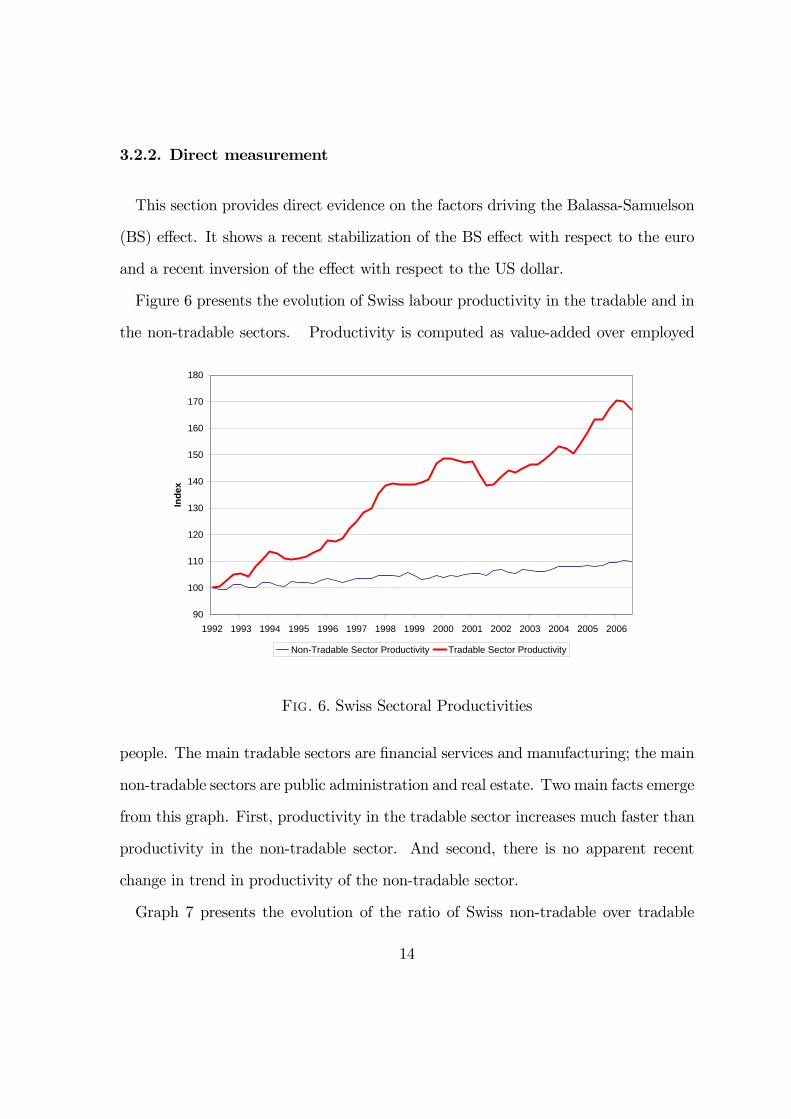
Figure 6 presents the evolution of Swiss labour productivity in the tradable and in
the non-tradable sectors. Productivity is computed as value-added over employed
90
100
110
120
130
140
150
160
170
180
1992 1993 1994 1995 1996 1997 1998 1999 2000 2001 2002 2003 2004 2005 2006
Inde
x
Non-Tradable Sector Productivity Tradable Sector Productivity
Fig. 6. Swiss Sectoral Productivities
people. The main tradable sectors are financial services and manufacturing; the main
non-tradable sectors are public administration and real estate. Two main facts emerge
from this graph. First, productivity in the tradable sector increases much faster than
productivity in the non-tradable sector. And second, there is no apparent recent
change in trend in productivity of the non-tradable sector.
Graph 7 presents the evolution of the ratio of Swiss non-tradable over tradable
14
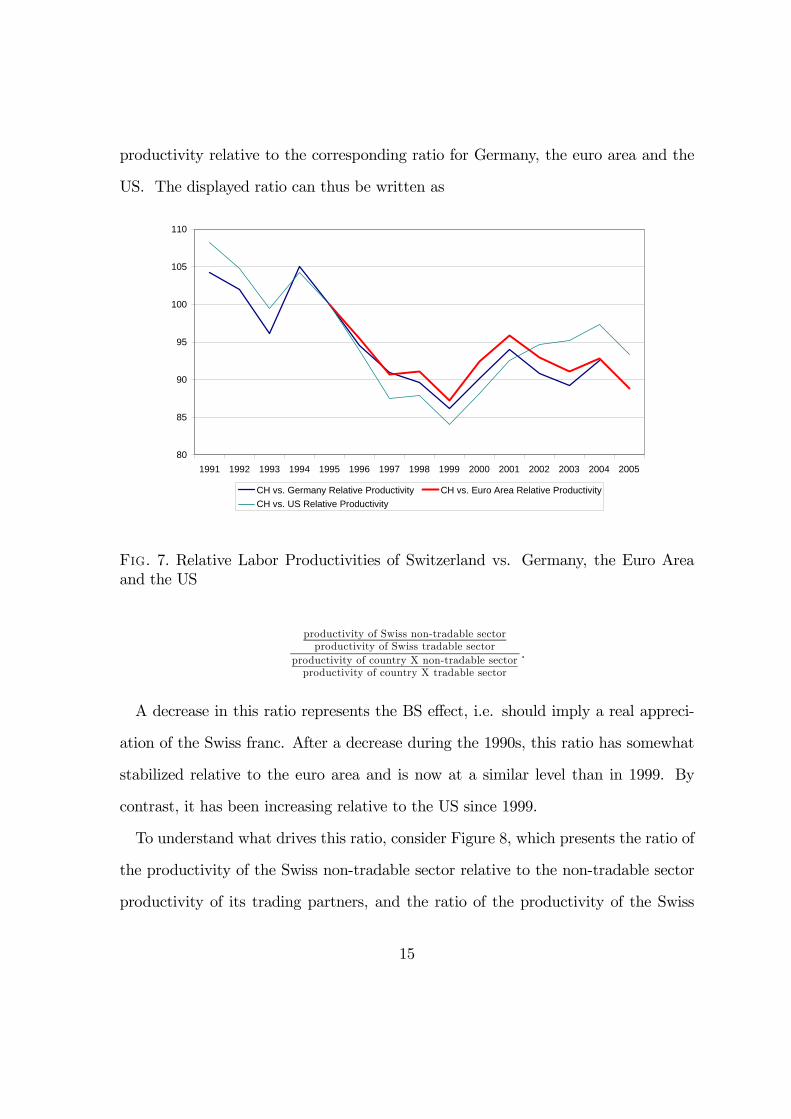
productivity relative to the corresponding ratio for Germany, the euro area and the
US. The displayed ratio can thus be written as
80
85
90
95
100
105
110
1991 1992 1993 1994 1995 1996 1997 1998 1999 2000 2001 2002 2003 2004 2005
CH vs. Germany Relative Productivity CH vs. Euro Area Relative ProductivityCH vs. US Relative Productivity
Fig. 7. Relative Labor Productivities of Switzerland vs. Germany, the Euro Areaand the US
productivity of Swiss non-tradable sectorproductivity of Swiss tradable sector
productivity of country X non-tradable sectorproductivity of country X tradable sector
.
A decrease in this ratio represents the BS effect, i.e. should imply a real appreci-
ation of the Swiss franc. After a decrease during the 1990s, this ratio has somewhat
stabilized relative to the euro area and is now at a similar level than in 1999. By
contrast, it has been increasing relative to the US since 1999.
To understand what drives this ratio, consider Figure 8, which presents the ratio of
the productivity of the Swiss non-tradable sector relative to the non-tradable sector
productivity of its trading partners, and the ratio of the productivity of the Swiss
15
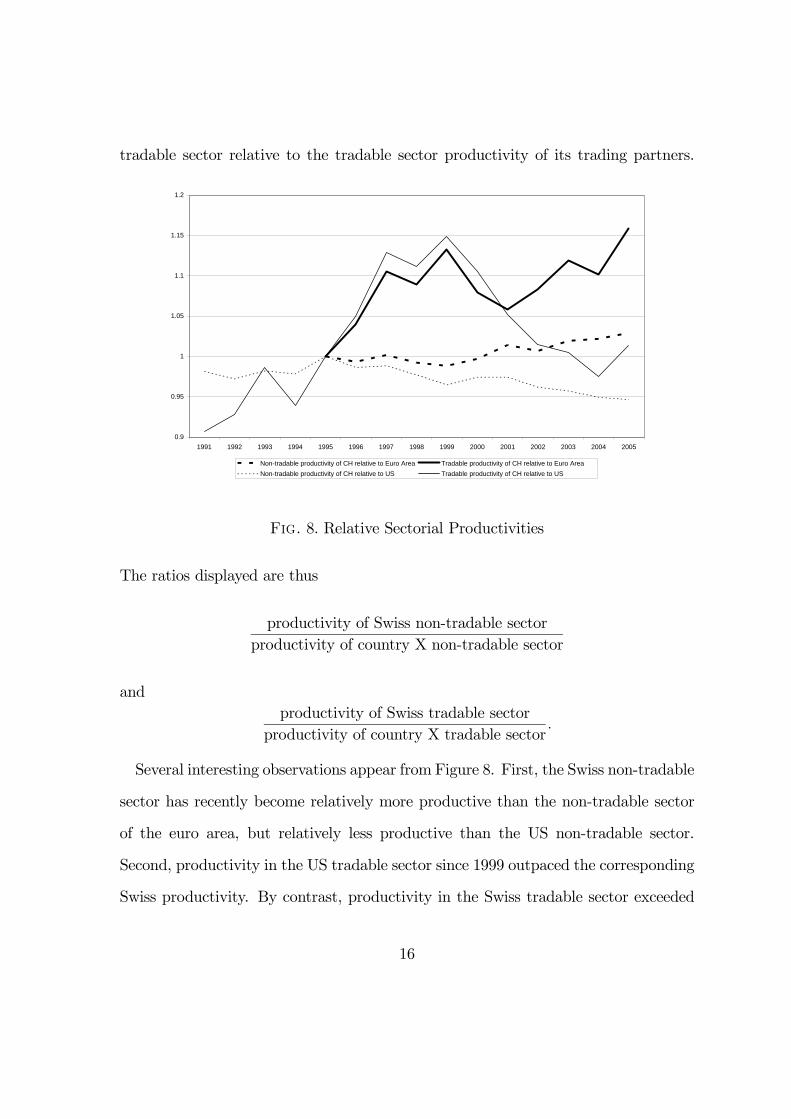
tradable sector relative to the tradable sector productivity of its trading partners.
0.9
0.95
1
1.05
1.1
1.15
1.2
1991 1992 1993 1994 1995 1996 1997 1998 1999 2000 2001 2002 2003 2004 2005
Non-tradable productivity of CH relative to Euro Area Tradable productivity of CH relative to Euro AreaNon-tradable productivity of CH relative to US Tradable productivity of CH relative to US
Fig. 8. Relative Sectorial Productivities
The ratios displayed are thus
productivity of Swiss non-tradable sectorproductivity of country X non-tradable sector
andproductivity of Swiss tradable sector
productivity of country X tradable sector.
Several interesting observations appear from Figure 8. First, the Swiss non-tradable
sector has recently become relatively more productive than the non-tradable sector
of the euro area, but relatively less productive than the US non-tradable sector.
Second, productivity in the US tradable sector since 1999 outpaced the corresponding
Swiss productivity. By contrast, productivity in the Swiss tradable sector exceeded
16
European tradable sector productivity. All in all, Swiss productivity has recently
been more in line with European than the more dynamic US productivity. Thus, the
inverse BS effect that appears relative to the US since 1999 (in Figure 7) is due to an
increase in the US tradable sector productivity relative to the Swiss tradable sector
productivity, rather than a relative productivity increase from the Swiss non-tradable
sector. However, since the beginning of this decade, Swiss domestic (internal) sector
productivity has increased faster than its European counterpart; this has offset the
faster relative productivity of the Swiss export sector and thus attenuated (flattened)
the Balassa-Samuelson effect.
Thus, although the indirect proxy BS presented in the previous section seems to
explain well the long-term evolution of Swiss franc exchange rates, more direct evi-
dence points to a recent diverging evolution, thus adding uncertainty in assessing the
potential development of the CHF exchange rates trend-evolution.
The mechanisms underlying the BS effect also provide some clues about the poten-
tial future trend evolution of the Swiss franc, which should depend on several factors.
As we saw on Figures 3-5, the real appreciation does not systematically follow a
trend, and the situation differs with respect to the currencies considered. On the one
hand, if productivity in the EU is boosted by the effect of higher integration, we can
imagine the bilateral exchange rate CHF/euro to evolve similarly to the exchange
rate CHF/dollar, with no long-run trend. If, on the other hand, the EU grows more
heterogeneously and includes less competitive countries, then gains in the Swiss trad-
able sector will keep appreciating the Swiss franc RER. From the Swiss side, bilateral
agreements with the EU leading to free movements for workers imply that an assump-
tion of BS, which is that labor supply is fixed, does not hold anymore and can thus
17
contribute to dampen the RER appreciation. Moreover, progress in the liberalization
and revitalization of the Swiss internal sector would dampen appreciation pressures
as well. The net effect of those different influences is difficult to quantify, and might
take time to unfold.
3.3. Other potential determinants
This section discusses other potential determinants of the Swiss franc real exchange
rates, and the corresponding variables will be used in the econometric analysis that
follows.
As there are no encompassing theory of exchange rate and thus no dominant ap-
proach of modeling equilibrium exchange rates, different approaches, more or less
theoretical, more or less oriented on the long- or short-run, coexist in the literature2.
The approach of this paper is to try explaining short- to medium-term CHF exchange
rates developments. In doing so, I consider various economic variables that different
theories have revealed as important. The methodology used is referred to as the
Behavioral Equilibrium Exchange Rate (BEER) approach in the literature. The ad-
vantage of this methodology is that it does not requires long data series and strong
assumptions regarding long-term equilibria, and it allows to assess short- to medium
term exchange rate developments by relating them directly to economic fundamentals
via simple single-equation regression methods.
The analysis is mostly based onMaeso-Fernandez, Osbat and Schnatz (MOS, 2001).
Each variable discussed here has been computed as the ratio (or difference) of the
Swiss variable divided by the corresponding weighted average of its trading partners,
2For a review of different methodologies, see e.g. Driver andWestaway (2004), and Égert, Halpernand MacDonald (2006).
18
where the weights account for imports, exports and third-market effects as discussed
in section 2.1.
The uncovered interest rate parity condition is assumed in many economic models.
In empirical analyses, the real exchange rate is usually expressed as
qt = qt + (rt − r∗t ) , (2)
where qt represents the equilibrium exchange rate and the second term in the RHS
represents real interest rate deviation from its trading partners counterpart. The idea
is that the exchange rate fluctuates around its equilibrium with interest rate differ-
entials. Given that interest rate differentials are usually non-stationary empirically,
they are included in econometric analyses; an increase in the differential is associated
with a stronger current exchange rate as the currency is expected to depreciate later
on. This condition thus translates into a positive relationship between the real inter-
est rate differential and the real exchange rate, i.e. a higher interest rate relative to
partners countries is associated with a stronger currency. Thus short- and long-term
interest rate differentials are examined.
Terms of trade shocks can also affect real exchange rates. Oil price fluctuations
(Oil), for example, can have a significant impact on the terms of trade of a small open
economy like Switzerland, without many natural resources. The sign of the empirical
effect of oil prices on a specific exchange rate is a priory unknown, and depends on
the weights of the different trading partners. An increase in oil price should affect
negatively the terms of trade and the competitiveness of a country that is relatively
more dependent on oil than its trading partners, and should thus have a depreciating
influence on the corresponding currency. In the empirical analysis, the real price of
19
oil deflated by the US producer price index is used.
Another potential determinant of real exchange rates is the net foreign asset po-
sition. As a country accumulates international assets, its exchange rate needs to
appreciate to re-equilibrate the balance of payments. The variable ACA used in the
analysis is the accumulated current account position as a percentage of GDP.
An additional cause of Swiss franc fluctuations, which seems related to the interna-
tional status of the Swiss currency, has been responsible for a structural break since
the introduction of the euro in 1999. It is discussed in section 4.
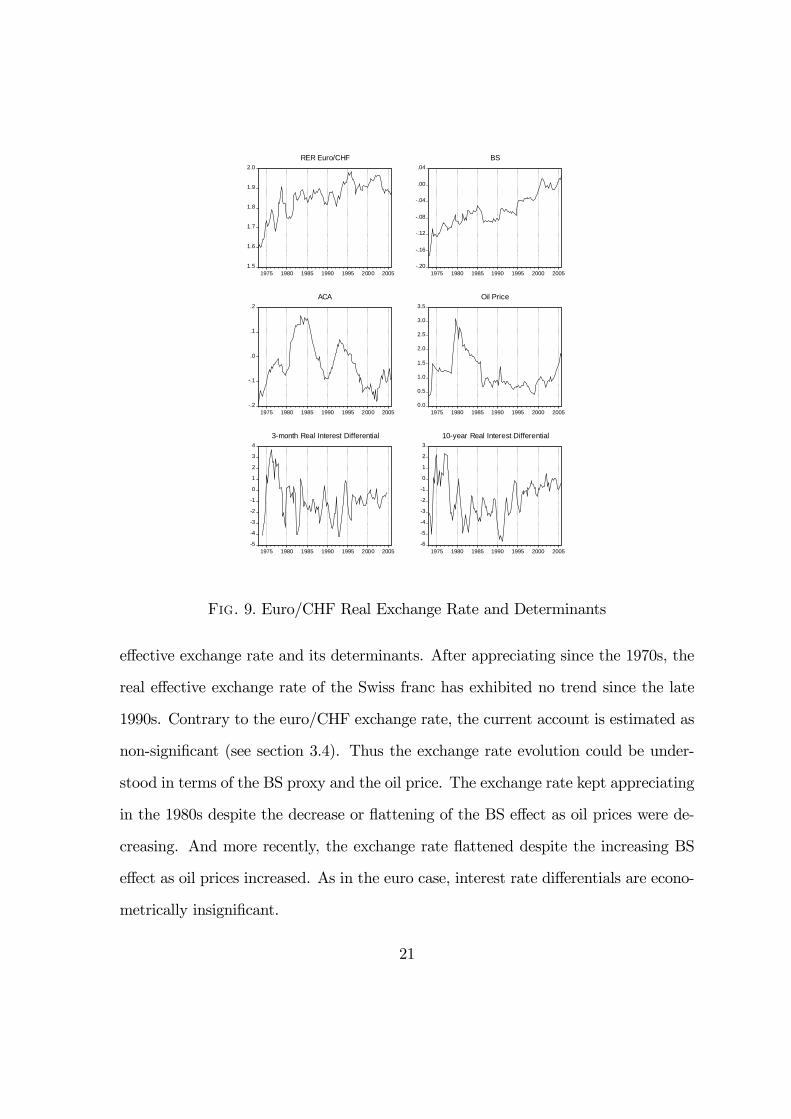
Figure 9 displays the evolution of the real euro/CHF exchange rate and its potential
determinants, i.e. Swiss relative to euro area corresponding variables. The Swiss franc
appreciated in the 1970s until the early 1980s, then had a relatively flat tendency until
the early 1990s. It further appreciated in the early 1990s before exhibiting a flat trend
again. This evolution reflects the evolution of the BS proxy and of current accounts.
Both the BS proxy and the current account (relative to euro area countries) increased
during the 1970s until the early 1980s, then decreased or were flat since the first half
of the 1980s, and increased again in the early 1990s; oil prices decreased a lot in the
1980s, which might have offset the relatively decreasing current account at that time,
given that oil prices affect negatively the Swiss franc as the estimations in section
3.4 show. Since the mid-1990s, the relative decrease in current account, and later
the increase in oil prices, have offset the increase in the BS effect for the evolution
of the real exchange rate, which has had a flat trend since. It is more difficult to
relate the Swiss franc evolution with interest rate differentials; this will be confirmed
by non-significant estimated coefficients in section 3.4.
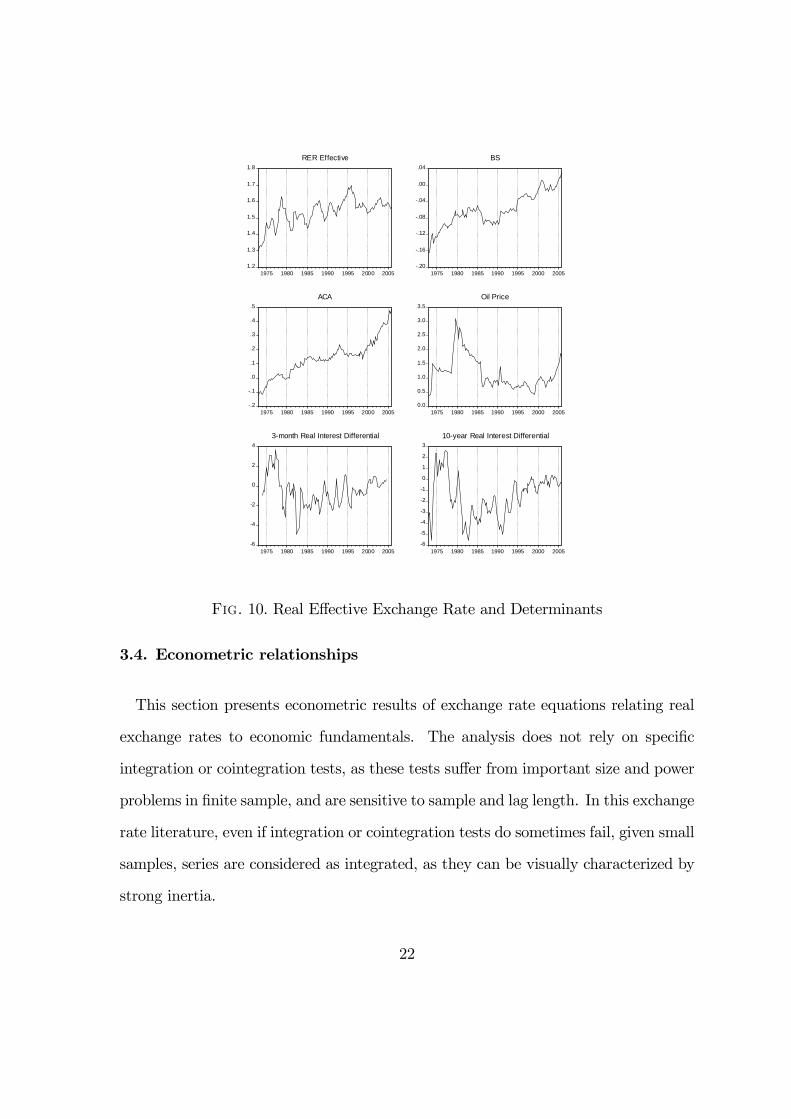
Figure 10 displays the same variables but relative all 24 trading partners, i.e. the
20
1.5
1.6
1.7
1.8
1.9
2.0
1975 1980 1985 1990 1995 2000 2005
RER Euro/CHF
-.20
-.16
-.12
-.08
-.04
.00
.04
1975 1980 1985 1990 1995 2000 2005
BS
-.2
-.1
.0
.1
.2
1975 1980 1985 1990 1995 2000 2005
ACA
0.0
0.5
1.0
1.5
2.0
2.5
3.0
3.5
1975 1980 1985 1990 1995 2000 2005
Oil Price
-5
-4
-3
-2
-1
0
1
2
3
4
1975 1980 1985 1990 1995 2000 2005
3-month Real Interest Differential
-6
-5
-4
-3
-2
-1
0
1
2
3
1975 1980 1985 1990 1995 2000 2005
10-year Real Interest Differential
Fig. 9. Euro/CHF Real Exchange Rate and Determinants
effective exchange rate and its determinants. After appreciating since the 1970s, the
real effective exchange rate of the Swiss franc has exhibited no trend since the late
1990s. Contrary to the euro/CHF exchange rate, the current account is estimated as
non-significant (see section 3.4). Thus the exchange rate evolution could be under-
stood in terms of the BS proxy and the oil price. The exchange rate kept appreciating
in the 1980s despite the decrease or flattening of the BS effect as oil prices were de-
creasing. And more recently, the exchange rate flattened despite the increasing BS
effect as oil prices increased. As in the euro case, interest rate differentials are econo-
metrically insignificant.
21
1.2
1.3
1.4
1.5
1.6
1.7
1.8
1975 1980 1985 1990 1995 2000 2005
RER Effective
-.20
-.16
-.12
-.08
-.04
.00
.04
1975 1980 1985 1990 1995 2000 2005
BS
-.2
-.1
.0
.1
.2
.3
.4
.5
1975 1980 1985 1990 1995 2000 2005
ACA
0.0
0.5
1.0
1.5
2.0
2.5
3.0
3.5
1975 1980 1985 1990 1995 2000 2005
Oil Price
-6
-4
-2
0
2
4
1975 1980 1985 1990 1995 2000 2005
3-month Real Interest Differential
-6
-5
-4
-3
-2
-1
0
1
2
3
1975 1980 1985 1990 1995 2000 2005
10-year Real Interest Differential
Fig. 10. Real Effective Exchange Rate and Determinants
3.4. Econometric relationships
This section presents econometric results of exchange rate equations relating real
exchange rates to economic fundamentals. The analysis does not rely on specific
integration or cointegration tests, as these tests suffer from important size and power
problems in finite sample, and are sensitive to sample and lag length. In this exchange
rate literature, even if integration or cointegration tests do sometimes fail, given small
samples, series are considered as integrated, as they can be visually characterized by
strong inertia.
22
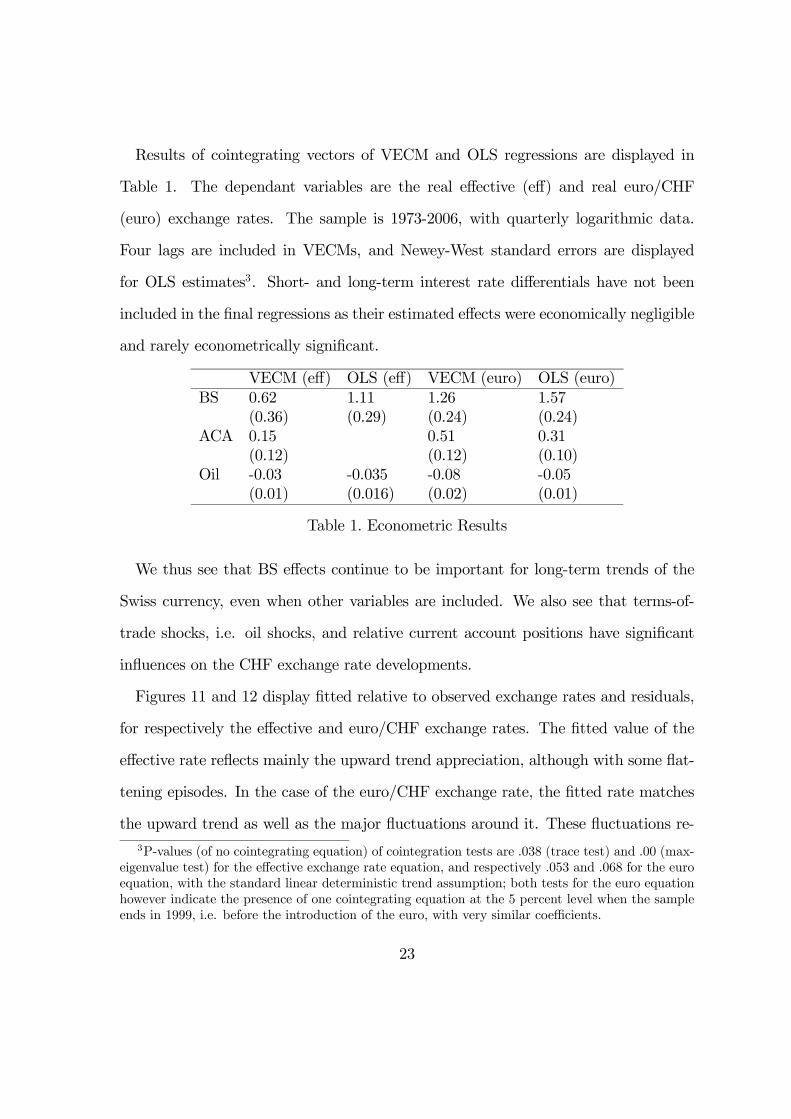
Results of cointegrating vectors of VECM and OLS regressions are displayed in
Table 1. The dependant variables are the real effective (eff) and real euro/CHF
(euro) exchange rates. The sample is 1973-2006, with quarterly logarithmic data.
Four lags are included in VECMs, and Newey-West standard errors are displayed
for OLS estimates3. Short- and long-term interest rate differentials have not been
included in the final regressions as their estimated effects were economically negligible
and rarely econometrically significant.
VECM (eff) OLS (eff) VECM (euro) OLS (euro)BS 0.62 1.11 1.26 1.57
(0.36) (0.29) (0.24) (0.24)ACA 0.15 0.51 0.31
(0.12) (0.12) (0.10)Oil -0.03 -0.035 -0.08 -0.05
(0.01) (0.016) (0.02) (0.01)
Table 1. Econometric Results
We thus see that BS effects continue to be important for long-term trends of the
Swiss currency, even when other variables are included. We also see that terms-of-
trade shocks, i.e. oil shocks, and relative current account positions have significant
influences on the CHF exchange rate developments.
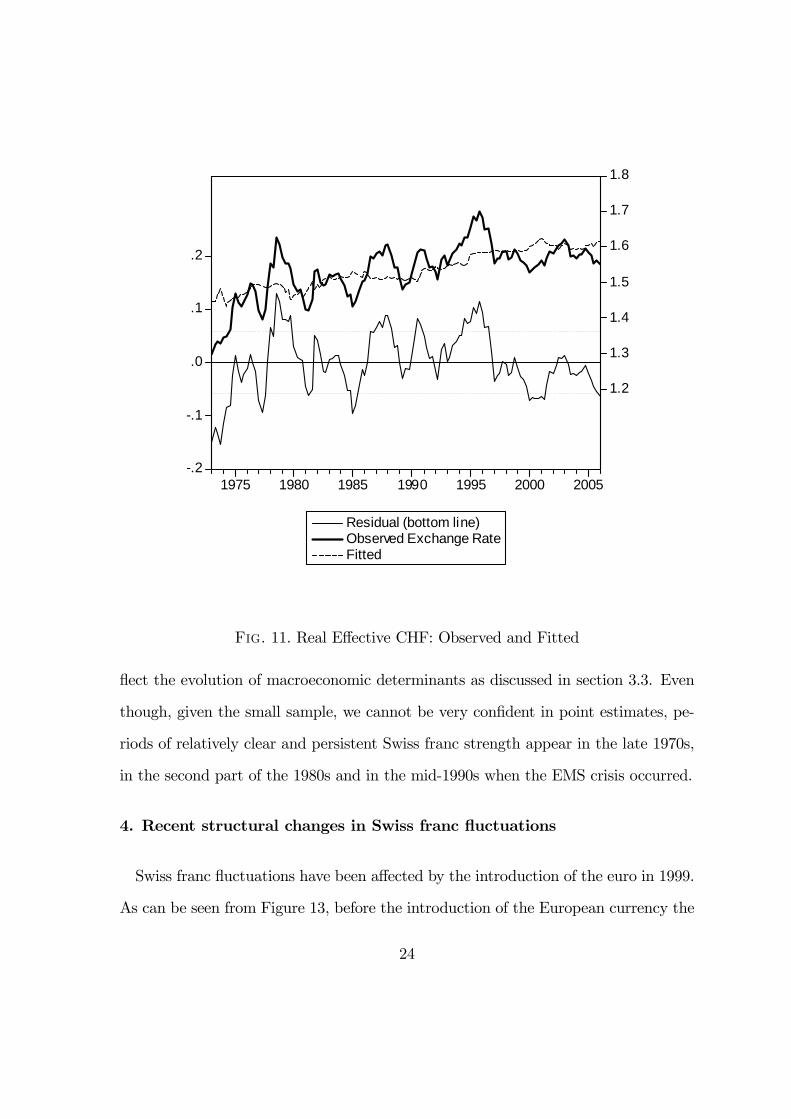
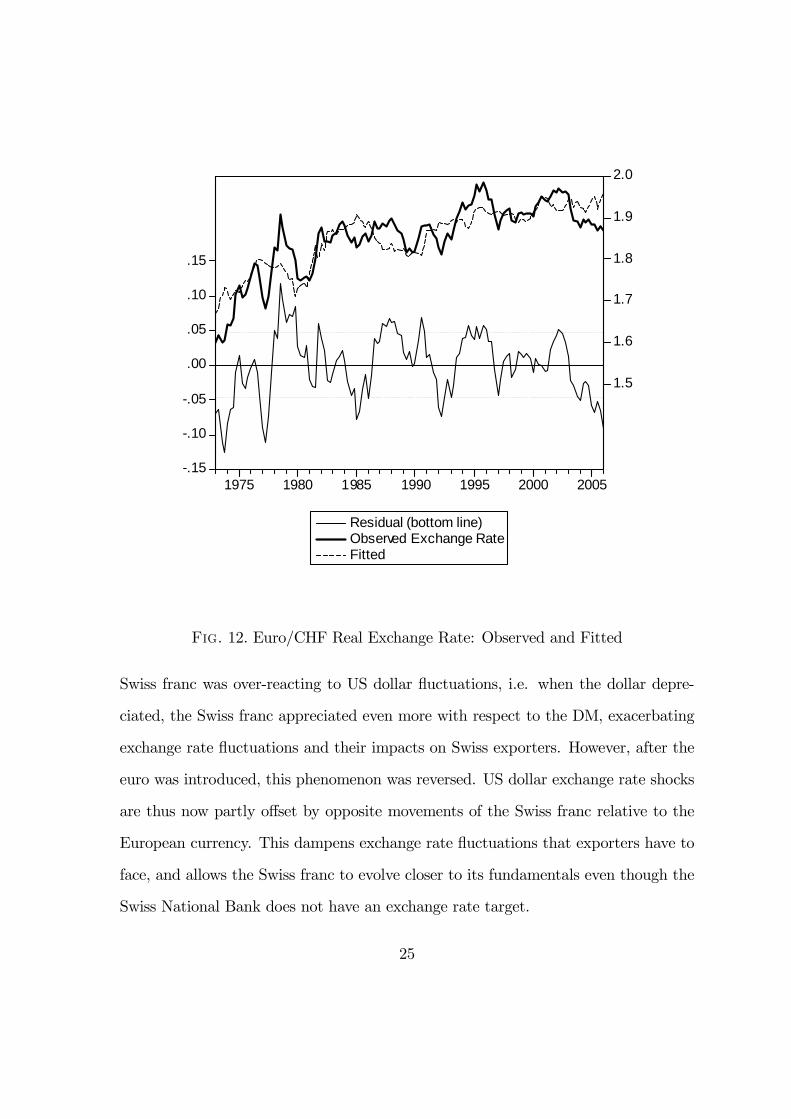
Figures 11 and 12 display fitted relative to observed exchange rates and residuals,
for respectively the effective and euro/CHF exchange rates. The fitted value of the
effective rate reflects mainly the upward trend appreciation, although with some flat-
tening episodes. In the case of the euro/CHF exchange rate, the fitted rate matches
the upward trend as well as the major fluctuations around it. These fluctuations re-3P-values (of no cointegrating equation) of cointegration tests are .038 (trace test) and .00 (max-
eigenvalue test) for the effective exchange rate equation, and respectively .053 and .068 for the euroequation, with the standard linear deterministic trend assumption; both tests for the euro equationhowever indicate the presence of one cointegrating equation at the 5 percent level when the sampleends in 1999, i.e. before the introduction of the euro, with very similar coefficients.
23
-.2
-.1
.0
.1
.2
1.2
1.3
1.4
1.5
1.6
1.7
1.8
1975 1980 1985 1990 1995 2000 2005
Residual (bottom line)Observed Exchange RateFitted
Fig. 11. Real Effective CHF: Observed and Fitted
flect the evolution of macroeconomic determinants as discussed in section 3.3. Even
though, given the small sample, we cannot be very confident in point estimates, pe-
riods of relatively clear and persistent Swiss franc strength appear in the late 1970s,
in the second part of the 1980s and in the mid-1990s when the EMS crisis occurred.
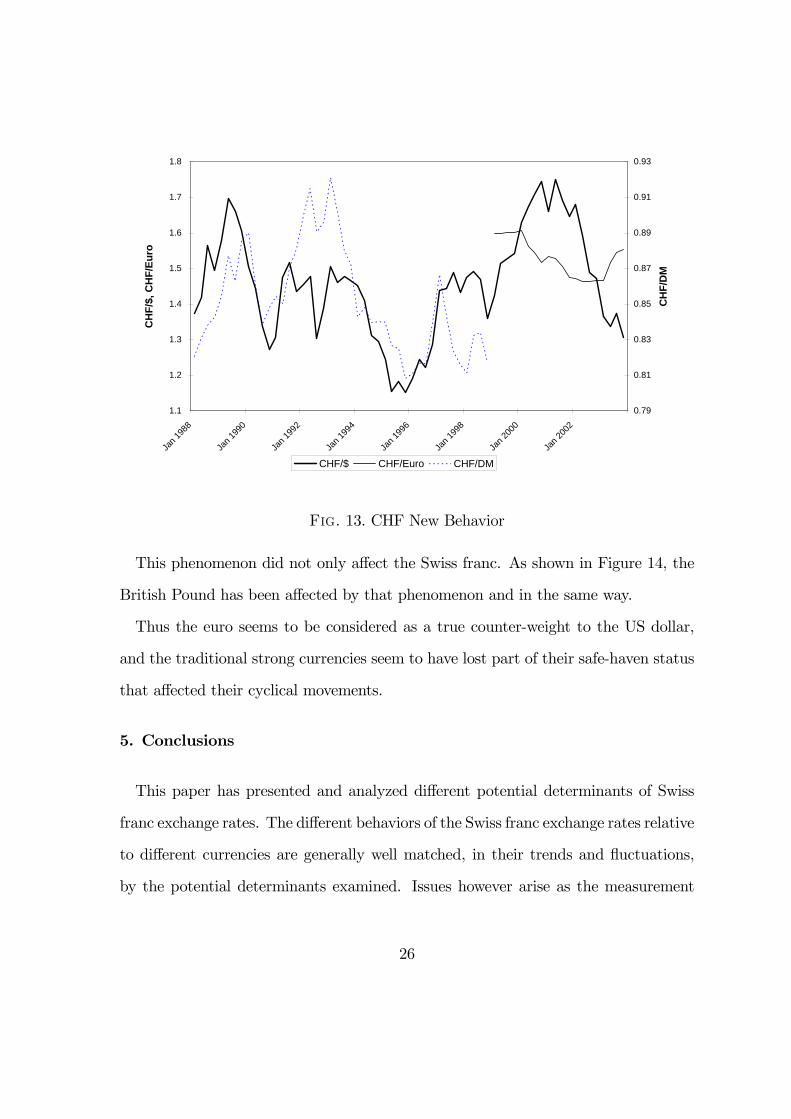
4. Recent structural changes in Swiss franc fluctuations
Swiss franc fluctuations have been affected by the introduction of the euro in 1999.
As can be seen from Figure 13, before the introduction of the European currency the
24
-.15
-.10
-.05
.00
.05
.10
.15
1.5
1.6
1.7
1.8
1.9
2.0
1975 1980 1985 1990 1995 2000 2005
Residual (bottom line)Observed Exchange RateFitted
Fig. 12. Euro/CHF Real Exchange Rate: Observed and Fitted
Swiss franc was over-reacting to US dollar fluctuations, i.e. when the dollar depre-
ciated, the Swiss franc appreciated even more with respect to the DM, exacerbating
exchange rate fluctuations and their impacts on Swiss exporters. However, after the
euro was introduced, this phenomenon was reversed. US dollar exchange rate shocks
are thus now partly offset by opposite movements of the Swiss franc relative to the
European currency. This dampens exchange rate fluctuations that exporters have to
face, and allows the Swiss franc to evolve closer to its fundamentals even though the
Swiss National Bank does not have an exchange rate target.
25
1.1
1.2
1.3
1.4
1.5
1.6
1.7
1.8
Jan 1
988
Jan 1
990
Jan 1
992
Jan 1
994
Jan 1
996
Jan 1
998
Jan 2
000
Jan 2
002
CH
F/$,
CH
F/Eu
ro
0.79
0.81
0.83
0.85
0.87
0.89
0.91
0.93
CH
F/D
M
CHF/$ CHF/Euro CHF/DM
Fig. 13. CHF New Behavior
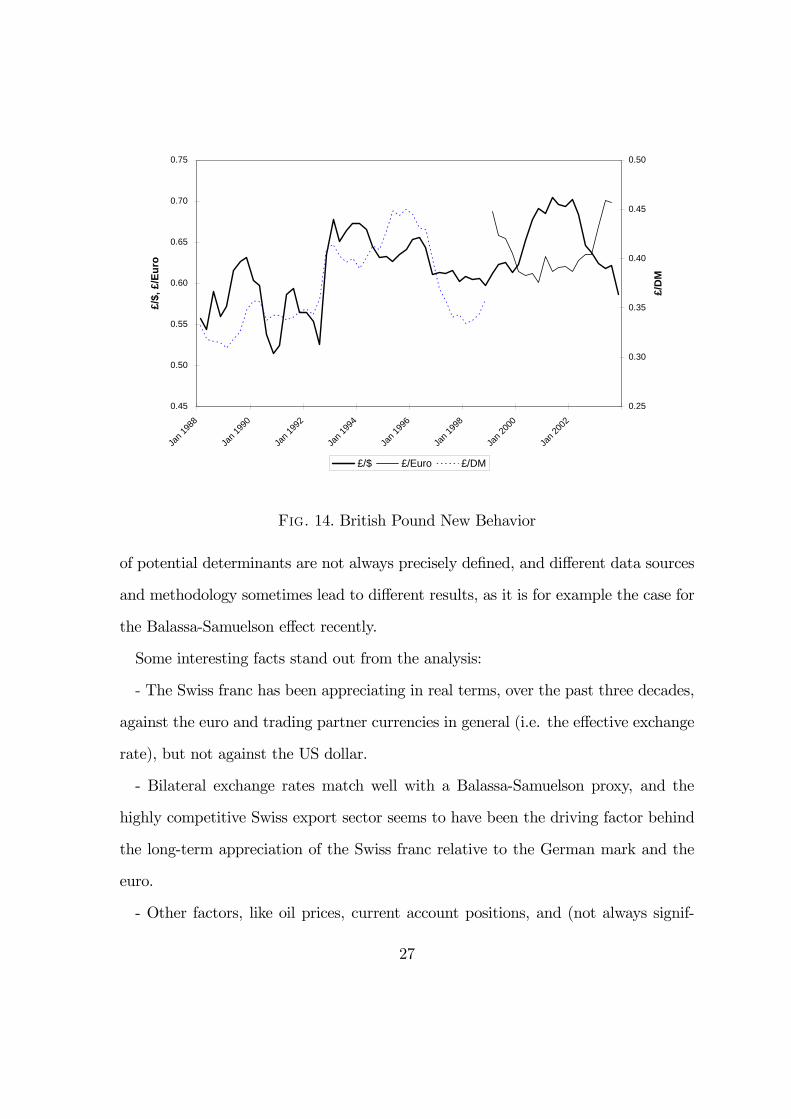
This phenomenon did not only affect the Swiss franc. As shown in Figure 14, the
British Pound has been affected by that phenomenon and in the same way.
Thus the euro seems to be considered as a true counter-weight to the US dollar,
and the traditional strong currencies seem to have lost part of their safe-haven status
that affected their cyclical movements.
5. Conclusions
This paper has presented and analyzed different potential determinants of Swiss
franc exchange rates. The different behaviors of the Swiss franc exchange rates relative
to different currencies are generally well matched, in their trends and fluctuations,
by the potential determinants examined. Issues however arise as the measurement
26
0.45
0.50
0.55
0.60
0.65
0.70
0.75
Jan 1
988
Jan 1
990
Jan 1
992
Jan 1
994
Jan 1
996
Jan 1
998
Jan 2
000
Jan 2
002
£/$,
£/E
uro
0.25
0.30
0.35
0.40
0.45
0.50
£/D
M
£/$ £/Euro £/DM
Fig. 14. British Pound New Behavior
of potential determinants are not always precisely defined, and different data sources
and methodology sometimes lead to different results, as it is for example the case for
the Balassa-Samuelson effect recently.
Some interesting facts stand out from the analysis:
- The Swiss franc has been appreciating in real terms, over the past three decades,
against the euro and trading partner currencies in general (i.e. the effective exchange
rate), but not against the US dollar.
- Bilateral exchange rates match well with a Balassa-Samuelson proxy, and the
highly competitive Swiss export sector seems to have been the driving factor behind
the long-term appreciation of the Swiss franc relative to the German mark and the
euro.
- Other factors, like oil prices, current account positions, and (not always signif-
27
icant) interest rate differentials also affect the Swiss franc evolution; the rise in oil
prices could partially explain the recent weakness of the Swiss franc.
- There have frequently been substantial and persistent exchange rate movements
not explained by fundamentals, especially with respect to the US dollar.
- Over the 1990s, the apparent strong Swiss franc seems to have been due to weak
(undervalued) European currencies rather than an overvaluation of the Swiss franc
itself.
- Since the beginning of this decade, Swiss domestic (internal) sector productivity
has increased faster than its European counterpart; this has offset the faster relative
productivity of the Swiss export sector and thus attenuated (flattened) the Balassa-
Samuelson effect; in other words, this would be a reason for the upward trend in the
CHF/euro real exchange rate to flatten and thus partly for the recent weakness of the
Swiss franc. However, on the contrary, indirect evidence on the Balassa-Samuelson ef-
fect do not point towards a change in that appreciating trend. The empirical evidence
is thus mixed.
- The short- and medium-term behavior of the Swiss franc has recently been affected
by the introduction of the euro, which has had a stabilizing effect on Swiss franc
fluctuations as the CHF/euro and CHF/dollar exchange rates have moved in opposite
directions; the recent weakness of the Swiss franc with respect to the euro could thus
have been partly caused by a weak dollar.
Even though such an empirical analysis can lead to interesting observations, the
literature on exchange rates is still far from being able to provide robust answers on
what drives a given exchange rate at a particular point in time. This is not only due to
data limitations, but also to a lack of theory encompassing the different explanations
28

suggested thus far in the literature.
29
References
Aebersold, C., Brunetti, A., 1998. Die langfristige reale Aufwertung des Schweizer
Frankens gegenuber der D-Mark: Nichthandelbare Guter und der Balassa-Samuelson-
Effekt. Aussenwirtschaft 53, 365-86.
Balassa, B., 1964. The purchasing power parity doctrine: a reappraisal. Journal of
Political Economy 72, 584-96.
Driver, R. L., Westaway, P. F., 2004. Concepts of equilibrium exchange rates. Bank
of England Working Paper no. 248.
Égert, B., Halpern, L., MacDonald, R., 2006. Equilibrium exchange rates in tran-
sition economies: taking stock of the issues. Journal of Economic Survey 20, 257-324.
Genberg, H., Kadareja, A., 2001. The Swiss franc and the euro. In R. Baldwin and
A. Brunetti (eds.) Economic Impact of EU Membership on Entrants, New Methods
and Issues. Kluwer Academic Publishers.
Maeso-Fernandez, F., Osbat, C., Schnatz, B., 2001. Determinants of the euro real
effective exchange rate: a BEER/PEER approach. European Central Bank Working
Paper 85.
Samuelson, P., 1964. Theoretical problems on trade problems. Review of Eco-
nomics and Statistics 46, 145-54.
30
Appendix: Data sources and computations of variables
A. Data used in computing exchange rates and their determinants:
The data set includes the following countries: Switzerland (CH), United States
(US), United Kingdom (UK), Japan (JP), Canada (CA), Australia (AU), Denmark
(DK), Sweden (SE), Norway (NO), Korea (KO), Hong Kong (HK), Singapore (SG),
Austria (AT), Belgium (BE), France (FR), Germany (DE), Italy (IT), Luxembourg
(LU), Netherlands (NL), Finland (FI), Greece (GR), Ireland (IE), Portugal (PT) and
Spain (ES).
Using trade weights obtained from the ECB, the series are generally aggregated
by geometric averaging. The weights, which were calculated for the reference period
1999-2001, include third market effects. See ECB 2000 for a description.
The data set is quarterly and covers the period 1970:1 to 2006:4. Some series
were converted from annual into quarterly values by a spline method. Due to lags
in the publication, the data set exhibits increasingly missing values near the end.
Similarly, some series start later than 1970:1 such that missing values also occur at
the beginning of the sample. Missing values are omitted by rebasing the weights
skipping the corresponding country.
In order to calculate the variables RER, TNT, OIL, TBD, RID and SRID, the
following time series are used:
Nominal exchange rates: International Financial Statistics [IFS], line rf, nominal
exchange rate per US dollar. For EMU countries, exchange rates before the introduc-
tion of the Euro were converted into Euro rates by multiplying with fixed exchange
rates (e.g. DEM/EUR is 1.95583).
Consumer Price Index: IFS, line 64. Harmonised CPI (line 64h) for EMU countries
31
from 1999:1 onwards. For HK, from 1974:3 to 1980:3 the average of the HK Census
and Statistics Department’s CPI(A), CPI(B) and CPI(C) represents CPI.
Wholesale Price Index: IFS, line 63. PT uses OECD Main Economic Indicator
[MEI] data line PPIAMP01.IXOB from 1990 onwards; no data before. No data
before 1993 for HK. For NO, BE, FR, IT and LU, early data are taken from the
paper version of IFS.
Oil price: IFS, line 00176AADZF, spot price in US dollar.
Long-term interest rates: IFS, line 61. No data for HK and SG. No data for ES
before 1978:4. No data for PT before 1976:1. For SE, OECD MEI line IRLTGV02
from 1987:1 on. Finland uses line 61 since 1993, BIS HGAAFI22 from 1988:1 to
1993:1 and BIS HPHAFI93 before.
Short-term interest rates: IFS, line 60b. For CH and CA, OECDMEI line irt3. For
UK, IFS line 60c. For HK, short-term interest rates from the HKMonetary Authority
from 1980:1 to 1993:1. For KO and FI, IFS line 60 from 1974:1 to 1976:4 and 1970:1
to 1977:4, respectively. For GR, IFS line 60l up to 1985:2 and line 60c onwards. For
IE, missing values replaced by 60c. For PT, line 60 before 1981:01.
Nominal GDP: IFS, line 99b. For US, JP, CA and AU, values divided by four
to convert into quarter-on-quarter values. For some countries, data converted into
quarterly values using a spline method. Some series were seasonally adjusted using
TRAMO-SEATS.
Net Foreign Asset: IFS, line 78aldzf. For some countries, missing values back to
1973 were replaced using the paper version of IFS or the Milesi-Ferretti database4.
For US, UK, CA, AU, SE, SG, AT, DE, IT and NL, values represent the cumulated
4See Lane, P.R., Milesi-Ferretti, G.M., 2001. The external wealth of nations: Measures of foreignassets and liabilities for industrial and developing countries. Journal of International Economics.
32
sum of current account data (78aldzf). Starting point is the value of Milesi-Ferretti
for the year 1972. For JP, KO, HK, BE, FR, LU, FI, IE, PT and ES, the values
represent linearly interpolated values of Milesi-Ferretti up to the point when IFS
data is available. No values for DK, NO and GR.
Real GDP: IFS, line 99bv. For most countries, values were seasonally adjusted and
converted to quarterly values. No values for SG and GR.
Purchasing Power Parity: IMF World Economic Outlook database, Implied PPP
conversion rate denoted in USD from 1980 to 20065.
Variables have been computed as follows:
RER: The real exchange rate of a country is the ratio of the nominal exchange rate
divided by the consumer price index. RER is then the ratio of the Swiss ratio over
the weighted ratio of its partner countries.
TNT: The ratio of consumer and producer prices in Switzerland relative to the
ratio of its trading partners.
OIL: Oil price divided by the US producer price index.
TBD: Difference in the trade balances of Switzerland and partner countries denom-
inated in percentages of nominal GDP. Geometric mean is not used for the aggrega-
tion of the partner countries’ values. Instead, imports and exports are summed across
partner countries divided by the corresponding sum of GDPs.
GDP: Ratio of GDP in per-capita terms at PPP levels in Switzerland over the same
variable from the other countries. For this purpose, real GDP values were multiplied
by the PPP conversion factors.
RID: Subtraction of consumer price inflation from current long-term interest rates.
RID is the difference between Swiss real interests and the real interest rates of its5See http://www.imf.org/external/pubs/ft/weo/2007/01/data/index.aspx
33
partners. Consumer price inflation is the year-on-year percentage change in the price
level.
SRID: The same ratio as RID but using short-term interest rates instead.
B. Data used in computing direct evidence on the BS effect:
In order to calculate sectorial labour productivities, data about sectorial employ-
ment and sectorial Gross Value Added [GVA] are needed. For Germany and Switzer-
land, quarterly data is only available for 7 and 11 sectors, respectively. On an annual
base, such data is available for 85 sectors in Germany and 88 sectors in the US. Swiss
data is not available on an annual base and, hence, it was aggregated. Swiss data
stems from the Swiss Federal Office of Statistics [BfS]6, German data is from the
Genesis database of the Federal Statistical Office7 and US data is from the Bureau of
Economic Analysis8.
In addition, such data is available for 33 sectors for Belgium, Czech Republic,
Germany, Denmark, Euro Area, Euro Area 11, Euro Area 12, Euro Area 13, EU15,
EU25, Finland, Italy, Luxembourg, Hungary, Netherlands, Norway, Sweden, Slovenia
and the United Kingdom from Eurostat9.
Quarterly data is available from 1992:1 to 2006:2. Annual US data is used from
1991 to 2005. Annual German data spans the period 1991 to 2005. Depending on
the country, Eurostat data begins between 1988 and 1995 and ends between 2003 and
2005.
According to a self-defined binary indicator, these sectors are separated into an
export-oriented sector and an interior sector. For each country, the relative labour
6See www.bfs.admin.ch7See https://www-genesis.destatis.de/genesis/online/logon8See http://www.bea.gov/industry/index.htm#annual9See the database of Eurostat at http://epp.eurostat.ec.europa.eu/. Annual, detailed breakdowns
of national accounts can be found in the tree Economy and Finance.
34
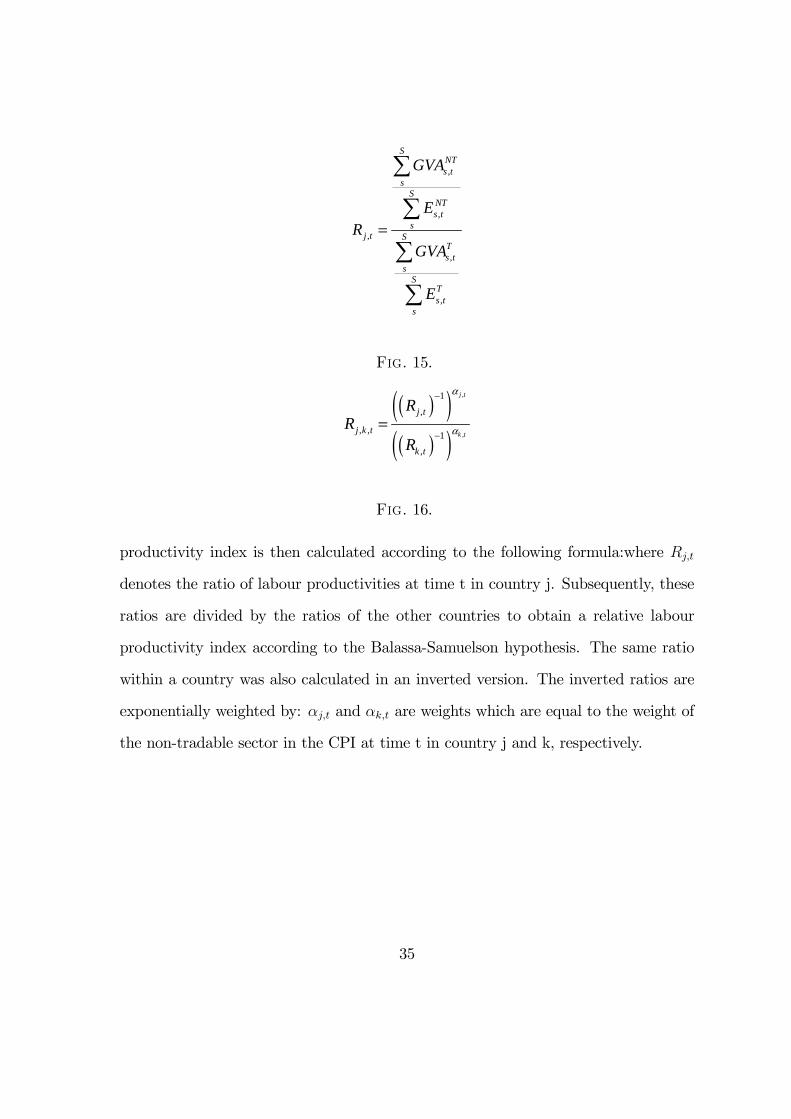
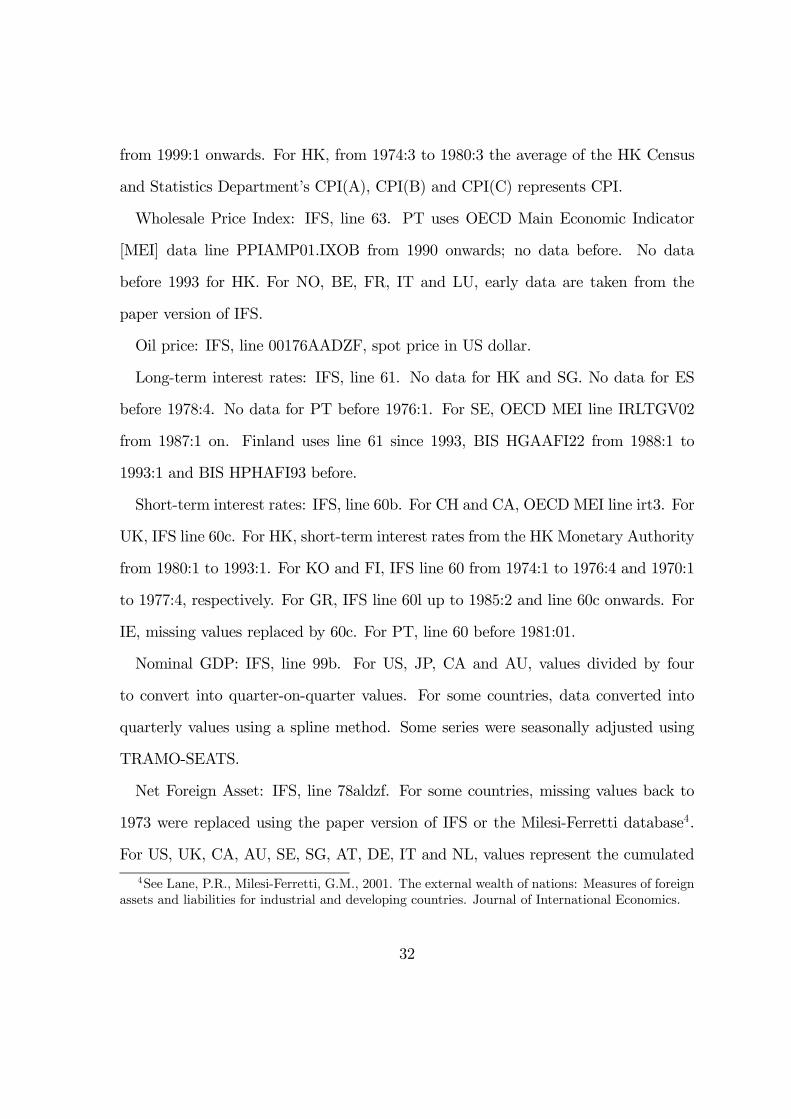
,
,
,
,
,
SNTs t
sS
NTs t
sj t S
Ts t
sS
Ts t
s
GVA
ER
GVA
E
=
∑
∑
∑
∑
Fig. 15.
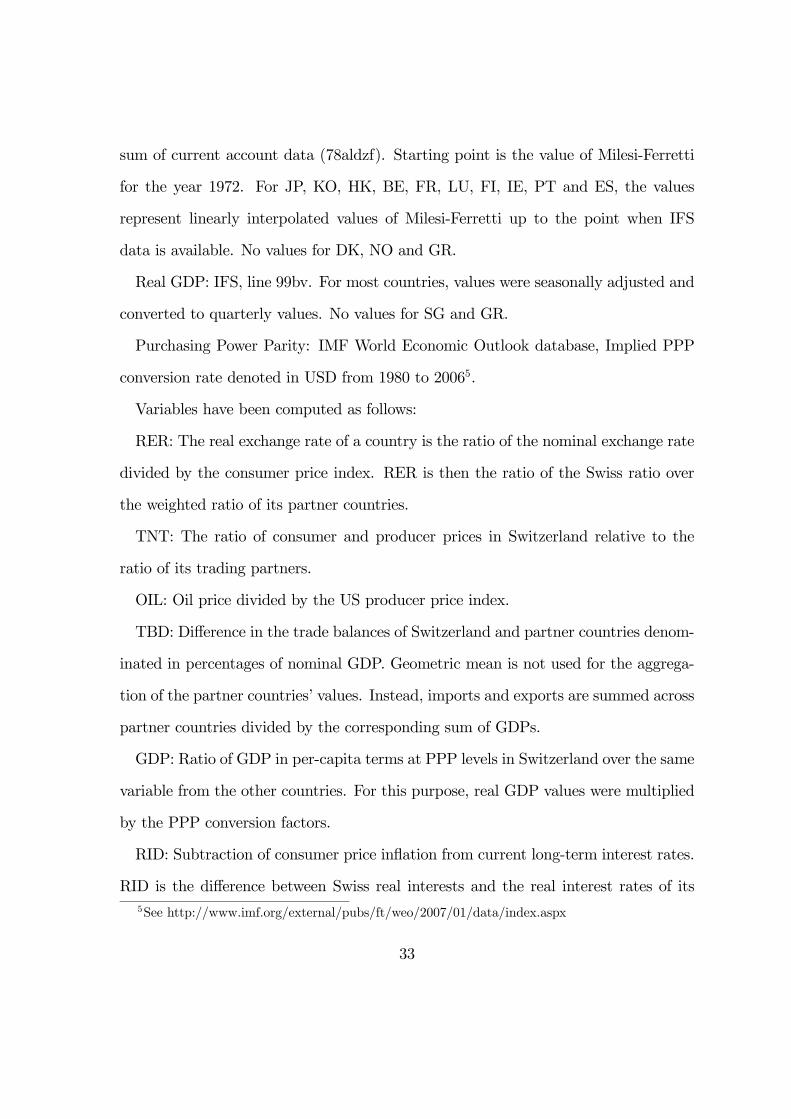
( )( )( )( )
,
,
1
,
, , 1,
j t
k t
j t
j k t
k t
RR
R
α
α
−
−=
Fig. 16.
productivity index is then calculated according to the following formula:where Rj,t
denotes the ratio of labour productivities at time t in country j. Subsequently, these
ratios are divided by the ratios of the other countries to obtain a relative labour
productivity index according to the Balassa-Samuelson hypothesis. The same ratio
within a country was also calculated in an inverted version. The inverted ratios are
exponentially weighted by: αj,t and αk,t are weights which are equal to the weight of
the non-tradable sector in the CPI at time t in country j and k, respectively.
35
Swiss National Bank Working Papers published since 2004: 2004-1 Samuel Reynard: Financial Market Participation and the Apparent Instability of
Money Demand 2004-2 Urs W. Birchler and Diana Hancock: What Does the Yield on Subordinated Bank Debt Measure? 2005-1 Hasan Bakhshi, Hashmat Khan and Barbara Rudolf: The Phillips curve under state-dependent pricing 2005-2 Andreas M. Fischer: On the Inadequacy of Newswire Reports for Empirical Research on Foreign Exchange Interventions 2006-1 Andreas M. Fischer: Measuring Income Elasticity for Swiss Money Demand: What do the Cantons say about Financial Innovation? 2006-2 Charlotte Christiansen and Angelo Ranaldo: Realized Bond-Stock Correlation:
Macroeconomic Announcement Effects 2006-3 Martin Brown and Christian Zehnder: Credit Reporting, Relationship Banking, and Loan Repayment 2006-4 Hansjörg Lehmann and Michael Manz: The Exposure of Swiss Banks to
Macroeconomic Shocks – an Empirical Investigation 2006-5 Katrin Assenmacher-Wesche and Stefan Gerlach: Money Growth, Output Gaps and
Inflation at Low and High Frequency: Spectral Estimates for Switzerland 2006-6 Marlene Amstad and Andreas M. Fischer: Time-Varying Pass-Through from Import
Prices to Consumer Prices: Evidence from an Event Study with Real-Time Data 2006-7 Samuel Reynard: Money and the Great Disinflation 2006-8 Urs W. Birchler and Matteo Facchinetti: Can bank supervisors rely on market data?
A critical assessment from a Swiss perspective 2006-9 Petra Gerlach-Kristen: A Two-Pillar Phillips Curve for Switzerland 2006-10 Kevin J. Fox and Mathias Zurlinden: On Understanding Sources of Growth and
Output Gaps for Switzerland 2006-11 Angelo Ranaldo: Intraday Market Dynamics Around Public Information Arrivals 2007-1 Andreas M. Fischer, Gulzina Isakova and Ulan Termechikov: Do FX traders in
Bishkek have similar perceptions to their London colleagues? Survey evidence of market practitioners’ views
2007-2 Ibrahim Chowdhury and Andreas Schabert: Federal Reserve Policy viewed through a Money Supply Lens
2007-3 Angelo Ranaldo: Segmentation and Time-of-Day Patterns in Foreign Exchange
Markets 2007-4 Jürg M. Blum: Why ‘Basel II’ May Need a Leverage Ratio Restriction 2007-5 Samuel Reynard: Maintaining Low Inflation: Money, Interest Rates, and Policy
Stance 2007-6 Rina Rosenblatt-Wisch: Loss Aversion in Aggregate Macroeconomic Time Series 2007-7 Martin Brown, Maria Rueda Maurer, Tamara Pak and Nurlanbek Tynaev: Banking
Sector Reform and Interest Rates in Transition Economies: Bank-Level Evidence from Kyrgyzstan
2007-8 Hans-Jürg Büttler: An Orthogonal Polynomial Approach to Estimate the Term
Structure of Interest Rates 2007-9 Raphael Auer: The Colonial Origins Of Comparative Development: Comment.
A Solution to the Settler Mortality Debate
2007-10 Franziska Bignasca and Enzo Rossi: Applying the Hirose-Kamada filter to Swiss data: Output gap and exchange rate pass-through estimates
2007-11 Angelo Ranaldo and Enzo Rossi: The reaction of asset markets to Swiss National
Bank communication 2007-12 Lukas Burkhard and Andreas M. Fischer: Communicating Policy Options at the Zero
Bound 2007-13 Katrin Assenmacher-Wesche, Stefan Gerlach, and Toshitaka Sekine: Monetary
Factors and Inflation in Japan 2007-14 Jean-Marc Natal and Nicolas Stoffels: Globalization, markups and the natural rate
of interest 2007-15 Martin Brown, Tullio Jappelli and Marco Pagano: Information Sharing and Credit:
Firm-Level Evidence from Transition Countries 2007-16 Andreas M. Fischer, Matthias Lutz and Manuel Wälti: Who Prices Locally? Survey
Evidence of Swiss Exporters 2007-17 Angelo Ranaldo and Paul Söderlind: Safe Haven Currencies
2008-1 Martin Brown and Christian Zehnder: The Emergence of Information Sharing in Credit Markets
2008-2 Yvan Lengwiler and Carlos Lenz: Intelligible Factors for the Yield Curve 2008-3 Katrin Assenmacher-Wesche and M. Hashem Pesaran: Forecasting the Swiss
Economy Using VECX* Models: An Exercise in Forecast Combination Across Models and Observation Windows
2008-4 Maria Clara Rueda Maurer: Foreign bank entry, institutional development and
credit access: firm-level evidence from 22 transition countries 2008-5 Marlene Amstad and Andreas M. Fischer: Are Weekly Inflation Forecasts
Informative? 2008-6 Raphael Auer and Thomas Chaney: Cost Pass Through in a Competitive Model of
Pricing-to-Market 2008-7 Martin Brown, Armin Falk and Ernst Fehr: Competition and Relational Contracts:
The Role of Unemployment as a Disciplinary Device 2008-8 Raphael Auer: The Colonial and Geographic Origins of Comparative Development 2008-9 Andreas M. Fischer and Angelo Ranaldo: Does FOMC News Increase Global FX
Trading? 2008-10 Charlotte Christiansen and Angelo Ranaldo: Extreme Coexceedances in New EU
Member States’ Stock Markets
2008-11 Barbara Rudolf and Mathias Zurlinden: Measuring capital stocks and capital services in Switzerland
2008-12 Philip Sauré: How to Use Industrial Policy to Sustain Trade Agreements 2008-13 Thomas Bolli and Mathias Zurlinden: Measuring growth of labour quality and the
quality-adjusted unemployment rate in Switzerland 2008-14 Samuel Reynard: What Drives the Swiss Franc?

Swiss National Bank Working Papers are also available at www.snb.ch, section Publications/ResearchSubscriptions or individual issues can be ordered at Swiss National Bank, Fraumünsterstrasse 8, CH-8022 Zurich,fax +41 44 631 81 14, E-mail [email protected]