Embed Size (px)
Citation preview

Discussion Papers
Why Did Self-Employment Increase So Strongly in Germany?
Michael Fritsch, Alexander Kritikos and Alina Sorgner
1447
Deutsches Institut für Wirtschaftsforschung 2015

Opinions expressed in this paper are those of the author(s) and do not necessarily reflect views of the institute. IMPRESSUM © DIW Berlin, 2015 DIW Berlin German Institute for Economic Research Mohrenstr. 58 10117 Berlin Tel. +49 (30) 897 89-0 Fax +49 (30) 897 89-200 http://www.diw.de ISSN electronic edition 1619-4535 Papers can be downloaded free of charge from the DIW Berlin website: http://www.diw.de/discussionpapers Discussion Papers of DIW Berlin are indexed in RePEc and SSRN: http://ideas.repec.org/s/diw/diwwpp.html http://www.ssrn.com/link/DIW-Berlin-German-Inst-Econ-Res.html

Why did self-employment increase so strongly in Germany?1
Michael Fritsch2 Alexander Kritikos3 Alina Sorgner4
This version: January 2015
Abstract
Germany experienced a unique rise in the level of self-employment in the first two decades following unification. Applying the non-linear Blinder-Oaxaca decomposition technique, we find that the main factors driving these changes in the overall level of self-employment are demographic developments, the shift towards service sector employment, and a larger share of population holding a tertiary degree. While these factors explain most of the development in self-employment with employees and the overall level of self-employment in West Germany, their explanatory power is much lower for the stronger increase of solo self-employment and of self-employment in former socialist East Germany.
Keywords: Self-employment, non-linear Blinder-Oaxaca decomposition technique, entrepreneurship, Germany
JEL classification: L26, D22
1 We are indebted to Adam Lederer, Simon Parker, Alexander Schiersch, and Michael Wyrwich for helpful comments on earlier versions of this paper. We are also grateful to the Research Data Centre of the Regional Statistical Office of Berlin and of Thuringia in Erfurt for on-site data access and for their support and cooperation. 2 Michael Fritsch is Professor of Economics and Chair of Business Dynamics, Innovation, and Economic Change at the Friedrich Schiller University Jena and Research Professor at the German Institute for Economic Research (DIW Berlin); e-mail: [email protected]. 3 Alexander Kritikos (Corresponding Author) is Research Director at the German Institute for Economic Research (DIW Berlin), Professor of Economics at the University of Potsdam, and Research Fellow of the IZA, Bonn and of the IAB, Nuremberg, e-mail: [email protected]. 4 Alina Sorgner is Research Associate at the Chair of Business Dynamics, Innovation, and Economic Change at the Friedrich Schiller University Jena, e-mail: [email protected].

1
1. Introduction
Between 1991 and 2009, the number of self-employed people in Germany
increased by 40 percent from 3 to 4.2 Million (Fritsch, Kritikos and Rusakova
2012). Accordingly, the self-employment rate rose from 8 to 11 percent while
remaining stagnant or even declining in many other established, innovation-
driven, economies.5 This is remarkable given that Germany is often described
as of having “a rather low level of entrepreneurial activity” (Bosma, Wennekers
and Amorós 2012, 124). Although the development coincides with the
pronounced expansion of self-employment in the former socialist eastern part of
the country after reunification (see Fritsch, et al. 2014), the development in East
Germany can explain a small portion of the total increase. Revealing the causes
for the rising self-employment is of major interest for researchers and policy
makers, as entrepreneurship has long been identified as a crucial driver of
growth (Audretsch, Keilbach and Lehmann 2007; Fritsch 2013) and not much is
known about the relative importance of the different determinants of
entrepreneurship with few empirical studies investigating changes in the level of
entrepreneurship.6
This paper identifies the most important determinants of the unusual
increase in German self-employment that occurred over the first two decades
following unification. Our empirical strategy consists of two steps, identifying,
firstly, key characteristics of self-employed people that determine their
probabilities of running an own business. Based on these results, we apply, in
the second step, a non-linear version of the Blinder-Oaxaca decomposition
5 According to OECD (2010), the share of self-employed persons in the economically active population decreased between 1991 and 2009 in countries such as the USA (from nine to seven percent), France (from 13 to 9 percent), the United Kingdom (from 15 to 13 percent), Australia (from 15 to 12 percent), Norway (from 11 to 8 percent), and Japan (from 22 to 13 percent). In Canada, the share of self-employed stagnated around nine percent. The self-employment rate rose to a lower degree in the Netherlands (from 11.6 to 13.2 percent) and in Sweden (from 9.2 to 10.4 percent). 6 Some studies such as Anderson and Koster (2011), Fotopoulos (2013), Fritsch and Mueller (2007), and Fritsch and Wyrwich (2014) investigate the development of regional start-up rates in established market economies such as Sweden, West Germany, and the UK at an aggregate level. Some work investigates the emerging self-employment in former socialist countries of Central and Eastern Europe; see, e.g., Alesina and Fuchs-Schuendeln (2007), Fritsch et al. (2014), Johnson and Loveman (1995), Smallbone and Welter (2001, 2009) and McMillan and Woodruff (2002). For an analysis of self-employment in West Germany over the 1984-1998 period, on the basis of micro-data from the German Socio-Economic Panel, see Lohmann and Luber (2004).

2
technique (Oaxaca and Ransom 1994; Fairlie 2005). This method allows us to
assess the extent of change in the level of self-employment that is due to
changes in the observable characteristics of the economy. As data source we
use the publicly accessible German Micro-Census (waves 1991-2009), the
largest representative household survey in Germany, which comprises of one
percent of the German population and contains information at the personal
level, including socio-demographic characteristics, labor market participation,
and human capital, among others. Two idiosyncrasies of the development of
self-employment in Germany after unification are taken into account in order to
ensure that the results are not biased in this respect. Firstly, German unification
in 1990 triggered the opening of the East German economy to markets that had
been suppressed by its socialist regime for 40 years. This resulted in a sharp
increase in self-employment in the new, formerly East German, federal states.
Hence, we perform separate analyses for the eastern and western parts of the
country. Secondly, in Germany there was a particularly pronounced increase in
solo-entrepreneurs – those without dependent employees (see e.g. Bögenhold
and Fachinger 2007)7. Since the rise of solo self-employment may have had its
particular reasons, the drivers of solo self-employment and of self-employment
with dependent employees (“employers”) are analyzed separately.
We begin our investigation with a brief review of different factors that may
explain the changes in the level of self-employment in the German context
(Section 2). We then describe the data set we use and the development of self-
employment in Germany between 1991 and 2009 (Section 3). Section 4
identifies the determinants of self-employment at the individual level during the
first and last year of the period under study. Section 5 introduces the non-linear
Blinder-Oaxaca decomposition technique to analyze the contribution of the
different factors that shape self-employment in Germany. Section 6 discusses
the results.
7 Comparing the development of self-employment over the 1992-2008 period in 26 OECD countries, van Stel, Scholman and Wennekers (2012) find that Germany experienced the greatest increase of solo self-employment among the countries in the sample.

3
2. Theoretical background and previous empirical evidence
Literature suggests three types of explanations for changing levels of self-
employment that we will discuss in the context of Germany.8 These three types
of explanations comprise, first, variations in the socio-demographic
characteristics of the population, such as age structure, different rates of
participation of males and females in the labor market, and level of education -
and Germany faced substantial changes in all three areas. Second, changes in
the economic environment that may also trace back to specific German
entrepreneurship-relevant policies, may influence the costs and benefits of
running a business, and, hence, influence the level of self-employment in the
society. Third, changing attitudes of people toward entrepreneurship may
modify their own willingness of being self-employed.
Previous research for developed countries, including Germany, provides
compelling evidence that a person’s propensity to start and run an own
business is strongly influenced by a number of socio-demographic
characteristics (see e.g. Parker 2009). According to the available empirical
evidence, the propensity of being self-employed is higher for middle aged
persons (Bergmann and Sternberg 2007; Caliendo, Fossen, Kritikos 2014a)
with a relatively high level of formal education (Block et al. 2011, Hundt and
Sternberg, 2014),9 as well as for persons who are male (Welter 2006; Koellinger
et al. 2013)10, are married and have a foreign nationality (Fritsch, Kritikos and
Rusakova 2012). Hence, changes of these socio-demographic characteristics,
such as aging of the population, an increasing education level, or a change in
the labor market participation rate can be expected to affect the level of self-
employment in a society.
One main factor in the economic environment that may affect the level of
self-employment is the minimum efficient size of production, which constitutes
8 Focusing on changes in the level of self-employment activities, we do not analyze entries into self-employment. Entry is a rather different concept. 9 The importance of being well educated as a crucial factor for entrepreneurship has been intensively discussed. See inter alia Dunn and Holtz-Eakin (2000), Delmar and Davidsson (2000), Davidsson and Honig (2003), Bosma, et al. (2004), van der Sluis, et al. (2008). 10 See also Georgellis and Wall (2005), Rosti and Chelli (2005), and Fairlie and Robb (2009) on the analysis and discussion of gender differences in self-employment.

4
an important entry barrier. For several decades, the minimum efficient size in
many countries has decreased considerably, thereby creating various new
entrepreneurial opportunities. The reasons behind such a reduction of minimum
efficient size are manifold. They include a demand shift away from standardized
mass production toward more individual products (Piore and Sabel 1984), the
increasing importance of knowledge as an input factor (Audretsch 2007),
technological developments in fields such as information and communication
that facilitate the coordination of labor division and allows for flexible small scale
production units (Thurik, Audretsch and Stam 2013), as well as ongoing
globalization that creates larger markets with new opportunities for a division of
labor (Audretsch, Grilo and Thurik 2011). In industrialized economies, such as
Germany, these developments induced a growing share of small firm
employment and a shift to service sector activities, many of which can be
competitively operated at rather small scales (see e.g. Bergmann and Sternberg
2007).
The most important change in socio-economic conditions, relevant for
entrepreneurship, occurred in the former East Germany, where a rapid
transformation to a market economic system took place.11 In addition, the
increased market size due to the fall of the Iron Curtain created new
entrepreneurial opportunities in both the East and the West. The development
of entrepreneurship in Germany also needs to be seen in the policy context, in
particular as a radical change with respect to public support of entrepreneurship
took place. A rather considerable number of policy measures were initiated and
launched at the federal as well as at the state and local level during this period
(see e.g. Bergmann and Sternberg 2007, Welter 2009), all seeking to stimulate
entrepreneurship and business start-ups. Some of the measures were also
accompanied by media campaigns. Most prominent among these programs are
those supporting start-ups by unemployed persons like the “bridging
11 The change of the institutional environment in East Germany can be regarded as a test of Baumol’s (1990) claim that the level of potential entrepreneurs is approximately the same in all societies but the proportion of those people who make productive use of their talent by running their own business depends on the ruling institutions. See Fritsch et al. (2014) for a detailed analysis of self-employment in East Germany.

5
allowance”12 or the “start-up subsidy” that supported about 1 million persons
between 2003 and 2006 (Caliendo and Kritikos 2010). Another prominent policy
program that demonstrates the policy shift towards entrepreneurship in
Germany is “EXIST.” Introduced in the late 1990s, this program seeks to
promote a culture of entrepreneurship at universities and other public research
institutes, including the provision of support to start-ups and spin-offs by
students and faculty members.13
In addition, regulatory changes – made between 1991 and 2009 – sought
to create or improve a business-friendly environment in German regions (see
also Welter, 2009), lowering the hurdles to become self-employed. For instance,
the requirement to be a “master craftsman” for establishing a business in a
number of occupations was eliminated in 2004,14 the minimum capital
requirements for setting up a limited liability company were reduced, and the
possibility of personal bankruptcy that limits private debts in case of business
failure was introduced in 1999 (see Fossen 2011). On the other end, in 2003,
access to support from social security was made more restrictive during the so-
called “Hartz-Reforms,” thus also encouraging the unemployed to opt into self-
employment (see Bergmann and Sternberg 2007). Last, but not least, fostering
female entrepreneurship has gained attention as a means of increasing the
overall rate of self-employment. The corresponding governmental programs
have primarily focused on eliminating individual barriers that women face on
their way to self-employment, such as lack of necessary human and financial
capital (Welter, 2009).15
12 For an earlier analysis of the bridging allowance program see Hinz und Jungbauer-Gans (1999). 13 For a comprehensive overview of the manifold policy initiatives to promote entrepreneurship in Germany see Welter (2009) 14 In Germany, setting up a business in the regulated crafts requires that the founder has a master craftsman’ certificate (Meisterbrief). This requirement was abolished for 52 crafts occupations in 2004. 15 Most programs, however, have led only to a few start-ups being directly supported. The only exception is the financial support of female start-ups out of unemployment, in particular the so called “start-up-subsidy,” which induced a higher share of women to start an own business. In contrast to many other programs, this subsidy was used on equal share by women and men (see Caliendo and Kritikos 2010) and impacted female entrepreneurship (see Caliendo and Künn forthcoming).

6
Another factor that may have contributed to the increasing level of
entrepreneurship in Germany is the increasing wealth level. Comparisons of the
self-employment levels across countries find a u-shaped relationship between
the share of self-employed workforce and the national wealth level, thus
indicating relatively high self-employment rates for both the poorest and richest
countries (Wennekers et al. 2010). It is argued that increasing levels of self-
employment in highly developed economies may come from a more
entrepreneurial attitude of the population, particularly from a growing desire of
people for self-realization and independence (see also Freytag and Thurik
2007).16 According to this argument, one may expect increasing levels of
opportunity entrepreneurship with rising wealth levels in countries such as
Germany.17
3. Data on the evolution of self-employment in Germany 1991-2009
Our investigation is based on the publicly accessible German Micro-Census
data, a representative survey containing information about the socio-economic
situation of 820,000 persons living in 380,000 households across Germany.18
The analysis draws on 19 waves of the Micro-Census, starting with 1991, when
the sample was substantially enlarged with the inclusion of East German
respondents, and concluding with the 2009 wave. The classification of
individuals as self-employed is based on a survey question about the
occupational status of the respondents. Self-employment applies to individuals
who own and manage a business, including craftsmen, people working in liberal
professions and freelancers. We include only those individuals who are self-
employed in their main occupation and calculate the self-employment rate as
the share of self-employed persons in the employed population between 18 and
65 years old. Civil servants and members of the military are excluded.
16 Global Entrepreneurship Monitor (GEM) data indicates that much of the self-employment observed in poorer countries is probably motivated by necessity; see Bosma, Wennekers and Amoros (2012) for details. 17 According to GEM data, the level, as well as the share, of opportunity entrepreneurship in Germany showed, however, no clear trend over the 2001-2011 period (Brixy, Sternberg and Vorderwülbecke 2012). 18 For more detailed information on the current Micro-Census program, see Micro-Census Law 2005 of 24 June 2004 (Federal Law Gazette I, p. 1350).

7
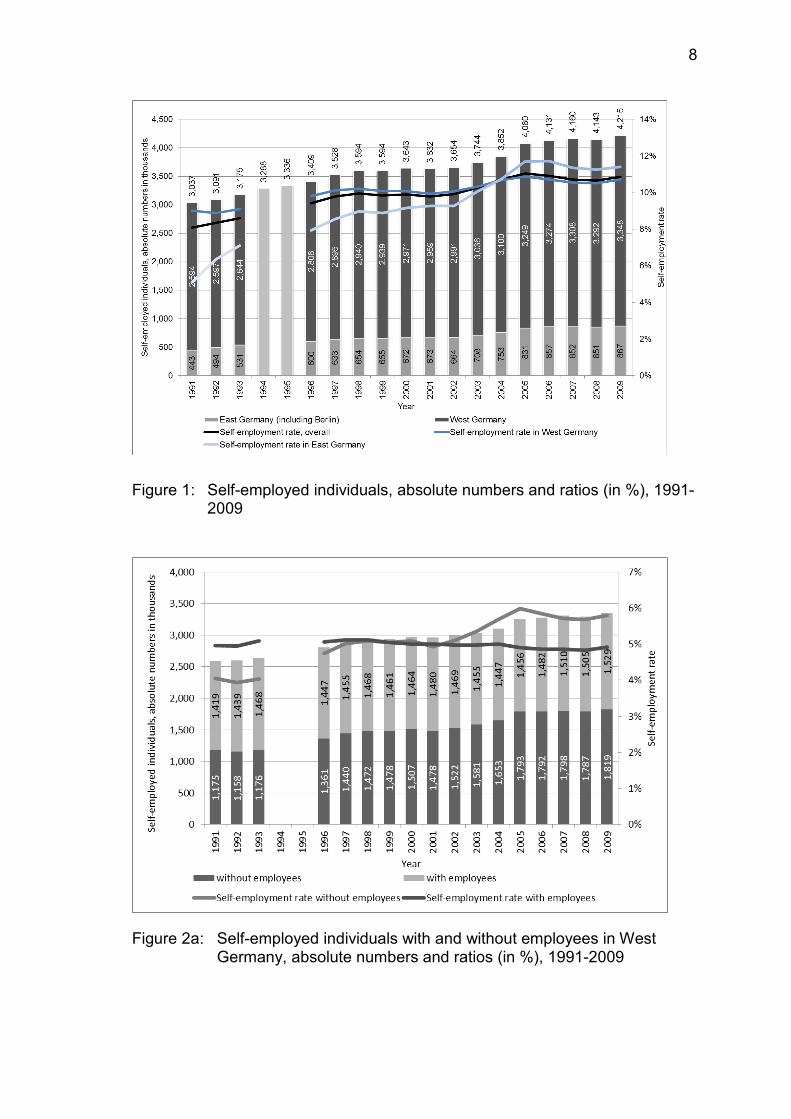
Between 1991 and 2009, the number of self-employed persons in the
German population rose almost constantly from 3.037 million in 1991 to 4.215
million in 2009 (see Figure 1).19 This increase is more pronounced in East
Germany where, until the breakdown of the socialist GDR regime in 1989/90, an
anti-entrepreneurship policy was in place (see Brezinski 1987; Pickel 1992). In
the fall of 1989, before the regime change, the self-employment rate in East
Germany was at 1.8 percent (Kawka 2007). With the regime-change, East
Germans started perceiving entrepreneurship as an opportunity to generate
income, while also with increasing unemployment rates necessity motives, such
as escaping unemployment or overcoming economic problems, underlay many
entrepreneurial career choices. As early as 1991, the self-employment rate in
East Germany was at 5.1 percent, with a particular focus on the service and the
construction sectors. In 2004, only 14 years after unification self-employment in
East Germany matched that of West German areas (Figure 1).
Distinguishing between self-employed persons with and without
employees (Figure 2a and 2b) reveals that the number of solo self-employed
increased over the entire observation period in both parts of the country, but this
rise was more pronounced in the East than in the West. With respect to the self-
employed with employees, we observe rather different developments. In West
Germany there is a small, but constant expansion of this group, while in East
Germany the number of self-employed persons with employees increased from
2.7 percent in 1991 to 4.7 percent in 1999 and since then has declined
slightly.20
19 It is quite remarkable that the Total Early-Stage Entrepreneurial Activity (TEA) Index, which constitutes the main measure for the level of entrepreneurship in the GEM study, does not show an increasing trend for Germany between 2001 and 2009 (Brixy, Sternberg, Vorderwülbecke 2012), while the Micro-Census recorded an increase of the self-employment rate of about 11 percent (from 9.8 to 10.9) over this period. 20 The rise of the number and the level of self-employed with employees in East Germany was particularly pronounced in the first ten years following German unification. Over this relatively short period of time, East Germany caught up to the level of West Germany, thus indicating that the change to a market system created sufficient demand for products offered by small firms. In the following years the level of self-employment with employees remained comparable in both parts of the country while there is clear evidence that the quality and size of businesses in East Germany is still below the level in West Germany.
8
Figure 1: Self-employed individuals, absolute numbers and ratios (in %), 1991-2009
Figure 2a: Self-employed individuals with and without employees in West Germany, absolute numbers and ratios (in %), 1991-2009

9
Figure 2b: Self-employed individuals with and without employees in East Germany, absolute numbers and ratios (in %), 1991-2009
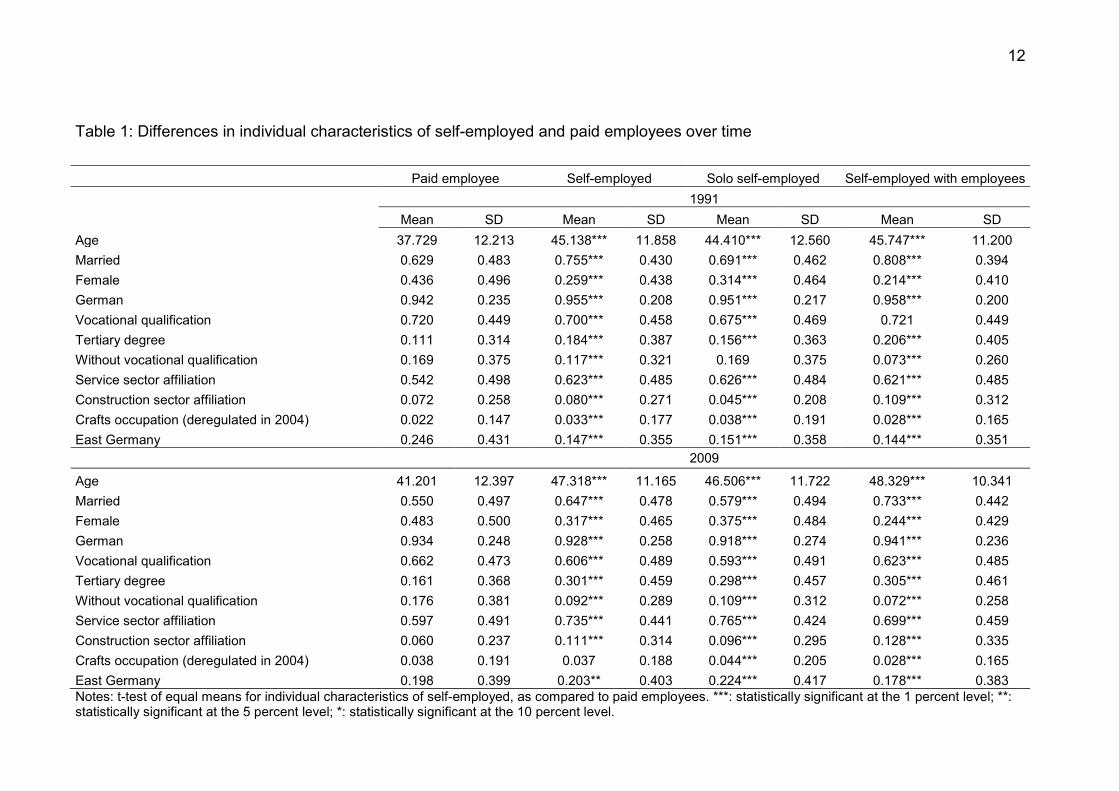
With regard to the differences in individual characteristics by employment
status, the descriptive statistics are in line with previous research. We find that,
on average, self-employed people significantly differ from their dependently
employed counterparts in a number of characteristics, including age, gender,
marital status, nationality, level of education, and industry sector affiliation
(Table 1).21 The German population has experienced major changes with regard
to these characteristics over the period under observation (see Table A2 in the
Appendix). The average age of population has increased from 38.3 years in
1991 to 41.8 years in 2009. There are more females actively participating in the
labor market, leading to an increase in the share of women among paid
employees as well as among self-employed with and without employees.22 We
21 A number of indicators that are often used for explaining the propensity of a transition into self-employment are not suited for an analysis of the stock in self-employment and have, therefore, not been included in the analysis. This pertains to income, the personal wealth level, the number of children, and the size of the community where a person lives. 22 A higher share of women among self-employed could be partly induced by various supporting programs by the German Federal Government devoted to fostering entrepreneurship among

10
also observe a higher percentage of people holding a tertiary degree.
Remarkably, the increase of highly educated was more pronounced among self-
employed people (from 18.4 to 30.1 percent) than among employees (from 11.1
to 16.1 percent). Moreover, the service sector expanded between 1991 and
2009. The Micro-Census data show a substantial shift in the industry structure
of self-employment towards the service sector during this period (Figure 3). The
share of self-employed persons who were affiliated to the service sector
increased from 35.8 percent in 1991 to 52.9 percent in 2009, reflecting the
structural change observed in innovation-driven economies.23 Other sectors,
with the exception of construction, faced negative trends with regard to numbers
and shares of all self-employed persons. For instance, in “mining,
manufacturing, energy and water supply,” the number of self-employed fell by
about 27 percent.
As the deregulation of several crafts occupations may have fostered self-
employment, we take a closer look at the development of self-employment in
these occupations over time. Indeed, we find that the share of self-employed
that are active in those crafts occupations where the precondition of being a
master craftsman for founding a business was abolished in 2004, rose from 3.3
percent in 1991 to 3.7 percent in 2009 (Table 1). This development was,
however, accompanied by an even stronger increase in the share of paid
employees that work in these occupations (from 2.2 percent to 3.8 percent).24
females. Those support measures were particularly focused on individual-level barriers that may prevent women to become entrepreneurs such as lack of human or financial capital (see Welter 2006, 2009). An increased share of women among paid employees may have resulted from an increased attractiveness or availability of labor market opportunities for women, in particular of part-time jobs that may meet the requirements for work-family balance. 23 According to the German Labor Force Statistics (Erwerbstätigenstatistik), the share of service employment in Germany increased from 60.9 percent in 1991 to 73.4 percent in 2009, while the employment share of the manufacturing sector decreased from 36.1 percent to 24.9 over the same period. See Federal Statistical Office (2012). 24 As a consequence, the overall rate of self-employment in this sector decreased from 11.57 percent to 10.75 percent. A more precise look at this development reveals that the rate of self-employment with employees in the deregulated crafts occupations decreased over time (from 5.41 percent to 3.66 percent); while – on contrary - the solo self-employment rate has remarkably increased (from 6.17 percent to 7.10 percent).

11
Figure 3: Self-employment by industrial sectors, absolute numbers and shares in percent, 1991-2009
In summary, this brief review shows four kinds of trends of self-
employment in Germany that have significantly contributed to its unique
increase between 1991 and 2009: the growth of entrepreneurship in East
Germany after the end of the socialist regime in 1990, the increase of solo
entrepreneurship in both parts of the country, a shift of economic activity toward
the service sector, which is characterized by relatively low entry barriers in
terms of minimum efficient size, and, lastly, an increase in people holding a
tertiary degree. The divergent developments of entrepreneurship with and
without employees suggest that these types of self-employment are driven by
different factors.25
25 Lohmann and Luber (2004), in their analysis of the development of self-employment in West Germany over the 1984-1998 period, identify a structural shift to the service sector and high unemployment as important sources of an increase of self-employment, particularly of solo self-employment.
12
Table 1: Differences in individual characteristics of self-employed and paid employees over time
Paid employee Self-employed Solo self-employed Self-employed with employees 1991 Mean SD Mean SD Mean SD Mean SD Age 37.729 12.213 45.138*** 11.858 44.410*** 12.560 45.747*** 11.200 Married 0.629 0.483 0.755*** 0.430 0.691*** 0.462 0.808*** 0.394 Female 0.436 0.496 0.259*** 0.438 0.314*** 0.464 0.214*** 0.410 German 0.942 0.235 0.955*** 0.208 0.951*** 0.217 0.958*** 0.200 Vocational qualification 0.720 0.449 0.700*** 0.458 0.675*** 0.469 0.721 0.449 Tertiary degree 0.111 0.314 0.184*** 0.387 0.156*** 0.363 0.206*** 0.405 Without vocational qualification 0.169 0.375 0.117*** 0.321 0.169 0.375 0.073*** 0.260 Service sector affiliation 0.542 0.498 0.623*** 0.485 0.626*** 0.484 0.621*** 0.485 Construction sector affiliation 0.072 0.258 0.080*** 0.271 0.045*** 0.208 0.109*** 0.312 Crafts occupation (deregulated in 2004) 0.022 0.147 0.033*** 0.177 0.038*** 0.191 0.028*** 0.165 East Germany 0.246 0.431 0.147*** 0.355 0.151*** 0.358 0.144*** 0.351 2009
Age 41.201 12.397 47.318*** 11.165 46.506*** 11.722 48.329*** 10.341 Married 0.550 0.497 0.647*** 0.478 0.579*** 0.494 0.733*** 0.442 Female 0.483 0.500 0.317*** 0.465 0.375*** 0.484 0.244*** 0.429 German 0.934 0.248 0.928*** 0.258 0.918*** 0.274 0.941*** 0.236 Vocational qualification 0.662 0.473 0.606*** 0.489 0.593*** 0.491 0.623*** 0.485 Tertiary degree 0.161 0.368 0.301*** 0.459 0.298*** 0.457 0.305*** 0.461 Without vocational qualification 0.176 0.381 0.092*** 0.289 0.109*** 0.312 0.072*** 0.258 Service sector affiliation 0.597 0.491 0.735*** 0.441 0.765*** 0.424 0.699*** 0.459 Construction sector affiliation 0.060 0.237 0.111*** 0.314 0.096*** 0.295 0.128*** 0.335 Crafts occupation (deregulated in 2004) 0.038 0.191 0.037 0.188 0.044*** 0.205 0.028*** 0.165 East Germany 0.198 0.399 0.203** 0.403 0.224*** 0.417 0.178*** 0.383 Notes: t-test of equal means for individual characteristics of self-employed, as compared to paid employees. ***: statistically significant at the 1 percent level; **: statistically significant at the 5 percent level; *: statistically significant at the 10 percent level.
13
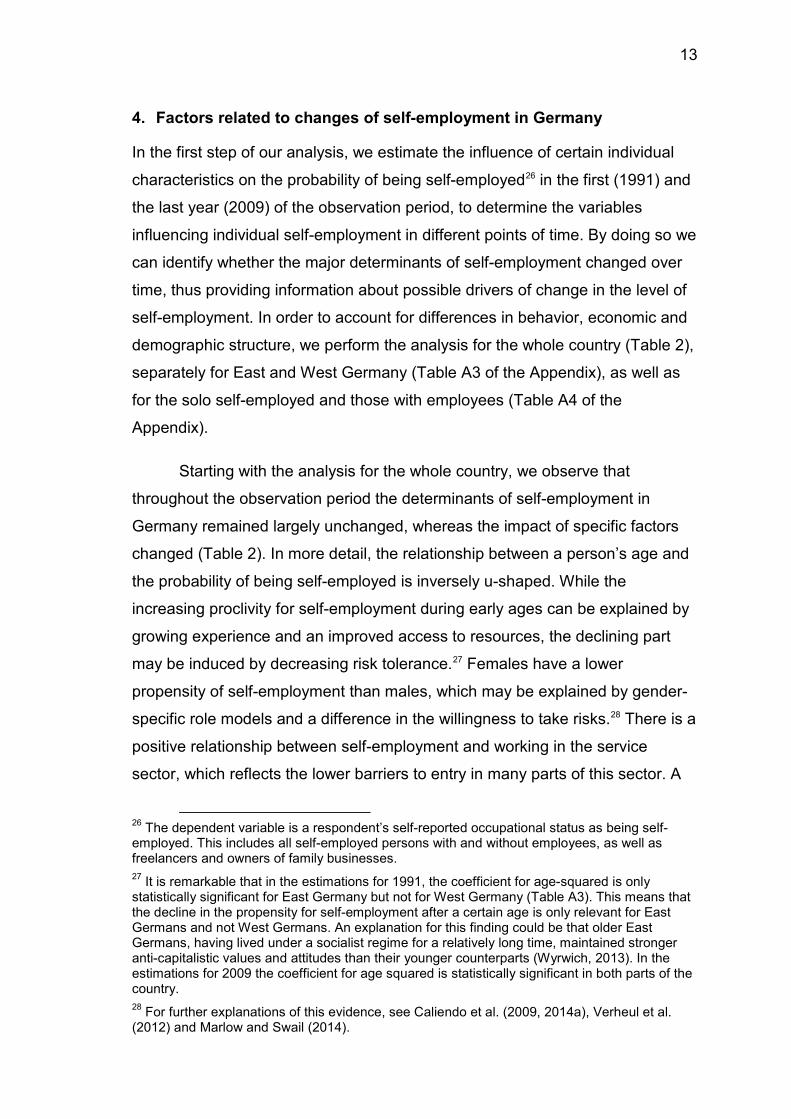
4. Factors related to changes of self-employment in Germany
In the first step of our analysis, we estimate the influence of certain individual
characteristics on the probability of being self-employed26 in the first (1991) and
the last year (2009) of the observation period, to determine the variables
influencing individual self-employment in different points of time. By doing so we
can identify whether the major determinants of self-employment changed over
time, thus providing information about possible drivers of change in the level of
self-employment. In order to account for differences in behavior, economic and
demographic structure, we perform the analysis for the whole country (Table 2),
separately for East and West Germany (Table A3 of the Appendix), as well as
for the solo self-employed and those with employees (Table A4 of the
Appendix).
Starting with the analysis for the whole country, we observe that
throughout the observation period the determinants of self-employment in
Germany remained largely unchanged, whereas the impact of specific factors
changed (Table 2). In more detail, the relationship between a person’s age and
the probability of being self-employed is inversely u-shaped. While the
increasing proclivity for self-employment during early ages can be explained by
growing experience and an improved access to resources, the declining part
may be induced by decreasing risk tolerance.27 Females have a lower
propensity of self-employment than males, which may be explained by gender-
specific role models and a difference in the willingness to take risks.28 There is a
positive relationship between self-employment and working in the service
sector, which reflects the lower barriers to entry in many parts of this sector. A
26 The dependent variable is a respondent’s self-reported occupational status as being self-employed. This includes all self-employed persons with and without employees, as well as freelancers and owners of family businesses. 27 It is remarkable that in the estimations for 1991, the coefficient for age-squared is only statistically significant for East Germany but not for West Germany (Table A3). This means that the decline in the propensity for self-employment after a certain age is only relevant for East Germans and not West Germans. An explanation for this finding could be that older East Germans, having lived under a socialist regime for a relatively long time, maintained stronger anti-capitalistic values and attitudes than their younger counterparts (Wyrwich, 2013). In the estimations for 2009 the coefficient for age squared is statistically significant in both parts of the country. 28 For further explanations of this evidence, see Caliendo et al. (2009, 2014a), Verheul et al. (2012) and Marlow and Swail (2014).

14
positive effect is also observed for those who are affiliated with the construction
sector. Notably, the positive impact of being affiliated with one of the both
mentioned sectors did become stronger over time suggesting an increased
propensity of self-employment in those industries. Having earned higher formal
qualifications leads to a significantly higher propensity of self-employment and
this impact on the likelihood of self-employment has increased over time, as
well. However, for affiliation to those craft occupations that once required
“Master” status but were deregulated in 2004, we find a statistically significant
and positive influence on the probability of self-employment.
Table 2: Determinants of self-employment – Full sample
1991 2009 1991 and
2009 Age 0.00268*** 0.00631*** 0.00484*** (0.000) (0.000) (0.000) Age squared -3.18e-07 -3.51e-05*** -2.04e-05*** (0.000) (0.000) (0.000) Married (1=yes; 0=no) 0.00588*** -0.000943 -0.00119* (0.001) (0.001) (0.001) Female (1=yes; 0=no) -0.0428*** -0.0625*** -0.0530*** (0.001) (0.001) (0.001) German (1=yes; 0=no) 0.00957*** -0.0156*** -0.00637*** (0.002) (0.002) (0.001) Without vocational qualification Reference Vocational training (1=yes; 0=no) 0.0170*** 0.0229*** 0.0193*** (0.001) (0.002) (0.001) Tertiary education (1=yes; 0=no) 0.0405*** 0.0853*** 0.0654*** (0.002) (0.003) (0.002) Service sector affiliation (1=yes; 0=no) 0.0318*** 0.0849*** 0.0576*** (0.001) (0.001) (0.001) Construction sector affiliation (1=yes; 0=no) 0.0228*** 0.179*** 0.0878*** (0.002) (0.004) (0.002) Crafts occupation, deregulated in 2004 (1=yes; 0=no)
0.0444*** 0.0106*** 0.0284*** (0.004) (0.003) (0.002)
Dummies for Federal States Yes*** Yes*** Yes*** Number of observations 306,204 316,686 622,890 McFadden Pseudo R2 0.0813 0.1027 0.0892 Log Likelihood -78,927.80 -98,372.92 -178,806.51 Wald Chi2 14,133.67*** 20,373.61*** 33,546.56***
Notes: marginal effects after logit regression with robust standard errors (in parentheses). ***: statistically significant at the 1 percent level; **: statistically significant at the 5 percent level; *: statistically significant at the 10 percent level.
The results for East and West Germany largely replicate the results for
the full sample (see Table A3 in Appendix). The only remarkable difference
between the two regions is that in the Eastern part, German nationals showed

15
throughout the observation period a lower propensity of being self-employed
than non-Germans while the effect of German nationality turned from
significantly positive to significantly negative for persons living in the Western
part of Germany. Beyond this observation, there seems to be no further
evidence of any strong behavioral idiosyncrasies for East Germans that may
have resulted from living under the socialist regime.29 All in all, the results are
consistent with previous research (see, for instance, Parker 2009).
The determinants of solo-entrepreneurship seem to have changed
considerably over the period under observation (Table A4 in Appendix). While
persons with a German nationality were significantly more likely to be solo self-
employed in 1991, they showed a significantly lower propensity to make this
occupational choice in 2009. Two differences with regard to the educational
level are remarkable. On the one hand, the relationship between having a
vocational degree and being a solo entrepreneur has changed from non-
significant and negative in 1991 to significant and positive in 2009. On the other
hand, the positive role of tertiary education for the propensity of being solo self-
employed increased considerably over the observation period.
In contrast to this, most of the determinants of self-employment with
employees did not change over the period under study. One exception in this
respect is that the significant difference between Germans and non-Germans
concerning the likelihood of being an employer disappeared over time. Another
exception is that affiliation with one of the craft occupations deregulated in 2004
had a significantly positive effect on the probability of being an employer in 1991
but not in 2009.
29 Interestingly, Pistrui et al. (2000), in their study of family businesses from a West German and an East German region in the late 1990s, find considerable differences with regard to entrepreneurial orientation. The study indicates that, on average, East German entrepreneurs show greater commitment to their venture. The representativeness of the underlying sample is, however, largely unclear.

16
5. Decomposition Analysis
5.1 The non-linear Blinder-Oaxaca technique
As outlined in Section 2, the large increase in the level of self-employment that
we observed in Germany may have various reasons. Besides directly
observable factors there may also be “soft factors” at work, such as changing
attitudes of the population towards entrepreneurship, which are difficult to
measure. By applying now, as a second step of our empirical strategy, the
Blinder-Oaxaca decomposition technique adapted for non-linear models (Fairlie
2005), we distinguish and quantitatively assess the influence of both observable
and unobservable factors on the development of self-employment in Germany.
This approach is widely used for the analysis of behavioral differences between
groups and is common in studies of racial or gender gaps in the labor market
literature. The Blinder-Oaxaca decomposition has also been applied to
investigate the differences in self-employment rates of minorities and
disadvantaged groups (see, e.g., Fairlie 1999, 2006).30 However, we are not
aware of any previous study that has used this method to explore changes in
the level of self-employment over time.
For a nonlinear equation , the Blinder-Oaxaca decomposition of
the average value of the dependent variable Y between 1991 and 2009 can be
expressed as:
, (1)
with jY denoting the average self-employment probability of group j,
20091991,j � , and jN denoting the sample size of group j. jiX represents the
average values of the independent variables and jβ̂ are the estimated
coefficients for the respective probabilities of being self-employed. The first term
30 For other applications of this technique, see e.g. Fitzenberger, Kohn and Wang (2011).
17
in equation (1) estimates the contribution of changes of the independent
variables jiX (economic and demographic structure) to the difference of the
level of self-employment between 1991 and 2009 (difference in characteristics).
As independent variables, we use those indicators in our data for which we find
a theoretically plausible and statistically significant relationship with the
employment status (see Table 2). In model specification (1), the coefficient
estimates β̂ for 1991 are used as the weights for individual characteristics of
being self-employed. Hence, the first term in (1) represents the part of the
change of the level of self-employment that can be attributed to changes in the
economic and demographic structure as measured by the variables that have
been included in the analysis.
The second term in (1) represents the part of the difference in self-
employment that cannot be explained by the variables that represent changes
in the economic and demographic structure (difference in coefficients). This
component could be interpreted as changes in formal and informal institutions
that affect people’s behavior, i.e. with regard to their willingness to start an own
business. It indicates to what extent the German population has developed a
more positive attitude toward entrepreneurship in the 20 years since
reunification.31
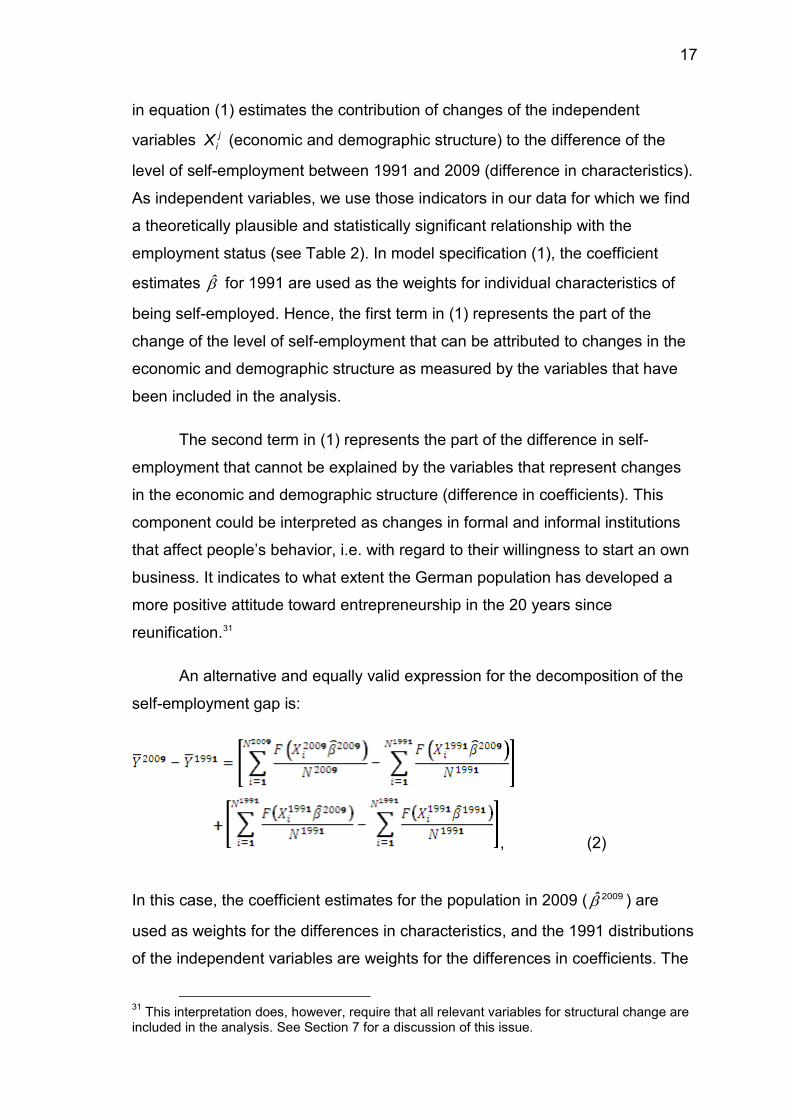
An alternative and equally valid expression for the decomposition of the
self-employment gap is:
, (2)
In this case, the coefficient estimates for the population in 2009 ( 2009β̂ ) are
used as weights for the differences in characteristics, and the 1991 distributions
of the independent variables are weights for the differences in coefficients. The
31 This interpretation does, however, require that all relevant variables for structural change are included in the analysis. See Section 7 for a discussion of this issue.

18
use of different weights in (1) and (2) can lead to different results, particularly for
East Germany, where entrepreneurship can be assumed to have been different
in 2009 when compared to 1991. As a sensitivity check of the decomposition
results, we also use coefficient estimates from the pooled model of all
individuals in 1991 and 2009, as proposed by Oaxaca and Ransom (1994).
Hence, we estimate three alternative model specifications: (1) using the
estimated coefficients for the first year (1991) of the observation period; (2)
based on the estimated coefficients for the last year (2009) of the observation
period; as well as (3) for a pooled sample. Each model is run for the whole
country, and separately for East and West Germany as well as for solo
entrepreneurs and for employers.
Furthermore, we extend the non-linear decomposition analysis by directly
attributing the changing levels of self-employment to certain characteristics
represented by independent variables. A particular advantage of this extended
analysis is that it quantifies the contribution of each independent variable to the
change in the level of self-employment over time. These variable-specific
contributions can be estimated as the change in the average predicted
probability by replacing the distribution of the variable of interest from the year
1991 with the distribution of the same variable from the year 2009 while keeping
the distribution of the other variables constant.32
5.2 Empirical Results
Table 3 reports the regression-based decomposition results for the different
samples. The total change in the level of self-employment over the observation
period is reported in the second column. The third column presents the
proportion of change that can be attributed to the differences in the structure of
the population between 1991 and 2009, while the fourth column shows the part
of changes that might be due to changes in behavior. These figures should be
regarded as an upper limit for the magnitude of such behavioral changes
because they might be caused by other unobserved factors for which our data
does not provide information. Taking East and West Germany together, the
32 See Fairlie (2005) for a more detailed description of this procedure.

19
decomposition procedure indicates that between 44.6 and 53.6 percent of the
change in the level of self-employment can be attributed to the independent
variables included in the analysis.
Table 3: Decomposition of the change of self-employment between 1991 and 2009
Total difference
Difference in characteristics Difference in coefficients
Full sample
0.0291 0.0135 (46.39%) 0.0156 (53.61%)
0.0291 0.0161 (55.33%) 0.013 (44.67%)
0.0291 0.0161 (55.33%) 0.013 (44.67%) East Germany
0.0628 0.00875 (13.93%) 0.05405 (86.07%)
0.0628 0.023 (36.62%) 0.0398 (63.38%)
0.0628 0.0201 (32.01%) 0.0427 (67.99%) West Germany
0.0183 0.0124 (67.76%) 0.0059 (32.24%)
0.0183 0.014 (76.50%) 0.0043 (23.50%)
0.0183 0.0137 (74.86%) 0.0046 (25.14%) Solo self-employed
0.0258 0.00771 (29.88%) 0.01809 (70.12%)
0.0258 0.0114 (44.19%) 0.0144 (55.81%)
0.0258 0.0113 (43.8%) 0.0145 (56.2%) Employers
0.0063 0.00628 (99.68%) 0.00002 (0.32%)
0.0063 0.00522 (82.86%) 0.00108 (17.14%) 0.0063 0.00575 (91.27%) 0.00055 (8.73%)
Notes: ***: statistically significant at the 1 percent level; **: statistically significant at the 5 percent level; *: statistically significant at the 10 percent level. Bootstrapped standard errors with 50 replications. and correspond to equations (1) and (2), respectively. are weights for the pooled sample of the years 1991 and 2009.
The results of the separate estimations for East and West Germany
further suggest significant differences in the factors that induced changing
levels of self-employment activities in both parts of the country. In fact, the
unexplained non-structural changes are considerably larger in East Germany
(between 63.4 percent and 86.1 percent) than in West Germany (between 23.5
percent and 32.2 percent).

20
One reason for the relatively large unexplained gap in East Germany is
most probably the introduction of the formal institutions of a market economy in
1990 that unleashed formerly repressed private initiative, thereby positively
affecting the inherent entrepreneurial spirit and propensity of self-employment.
In fact, if the attitudes and abilities of the East German population with regard to
entrepreneurship would have remained at 1991 levels, and controlling for
structural changes through 2009, the East German self-employment rate should
have only reached 5.8 percent in 2009, not the 11.2 percent it actually
reached.33 If, in 1991, the East German population would have had the same
propensity for self-employment as 2009, the East German self-employment rate
in 1991 would have amounted to about 8.9 percent. Noteworthy, our results
also suggest that if the entrepreneurial attitudes of the West German population
would have remained at 1991 levels, the 2009 self-employment rates in West
Germany would have only reached 10.3 percent; not the actual achieved rate of
10.9 percent.
Furthermore, it is striking that the part of the development that is
explained by the observable characteristics of the economy is much higher for
the employers than for the solo entrepreneurs. Taking the behavioral
parameters estimated for 1991, we find that these variables may explain 99.6
percent—virtually all—of the changes in self-employment of employers, but only
29.8 of the dynamics of solo entrepreneurship.
Table 4 shows estimates for the contribution of individual characteristics
to the explained change of self-employment in the whole of Germany as well as
for East and West separately. The results of the decomposition are sensitive to
the choice of coefficients that were estimated for the first (1991) and final (2009)
years of the observation period. A solution to this index problem is provided by
Oaxaca and Ransom (1994), who suggest using the coefficients estimated on
the basis of the pooled sample. Thus, we base our interpretation on these
pooled coefficients. According to the estimates for the pooled sample, there are
two structural characteristics of the economy that had, by far, the strongest
33 This figure is the sum of the East German self-employment rate in the year 1991 and the increase of self-employment in East Germany that can be attributed to changes in the economic structure between 1991 and 2009, based on the behavioral coefficients estimated for 1991.

21
positive effect on the increase of self-employment in Germany. These are the
increasing share of service sector employment (26.5 percent) 34 and the growing
share of persons with a tertiary degree (27.9 percent). The increasing average
age of the population also had a noteworthy impact, contributing 13.2 percent to
the explanation, indicating that a large part of the population entered age
categories that are characterized by a relatively high propensity to be self-
employed.
Given the significantly lower propensity of females to be self-employed,
the increased female participation in the labor market results in a negative effect
on the level of self-employment (minus 16 percent) (see Caliendo et al. 2014b,
for a more detailed analysis). The declining share of people with vocational
training also contributes negatively to the level of self-employment (minus 13.4
percent). The impact of the marital status, nationality (thus of migrants), and
being in a deregulated crafts occupation to the explanation of changing self-
employment levels is rather small. For example, only 2.9 percent of the change
can be explained by marital status, 0.66 percent is due to the increasing share
of people with non-German nationality, and 4.6 percent can be assigned to
affiliation to a deregulated crafts occupation.
That only about 4.8 percent of the increasing self-employment rate in
Germany can be attributed to the rather pronounced rise of entrepreneurship in
the Eastern part is due to the fact that East Germans make up only about 20
percent of the overall German population. Thus, changes in East Germany had
only a relatively small effect on increased self-employment rates across
Germany as a whole. The main differences between East and West Germany
with regard to the contribution of the different factors are a particularly strong
positive contribution of the growing service sector and of the share of people
with tertiary education to the increase of the self-employment rate in West
Germany as compared to East Germany.
The decomposition results for the self-employment rates of solo entrepreneurs
and employers (Table 5) reveal several pronounced differences. For instance,
34 For ease of interpretation, the contributions of independent variables can be expressed in percent by dividing the corresponding coefficient over the gap of the dependent variable, i.e., the change of the self-employment rate between 1991 and 2009.

22
the increasing average age of the population explains about 15.9 percent of the
increase in the employers’ self-employment rate but only about 3.8 percent of
the rate of solo self-employment. Also the increasing share of service sector
employment makes a larger contribution to the growing self-employment rate for
employers (42.8 percent) than to the corresponding increase for solo self-
employed (19.1 percent). The deregulation of self-employment in crafts
occupations explains about 7.3 percent of increasing solo entrepreneurship but
only 2.9 percent of the increase of employers. Overall, while we are able to
explain changes among self-employed with employees and among self-
employed in West Germany to a high degree by a changing structure, structural
variables mattered little for the increase in solo-entrepreneurship and for the
development of East Germany.

23
Table 4: Non-linear decompositions of the change of self-employment rates
East and West East West
1991 2009 1991/2009 pooled 1991 2009 1991/2009
pooled 1991 2009 1991/2009 pooled
Self-employment rate in 1991 0.0807 0.0807 0.0807 0.0496 0.0496 0.0496 0.0909 0.0909 0.0909 Self-employment rate in 2009 0.1098 0.1098 0.1098 0.1125 0.1125 0.1125 0.1092 0.1092 0.1092 1991/2009 change 0.0291 0.0291 0.0291 0.0628 0.0628 0.0628 0.0183 0.0183 0.0183 Age 0.00452*** 0.0027*** 0.00385*** 0.0027*** 0.0050*** 0.00512*** 0.00601*** 0.0018*** 0.00360***
(0.000) (0.000) (0.000) (0.000) (0.000) (0.000) (0.000) (0.000) (0.000) Married -0.0010*** -0.000263 -0.00046*** -0.0013*** 9.10e-05 -0.000724 -0.000819*** -0.000394** -0.000566***
(0.000) (0.000) (0.000) (0.001) (0.001) (0.001) (0.000) (0.000) (0.000) Female -0.003*** -0.00662*** -0.00467*** -0.0058*** -0.00570*** -0.00711*** -0.00173*** -0.00703*** -0.00420***
(0.000) (0.000) (0.000) (0.000) (0.000) (0.000249) (0.000) (0.000) (0.000) German nationality -0.000129*** 0.00029*** 0.000107*** 0.000318** 0.00089*** 0.000814*** 3.17e-05*** 0.00019*** 2.91e-05*
(0.000) (0.000) (0.000) (0.000) (0.000) (0.000) (0.000) (0.000) (0.000) Vocational training -0.00287*** -0.00482*** -0.00391*** -0.007*** -0.00462*** -0.00719*** -0.00253*** -0.00463*** -0.00338***
(0.000) (0.000) (0.000) (0.000) (0.001) (0.001) (0.000) (0.000) (0.000) Tertiary education 0.00500*** 0.00938*** 0.00811*** 0.00734*** 0.00901*** 0.0104*** 0.00573*** 0.00955*** 0.00806***
(0.000) (0.000) (0.000) (0.000) (0.001) (0.001) (0.000) (0.000) (0.000) Service sector affiliation 0.00466*** 0.00761*** 0.00772*** 0.00807*** 0.00285*** 0.00856*** 0.00371*** 0.00822*** 0.00700***
(0.000) (0.000) (0.000) (0.000) (0.001) (0.000) (0.000) (0.000) (0.000) Construction sector affiliation 8.79e-05*** 0.00650*** 0.00247*** 0.00127*** 0.0133*** 0.00770*** 0.0001*** 0.0054*** 0.00186***
(0.000) (0.000) (0.000) (0.000) (0.001) (0.000) (0.000) (0.000) (0.000)
Crafts occupations (deregulated in 2004) 0.00147*** 0.00024*** 0.000741*** 0.00243*** 0.000280** 0.00104*** 0.00127*** 0.00025*** 0.001***
(0.000) (0.000) (0.000) (0.000) (0.000) (0.000) (0.000) (0.000) (0.000)
Dummies for Federal States Yes*** Yes*** Yes*** Yes*** Yes*** Yes*** Yes*** Yes*** Yes*** Total explained 0.0135 0.0161 0.0161 0.00875 0.0230 0.0201 0.0124 0.0140 0.0137 Total explained (share) 46.39% 55.33% 55.33% 13.93% 36.62% 32.01% 67.76% 76.50% 74.86%
Notes: Standard errors are reported in parentheses below contribution estimates. ***: statistically significant at the 1 percent level; **: statistically significant at the 5 percent level; *: statistically significant at the 10 percent level
Table 5: Non-linear decompositions of the change of self-employment rates—Solo entrepreneurs and employers

24
Solo self-employed Employers 1991 2009 1991/2009 pooled 1991 2009 1991/2009 pooled Self-employment rate in 1991 0.0383 0.0383 0.0383 0.0458 0.0458 0.0458 Self-employment rate in 2009 0.064 0.064 0.064 0.0521 0.0521 0.0521 1991/2009 change 0.0258 0.0258 0.0258 0.0063 0.0063 0.0063 Age 0.001*** 0.000433*** 0.000973*** 0.00171*** 0.000656*** 0.00100***
(0.000102) (8.16e-05) (7.71e-05) (8.48e-05) (6.80e-05) (5.49e-05) Married 0.00105*** 0.00219*** 0.00209*** -0.00208*** -0.00275*** -0.00239***
(0.000152) (0.000161) (0.000127) (0.000136) (0.000152) (0.000106) Female -0.00165*** -0.00372*** -0.00262*** -0.00197*** -0.00429*** -0.00264***
(8.75e-05) (0.000117) (7.63e-05) (8.74e-05) (0.000117) (6.96e-05) German nationality -0.000129*** 0.000375*** 0.000240*** -1.92e-05*** 1.12e-05 -8.81e-06
(3.66e-05) (3.72e-05) (3.42e-05) (6.24e-06) (1.27e-05) (7.14e-06) Vocational training 0.000107 -0.00232*** -0.000775*** -0.00646*** -0.00490*** -0.00562***
(9.33e-05) (0.000257) (0.000148) (0.000462) (0.000408) (0.000305) Tertiary education 0.000317*** 0.00490*** 0.00304*** 0.00873*** 0.00788*** 0.00840***
(0.000102) (0.000262) (0.000163) (0.000523) (0.000440) (0.000339) Service sector affiliation 0.00225*** 0.00293*** 0.00492*** 0.00220*** 0.00234*** 0.00270***
(0.000117) (0.000173) (0.000104) (8.92e-05) (0.000143) (7.86e-05) Construction sector affiliation 0.000149*** 0.00490*** 0.000904*** 0.000848*** 0.00565*** 0.00269***
(2.32e-05) (0.000186) (5.01e-05) (6.11e-05) (0.000186) (8.64e-05)
Crafts occupations (deregulated in 2004) 0.00139*** 0.000382*** 0.000820*** 0.000522*** -1.48e-06 0.000169***
(0.000125) (6.33e-05) (6.70e-05) (7.68e-05) (2.70e-05) (3.23e-05)
Dummies for Federal States Yes*** Yes*** Yes*** Yes*** Yes*** Yes*** Total explained 0.00771 0.0114 0.0113 0.00628 0.00522 0.00575 Total explained (share) 29.88% 44.19% 43.80% 99.68% 82.86% 91.27%
Notes: Standard errors are reported in parentheses below contribution estimates. ***: statistically significant at the 1 percent level; **: statistically significant at the 5 percent level; *: statistically significant at the 10 percent level.

25
6. Discussion and Conclusion
The rise of Germany’s self-employment rates by 40 percent during the first two
decades following unification is a unique case among innovation-driven
economies. So far it was unclear which factors drove this development.
Previous research revealed only single factors that were important explaining
this development without clarifying there relative importance. To further uncover
the underlying reasons for this increase, we employ the non-linear Blinder-
Oaxaca decomposition technique that allows us to disclose the relative
importance of the different determinants that have induced the changes in the
level of entrepreneurship.
Three major changes of the socio-economic environment, which we
discussed in section 2, contribute to this development: the shift of the sectoral
structure toward the service economy, a higher share of people holding a
tertiary degree, and population aging towards those age classes where
individuals are particularly open for entrepreneurial activities. Thus, except for
the easing of the entrance of new businesses into the service sector, these
changes may not be attributed to entrepreneurship policies.
While these factors can explain half of the changing self-employment in
Germany, the other half could be interpreted in the direction of a more positive
attitude toward entrepreneurial activities among the population. One part of
these behavioral changes may be attributed to entrepreneurial opportunities
that resulted from globalization and from technological developments.
Furthermore, regulatory changes and policy programs that propagated
entrepreneurship and supported new business formation, thus, the sum of
policy measures mentioned in section 2, may have influenced the change in
attitudes. Interesting enough, it should also be emphasized that some of these
measures, like the deregulation of entry in a number of crafts occupations, did
not lead to an increase of self-employment in this sector.
We were further interested in the reasons behind the rapid convergence of
East German self-employment rates to those of West Germany, which occurred
only 14 years after unification. Considering that the radical shift to the

26
institutions of a market economy system in East Germany unleashed private
initiative (Wyrwich, 2013), it is reasonable to observe that a larger share of the
development can be attributed to behavioral changes in the East (between 63
and 86 percent) than in the West (between 23 and 32 percent). As far as the
behavioral change of East Germans has resulted from this liberalization, one
may not only trace it back to a change of attitudes as these attitudes may have
pre-existed. This interpretation would be consistent with Baumol’s (1990)
hypothesis that the allocation of people into productive entrepreneurship is
strongly shaped by the ruling formal institutions. Moreover, the change may also
be explained by the high unemployment rates in East Germany and the
accompanying policy measures of promoting self-employment and of reducing
the financial support through the social security system.
In contrast, the main drivers of increasing entrepreneurship in West
Germany are the development of structural and demographic characteristics
that explain up to 76 percent of the rise of self-employment; compared to 36
percent in East Germany. Still, we can conclude that over the observation
period attitudes toward entrepreneurship among West Germans positively
changed.
What has also been unclear so far and what our further analysis reveals
is that the increasing solo entrepreneurship in Germany is to a much lesser
degree induced by changes in the socio-economic structure. These variables
can explain less than half of the increase in solo self-employment, while in case
of self-employment with employees virtually the complete increase can be
explained by the change in structural variables.
Consistent with the analysis of Lohmann and Luber (2004) for West
Germany over the 1984-1998 period, our analysis indicates that employers and
solo entrepreneurs tend to be rather distinct types with different factors affecting
the probability of self-employment.35 The conditions of the socio-economic
environment in Germany (high unemployment or increasing preferences for
independence and for self-realization) may also have contributed considerably
35 Lohmann and Luber (2004, 67) conclude from their analysis that, “there are distinct forms of self-employment which differ considerably from each other in terms of their underlying determinants and outcomes.”

27
to the observed greater willingness to be self-employed. However, still little is
known about the factors that determine entrepreneurial spirit, leaving room for
further investigation. In particular, the increase of solo-entrepreneurship needs
more attention in further research.
Our analysis has some limitations. For instance, the data do not allow us
to control for all factors that might determine self-employment, such as previous
working experience or the presence of self-employed parents or peers.36
However, the decomposition analysis clearly indicates the extent to which those
variables that are included into the analysis have contributed to the change of
self-employment. Another shortcoming of the method, which it shares with other
types of empirical analyses, is that the underlying causalities are not entirely
clear. We cannot, for example, disentangle to what extent the level of self-
employment has been increasing due to the shift of the economy toward the
service sector or to what extent the service sector has grown due to its
attractiveness for new businesses. Nevertheless, the decomposition analysis is
able to provide advice where to further investigate such potential causal
relationships.
Our findings allow for three policy relevant conclusions: First, if there has
been a change of behavior in Germany towards a more entrepreneurial society,
it has led to more solo entrepreneurship but to virtually no increase of the
number of entrepreneurs with dependent employees. This is simultaneously
good news (in terms of entrepreneurial attitudes) and bad news (in terms of
growth potential). It clarifies that future government policy – if it further aims to
support entrepreneurial activities – needs to put greater focus on designing
instruments that also take growth strategies for new businesses into account.
Second, our observations also make clear how important other policy
measures beyond direct policy interventions are. Improving the regulatory
environment in a way that it does not involve unnecessary impediments for
starting a firm remains challenging. Education policies also impact
36 This incomplete coverage of the determinants of entrepreneurship probably leads to an overestimation of the part of the increasing self-employment that could not be explained by characteristics of the economic structure. Since information about the complete set of all potential determinants of self-employment is rarely available this type of analysis will generally suffer from some vagueness of interpretation.

28
entrepreneurial entry as better educated individuals are more likely to enter into
self-employment. Changes since German unification had a substantial positive
effect on the rising number of self-employed, also with employees.
Third, the strong age-specific influence that we observed also has an
important policy implication. Because the so called baby-boomer generation is
now replaced by a generation with low birth rates, one can expect considerable
changes in the development of self-employment in Germany. Therefore,
German policy may need to seek for ways to avoid a decrease of
entrepreneurial activities in the future.

29
References
Alesina, Alberto and Nicola Fuchs-Schuendeln (2007): Good-Bye Lenin (or Not?): The Effect of Communism of People’s Preferences. American Economic Review, 97, 1507-1528.
Andersson Martin and Sijerdan Koster (2011) Sources of persistence in regional start-up rates—Evidence from Sweden. Journal of Economic Geography, 11, 179–201.
Audretsch, David B., Max Keilbach and Erik Lehmann (2006): Entrepreneurship and Economic Growth. Oxford: Oxford University Press.
Audretsch, David B. (2007): The Entrepreneurial Society. Oxford: Oxford University Press.
Audretsch, David B, Isabel Grilo and Roy Thurik (2011): Globalization, Entrepreneurship and the Region. In Michael Fritsch (ed.), Handbook of Research on Entrepreneurship and Regional Development, Cheltenham: Edward Elgar, 11-32.
Baumol, William J. (1990): Entrepreneurship: Productive, Unproductive and Destructive. Journal of Political Economy, 98, 893-921.
Bergmann, Heiko and Rolf Sternberg (2007): The Changing Face of Entrepreneurship in Germany. Small Business Economics, 28, 205-221.
Block, Joern H., Lennart Hoogerheide and Roy Thurik (2011): Education and entrepreneurial choice: An instrumental variables analysis. International Small Business Journal, 31(1), 23-33.
Bögenhold, Dieter and Uwe Fachinger (2007): Micro-firms and the margins of entrepreneurship: The restructuring of the labour market. The International Journal of Entrepreneurship and Innovation, 8, 281-292.
Bosma, Niels, Mirjam van Praag, Roy Thurik and Gerrit de Wit (2004): The value of human and social capital investments for the business performance of start-ups. Small Business Economics, 227-236.
Bosma, Niels, Sander Wennekers and José Ernesto Amorós (2012): Global Entrepreneurship Monitor - 2011 Extended Report. Babson College.
Brezinski, Horst (1987): The second economy in the GDR—Pragmatism is gaining ground. Studies in Comparative Communism, 20, 85–101.
Brixy, Udo, Rolf Sternberg and Arne Vorderwülbecke (2012): Global Entrepreneurship Monitor – Länderbericht Deutschland 2011 (Global Entrepreneurhsip Monitor – Country Report Germany 2011). Hanover and Nuremberg.
Caliendo, Marco, Frank Fossen and Alexander Kritikos (2009): Risk Attitudes of Nascent Entrepreneurs. Small Business Economics, 32, 153-167.
Caliendo, Marco, Frank M. Fossen and Alexander S. Kritikos (2014a): Personality Characteristics and the Decisions to Become and Stay Self-Employed. Small Business Economics, 42, 787–814.

30
Caliendo, Marco, Frank Fossen, Alexander Kritikos and Miriam Wetter (2014b):
The Gender Gap in Entrepreneurship: Not just a Matter of Personality. CESifo Economic Studies, published online: doi:10.1093/cesifo/ifu023.
Caliendo, Marco and Alexander Kritikos (2010): Start-ups by the Unemployed: Characteristics, Survival and Direct Employment Effects. Small Business Economics, 35, 71-92.
Caliendo, Marco and Steffen Künn (Forthcoming): Getting Back into the Labor Market: The Effects of Start-Up Subsidies for Unemployed Females. Journal of Population Economics.
Davidsson, Per and Benson L. Honig (2003): The role of social and human capital among nascent entrepreneurs. Journal of Business Venturing, 18 (3), 301-331.
Delmer, Frederic and Per Davidsson (2000): Where do they come from? Prevalence and characteristics of nascent entrepreneurs. Entrepreneurship and Regional Development, 12, 1–23.
Dunn, Thomas.and Douglas Holtz-Eakin (2000): Financial capital, human capital, and the transition to self-employment: evidence from intergenerational links. Journal of Labor Economics, 18, 282–305.
Fairlie, Robert W. (1999): The Absence of the African-American Owned Business: An Analysis of the Dynamics of Self-Employment. Journal of Labor Economics 17, 80-108.
Fairlie, Robert W. (2005): An extension of the Blinder-Oaxaca decomposition technique to logit and probit models. Journal of Economic and Social Measurement, 30, 305-316.
Fairlie, Robert W. (2006): Entrepreneurship among disadvantaged groups: An analysis of the dynamics of self-employment by gender, race and education, Vol. 2. In S. C. Parker, Z.J. Acs, & D. R. Audretsch (Eds.), Handbook of entrepreneurship. Dordrecht: Kluwer Academic Publishers.
Fairlie, Robert W. and Alicia Robb (2009): Gender Differences in Business Performance: Evidence from the Characteristics of Business Owners Survey. Small Business Economics, 33, 375- 395.
Federal Statistical Office (Statistisches Bundesamt) (2012): Erwerbstätige im Inland nach Wirtschaftssektoren, https://www.destatis.de/DE/ZahlenFakten/Indikatoren/LangeReihen/Arbeitsmarkt/lrerw013.html (as of June 7 2012).
Fitzenberger, Bernd, Karsten Kohn, and Qingwei Wang (2011): The erosion of union membership in Germany: determinants, densities, decompositions. Journal of Population Economics, 24, 141-165.
Fossen, Frank (2011): Personal Bankruptcy Law, Wealth and Entrepreneurship: Theory and Evidence from the Introduction of a "Fresh Start". Bonn: IZA Discussion Paper No. 5459.
Fotopoulos, Georgious (2013): On the spatial stickiness of UK New firm formation rates. Journal of Economic Geography (forthcoming). DOI 10.1093/jeg/lbt011

31
Freytag, Andreas and Roy Thurik (2007): Entrepreneurship and its determinants
in a cross-country setting. Journal of Evolutionary Economics, 17, 117-131.
Fritsch, Michael (2013): New Business Formation and Regional Development—A Survey and Assessment of the Evidence. Foundations and Trends in Entrepreneurship, 9, 249–364.
Fritsch, Michael, Elisabeth Bublitz, Alina Sorgner and Michael Wyrwich (2014): How Much of a Socialist Legacy? The Re-emergence of Entrepreneurship in the East German Transformation to a Market Economy. Small Business Economics, 43, 427-446.
Fritsch, Michael, Alexander Kritikos and Alina Rusakova (2012): Who Starts a Business and Who is Self-Employed in Germany? Discussion Paper 1184, German Institut for Economic Research (DIW), Berlin.
Fritsch, Michael and Pamela Mueller (2007): The Persistence of Regional New Business Formation-Activity over Time – Assessing the Potential of Policy Promotion Programs. Journal of Evolutionary Economics, 17, 299-315.
Fritsch, Michael and Michael Wyrwich (2014): The Long Persistence of Regional Levels of Entrepreneurship: Germany 1925 to 2005. Regional Studies, 48, 955-973.
Georgellis, Y. and H. J. Wall (2005), “Gender Differences in Self-Employment”, International Review of Applied Economics, 19, 321–42.
Hinz, Thomas and Monika Jungbauer-Gans (1999): Starting a Business after Unemployment: Characteristics and Chances of Success. Entrepreneurship and Regional Development, 11, 317–333.
Hundt, Christian and Rolf Sternberg (2014): Explaining New Firm Creation in Europe from a Spatial and Time Perspective: A Multilevel analysis based upon data of individuals, regions and countries. Papers in Regional Science, published online: DOI:10.1111/pirs.12133.
Johnson, Simon and Gary Loveman (1995): Starting over in Eastern Europe - Entrepreneurship and Economic Renewal. Cambridge (MA) Harvard Business School Press.
Kawka, Rupert (2007): Regional Disparities in the GDR: Do They Still Matter? In: Sebastian Lentz Sebastian (ed.), German Annual of Spatial Research and Policy: Restructuring Eastern Germany. Berlin: Springer, 111-122.
Koellinger, Phillip; Maria, Minniti and Christian Schade (2013): Gender differences in entrepreneurial propensity. Oxford Bulletin of Economics and Statistics, 75, 213-234.
Lohmann, Henning and Silvia Luber (2004): Trends in Self‐Employment in Germany: Different Types, Different Developments? In Richard Arum and Walter Mueller (eds.): The Reemergence of Self‐Employment: A Comparative Study of Self‐Employment Dynamics and Social Inequality. Princeton (NJ): Princeton University Press), 36‐74.

32
Marlow, Susan and Janine Swail (2014): Gender, Risk and Finance: why can’t a
woman be more like a man? Entrepreneurship and Regional Development, 26, 80–96.
McMillan, John and Christopher Woodruff (2002): The Central Role of Entrepreneurs in Transition Economies. Journal of Economic Perspectives, 16, 153-170.
Oaxaca, Ronald L. and Michael R. Ransom (1994): On Discrimination and Decomposition of Wage Differentials. Journal of Econometrics, 61, 5-21.
Organisation for Economic Co-operationand Development OECD (2010): Factbook 2010 – Economic, Environmental and Social Statistics. Paris: OECD.
Parker, Simon C. (2009): The Economics of Entrepreneurship. Cambridge University Press.
Pickel, Andreas (1992): Radical Transitions: The Survival and Revival of Entrepreneurship in the GDR. Boulder: Westview Press.
Piore, Michael J. and Charles F. Sabel (1984): The Second Industrial Divide: Possibilities for Prosperity. New York: Basic Books.
Pistrui, David et al. (2000): Entrepreneurial Orientation and Family Forces in the New Germany: Similarities and Differences Between East and West German Entrepreneurs. Family Business Review, 13, 251-264.
Rosti, L. and F. Chelli (2005): Gender Discrimination, Entrepreneurial Talent and Self-Employment. Small Business Economics, 24, 131–42.
Smallbone, David and Friederike Welter (2001): The Distinctiveness of Entrepreneurship in Transition Economies. Small Business Economics, 16, 249–262.
Smallbone, David and Friederike Welter (2009): Entrepreneurship and Small Business Development in Post-Socialist Economies. Abingdon: Routledge.
Thurik, Roy, David B. Audretsch and Erik Stam (2013): The rise of the entrepreneurial economy and the future of dynamic capitalism. Technovation, 33, 302-310
Van Der Sluis, J., M. van Praag and W. Vijverberg (2008): Education and Entrepreneurship Selection and Performance: A Review of the Empirical Literature. Journal of Economic Surveys, 22, 795–841.
van Stel, André, Gerard Scholman and Sander Wennekers (2012): Solo self-employed versus employer entrepreneurs: prevalence, determinants and macro-economic impact. Zoetemeer: EIM Research Report No. H201212.
Verheul, Ingrid, Roy Thurik, Isabel and Peter van der Zwan (2012). Explaining preferences and actual involvement in self-employment: Gender and the entrepreneurial personality. Journal of Economic Psychology, 33, 325-341.
Welter, Friederike (2006): Women’s entrepreneurship in Germany: progress in a still traditional environment. In Candida G. Brush, Nancy M.

33
Carter,Elisabeth J. Gatewood, Patricia G. Greene and Myra M. Hart (eds): Growth-oriented Women Entrepreneurs and Their Businesses: A Global Research Perspective. Edward Elgar Publishing, Cheltenham, 128-153.
Welter, Friederike (2009): Policy delivery: challenges and opportunities for entrepreneurship and SME development. OECD Local Entrepreneurship Reviews—Strengthening Entrepreneurship and Economic Development in East Germany: Lessons from Local Approaches. OECD, Paris and Trento, 195–216.
Wennekers, Sander, Martin Carree, Andre van Stel and Roy Thurik (2010): The Relationship between Entrepreneurship and Economic Development: is it U-shaped? Foundations and Trends in Entrepreneurship, 6, 167-237.
Wyrwich, Michael (2013): Can socioeconomic heritage produce a lost generation with regard to entrepreneurship? Journal of Business Venturing, 88, 667-682.

34
Appendix
Table A1: Development of industrial structure of solo self-employed and self-employed with employees.
Industrial sector Solo self-employed Employers
1991 1996 2000 2004 2009 1991 1996 2000 2004 2009 Agriculture and forestry
305,124 220,689 213,814 188,918 163,503 109,600 110,038 105,966 100,201 111,094 22.06% 13.45% 11.61% 9.10% 6.94% 6.63% 6.23% 5.88% 5.64% 5.98%
Mining, manufacturing, energy and water supply
145,203 157,719 148,488 157,106 149,605 335,108 242,739 234,475 219,508 200,209 10.50% 9.61% 8.06% 7.57% 6.35% 20.26% 13.73% 13.02% 12.36% 10.77%
Construction 62,957 118,076 140,077 168,950 234,521 179,864 238,054 251,445 221,885 238,255 4.55% 7.20% 7.60% 8.14% 9.95% 10.88% 13.47% 13.96% 12.49% 12.82%
Trading and hospitality
327,013 382,612 395,871 404,638 383,092 485,186 555,571 528,199 502,148 501,128 23.64% 23.32% 21.49% 19.49% 16.26% 29.34% 31.43% 29.33% 28.26% 26.96%
Transport and communication
58,044 63,151 72,957 65,986 66,546 65,518 64,788 77,155 70,029 70,353 4.20% 3.85% 3.96% 3.18% 2.82% 3.96% 3.67% 4.28% 3.94% 3.78%
Credit and insurance
66,575 76,921 98,346 105,664 99,775 36,545 33,760 34,819 37,807 53,261 4.81% 4.69% 5.34% 5.09% 4.23% 2.21% 1.91% 1.93% 2.13% 2.86%
Renting, business and socialservices
418,167 621,863 772,575 984,354 1,254,201 441,964 522,578 568,960 625,070 682,207 30.23% 37.89% 41.94% 47.42% 53.23% 26.72% 29.57% 31.59% 35.18% 36.70%
Total 1,383,083 1,641,032 1,842,128 2,075,726 2,356,033 1,653,786 1,767,528 1,801,018 1,776,647 1,859,101
100% 100% 100% 100% 100% 100% 100% 100% 100% 100%
Notes: Own calculations on the basis of the German Micro-Census.
Table A2: Sample means and standard deviations of key variables

35
East and West Germany East Germany West Germany 1991 2009 1991 2009 1991 2009 Mean SD Mean SD Mean SD Mean SD Mean SD Mean SD Self-employment 0.081 0.273 0.11 0.313 0.05 0.219 0.112 0.316 0.091 0.288 0.109 0.312 Solo self-employment 0.039 0.193 0.064 0.245 0.024 0.154 0.072 0.258 0.043 0.204 0.062 0.241 Self-employment with employees 0.046 0.209 0.052 0.222 0.027 0.163 0.047 0.212 0.052 0.222 0.053 0.225 Age 38.332 12.352 41.873 12.416 37.87 11.746 41.925 12.221 38.476 12.532 41.86 12.464 Married 0.639 0.48 0.561 0.496 0.681 0.466 0.523 0.499 0.626 0.484 0.57 0.495 Female 0.421 0.494 0.465 0.498 0.464 0.499 0.479 0.5 0.408 0.491 0.461 0.498 German nationality 0.943 0.233 0.933 0.249 0.982 0.135 0.974 0.158 0.93 0.254 0.923 0.266 Service sector affiliation 0.548 0.498 0.612 0.487 0.53 0.499 0.623 0.485 0.554 0.497 0.609 0.488 Construction sector affiliation 0.072 0.259 0.066 0.247 0.086 0.281 0.09 0.286 0.068 0.252 0.06 0.237 Crafts occupation (deregulated in 2004) 0.023 0.149 0.037 0.19 0.023 0.151 0.035 0.184 0.023 0.149 0.038 0.192 Without educational degree 0.165 0.371 0.167 0.373 0.08 0.271 0.11 0.313 0.192 0.394 0.181 0.385 Vocational training 0.719 0.45 0.656 0.475 0.801 0.399 0.708 0.455 0.692 0.462 0.643 0.479 Tertiary education 0.117 0.321 0.177 0.381 0.119 0.324 0.182 0.386 0.116 0.32 0.175 0.38 East Germany 0.238 0.426 0.199 0.399 - - - - - - - -
Table A3: Determinants of self-employment—East and West Germany
East Germany West Germany 1991 2009 1991 and 2009 1991 2009 1991 and 2009 Age 0.00301*** 0.00708*** 0.00475*** 0.00344*** 0.00649*** 0.00522*** (0.000478) (0.000643) (0.000358) (0.000266) (0.000272) (0.000188) Age squared -2.66e-05*** -5.59e-05*** -3.51e-05*** -1.72e-06 -3.47e-05*** -2.07e-05*** (5.98e-06) (7.45e-06) (4.30e-06) (3.07e-06) (3.02e-06) (2.12e-06) Married (1=yes; 0=no) 0.00188 -0.00293 -0.00968*** 0.00622*** -0.000108 0.00130 (0.00158) (0.00229) (0.00130) (0.00129) (0.00114) (0.000848) Female (1=yes; 0=no) -0.0367*** -0.0596*** -0.0450*** -0.0456*** -0.0626*** -0.0548*** (0.00142) (0.00219) (0.00123) (0.00108) (0.00108) (0.000758) German (1=yes; 0=no) -0.0115** -0.0468*** -0.0396*** 0.0128*** -0.0124*** -0.00283*

36
(0.00559) (0.00768) (0.00501) (0.00207) (0.00216) (0.00154) Without vocational qualification Reference Vocational training (1=yes; 0=no) 0.0183*** 0.0125*** 0.0150*** 0.0194*** 0.0246*** 0.0210*** (0.00237) (0.00415) (0.00217) (0.00141) (0.00161) (0.00108) Tertiary education (1=yes; 0=no) 0.0431*** 0.0963*** 0.0713*** 0.0460*** 0.0816*** 0.0648*** (0.00636) (0.00746) (0.00475) (0.00281) (0.00299) (0.00204) Service sector affiliation (1=yes; 0=no) 0.0414*** 0.102*** 0.0692*** 0.0299*** 0.0812*** 0.0554*** (0.00159) (0.00247) (0.00142) (0.00111) (0.00111) (0.000783) Construction sector affiliation (1=yes; 0=no) 0.0291*** 0.234*** 0.118*** 0.0220*** 0.169*** 0.0824*** (0.00383) (0.00990) (0.00492) (0.00244) (0.00460) (0.00245) Crafts occupation, deregulated in 2004 (1=yes; 0=no) 0.0528*** 0.0124** 0.0356*** 0.0423*** 0.0107*** 0.0264*** (0.00748) (0.00604) (0.00464) (0.00435) (0.00296) (0.00250) Dummies for Federal States Yes*** Yes*** Yes*** Yes*** Yes*** Yes*** Number of observations 75,407 63,172 138,579 230,797 253,514 484,311 McFadden Pseudo R2 0.0678 0.105 0.0946 0.0787 0.104 0.0888 Log Likelihood -13,879 -19,870 -34,444 -64,769 -78,316 -143,928 Wald Chi2 2,142*** 4,067*** 6,721*** 11,370*** 16,402*** 26,828***
Notes: marginal effects after logit regression with robust standard errors (in parentheses). ***: statistically significant at the 1 percent level; **: statistically significant at the 5 percent level; *: statistically significant at the 10 percent level.

37
Table A4: Determinants of self-employment—solo entrepreneurs and employers
Solo self-employed Employers 1991 2009 1991 and 2009 1991 2009 1991 and 2009 Age 0.000684*** 0.00259*** 0.00191*** 0.00181*** 0.00366*** 0.00275*** (0.000151) (0.000191) (0.000121) (0.000165) (0.000170) (0.000116) Age squared 6.97e-06*** -8.98e-06*** -2.59e-06* -4.79e-06** -2.47e-05*** -1.50e-05*** (1.77e-06) (2.16e-06) (1.40e-06) (1.92e-06) (1.89e-06) (1.33e-06) Married (1=yes; 0=no) -0.00413*** -0.0113*** -0.0113*** 0.00921*** 0.00913*** 0.00877*** (0.000774) (0.000801) (0.000559) (0.000692) (0.000628) (0.000461) Female (1=yes; 0=no) -0.0164*** -0.0274*** -0.0216*** -0.0265*** -0.0364*** -0.0323*** (0.000632) (0.000750) (0.000494) (0.000620) (0.000653) (0.000447) German (1=yes; 0=no) 0.00424*** -0.0158*** -0.00881*** 0.00446*** -0.000856 0.00125 (0.00127) (0.00170) (0.00114) (0.00121) (0.00119) (0.000862) Without vocational qualification Reference Vocational training (1=yes; 0=no) -0.000460 0.0107*** 0.00421*** 0.0189*** 0.0131*** 0.0163*** (0.000853) (0.00115) (0.000726) (0.000791) (0.000943) (0.000619) Tertiary education (1=yes; 0=no) 0.00465*** 0.0487*** 0.0280*** 0.0466*** 0.0434*** 0.0454*** (0.00126) (0.00219) (0.00128) (0.00251) (0.00211) (0.00162) Service sector affiliation (1=yes; 0=no) 0.0132*** 0.0541*** 0.0327*** 0.0183*** 0.0335*** 0.0260*** (0.000646) (0.000826) (0.000528) (0.000634) (0.000629) (0.000445) Construction sector affiliation (1=yes; 0=no) -0.00827*** 0.114*** 0.0373*** 0.0293*** 0.0865*** 0.0532*** (0.00111) (0.00386) (0.00167) (0.00168) (0.00300) (0.00158) Crafts occupation, deregulated in 2004 (1=yes; 0=no) 0.0307*** 0.0126*** 0.0231*** 0.0160*** -0.000400 0.00714*** (0.00296) (0.00219) (0.00180) (0.00241) (0.00158) (0.00137) Dummies for Federal States Yes*** Yes*** Yes*** Yes*** Yes*** Yes*** Number of observations 292,686 301,186 593,872 295,000 297,400 592,400 McFadden Pseudo R2 0.0565 0.0819 0.0665 0.0994 0.117 0.105 Log Likelihood -44,856 -65,790 -112,232 -49,426 -53,754 -103,624 Wald Chi2 6,077*** 11,068*** 16,795*** 9,906*** 12,751*** 21,681***
Notes: marginal effects after logit regression with robust standard errors (in parentheses). ***: statistically significant at the 1 percent level; **: statistically significant at the 5 percent level; *: statistically significant at the 10 percent level.