Embed Size (px)
Citation preview

Public Choice (2005) 123: 275–319DOI: 10.1007/s11127-005-7164-3 C© Springer 2005
What does the European Union do?
ALBERTO ALESINA1, IGNAZIO ANGELONI2 & LUDGERSCHUKNECHT2,∗1Harvard University, NBER and CEPR, Cambridge, Massachussets, U.S.A.; 2European Central Bank,Frankfurt am Main, Germany(∗Author for correspondence: E-mail: [email protected])
Accepted 9 February 2004
Abstract. The goal of this paper is to evaluate the attribution of policy prerogatives to EuropeanUnion level institutions and compare them to the implications of normative policy models andto the preferences of European citizens. For this purpose we construct a set of indicators tomeasure the policy-making intensity of the European Union (European Council, Parliament,Commission, Court of Justice, etc.). We confirm that the extent and the intensity of policy-making by the EU have increased sharply over the last 30 years, but at different speeds, and indifferent degrees, across policy domains. In recent years the areas that have expanded most arequite remote from the EEC’s original mission of establishing a free market zone with commonexternal trade policy. On the contrary some policy domains that would normally be attributed tothe highest level of government remain at national level. We argue that the resulting allocationof prerogatives between the EU and member countries is partly inconsistent with normativecriteria concerning the assignment of policies at different government levels, as laid out in thetheoretical literature.
Introduction
A major rethinking of Europe’s institutions and policies is underway. Follow-ing the Laeken declaration by the European Council (2001), a Convention wasassembled to draft a new Constitutional Treaty. This draft is now undergoingexamination by the member states.
This constitutional process is timely. The introduction of a single currencyand the delegation of monetary powers to the European Central Bank (ECB),reforms of high substantive and symbolic value, are seen by many as stepstowards fuller political integration. At the same time, while the prospect offull integration in the EU is fuelling enthusiasm among several new unionmember, the integration process seems to be losing support within severalmember countries. In fact, large portions of European citizens seem reluctantto accept further centralization in the European governance, or at least demandthat the rationale for centralization be made more explicit and transparent. Theexisting EU charters fall significantly short of providing a method—let alone adetailed road map—for assigning policy prerogatives amongst supranational,national and local policy authorities in the continent. One of the main purposesof a European Constitution is to clarify this critical issue of attribution ofprerogatives.

276
The goal of this paper is to provide a coherent framework and examine theevidence relevant to the debate on the question of which level of governmentshould do what. We begin by briefly reviewing the theoretical arguments onhow to think about what a union of independent countries should do, followingrecent contributions by Alesina and Wacziarg (1999) and Alesina, Angeloniand Etro (2001a,b). These papers focus on a trade-off between the benefits ofcentralization, arising from economies of scale or externalities, and the costsof harmonizing policies in light of the increased heterogeneity of individualpreferences in a union which is growing in size.1 The normative prediction ofthese papers is that policies where economies of scale and/or externalities arepredominant should be allocated at the union level, or even at the world level.Instead, policy areas where heterogeneity of preferences are high relative toexternalities should be allocated to a national or sub-national level.
These ideas are related to the vast literature on fiscal federalism, recentlyreviewed by Oates (1999). However, when thinking about federations2 ofcountries like the European Union, several important differences come tomind. One is that the literature on fiscal federalism heavily emphasizes in-dividual mobility across jurisdictions, a phenomenon which applies only toa limited extent to the European Union. The second is that the size of fiscaltransfers within EU member countries is much larger than that among coun-tries. The third is that heterogeneity of preferences across countries is likelyto be much larger than within a single country.
Building upon these ideas, we shift here the focus from the normative-theoretical to the empirical side, asking the question: “what does the EUactually do?” And, more specifically, does the allocation of policy preroga-tives between the EU and national governments satisfy the normative criteriadescribed above? In order to answer these questions, we first construct a set ofdetailed numerical indicators to measure the policy involvement of the EU inan encompassing set of policy domains. We find that the range of prerogativesattributed to the EU has expanded considerably in recent decades, and it hasmoved far away from the EEC’s original mandate, especially in the 1990s.
We then ask the question of whether the EU prerogatives have expanded inways consistent with the normative criteria we described above. Based on ourown motivated priors and on the results of a public opinion survey, we suggestthat important deviations of the EU’s action from those criteria have occurred.A prominent example concerns the area of social protection. Much reluctanceto further European integration amongst, for instance, the British public stemsfrom the fear of having to adopt “continental style” social welfare policies.Our results suggest that this is indeed an area in which the EU involvement isalready over expanded. Another area of over-expansion is sectoral policies,notably in agriculture.
In contrast, there are areas in which EU involvement is probably too limited.For instance, one would think that defense and foreign relations is a policy

277
area typically allocated to the highest level of government. Instead, the EUhas a limited (although growing) role in these areas. Environmental protectionis another area of EU involvement that may usefully be developed in areaswhere sopranational solutions are needed. International crime and migrationrelated policies might also warrant a stronger role of the EU.
The paper is organized as follows. In the following two sections we defineour framework of analysis and lay out the list of relevant policy domains. In thefourth section, we describe briefly the instruments and processes used by theEU to enact its policies. In the subsequent section, we introduce our empiricalanalysis with a brief excursus of how the EU involvement in these domainshas evolved in the last 30 years. The core of the results, regarding the role theEU presently plays in the different domains of policies, is presented in thesection on “EU presence across policy domains”. Next, we present our overallassessment and conclude with some caveats and directions for further research.
A Framework for Assessing EU Policies
Theory
We think of “international unions”, like the EU, as groups of countries whichagree to pool certain public goods and policies and delegate the choice andadministration of these to super national governing bodies. “Goods” includetraditional public goods like defense or infrastructures and “policies” includea legal or regulatory framework, a single currency, etc.
A fundamental and broad trade-off should dictate the choice of whichpublic goods and policies to centralize at the union level or left to nationalgovernments. On the one hand we have the benefits of economies of scale andinternalization of externalities, on the other we have the costs of heterogeneityof preferences, which grow as the union becomes larger and more diverse.The implication is that the EU—like any international union—should focuson policy areas where economies of scale are large, and internalizing exter-nalities is important, and delegate to national or even sub-national levels ofgovernment the policy prerogatives where heterogeneity of preferences is pre-dominant relative to the benefit of scale. Alesina and Wacziarg (1999) and,especially Alesina, Angeloni and Etro (2001a,b) formally model these andrelated ideas.
An example may help. Consider the adoption of a single currency, that isthe decision to centralize monetary policy. The benefits of scale concern thetrade benefits of sharing a single monetary unit of account. Also, a single cur-rency eliminates negative externalities arising from competitive devaluations.Certain countries may also benefit from importing monetary policy credibilityfrom abroad. The heterogeneity costs arise because different countries mayhave different objectives for monetary policy, or even if they have the sameobjective, their economies may be affected by partially uncorrelated shocks,

278
so that these business cycles may not be perfectly synchronized. Thus, the lossof independent monetary policy conducted at the national level implies costs.The choice of whether to centralize monetary policy or not depends on theevaluation of these costs and benefits. In fact, much of the pre-Euro discussionabout whether Europe was or not an “optimum currency area” revolved aroundthe question of whether the scale benefits of the single currency (lower trans-action costs; more transparent relative prices) outweighed the costs inducedby different forms of diversity (asymmetric shocks, preferences, transmissionmechanisms, etc.).
The same intuition applies to other policy domains and public goods, andhas implication for the size of the union. If the union centralizes too manyprerogatives, several potential member countries will not join because theunion’s centralized policies are too many and too far from their own prefer-ences. On the other hand if the union centralizes too little, it does not fullybenefit from economies of scale and from the internalization of externalities,which motivate the creation of the union in the first place. Hence, for any givendistribution of preferences by potential union members over a diverse range ofpolicies, in equilibrium one should observe either small unions that centralizemany prerogatives, or large unions in which few prerogatives are delegatedabove national governments. This implies, also, that the enlargement of theunion and the deepening of co-ordination of policies are contradictory if thenew members and the incumbents are heterogeneous.
How the union would choose along the trade-off between benefits of scaleand heterogeneity costs depends on the voting rules within the union. This iswhy the discussion about the EU competencies is linked to that of its decision-making institutions. Alesina, Angeloni and Etro (2001a) discuss the possibilityof a centralization bias in the union. If the prerogatives of the union are notdefined ex ante by constitutional design, the union may have an incentive toincrease centralization ex post. Anticipating this tendency, potential memberswill stay out to begin with, leading to unions that are too small. A union whereprerogatives are fixed ex ante leads to superior outcomes.
A related question concerns the issue of supermajority voting within theunion. The lower the size of the majority needed to centralize a policy pre-rogative, the larger the number of policies that would be centralized. Thisis why those who favor more EU integration tend to prefer simple majorityvoting over unanimity requirements or supermajorities. (See Aghion, Alesinaand Trebbi (2002) for a recent analysis of supermajority rules in a generalcontext.)
From theory to empirics
The previous discussion will guide in our empirical investigation concerningthe question of which policy areas should the European Union concentrate

279
upon. Even with the guidance provided by the basic trade-off highlightedabove, answering this question is difficult. In fact, in practice governmentfunctions do not neatly line up on a scale from high to low economy ofscale, high to low externality, high to low heterogeneity of preferences. Onlyin some cases is the judgement rather obvious; examples are internationaltrade, with large externalities, and educational choices in local schools, whereheterogeneity of preferences are critical. In many other cases the choice isless clear cut. This is why, in practice, the allocation problem is complex.
Our goal in the rest of the paper is to evaluate how the attribution of re-sponsibilities to EU level versus national level of government relates to thenormative criteria described above. In order to do that, one has to analyzewhat the EU does, not an easy task in itself. One should be able to determinethe policy prerogatives of the EU institutions—and as a complement thosebelonging to other government levels—directly from the EU Treaties. Con-stitutional charters are intended to lay out the criteria for the allocation ofpower, their limits, checks and balances, etc. However, the EU Treaties do notprovide an exhaustive guide on whether, and on the basis of what principles,policy powers fall within or outside the realm of EU powers. Their complex-ity and generality make it difficult for anybody, even somebody informed, tograsp the degree of effective presence of EU institutions in the relevant areasof policy-making.
If one takes an extensive interpretation of the Treaties, the EU seems tohave some say in almost all policy areas (see Alesina & Wacziarg (1999)).This is, by itself, a problem, because it potentially opens the door for an ex-cessive attribution of responsibilities in too many areas and it also weakensaccountability. However, the mention of a given policy chapter in the Treatiesdoes not mean that the EU effectively exercises policy-making power in thatarea, and conversely the EU takes concrete action in areas only vaguely men-tioned in the Treaties. In short: whether the EU is active in a given field andhow important such presence is, is a question that cannot be answered byconsulting the Treaties alone. Other information is necessary.
Unfortunately, the available literature is also of little help. Despite exten-sive exploration by political scientists,3 there have been virtually no attemptsto rigorously weigh and compare the involvement of the EU in its key policydomains.4 Using statistical information provided mainly through EU on-lineservices, we derive simple quantitative measures of the EU involvement acrosspolicy areas.5 We accomplish this using a very simple method: we count thenumber of legal, judiciary and other, non-binding, acts (“policy acts”) ema-nating from the EU, classified across broadly homogeneous policy fields, andassembling the results from various sources into summary indicators.
Our approach has advantages and drawbacks. The key advantages of simplecounting are transparency and objectivity. The disadvantage is that individualpolicy acts can be more or less influential. If these differences are randomly
280
distributed across policy chapters, however, one can rely on the law of largenumbers to mitigate the problem; the sample sizes are indeed very large, aswe shall see.
Domains of EU Policy-Making
The first step in our empirical analysis is to classify the policy domains intocategories. Several requirements must be borne in mind. First, each domainshould be relatively homogeneous. Second, it should be easily interpretablein terms of the theoretical concepts we have discussed, namely, in terms ofthe benefits arising from externalities and economies of scale and the prefer-ence asymmetries that the European citizens are likely to have. Third, theclassification should be consistent with the existing statistical sources, tomake data collection feasible. Finally, it should be transparent, and allow easyreplication.
These requirements are to some extent contradictory. Our choice was touse a very limited number of areas (nine) to start with, and break down subse-quently three of them in sub-areas, where we thought that useful insights couldbe gained from further disaggregation. Our classification covers all main EUpolicy areas, excluding internal administration and all related administrativeacts.6
Definition of policy domains and discussion
This sub-section presents the nine areas, including sub-areas for three of them,and provides arguments for our choice of this classification.7
International trade. The most important area of EU policy-making, andthe closest to the original raison d’etre of the European Communities, is thecreation of a common market with a common external trade policy. Here wedistinguish between external trade provisions (covered under this heading)and the policies aimed at the establishment of the common internal market(grouped in the following heading). External trade provisions cover both theinternational agreements between the EU and third countries, and the provi-sions aimed at establishing uniform trade and tariff policies with non-membercountries.
Economists tend to agree that there are sizeable benefits from free trade atthe global level. This implies a high degree of policy harmonization, again atthe global level, directed towards the removal of trade barriers. A free tradearea, with common external trade policy, is obviously a second best solution. Itis welfare improving only if the common external policies are also consistentwith free trade principles. With this important proviso, economic argumentsspeak in favor of a clear EU-wide assignment of trade and common marketlegislation.

281
Common market. The EU internal market chapter includes a variety of pro-visions promoting the free internal movement of goods, services (includingfinancial services), capital and people. It includes all acts aimed at the harmo-nization and mutual acceptance of national provisions, in a way to ensure thatobstacles to such movements are removed (so-called “approximation laws”).From a normative viewpoint, however, the exact role of this type of legisla-tion within the context of the Single Market is ambiguous. On the one side,a certain degree of approximation of domestic laws is necessary to guaranteea level playing field for intra-area trade. On the other side excessive harmo-nization may at times become an infringement, rather than a support, of freearea-wide competition.
In the areas of banking and financial market, including the related super-visory activities, the arguments for or against centralization are somewhatmixed. On the one hand, the drive towards integration of financial markets isa clear and powerful stimulus to supranational ruling. The economies of scaleinherent in gathering supervisory information and the international transmis-sion of financial fragility also speak in favor of centralization; at least up to thegeographical level at which financial markets are integrated and significantspillovers exist. On the other hand, however, considering that fiscal and taxpolicies are decentralized—as they are at present in the EU, and that the costsof bank rescues and of lending-of-last-resort are ultimately fiscal, allocationof banking and supervisory policies at a lower geographical level can also bejustified.8
Money and fiscal. This broad area includes policies in the monetary,macroeconomics, exchanges rate, tax and fiscal spheres. It excludes finan-cial services and capital markets legislation to the extent that this falls intothe common market chapter. Though related, money and fiscal matters aredistinct in a number of respects, in particular in the arguments that have beenused in favor, or against, EU centralization or harmonization. Hence we havedecided to consider also a breakdown of this category into money and macropolicies (including budgets) on the one hand, and taxation on the other. Thisfollows the Treaty logic of seeing the budgetary constraints and co-ordinationmechanisms of the Maastricht Treaty and the Stability and Growth Pact asan element in support of the single currency. Data limitations, unfortunately,prevented us from sub-dividing the money and macro policy chapter further.
Though not being one of the tasks addressed by the EEC founding fathersfrom the start, monetary integration was always in the background and wassoon recognized as complement of the Single Market.9 With the creation ofthe ECB (1998) and the introduction of the Euro (1999), this turned out tobe one of the most active and successful policy chapters in the history ofthe EU. On the benefits and costs from monetary unification, the prescrip-tions from economic theory are rather mixed. While the theory of OptimumCurrency Areas provides a clear conceptual framework for the international

282
allocation of monetary policy responsibilities,10 no clear-cut theoretical con-clusions emerge, as the judgement is inherently empirical. The empiricalevidence on optimal currency areas is often controversial, but in the case ofthe Euro-area the balance tends to tilt in favor.11
Fiscal policy is another area where the responsibility of the EU versusnational governments is hotly debated. Inroads into national responsibilityhave been made by constraining budget balances and debt and by co-ordinatingfiscal surveillance, in the Maastricht Treaty and the Stability and Growth Pact.However, despite these constraints intended to safeguard monetary stability,fiscal and tax policies remain largely national. Beyond that, the EU has avaguely specified role in the co-ordination of taxation and some very limitedown spending responsibilities (see data below). Here again, the judgementon the economics of further EU involvement is mixed, though largely notcompelling.12
Education, research and culture. This policy chapter focuses on youth poli-cies, research, technology, preservation of the cultural heritage, etc. Thoughnot included in the original EEC Treaty, this area developed considerablyin subsequent times. On economic grounds, the gains from international co-ordination are vague at best. On the one side, the externality element in thispolicy domain could potentially be large. There is also a general interest in thespreading and communication of knowledge across frontiers, but this can sim-ply be achieved with free circulation of individuals and ideas. It is also likelyto be an area in which local preferences and backgrounds have a predominantweight.
Environment. This is an area where international—indeed global—externalities are important: pollution of the seas and global warming are justtwo obvious examples. An involvement of the EU as regards EU-wide exter-nalities seems therefore desirable. There may also be fixed costs (e.g. research)and economies of scale in the setting of environmental policies. However,much environmental effects are local or regional (garbage, river pollution).The preservation of territory and the enforcement of environmental policiesare likely to have also a strong “local” component (local communities are thefirst, though ultimately not the only, to suffer from a deterioration of environ-mental conditions).
Business relations (sectoral). We divide the area of Business Relations intwo compartments. The first—Sectoral—is very well defined and includesall policies designed to affect the behavior and performance of the economicproducing sectors. In the subsequent analysis, we further break down this intothree sub-areas, Agriculture (and fishing), Industry (with energy) and Trans-port. Agricultural policy is one of the oldest and most active policy chapterssince the origins of the EEC, though its justifications on efficiency groundshave long and convincingly been challenged. Other sectoral policies couldprovide public goods, for example, if they support an EU wide transportation

283
and communication network. However, sectoral policies do not necessarilyprovide such public goods. They could even be used to delay the completionof the internal market (as might be feared, for example, in energy and postalservices). All together we are skeptical on the need for such sectoral policiesat the EU level.
Business relations (non-sectoral). This broad area encompasses undertak-ing laws, market competition and state subsidies. Antitrust has a growingglobal dimension, which reflects market globalization. The importance ofmaintaining competition at the EU level to promote the functioning of theinternal market is reflected in the EU’s mandate in this area. However, the factthat only large mergers/acquisitions are under EU scrutiny takes into accountthat only such mergers/acquisitions can have implications for competition inthe EU as a whole and should hence be dealt with at that level. As regardssubsidies and state aid, the logic of EU involvement is similar because suchgovernment policies could undermine the level playing field in the commonmarket. On this basis, EU involvement in these domains seems economicallysensible.
International relations. This includes foreign policy, defense, and foreignaid. There are significant economies of scale and externalities to be exploitedin foreign policy and defense, provided geo-political interests are similar.13
This leaves an ambiguous picture about the desirability of EU involvement,but on the whole there seems to be little doubt that some significant EUinvolvement in foreign policy and defense issues makes sense on efficiencygrounds.
Citizen and social protection. This encompasses home affairs, justice, con-sumer protection, civil rights, health, social protection, labor relations, etc. Italso includes the important Social Cohesion chapter, with the attached social,structural and regional funds.
Here again we decided to distinguish three sub-chapters, to betterdifferentiate across policy issues. The first refers to justisce and migration.There are important supranational elements in these policies, which followfrom the goal of ensuring a high degree of mobility of citizen across theunion. Mobility suggests the need for a common migration as well as crimeenforcement policies, at least as far as globally relevant types of crime isconcerned. Concerning “local” crime prevention and enforcement, as foreducation and culture, important local/national elements are probably present.A second sub-category includes health, social welfare and employment.Given the high standards of social protection existing in all EU countries,and the well-known differences in preferences, a strong EU involvementin these areas is highly questionable. Our third sub-category is structuraland regional funds. There may be important reasons justifying EU activityin the area of redistribution, though from an efficiency perspective theyare much harder to justify. Heterogeneity of preferences in redistributive

284
policies is likely to be very large, and highly correlated with per capitaincome.
Preferences on policy devolution
We have summarized the considerations just expressed in a set of “judge-ments” concerning the desirable allocation of policy responsibilities (Table 1).These judgements are tentative and, reflecting our own best understanding ofthe underlying trade-offs, subjective. In the section on “assessment” we willuse them as a working assumption to guide our reading of the empirical ev-idence concerning the actual involvement of the EU in the policy domains.Before getting there, however, it is interesting to see how our judgementscompare with the ones of the European citizens.
A broad ranging survey of the Europeans’ opinions concerning the as-signment of policies in the Union is beyond the scope of this paper. Hence,we have only looked at the most readily available information. We have usedEurobarometer (Spring 2001 issue), a publication of the EU Commission con-taining the results of an opinion poll, focused on the role and the policies of theEuropean Union. Eurobarometer is a public opinion survey conducted, twicea year, face-to-face with a representative sample of individuals in each mem-ber state. An identical set of questions is asked 1000 people in each memberstate.14 The main drawback of this opinion survey is its very limited samplesize. A key advantage from our viewpoint is the fact that some of the ques-tions focus exactly on the set of issues we are interested in. We concentratedour attention on section 5.1 of Eurobarometer, in which survey respondentsare asked whether, for each of 25 policy areas, they “think that the decisionsshould be made by the [own] government, or made jointly with the Euro-pean Union”. Answers are published in percent (N = decisions should benational; S = decisions should be shared; U = uncertain; N + S +U = 100).
Table 1. The desirable allocation of policy responsibilities
Policy domains Externalities Pref. asymmetry Devolution
1 International trade High Low EU/Global
2 Common market High Low EU/Global
3 Money and fiscal Med./High ? National/EU
4 Education, research and culture Low High Local/National
5 Environment Med./High High National/EU/Global
6 Business relations (Sectoral) Low High National
7 Business relations (Non-sectoral) High ? EU/Global
8 International relations Med./High Low National/EU
9 Citizen and social protection Mixed High Local/National

285
We have grouped the 25 areas into broader areas consistent with our earlierclassification (see footnotes to Table 2 for details).
Unfortunately, not all our previously defined policy areas are included inthe survey, so we have no information to report on some areas. Among the25 policy areas considered, 15 refer to the broad areas that we have calledCitizen and social protection; hence, we have in Table 2 provided a furtherbreakdown of this broad area in five sub-areas: 9a (Migration); 9b (Crime-local); 9c (Crime-global); 9d (Health and social welfare); 9e (Unemployment,social exclusion and regional aid).15 Each cell of Table 2 reports, for eachpolicy area, the (integer of the) balance of the answers calculated as fol-lows: [(S − N )(1 − U /100)]. We multiply (S − N ) by (1 − U /100) so thatthe balance receives a lower weight if the share of uncertain respondents islarge. Hence, the larger the number in each cell of Table 2 is, the stronger the(percent) number of people that have expressed a preference for a “Shared”responsibility, weighted for the undecided. The maximum (minimum) theo-retical entry in each cell is 100 (−100), meaning a unanimous preference forShared (National).
In interpreting these data, two caveats are in order. First, the exact meaningof “Shared” is unclear; different interpretations by respondents in differentcountries cannot be ruled out. Second, the responses to certain questions (forexample: regional aid) could be biased in certain countries by the presumptionthat transferring policy responsibility to the EU may result in net benefits forthose countries. In other words, the response to the questionnaire may reflectthe perception of personal or country gains rather than a fair judgement aboutthe optimality of allocative criteria.
Nonetheless, our own conjectures concerning the proper allocation of pol-icy areas are broadly consistent with the survey. The (unweighted) mean acrosscountries reveals that Money and fiscal,16 Environment and International re-lations and foreign aid receive a positive value (Shared), whereas Education,research and culture and Agriculture have a negative one (National). Verydiverse opinions are expressed on the five sub-areas belonging to Citizen andsocial protection: Crime-local and Health, Employment and Social Protectionare on average viewed to be “National”, whereas Migration, Crime-global andRegional aid are more frequently judged to be areas of “Shared” responsibility.However, as noted earlier, we suspect that on some of the particular questionsthe data reported by Eurobarometer may be biased. Also interesting is the factthat there are significant differences across countries and domains. Denmark,Portugal, the United Kingdom and the Scandinavian countries seem the mostEU sceptic while Italy, Belgium and the Netherlands are most supportive ofa strong EU role.
In the last column of Table 2 we report the results of a different aggregationof the country preferences. The column shows how many votes a proposal tocentralize a policy domain would (hypothetically) get if member governments

286

287
were to vote in the European Council according to the outcome of Euro-barometer. In other words, we assume that Council members of countrieswith a majority of voters in favor of a strong EU role on certain issues (apositive number in their respective cells of Table 2) would vote in favor. Anegative number would imply a negative vote by Council members. We thenaggregate the country preferences using the current allocation of votes in theCouncil.
The figures in the last column of Table 2 suggest that a shared EU rolefinds a simple majority of Council votes (currently, Council votes total 87) inMoney and fiscal, Environment, International relations, and certain aspectsof Citizen and social protection. EU involvement would receive unanimoussupport in only two domains: the fight against organized crime (Crime-global)and Regional aid. Centralization in the other domains except Migration wouldget a qualified majority of Council votes (at least 62 out of 87). Policieson Education, research and culture, Agriculture, Crime-local and Health,employment and social protection would be voted to be undertaken at thenational level.
In summary, the evidence from the Eurobarometer shows that the pref-erences of European citizens regarding the allocation of functions betweenEurope and member countries is remarkably similar to our judgement basedon the predictions of theoretical models (a partial exception is Regional aid).17
We find this comforting.
Instruments and Processes of EU Policy
We now need to make a brief detour and discuss the instruments and processesused by the EU to formulate and to enact its policies, as some understandingof it is necessary to tackle the data analysis that follows. This section offers ashort “primer” on the nature of the legal instruments and the processes of EUpolicy-making.18
Treaties
The primary source of law and policy-making power in the EU is the Treaties.New treaties are negotiated at so-called Intergovernmental Conferences andneed to be ratified by all member governments. Together with their annexesand Protocols, the Treaties constitute the ultimate source of mandate andlegitimacy for all EU institutions and for all their legislative and judicialauthority. However, important initiatives can occasionally arise in the EUcontext that have no origin, or even mention, in the Treaties.19
More frequent are cases in which important policy chapters have only atenuous or very general basis in the letter of the Treaties (e.g., transport). Inother cases, explicit Treaty provision remains either inoperative or at least

288
hardly developed, perhaps for many years, until the conditions for concreteaction materialize.
Conversely, cases exist as well in which the letter of the Treaty has adirect and immediate application. For example, the Treaty-based goal of pricestability has become a cornerstone of the ECB’s monetary policy.20
Secondary legislation and non-binding acts
Secondary legislation comprises a broad and differentiated range of bindingand non-binding legal instruments. There are three principal categories ofbinding legal acts.
(1) Regulations contain general provisions, fully binding vis-a-vis all partiesin all member states. They are directly applicable without need for nationalimplementation.
(2) Directives are binding vis-a-vis all member states addressed. They specifythe results to be achieved but leave member states the choice of formand methods to implement them. They need not apply to all memberstates (although they usually do) and are rather general, often specifyingoutcomes that national measures are supposed to attain.
(3) Decisions are binding vis-a-vis all parties addressed. They may be ad-dressed to one, several or all parties or member states. They can be veryspecific, like administrative acts, or rather general.
In addition, the EU Commission issues a number of “softer” acts, or doc-uments, of non-binding nature. Occasionally, particularly when new policyinitiatives are envisaged, the Commission publishes White Papers to outlinetheir legislative strategies.21
Legislation in the EU is typically initiated and prepared by the Commis-sion, who can also sign legislative acts. Before the Maastricht Treaty, otherlegislative acts were signed by the Council alone. Pressures from the Euro-pean Parliament have resulted in the so-called co-decision procedure, wherethe Parliament also has to sign (and with its refusal can veto) certain acts. Sincethe Amsterdam Treaty, only agriculture, justice, home affairs, trade, fiscal har-monization and EMU issues are largely outside the control of the EuropeanParliament, although admittedly these are among the most important dossiers.
Enforcement via the Court of Justice
The EU Court of Justice22 has the double important mandate of interpretingEU law and to seek its application and enforcement. Hence, the existence ofCourt cases is both a sign of the EU role in policy-making and of the relevanceof EU legislation and Treaty provisions (or in other words, the absence ofCourt cases would be an indicator of a small role of the European Union in

289
that domain). Court cases can be initiated by governments and private agents,including staff of the EU agencies.
Contrary to Anglo-Saxon practice, judicial rulings do not have legal statusin the EU; but the influence of the Court in giving content to existing legislationand making it effective is considerable. Acting on the initiative of EU bodies,member states, or private parties, the Court rules using as a basis the entireEU legislation (Treaties, Directives, Regulations, etc.) and its deliberationshave a key influence on how such legislation is interpreted and applied. Theinfluence of the EU judiciary is enhanced decisively by the fact that Europeanlaw now “breaks” national law and European Court of Justice rulings “break”national Court decisions.
International agreements
The EU also negotiates international agreements of three types. Trade agree-ments including preferential agreements are based on the mandate on inter-national trade policy (e.g. WTO agreements). Trade and co-operation agree-ments include the granting of trade preferences and assistance mainly fordevelopment reasons. Finally association agreements (e.g. with Mediter-ranean countries) grant reciprocal rights and obligations typically beyondtrade.
The ECB
The responsibilities and prerogatives of the ECB in the sphere of monetarypolicy are, in comparison to other policy areas, very clearly defined in theTreaties and well documented in the literature.23 There is thus no need to gointo details here. From our viewpoint it should be noted, however, that mon-etary policy-making is conducted within a different institutional frameworkthan that of other policies. The Maastricht Treaty defined the main features ofEMU and its objective of price stability (Article 105). The Eurosystem, com-prising the ECB and national central banks adopting the Euro, determines andimplements monetary policies via the ECB Governing Council and ExecutiveBoard. The ECB decision-making bodies are independent in their task i.e. notsubject to influence or approval by other EU or national bodies.
The Expansion of EU Legislation, 1971–2000
We present some summary data on the expansion of EU policy activity inthe last 30 years in Tables 3–4. We have divided this period in six 5-yearsub-periods. For each of them, we show the number of legal acts (of varioussorts, including binding and non-binding), judiciary acts and internationalagreements that emanated from the EU over the period in the aggregate and
290
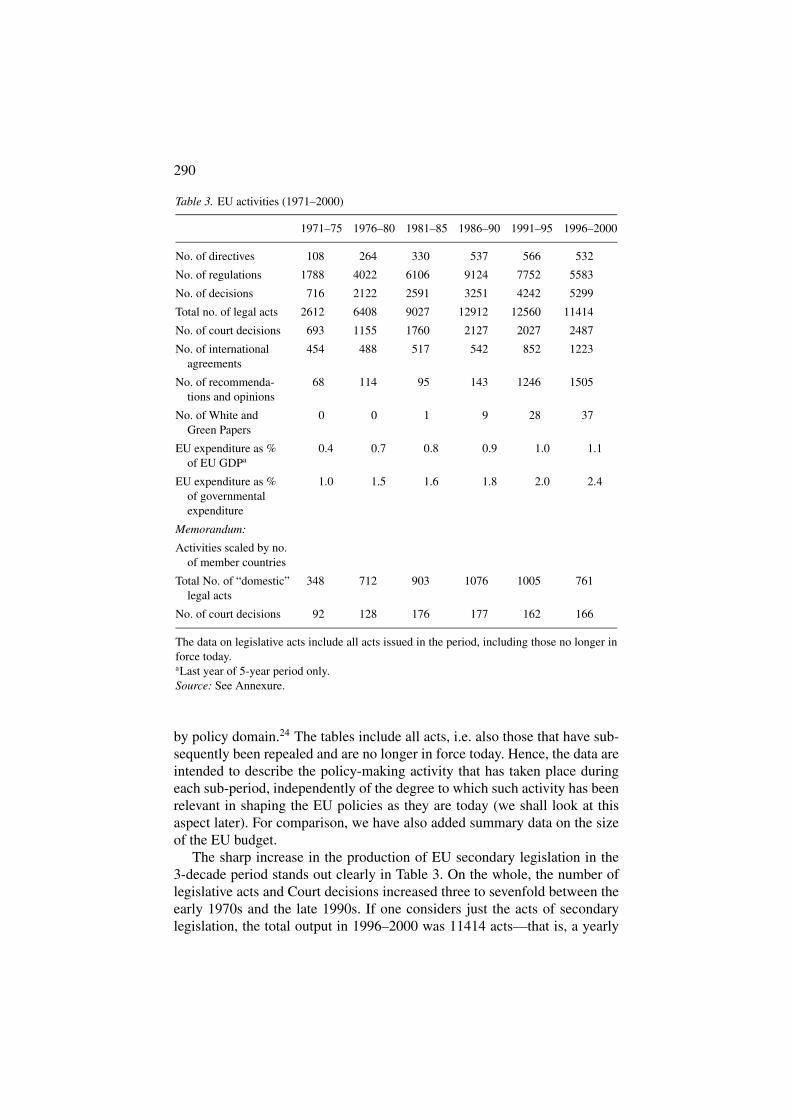
Table 3. EU activities (1971–2000)
1971–75 1976–80 1981–85 1986–90 1991–95 1996–2000
No. of directives 108 264 330 537 566 532
No. of regulations 1788 4022 6106 9124 7752 5583
No. of decisions 716 2122 2591 3251 4242 5299
Total no. of legal acts 2612 6408 9027 12912 12560 11414
No. of court decisions 693 1155 1760 2127 2027 2487
No. of international 454 488 517 542 852 1223agreements
No. of recommenda- 68 114 95 143 1246 1505tions and opinions
No. of White and 0 0 1 9 28 37Green Papers
EU expenditure as % 0.4 0.7 0.8 0.9 1.0 1.1of EU GDPa
EU expenditure as % 1.0 1.5 1.6 1.8 2.0 2.4of governmentalexpenditure
Memorandum:
Activities scaled by no.of member countries
Total No. of “domestic” 348 712 903 1076 1005 761legal acts
No. of court decisions 92 128 176 177 162 166
The data on legislative acts include all acts issued in the period, including those no longer inforce today.aLast year of 5-year period only.Source: See Annexure.
by policy domain.24 The tables include all acts, i.e. also those that have sub-sequently been repealed and are no longer in force today. Hence, the data areintended to describe the policy-making activity that has taken place duringeach sub-period, independently of the degree to which such activity has beenrelevant in shaping the EU policies as they are today (we shall look at thisaspect later). For comparison, we have also added summary data on the sizeof the EU budget.
The sharp increase in the production of EU secondary legislation in the3-decade period stands out clearly in Table 3. On the whole, the number oflegislative acts and Court decisions increased three to sevenfold between theearly 1970s and the late 1990s. If one considers just the acts of secondarylegislation, the total output in 1996–2000 was 11414 acts—that is, a yearly
291
Tabl
e4.
Bre
akdo
wn
ofE
Ule
gisl
atio
nby
polic
ydo
mai
n:N
umbe
rof
regu
latio
ns,d
irec
tives
and
deci
sion
s
1971
–197
519
76–1
980
1981
–198
519
86–1
990
1991
–199
519
96–2
000
1In
tern
atio
nalt
rade
864
2573
2208
3416
2783
2041
2C
omm
onm
arke
t13
325
118
426
830
552
9
3M
oney
and
fisca
l49
6998
6510
024
9
4E
duca
tion,
rese
arch
,cul
ture
1540
7310
418
013
6
5E
nvir
onm
ent
2961
9813
119
725
5
6B
usin
ess
rela
tion
(sec
tora
l)11
5530
5156
8572
8171
3054
37
6aA
gric
ultu
rean
dfis
hery
980
2479
5165
6880
6654
4907
6bIn
dust
ryan
den
ergy
109
445
408
300
309
370
6cT
rans
port
6612
711
210
116
716
0
7B
usin
ess
(non
-sec
tora
l)11
613
725
635
866
914
06
8In
tern
atio
nalr
elal
atio
nsan
d15
510
016
276
842
650
1
fore
ign
aid
9C
itize
nsan
dso
cial
prot
ectio
n96
126
263
521
770
860
Tota
l26
1264
0890
2712
912
1256
011
414
(Con
tinu
edon
next
page
)
292
Tabl
e4.
(Con
tinu
ed)
1971
–197
519
76–1
980
1981
–198
519
86–1
990
1991
–199
519
96–2
000
Shar
es(%
ofco
lum
n)
1In
tern
atio
nalt
rade
33.1
40.2
24.5
26.5
22.2
17.9
2C
omm
onm
arke
t5.
13.
92.
02.
12.
44.
6
3M
oney
and
fisca
l1.
91.
11.
10.
50.
82.
2
4E
duca
tion,
rese
arch
and
cultu
re0.
60.
60.
80.
81.
41.
2
5E
nvir
onm
ent
1.1
1.0
1.1
1.0
1.6
2.2
6B
usin
ess
rela
tion(
sect
oral
)44
.247
.663
.056
.456
.847
.6
6aA
gric
ultu
rean
dfis
hery
37.5
38.7
57.2
53.3
53.0
43.0
6bIn
dust
ryan
den
ergy
4.2
6.9
4.5
2.3
2.5
3.2
6cT
rans
port
2.5
2.0
1.2
0.8
1.3
1.4
7B
usin
ess
(non
-sec
tora
l)4.
42.
12.
82.
85.
312
.3
8In
tern
atio
nalr
elat
ions
and
5.9
1.6
1.8
5.9
3.4
4.4
fore
ign
aid
9C
itize
nsan
dso
cial
prot
ectio
n3.
72.
02.
94.
06.
17.
5
Tota
l10
0.0
100.
010
0.0
100.
010
0.0
100.
0
Not
e:T
heda
tain
clud
eal
lact
sis
sued
inth
epe
riod
,inc
ludi
ngth
ose
nolo
nger
info
rce
toda
y.So
urce
:See
App
endi
x.
293
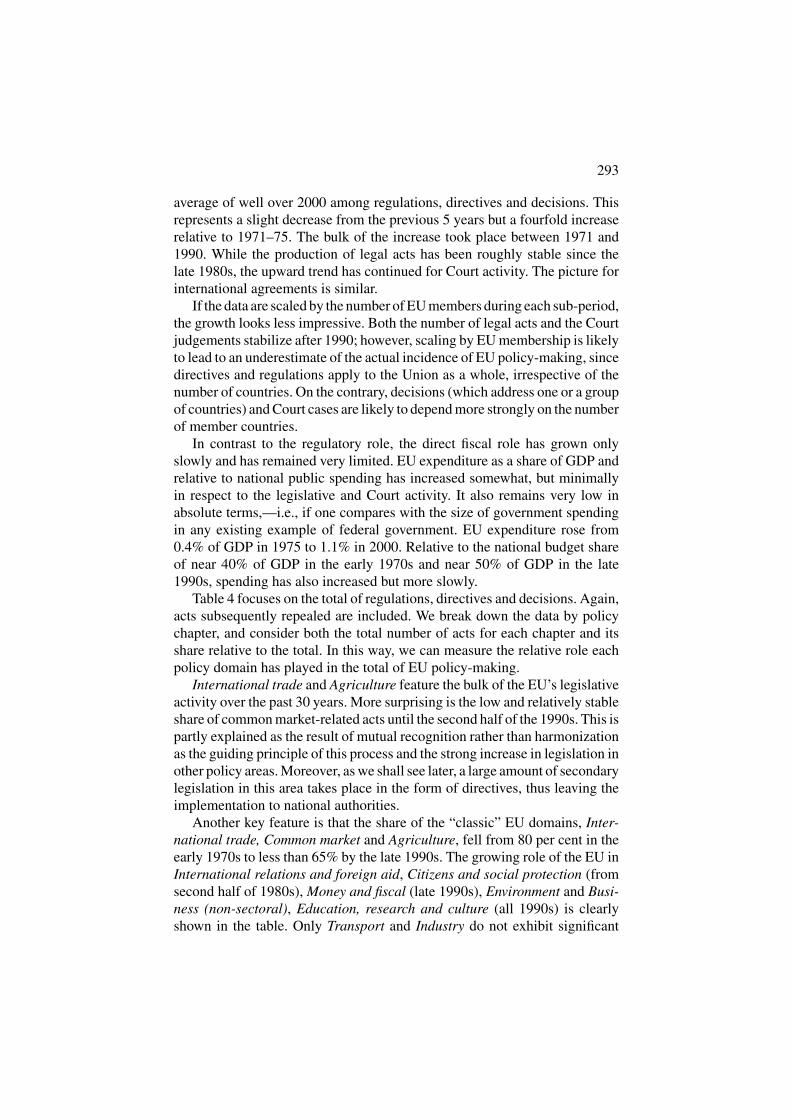
average of well over 2000 among regulations, directives and decisions. Thisrepresents a slight decrease from the previous 5 years but a fourfold increaserelative to 1971–75. The bulk of the increase took place between 1971 and1990. While the production of legal acts has been roughly stable since thelate 1980s, the upward trend has continued for Court activity. The picture forinternational agreements is similar.
If the data are scaled by the number of EU members during each sub-period,the growth looks less impressive. Both the number of legal acts and the Courtjudgements stabilize after 1990; however, scaling by EU membership is likelyto lead to an underestimate of the actual incidence of EU policy-making, sincedirectives and regulations apply to the Union as a whole, irrespective of thenumber of countries. On the contrary, decisions (which address one or a groupof countries) and Court cases are likely to depend more strongly on the numberof member countries.
In contrast to the regulatory role, the direct fiscal role has grown onlyslowly and has remained very limited. EU expenditure as a share of GDP andrelative to national public spending has increased somewhat, but minimallyin respect to the legislative and Court activity. It also remains very low inabsolute terms,—i.e., if one compares with the size of government spendingin any existing example of federal government. EU expenditure rose from0.4% of GDP in 1975 to 1.1% in 2000. Relative to the national budget shareof near 40% of GDP in the early 1970s and near 50% of GDP in the late1990s, spending has also increased but more slowly.
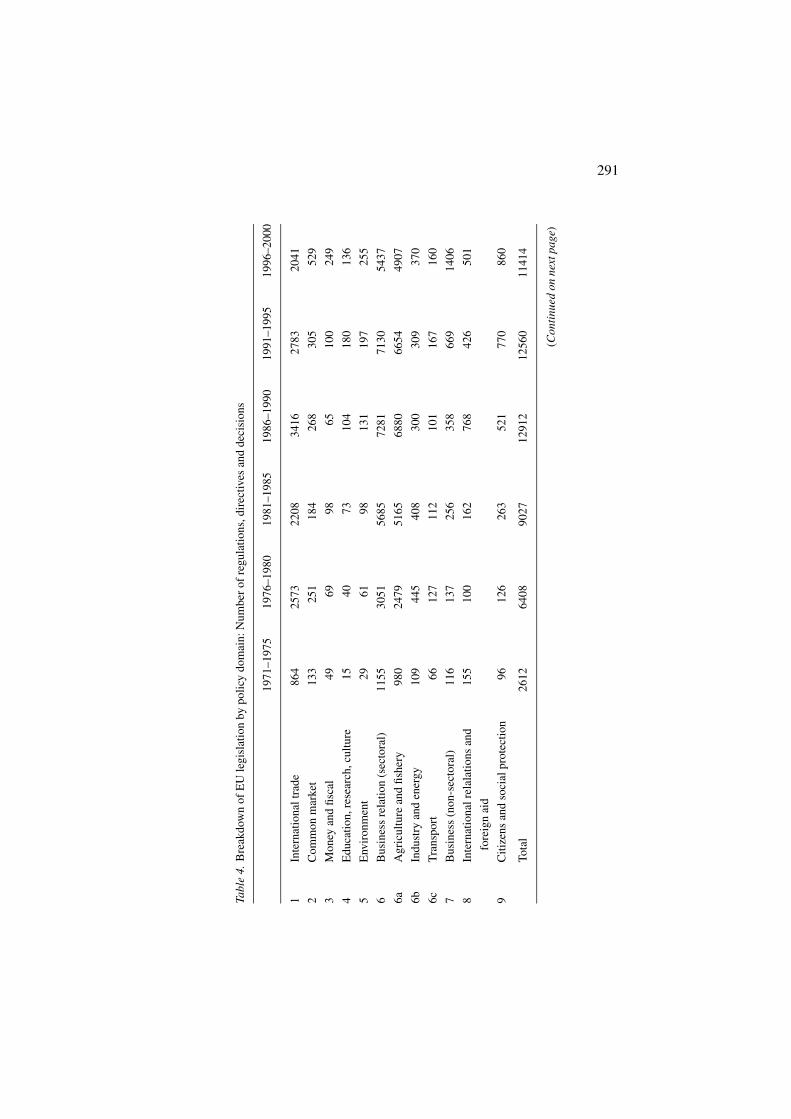
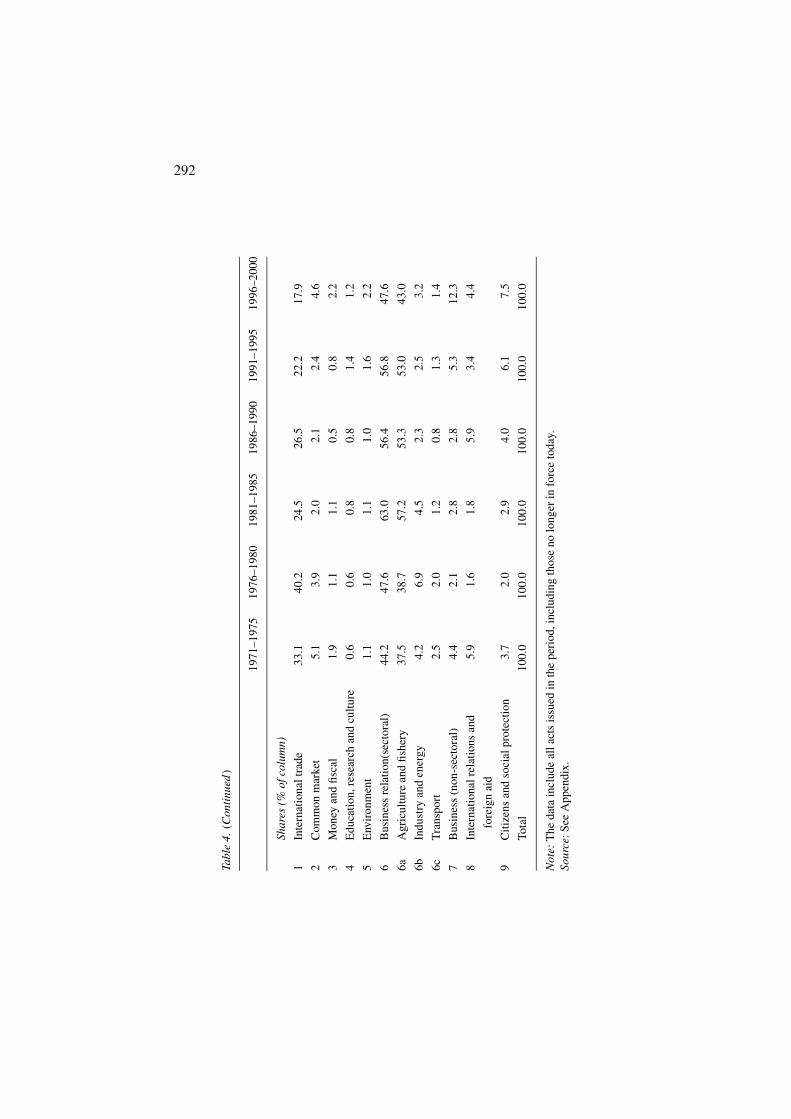
Table 4 focuses on the total of regulations, directives and decisions. Again,acts subsequently repealed are included. We break down the data by policychapter, and consider both the total number of acts for each chapter and itsshare relative to the total. In this way, we can measure the relative role eachpolicy domain has played in the total of EU policy-making.
International trade and Agriculture feature the bulk of the EU’s legislativeactivity over the past 30 years. More surprising is the low and relatively stableshare of common market-related acts until the second half of the 1990s. This ispartly explained as the result of mutual recognition rather than harmonizationas the guiding principle of this process and the strong increase in legislation inother policy areas. Moreover, as we shall see later, a large amount of secondarylegislation in this area takes place in the form of directives, thus leaving theimplementation to national authorities.
Another key feature is that the share of the “classic” EU domains, Inter-national trade, Common market and Agriculture, fell from 80 per cent in theearly 1970s to less than 65% by the late 1990s. The growing role of the EU inInternational relations and foreign aid, Citizens and social protection (fromsecond half of 1980s), Money and fiscal (late 1990s), Environment and Busi-ness (non-sectoral), Education, research and culture (all 1990s) is clearlyshown in the table. Only Transport and Industry do not exhibit significant

294
increases over the past two decades. All this shows the broadening of thescope of activity of the EU.
In Table 5 we have assembled the data on the non-binding acts and doc-uments. We find it interesting to document also these “softer” forms of pol-icy, since in many cases they are used to lay tentative ground for successivemore binding forms of policy. The growth in the number of recommendationsand opinions, as well as “white” and “green” papers, is particularly sharpin the 1990s. Common market and Business relations take the lion’s share,but it is noteworthy that a sharp increase took place also in two more “pe-ripheral” areas, i.e., Education, research and culture and Citizen and socialprotection.
Where We Now Stand: EU Presence Across Policy Domains
Basic data
We now move from past evolution to the present, looking in some detail attoday’s EU policy involvement in our policy domains via Treaties, legislation,the Court and subordinate measures.
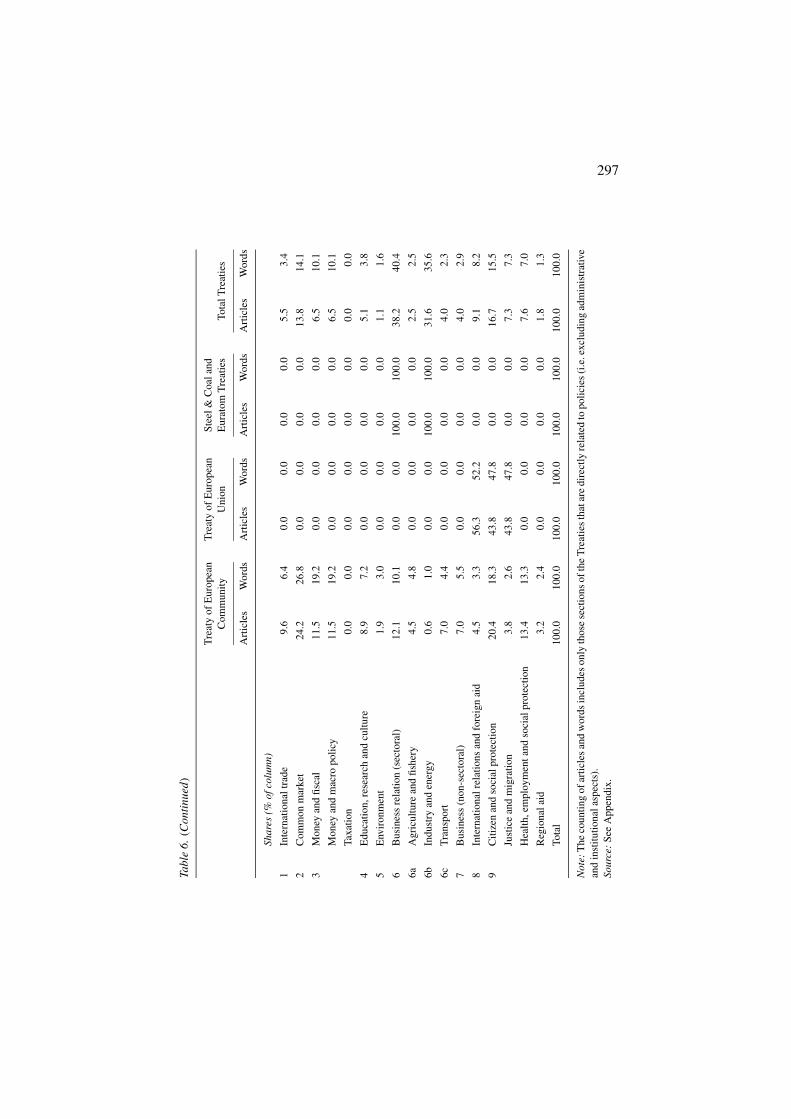
Table 6 focuses on the role of the Treaties. Such role is measured, across thepolicy domains, by the degree of detail devoted to each of them, approximatedby the number of articles or the number of words (for details on the breakdownof the Treaties into policy domains, see the annexure table). Some policychapters that are clearly of key importance, such as Agriculture or Businessrelations (non-sectoral), have little mention in the Treaties. International tradehas also relatively little weight, despite its full centralization at the EU level.25
Taxation is perhaps the domain with the most blatant discrepancy betweenTreaty coverage and policy-making activity. There is no single Treaty articledirectly referring to taxation and related secondary legislation is based on anindirect reference in just one Article (Art. 99).
Other domains, like Common market or Money and macro policy (thelatter, particularly after Maastricht) are heavily present. A surprisingly largeshare of articles and words (almost one quarter of the combined Articles of theTreaties) are devoted to the Citizen and social protection chapter. But amongstits sub-chapters, Justice and migration and Regional aid feature relativelyless coverage than Health, employment and social protection. Internationalrelations also cover a large share (mainly due to its presence in the EU Treaty).The ECSC and EURATOM treaties give rise to a large presence to sectoralpolicies on “industry and energy” in the Treaties.
Table 7 looks at total legislation in force today, showing the acts signed byall signatories by policy chapter. Two findings seem important. Again Agri-culture is coming out on top of the list in terms of the number of legal actspassed, followed by International trade, Business (non-sectoral) and Com-mon market. Education et al., Environment, Industry, Transport, International

295
Table 5. Breakdown of EU non-binding acts by policy domain
Recommendations & opinions
1971–75 1976–80 1981–85 1986–90 1991–95 1996–2000
1 International trade 6 2 12 11 49 382 Common market 4 20 8 17 160 2003 Money and fiscal 3 1 4 1 50 1074 Education, research and culture 2 2 4 1 68 925 Environment 4 2 4 17 92 1496 Business relation (sectoral) 37 79 48 55 559 5746a Agriculture and fishery 5 5 2 11 183 1486b Industry and energy 1 13 13 26 273 3116c Transport 31 61 33 18 103 1157 Business (non-sectoral) 6 1 1 7 49 458 International relations and foreign aid 0 3 3 15 39 339 Citizens and social protection 6 4 11 19 180 267
Total 68 114 95 143 1246 1505
White Papers1971–75 1976–80 1981–85 1986–90 1991–95 1996–2000
1 International trade2 Common market 1 1 13 Money and fiscal 24 Education, research and culture 15 Environment 16 Business relation (sectoral) 1 36a Agriculture and fishery6b Industry and energy 16c Transport 37 Business (non-sectoral) 18 International relations and foreign aid 19 Citizens and social protection 1 2
Total 0 0 1 1 6 8
Green Papers1971–75 1976–80 1981–85 1986–90 1991–95 1996–2000
1 International trade 12 Common market 4 7 43 Money and finance 14 Education, researchand culture 3 25 Environment 1 2 36 Business relation and sectoral 1 4 46a Agriculture and fishery 16b Industry and energy 1 36c Transport 3 17 Business (non-sectoral) 2 78 International relations and foreign aid 19 Citizens and social protection 5 7
Total 0 0 0 8 22 29
Source: See Annexure.

296
Tabl
e6.
Mea
sure
sof
polic
yin
tens
ity:T
heT
reat
ies Tre
aty
ofE
urop
ean
Tre
aty
ofE
urop
ean
Stee
l&C
oala
ndC
omm
unity
Uni
onE
urat
omT
reat
ies
Tota
lTre
atie
s
Art
icle
sW
ords
Art
icle
sW
ords
Art
icle
sW
ords
Art
icle
sW
ords
1In
tern
atio
nalt
rade
1514
540
00
015
1454
2C
omm
onm
arke
t38
6057
00
00
3860
57
3M
oney
and
fisca
l18
4335
00
00
1843
35
3aM
oney
and
mac
ropo
licy
1843
350
00
018
4335
3bTa
xatio
n0
00
00
00
0
4E
duca
tion,
rese
arch
and
cultu
re14
1614
00
00
1416
14
5E
nvir
onm
ent
368
20
00
03
682
6B
usin
ess
rela
tiona
ndse
ctor
al19
2285
00
8614
998
105
1728
3
6aA
gric
ultu
rean
dfis
hery
710
720
00
07
1072
6bIn
dust
ryan
den
ergy
123
00
086
1499
887
1522
8
6cT
rans
port
1198
30
00
011
983
7B
usin
ess
(non
-sec
tora
l)11
1248
00
00
1112
48
8In
tern
atio
nalr
elat
ions
and
775
218
2742
00
2534
94
fore
ign
aid
9C
itize
nan
dso
cial
prot
ectio
n32
4133
1425
140
046
6647
9aJu
stic
ean
dm
igra
tion
659
214
2514
00
2031
06
9bH
ealth
,em
ploy
men
tand
soci
alpr
otec
tion
2129
950
00
021
2995
9cR
egio
nala
id5
546
00
00
554
6
Tota
l15
722
560
3252
5686
1499
827
542
814
(Con
tinu
edon
next
page
)
297Ta
ble
6.(C
onti
nued
)
Tre
aty
ofE
urop
ean
Tre
aty
ofE
urop
ean
Stee
l&C
oala
ndC
omm
unity
Uni
onE
urat
omT
reat
ies
Tota
lTre
atie
s
Art
icle
sW
ords
Art
icle
sW
ords
Art
icle
sW
ords
Art
icle
sW
ords
Shar
es(%
ofco
lum
n)
1In
tern
atio
nalt
rade
9.6
6.4
0.0
0.0
0.0
0.0
5.5
3.4
2C
omm
onm
arke
t24
.226
.80.
00.
00.
00.
013
.814
.1
3M
oney
and
fisca
l11
.519
.20.
00.
00.
00.
06.
510
.1
Mon
eyan
dm
acro
polic
y11
.519
.20.
00.
00.
00.
06.
510
.1
Taxa
tion
0.0
0.0
0.0
0.0
0.0
0.0
0.0
0.0
4E
duca
tion,
rese
arch
and
cultu
re8.
97.
20.
00.
00.
00.
05.
13.
8
5E
nvir
onm
ent
1.9
3.0
0.0
0.0
0.0
0.0
1.1
1.6
6B
usin
ess
rela
tion
(sec
tora
l)12
.110
.10.
00.
010
0.0
100.
038
.240
.4
6aA
gric
ultu
rean
dfis
hery
4.5
4.8
0.0
0.0
0.0
0.0
2.5
2.5
6bIn
dust
ryan
den
ergy
0.6
1.0
0.0
0.0
100.
010
0.0
31.6
35.6
6cT
rans
port
7.0
4.4
0.0
0.0
0.0
0.0
4.0
2.3
7B
usin
ess
(non
-sec
tora
l)7.
05.
50.
00.
00.
00.
04.
02.
9
8In
tern
atio
nalr
elat
ions
and
fore
ign
aid
4.5
3.3
56.3
52.2
0.0
0.0
9.1
8.2
9C
itize
nan
dso
cial
prot
ectio
n20
.418
.343
.847
.80.
00.
016
.715
.5
Just
ice
and
mig
ratio
n3.
82.
643
.847
.80.
00.
07.
37.
3
Hea
lth,e
mpl
oym
enta
ndso
cial
prot
ectio
n13
.413
.30.
00.
00.
00.
07.
67.
0
Reg
iona
laid
3.2
2.4
0.0
0.0
0.0
0.0
1.8
1.3
Tota
l10
0.0
100.
010
0.0
100.
010
0.0
100.
010
0.0
100.
0
Not
e:T
heco
untin
gof
artic
les
and
wor
dsin
clud
eson
lyth
ose
sect
ions
ofth
eT
reat
ies
that
are
dire
ctly
rela
ted
topo
licie
s(i
.e.e
xclu
ding
adm
inis
trat
ive
and
inst
itutio
nala
spec
ts).
Sour
ce:
See
App
endi
x.

298
Table 7. Measures of policy intensity: Legislation in force
All signatories
Regulation Directive Decision Total
1 International trade 1568 20 1216 2804
2 Common market 48 890 184 1122
3 Money and fiscal 58 77 138 273
3a Money and macro policy 45 1 80 126
3b Taxation 13 76 58 147
4 Education, research and culture 22 19 94 135
5 Environment 66 193 188 447
6 Business relation (sectoral) 3915 650 2738 7303
6a Agriculture and fishery 3733 484 2245 6462
6b Industry and energy 70 45 380 495
6c Transport 112 121 113 346
7 Business (non-sectoral) 73 38 2309 2420
8 International relations and 222 1 258 481foreign aid
b Citizen and social protection 257 178 527 962
9a Justice and migration 17 12 108 137
9b Health, employment and 198 166 166 530social protection
9c Regional aid 42 0 253 295
Total 6229 2066 7652 15947
Shares (% of column)
1 International trade 25.2 1.0 15.9 17.6
2 Common market 0.8 43.1 2.4 7.0
3 Money and fiscal 0.9 3.7 1.8 1.7
3a Money and macro policy 0.7 0.0 1.0 0.8
3b Taxation 0.2 3.7 0.8 0.9
4 Education, research and culture 0.4 0.9 1.2 0.8
5 Environment 1.1 9.3 2.5 2.8
6 Business relation (sectoral) 62.9 31.5 35.8 45.8
6a Agriculture and fishery 59.9 23.4 29.3 40.5
6b Industry and energy 1.1 2.2 5.0 3.1
6c Transport 1.8 5.9 1.5 2.2
7 Business (non-sectoral) 1.2 1.8 30.2 15.2
8 International relations and 3.6 0.0 3.4 3.0foreign aid
(Continued on next page)

299
Table 7. (Continued.)
All signatories
Regulation Directive Decision Total
9 Citizen and social protection 4.1 8.6 6.9 6.0
9a Justice and migration 0.3 0.6 1.4 0.9
9b Health, employment and 3.2 8.0 2.2 3.3social protection
9c Regional aid 0.7 0.0 3.3 1.8
Total 100.0 100.0 100.0 100.0
relations, Regional aid, Justice and migration but also Money and fiscal comesout as less important.
Tables 6 and 7 together suggest that there is a certain substitutabilitybetween Treaties and secondary legislation as vehicles for enacting policy.Both the Common market and the Money and fiscal policy domains are ex-tensively represented in the Treaties, but feature less prominently in sec-ondary legislation. International trade, by contrast, has fewer provisions inthe Treaties but features more prominently in secondary legislation (and, asindicated below, in international treaties). Similarly, Business relations (non-sectoral) and Taxation are more prominent in secondary legislation than inthe Treaties. We will take this into account when constructing the summaryindicators.
Table 8 displays the Court of Justice activity by policy chapter. Data limita-tions forced us to restrict ourselves to the period between June 1997 and March2001. The Court of Justice is only asked for an opinion or a judgement if theEU has an important presence in the corresponding area. The “front-runners”of previous tables—International trade; Common market; Agriculture–alsogenerate numerous Court cases. In addition, the Court had to decide on manycases related to Taxation, Business relations (non-sectoral) and Health, em-ployment and social protection. It is hardly surprising that Education andResearch and culture are virtually absent from the Court, but also Industryplays a very limited role in the Courts as in secondary legislation, despite theirimportant role in the Treaties.
Table 9 assembles various other indicators, including international agree-ments, non binding acts, as well as the staffing of the EU Commissions andthe level of spending in the EU budget, all broken down by policy area. Inter-national agreements mainly belong to International trade (about 80% of thetotal), whereas Agriculture and International relations make up for almostall of the remaining 20%. Recommendations and opinions, Green Papers andWhite Papers show, as already seen in an earlier table, a significant coverageof non-traditional policy areas, such as Citizen and social protection. They

300
Table 8. Measures of policy intensity: Court activity ( June 1997 to March 2001)
Judgements Opinions Total
1 International trade 139 70 2092 Common market 218 206 4243 Money and fiscal 105 123 2283a Money and macro policy 1 0 13b Taxation 104 123 2274 Education, research and culture 1 0 15 Environment 70 59 1296 Business relation and sectoral 248 130 3786a Agriculture and fishery 214 106 3206b Industry and energy 2 0 26c Transport 32 24 567 Business (non-sectoral) 317 116 4338 International relations and foreign aid 44 28 729 Citizen and social protection 123 85 2089a Justice and migration 3 3 69b Health, employment and social protection 112 80 1929c Regional aid 8 2 10
Total 1265 817 2082
Shares (% of column)
1 International trade 11.0 8.6 10.02 Common market 17.2 25.2 20.43 Money and fiscal 8.3 15.1 11.03a Money and macro policy 0.1 0.0 0.03b Taxation 8.2 15.1 10.94 Education, research and culture 0.1 0.0 0.05 Environment 5.5 7.2 6.26 Business relationand sectoral 19.6 15.9 18.26a Agriculture and fishery 16.9 13.0 15.46b Industry and energy 0.2 0.0 0.16c Transport 2.5 2.9 2.77 Business (non-sectoral) 25.1 14.2 20.88 International relations and foreign aid 3.5 3.4 3.59 Citizen and social protection 9.7 10.4 10.09a Justice and migration 0.2 0.4 0.39b Health, employment and social protection 8.9 9.8 9.29c Regional aid 0.6 0.2 0.5
Total 100.0 100.0 100.0
Source: See Annexure.

301
Tabl
e9.
Oth
erm
easu
res
ofpo
licy
inte
nsity
:Int
erna
tiona
lagr
eem
ents
,non
-bin
ding
legi
slat
ion,
pape
rs,s
taff
and
budg
et
Inte
rnat
iona
lR
ecom
men
datio
nsW
hite
Gre
enSt
aff
EU
agre
emen
tsan
dop
inio
nspa
pers
pape
rssi
zea
expe
nditu
reb
1In
tern
atio
nalt
rade
4521
130
01
372
55
2C
omm
onm
arke
t11
454
315
330
194
3M
oney
and
fisca
l1
168
21
682
101
3aM
oney
and
mac
ropo
licy
110
12
139
558
3bTa
xatio
n0
670
028
742
4E
duca
tion,
rese
arch
and
cultu
re10
117
21
538
2150
66
5E
nvir
onm
ent
326
81
641
021
8
6B
usin
ess
rela
tion
and
sect
oral
833
1385
49
2521
4294
2
6aA
gric
ultu
rean
dfis
hery
735
361
01
1036
4174
5
6bIn
dust
ryan
den
ergy
4464
91
495
8
6cT
rans
port
5437
53
421
7B
usin
ess
(non
-sec
tora
l)5
129
19
1095
364
8In
tern
atio
nalr
elat
ions
and
fore
ign
aid
426
941
120
6184
99
9C
itize
nan
dso
cial
prot
ectio
n28
498
312
1483
3304
1
9aJu
stic
ean
dm
igra
tion
1532
03
138
124
9bH
ealth
,em
ploy
men
tand
soci
alpr
otec
tion
1335
33
896
093
31
9cR
egio
nala
id0
113
01
385
2358
6
Mem
o:ad
min
istr
atio
nc10
214
1505
Mem
o:ot
her
Com
mun
ity
inst
itut
ions
d90
7413
37
Tota
l59
2932
9816
5932
063
9332
2

302Sh
ares
(%of
colu
mn)
1In
tern
atio
nalt
rade
76.3
3.9
0.0
1.7
1.2
0.1
2C
omm
onm
arke
t0.
213
.818
.825
.41.
00.
23
Mon
eyan
dfis
cal
0.0
5.1
12.5
1.7
2.1
0.1
3aM
oney
and
mac
ropo
licy
0.0
3.1
12.5
1.7
1.2
0.1
3bTa
xatio
n0.
02.
00.
00.
00.
90.
04
Edu
catio
n,re
sear
chan
dcu
lture
1.7
5.2
6.3
8.5
11.9
5.4
5E
nvir
onm
ent
0.1
8.1
6.3
10.2
1.3
0.2
6B
usin
ess
rela
tion
(sec
tora
l)14
.042
.025
.015
.37.
946
.06a
Agr
icul
ture
and
fishe
ry12
.410
.90.
01.
73.
244
.76b
Indu
stry
and
ener
gy0.
719
.76.
36.
80.
01.
06c
Tra
nspo
rt0.
911
.418
.86.
80.
00.
07
Bus
ines
sre
latio
n(n
on-s
ecto
ral)
0.1
3.9
6.3
15.3
3.4
0.4
8In
tern
atio
nalr
elat
ions
and
fore
ign
aid
7.2
2.9
6.3
1.7
6.4
9.1
9C
itize
nan
dso
cial
prot
ectio
n0.
515
.118
.820
.34.
635
.49a
Just
ice
and
mig
ratio
n0.
31.
00.
05.
10.
40.
19b
Hea
lth,e
mpl
oym
enta
ndso
cial
prot
ectio
n0.
210
.718
.813
.63.
010
.09c
Reg
iona
laid
0.0
3.4
0.0
1.7
1.2
25.3
Mem
o:ad
min
istr
atio
n31
.91.
6M
emo:
othe
rco
mm
unit
yin
stit
utio
ns28
.31.
4To
tal
100.
010
0.0
100.
010
0.0
100.
010
0.0
Not
e:D
iscr
epan
cies
inth
eto
taln
umbe
rsw
ithre
spec
tto
Tabl
e3
are
due
toth
edi
ffer
ence
inth
etim
epe
riod
sco
nsid
ered
.a St
aff
size
asof
01/0
3/20
01,i
nclu
ded
tem
pora
rypo
sts.
bT
heE
Uad
min
istr
ativ
eex
pend
iture
s(4
725.
3m
il.E
UR
)ha
vebe
enal
loca
ted
toth
epo
licy
dom
ains
acco
rdin
gto
staf
fsi
ze.
c “Adm
inis
trat
ion”
incl
udes
the
Com
mis
sion
,Sec
reta
riat
-Gen
eral
,Leg
alse
rvic
e,Pr
ess
and
com
mun
icat
ion
serv
ice,
Ext
erna
lrel
atio
ns,P
er-
sonn
elan
dA
dmin
istr
atio
n,B
udge
t,Fi
nanc
ialC
ontr
ol,E
urop
ean
Ant
i-Fr
aud
Offi
ce,J
oint
Inte
rpre
ting
and
Con
fere
nce
Serv
ice,
Tra
nsla
tion
Serv
ice,
Offi
cefo
rO
ffici
alPu
blic
atio
nsof
the
EC
,Rep
rese
ntat
ions
inth
eE
U.
d“O
ther
Com
mun
ityin
stitu
tions
”in
clud
ePa
rlia
men
t(41
26),
Cou
ncil
(264
8),C
ourt
ofJu
stic
e(1
006)
,Cou
rtof
Aud
itors
(552
),E
cono
mic
and
Soci
alC
omm
ittee
and
Com
mitt
eeof
the
Reg
ions
(742
).So
urce
:See
Ann
exur
e.

303
can serve to justify staffing and budgets and show readiness to take on andcentralize other policy responsibilities in the future.
The final two columns of the table reveal some familiar and some surprisingfacts as well. As well known, most of the EU budget goes into agriculture andsocial, regional and structural funds (here under chapters 9b and 9c). Theseareas do not, however, correspond to those in which the Commission is mostheavily staffed. By contrast, some of the policy domains with the main legisla-tive activity are surprisingly modestly staffed. International trade, Commonmarket, Business relations (non-sectoral) and even Agriculture only accountfor a few percent each of total staff. Education et al. and International rela-tions seem rather favorably equipped with manpower. Administration (whichincludes notably Personnel/Administration and translation services) accountfor an astonishing 44% of the total Commission staff of 23000. In addi-tion, the other institutions (notably the Parliament) employ another 9000staff.26
Due to statistical difficulties we are not able, in this paper, to provide afull comparison of the relative policy-making involvement of the EU acrosspolicy chapter with that of national governments. However, we move one stepin this direction by showing some comparison of the relative fiscal roles, asmeasured by the size of the budget across our policy areas (Table 10). 90%of EU spending is redistributional and goes to agriculture, to member coun-tries for social or regional development purposes and to foreign aid. Lessthan 10% of total spending is on education and other functions traditionallyundertaken by governments under the heading of “public consumption”. Bycontrast, member states spend more than one third of their budgets on defense,environment, education, and about half on redistribution, including pensionsand unemployment benefits.27 It is therefore quite clear that the budgetaryallocation of the EU are disproportionally allocated to a specific sector, agri-culture, which represents a miniscule fraction of GDP. Recall, however, thatthe overall magnitude of EU spending is very limited and amounts to around2% of spending at the national level.
Summary indicators
The elementary indicators presented so far provide a somewhat fragmentedpicture of the intensity of EU policy involvement in each policy area. More-over, each elementary indicator can be misleading because it measures suchinvolvement from a specific angle and can be affected by measurement prob-lems. Assembling all evidence into summary indicators can thus help us geta clearer overall sense of the results. To construct them, we proceed in twosteps. First, we compile semi-aggregate indicators of policy involvement (bro-ken down by domains) for each of the three main channels of policy-making,i.e., the Treaties, the secondary legislation and the Court. Second, we combine

304
Tabl
e10
.Fi
scal
cent
raliz
atio
nin
the
Eur
opea
nU
nion
:The
allo
catio
nof
spen
ding
deci
sion
sbe
twee
nE
Uan
dM
embe
rC
ount
ries
,200
0
Bud
geto
fth
eE
urop
ean
Uni
onE
xpen
ditu
re,E
U15
Nom
inal
%of
tota
l%
ofE
U%
ofto
tal
%of
EU
(bill
Eur
o)sp
endi
ngG
DP
spen
ding
GD
P
Tota
lexp
endi
ture
93.3
100
1.1
100
46.8
Intle
rnat
iona
ltra
de,c
omm
onm
arke
t,m
acro
,non
-sec
tora
lbus
ines
s(c
at.1
–3,7
)0.
70.
80.
0..
...
.
Edu
catio
n,re
sear
ch,c
ultu
re(c
at.4
)5.
15.
50.
112
.35.
8
Edu
catio
n..
...
...
.10
.95.
1
Res
earc
h..
...
...
.1.
40.
7
Env
iron
men
t(ca
t.5)
0.2
0.2
0.0
1.4
0.6
Sect
oral
busi
ness
(cat
.6)
42.9
46.0
0.5
...
...
ofw
hich
agri
cultu
re(6
a)41
.744
.70.
5
Inte
rnat
iona
lrel
atio
ns(c
at.8
)8.
59.
10.
14.
92.
3
Def
ense
...
...
...
4.3
2.0
Fore
ign
aid
8.5
9.1
0.1
0.7
0.3
Citi
zen
and
soci
alpr
otec
tion
(cat
.9)
3335
.40.
439
.818
.6
Hea
lth..
...
...
.13
.86.
5
Une
mpl
oym
entb
enefi
ts..
...
...
.2.
81.
3
Act
ive
labo
rm
arke
tpol
icie
s..
...
...
.2.
11.
0
Pens
ions
...
...
...
21.1
9.9
Hea
lth,e
mpl
oym
enta
ndso
cial
prot
ectio
n(s
ocia
lfun
ds)
9.3
10.0
0.1
...
...
Reg
iona
laid
23.6
25.3
0.3
...
...
Oth
erad
min
istr
atio
nan
dco
mm
unity
inst
itutio
ns2.
83.
00.
0..
...
.
Mem
oran
dum
Publ
icco
nsum
ptio
n8.
89.
40.
135
.316
.5
Tra
nsfe
rsan
dsu
bsid
iesa
84.5
90.6
1.0
51.3
24
a EU
tran
sfer
sin
clud
eca
pita
ltra
nsfe
rsto
regi
ons
whi
lena
tiona
ltra
nsfe
rsar
ecu
rren
ttra
nsfe
rs.
Sour
ce:
NA
TO
Han
dboo
k,20
01;O
EC
DSo
cial
Exp
endi
ture
Dat
abas
e,O
EC
Din
figur
es,2
000.

305
these into overall indicators of policy involvement, using specific aggregationcriteria. All results are presented in Table 11.
The first three columns present the semi-aggregate indicators on EU in-volvement via Treaties, secondary legislation and Court activity, respectively.In practice, we standardize all earlier detailed indicators for each of thenine main policy domains and the three channels—i.e., (i) Treaty articlesand words; (ii) regulations, directives, decisions; (iii) Court decisions andopinions—in Tables 6–8 by dividing each cell by the column mean. In thisway, attention is restricted exclusively to the relative weights across policy do-mains: the information on the absolute values of the elementary indicators islost. Subsequently, we take the arithmetic means of the elementary indicatorsfor each channel. This yields the three semi-aggregate indicators, referringrespectively to the Treaties, to secondary legislation, and to Court activity. Byconstruction, each of them has a mean equal to one. Finally we look at thesub-categories under money and fiscal, sectoral policies and citizen and so-cial protection. We calculate semi-aggregate indicators for each sub-chapterso that they reflect the relative intensity within their chapter and so that themean in each chapter remains one.28
The three indicators take on quite different values for each policy domain.This supports the view that EU action in each field tends to take place througha different mix of policy instruments. For example, international trade andagricultural policies are enacted mainly through secondary legislation, withsome support from the Court; the direct input from the Treaty is minor. Bycontrast, in the areas of Money and other macro policy and Citizen and socialprotection the Treaty plays a greater role than secondary legislation.
In general, the activity of the Court (as measured by the third semi-aggregated index) for the main chapters tends to be characterized by lowervariability across policy domains than the legislative. In turn, the first two arenegatively correlated across policy domains, thereby seemingly confirmingtheir complementarity. All this strengthens our earlier conjecture that there issubstitutability between Treaty and secondary legislation as policy vehicles.
The interpretation of the data on Court activity is more complex due tothe fact that the Court does not merely complement the Treaty and legislationthrough their interpretation. The Court enforces EU law. The correlation ofdata can, therefore, not be interpreted simply as an indicator of substitutability.Court activity is positively correlated with the legislative activity across policydomains, confirming the importance of legislation as an indicator for the roleof the European Union. But this is not the case for the Treaty with whichCourt cases are negatively correlated.29 The latter is due, for example, to theextensive space in the Treaties on industry and citizen-related issues which isnot matched by follow up secondary legislation and Court cases.
We then proceed to aggregate this information further. We use the produc-tion function analogy to construct three alternative indicators characterized,

306Ta
ble
11.
Invo
lvem
ento
fth
eE
Uin
polic
y-m
akin
g:M
easu
res
ofin
tens
ityby
polic
ych
apte
r
Bas
icin
dica
tors
aM
eans
a
Tre
aty
Leg
isla
tion
Cou
rtA
rith
met
icG
eom
etri
cL
eont
ief
1In
tern
atio
nalt
rade
0.40
1.58
0.90
0.96
1.01
1.32
2C
omm
onm
arke
t1.
260.
631.
831.
241.
411.
38
3M
oney
and
fisca
l,of
whi
ch0.
750.
150.
990.
630.
720.
66
3aM
oney
and
mac
ropo
licy
1.50
0.14
0.01
0.55
0.25
0.12
3bTa
xatio
n0.
000.
171.
960.
711.
181.
19
4E
duca
tion,
rese
arch
and
cultu
re0.
400.
080.
000.
160.
030.
01
5E
nvir
onm
ent
0.12
0.25
0.56
0.31
0.35
0.27
6B
usin
ess
rela
tion
(sec
tora
l)of
whi
ch3.
534.
121.
633.
102.
682.
38
6aA
gric
ultu
rean
dfis
hery
0.68
10.9
44.
155.
266.
606.
06
6bIn
dust
ryan
den
ergy
9.07
0.84
0.03
3.31
0.48
0.04
6cT
rans
port
0.85
0.59
0.73
0.72
0.97
1.05
7B
usin
ess
rela
tions
(non
-sec
tora
l)0.
311.
371.
871.
181.
341.
22
8In
tern
atio
nalr
elat
ions
and
fore
ign
aid
0.78
0.27
0.31
0.45
0.43
0.45
9C
itize
nan
dso
cial
prot
ectio
n1.
450.
540.
900.
961.
021.
31
9aJu
stic
ean
dm
igra
tion
1.96
0.23
0.08
0.76
0.37
0.19
9bH
ealth
,em
ploy
men
tand
soci
alpr
otec
tion
1.98
0.90
2.49
1.79
2.37
3.44
9cR
egio
nala
id0.
420.
500.
130.
350.
310.
31
Ave
rage
:1.
001.
001.
001.
001.
001.
00
a Indi
cato
rsar
eno
rmal
ized
soth
atth
eco
lum
nav
erag
eof
the
mai
nca
tego
ries
equa
lsun
ity.T
heav
erag
efo
rth
esu
bcat
egor
ies
equa
lsth
eva
lue
ofth
em
ain
cate
gory
.So
urce
:Se
eA
ppen
dix.

307
by construction, by different elasticities of substitutions among the basic indi-cators. They are, respectively, the arithmetic mean, a (mixed) geometric mean,and a so-called “Leontief” mean constructed as follows (and normalized tohave a mean equal one).30
I1 = (i1 + i2 + i3) /3 Arithmetic mean;
I2 =√
[(i1 + i2) /2] i3 Mixed geometric mean;
I3 = min {[(i1 + i2)/2]; i3)} “Leontief” mean.
The first one assumes that the EU policy services (the “output”) are pro-vided with a production technology that is linear in the three “inputs,” i1 (theTreaties), i2 (secondary legislation) and i3 (Court activity). The second indexuses the same technology for the first two inputs, while the first two and thethird are aggregated using a Cobb Douglas technology. In the latter, the elas-ticity of substitution is constant and unitary, which implies that the rate ofsubstitution between (i1 + i2) /2 and i3 decreases as the use of i3 increases. Inthe third index, we push this idea further by assuming that the production tech-nology is of Leontief type: there is no substitution at all between (i1 + i2) /2and i3 and the “output” is determined by the scarcest “input”. Indicators arecalculated for the main categories, while indicators for sub-categories reflectthe relative intensity within their category and average the indicator for thewhole category.31
The summary indicators provide a measure of the relative degree of in-volvement of the EU in the policy areas. Focusing on the arithmetic meanfirst, there are five areas where the indicator comes out larger than unity(call this “upper group”): in decreasing order they are Sectoral policies (wayabove all others), Common market, and Business relations (non-sectoral).Citizen and social protection, International trade and Money and fiscal areclose to average. The “lower group” includes, in increasing order from thebottom, Education, Environment and International Relations. Amongst sub-indicators for chapters with above average indicators, Agriculture and Healthemployment and social protection have the highest scores.
The other two types of mean provide some important qualifications tothis ranking. First, the index value of some categories and sub-categoriesfalls sharply if one moves from the arithmetic to the geometric mean, andeven more to the Leontief mean. For Money and macro policy this reflectsthe virtual absence of Court cases which, in turn, may be due to “youth” ofthis policy domain. We regard this result with some special caution, sincemacro policies systematically attract fewer Court cases than “micro” policies.For industry, this reflects the fact that the sections of the Treaties relatingto Industry (mainly Coal and Steel and Euratom Treaties) are not backedby corresponding secondary legislation and even less by Court activity. We

308
are inclined to interpret this as meaning that EU policy in this area is notreally operative. A similar conclusion can perhaps be drawn for Justice andmigration, whose geometric and Leontief scores are very low due to the limitednumber of Court cases.
Second, the position of International trade, Common market, Businessnon-sectoral and Citizen and social protection within the “upper group” isstrengthened further while that of Sectoral policies declines. In particular,the Health, employment and social protection sub-category becomes moreimportant. In the “lower group,” Education is reduced even further, whileInternational relations and Environment remain roughly unchanged.
Assessment
We now look at the findings of the quantitative analysis in the light of thenormative claims as to the desirable policy allocation suggested in the sec-tion on “domains of EU policy-making” To facilitate comparison, we haveinserted a summary of the evidence, coming from the aggregate indicatorsjust reviewed, in the earlier table. This yields Table 12.
In the last column of the table, we have highlighted in bold the areas inwhich we find relatively clearer evidence of discrepancy between our “nor-mative” priors and the evidence. We shall turn to these areas later. Let usfirst review the other ones, on which there appears to be broad consistencybetween the two.
The key historical functions of the EU—International trade and Commonmarket—seem on the whole to be properly allocated. The EU role is large onboth, and rightly so. While there seem to be no doubt whether the EU shouldhave a dominant role in these areas, there may be an issue of how such a role isperformed. Though the analysis of this paper does not have much to say in this,it is worth recalling two caveats. First, a free trade area is consistent with soundeconomic principles provided its external trade policy is also consistent withthem. Second, common market legislation should aim at ensuring effectivemobility of goods, services, capital and people in the Single Market area,but does not need to go beyond that. Top-down harmonization of nationalpractices can be equally at odds with economic principles as impediments totrade are.
Free trade promotes welfare by allowing countries and regions to specializewhile respecting local practices and preferences. In recent years, this principleseems to have been given increasing weight within the context of EU commonmarket policies.
Money and fiscal is a heterogeneous area, within which quite differentconsiderations apply. The existence of a single European currency requiresarea-wide centralization of monetary policy, including related areas such aspayments systems, money market infrastructures, etc. In the areas of budgets

309
Table 12. Desirable versus actual allocation of policy responsibilities
PreferredPolicy domains Externalities asymmetry Devolution EU rolea
1 International trade High Low EU/Global Large
2 Common market High Low EU/Global Large
3 Money and fiscal Med./High ? National/EU
3a Money and macro policy Medium
3b Taxation Medium
4 Education, research Low High Local/National Small
and culture
5 Environment Medium High National/EU Small
/High /Global
6 Business relations (sectoral) Low High National
6a Agriculture Large
6b Industry Small
6c Transport Small
7 Business relations High ? EU/Global Large
(non-sectoral)
8 International relations Medium/High Low National/EU Small
9 Citizen and social Mixed High Local/National
protection
9a Justice and migration Small
9b Health, employment and Large
social protection
9c Regional aid Mixed
aAccording to the findings of our preceding numerical analysis.
and taxation, the two current issues regard budget co-ordination (beyond theStability and Growth Pact) and tax harmonization. The relatively strong EUinvolvement in indirect taxation not reflected in our detailed numbers butwhich comes out of a more careful look at legislation and Court activity, inconjunction with plans for further co-ordination in other areas (e.g. capitalincome taxes) lacks an evident justification. On the whole, however, we seeno reason to regard an “average” degree of EU involvement in the overallMoney and fiscal field as inconsistent with our normative priors, nor do wesee reasons to extend co-ordination and centralization further in the fiscaldomain.
The EU involvement in Education, research and culture appears justifi-ably limited. Though significant emphasis is devoted to this in the Treaties,the effect of this is diluted in the overall indexes by the fact that the legisla-ture and Court activity is practically nil. We also noted that the EU devotes

310
a considerable amount of financial and staff resources to it, which seems un-called for. On the whole, our numbers suggest a case for strictly limiting theEU policy initiatives in the areas to the sole areas in which a strong externalityargument can be made.
We also find broad accordance with priors in the area of Business (non-sectoral) policies. There is here a good balance of Treaty basis, legislative ac-tivity, and Court support. The historical developments in our indicators clearlyshow that the decade of the 1990s has been decisive for the enhancement ofthe extent and intensity of EU action in this field, notably in the sub-areas ofcompetition and state-aid control. This progress appears to us fully consistentwith economic arguments, given, inter alias, the shortcomings of much of thenational legislation in this field and the increasingly continental and indeedglobal nature of business competition. Non-sectoral business relations are,indeed, a key complement of the common market if applied in a competitionenhancing way.
The first and most obvious area where our normative priors seem to conflictwith present arrangements is Agriculture. Mentioned only in broad terms inthe Treaties, this area jumps to the top of the list for EU involvement due toan intensive use of secondary legislation and to a more limited extent Courtactivity. The exceedingly high value of the semi-aggregate indicator of legis-lation intensity in agriculture (more than 10 times the average) simply reflectsthe fact (shown in Table 6) that over 40% of the EU secondary legislationtoday in force concerns agriculture. In addition to that, agriculture absorbsthe lion share of the EU financial resources. In light of our results, some fun-damental rethinking seems warranted. On the contrary, among the other areasof sectoral policy (Industry, Transport), we see no significant issue raised byour evidence.32
We also find inconsistencies in the area of Citizen and Social Protection.Except for some specific sub-categories, it is hard to see reasons against afairly decentralized scheme of policy management, delegated to local andnational authorities. The degree of EU involvement is instead surprisinglystrong, notably in the area of Health, employment and social protection. Thelatest Treaties have strengthened the base for EU social policies to include“human resource, social protection and social inclusion” (Maastricht) and em-ployment promotion (Amsterdam). Provisions like working hours and laborprotection regulation, layoff rules, co-determination at the workplace seemunnecessary in a single market framework and quite outside the scope ofwhat needs to be dealt with at the supranational level.33 By contrast, co-ordination on international crime and migration issues seems justified onthe basis of our considerations. Regarding regional aid, magnitudes involvedare moderate and Eurobarometer suggests support for this type of redis-tribution amongst EU citizens, though the economic case does not appearcompelling.

311
We find the judgement on the Environment chapter complex. On theone side, the presence of supra-national externalities calls for supra-nationalsolutions. However, the presence of national/local aspects points to potentialsynergy between different levels of governance, among which the EU shouldfind its place. According to our data, the EU involvement is very limited.
However, a general judgement on whether a more enhanced role of theEU is needed is nevertheless impossible. Judging from the EU treaties, themandate of the EU is rather general and by no means restricted to internationalenvironmental challenges. EU intervention seems to be justified also as meansto strengthen the Common Market through the creation of a leveled regulatoryplaying field. The literature dealing with this issue is somewhat ambiguous.It suggests that the role of the EU is somewhat stronger than our numberssuggest while it also confirms a strong standing of national governments inlegislation and implementation (Schwarz, 2001; Nugent, 1999). We, there-fore, argue for a cautious approach and EU involvement in this policy areamay usefully be developed further in areas where supra-national solutions areneeded.
The degree of EU-level involvement in the area of International relations israther limited, according to our summary data. The normative case is mixed.There are clear arguments for centralization in certain areas such as defenseor diplomacy, where economies of scale and specialization are likely to bean advantage. In other areas included in this category, such as foreign aid,such a case does not seem to exist, unless one sees foreign aid mainly as acomplement of foreign policy. Moreover, foreign policy itself may still displaynon-negligible differences in “tastes” across EU member countries.34
Conclusion
We have presented an empirical investigation aimed at determining the roleplayed by the European Union (European Council, Parliament, Commission,Court of Justice, etc.), in a number of policy areas. We compared our findingto the criteria derived by a normative model of policy allocation.
For this purpose we have constructed indicators of “policy involvement”based on the extent to which the EU role is mandated in the Treaties, regulatedthrough secondary legislation, or enforced via the European Court of Justice.We have then compared our results with priors concerning the desirable degreeof supranational allocation of policy responsibilities. We based these priorson three elements: the recent theoretical literature; our own views as to therelative advantages of centralization or decentralization of each policy area;the results from an opinion survey. These criteria pointed in the same generaldirection.
Our conclusion is that the allocation of EU policy prerogatives is partlyinconsistent with normative criteria for the proper assignment of policies at

312
different government levels. The EU is too involved in certain areas whereeconomies of scale seem low and heterogeneity of preferences high and notinvolved enough in others, which, in principle, should have the opposite char-acteristics.
Our research should be extended in several directions. First, a number ofempirical refinements seem useful. Our indicators are based on the assump-tion that the EU role can be gauged from its own acts alone, rather than alsoindirectly by the policies conducted by national states. But we know thatmuch EU legislation today constrains national legislation, especially via theuse of directives and decisions. If most national legislation is influenced bythe Union, via legislation or Court decisions, then our estimates of policyinvolvement are to be seen as (perhaps much) lower bounds of the actual roleof the EU. National legislation should be examined in order to clarify this.Moreover, the judgement of the “public good” nature of each policy chap-ters could be improved. This would require measuring the externalities andspillovers of policies across national states. One would also need to measureasymmetries of preferences over policies. It is hard to think of empirical anal-yses, however accurate, that can shed complete light on these questions, butan effort in this direction seems worthwhile. A wealth of indirect information(voting behavior, consumer preferences, survey measures more extensive thanthe ones explored here, etc.) could be exploited.
Second, if, as we argue, substantial discrepancies have emerged betweenthe Union’s policy action and optimality principles, then the next question:Why has this happened? Policy agendas are the result of bargaining processes,typically delegated to elected representatives or bureaucracies. Competing bu-reaucracies may not be willing to easily give up responsibilities, from whichthey derive prestige and influence.35 When different levels of governmentcompete over the allocation of responsibilities, several outcomes are possi-ble. For example, this game may lead to an excessive centralization in policyareas in which the supranational bureaucracy has been successful in gainingprerogatives. Or, on the contrary, national bureaucracies may be successful inresisting delegation of functions to the union. Examining the role of lobbyingand delegated bargaining in the policy allocation process within the Union isa potentially fruitful area of research (Dur & Roelfsema, 2002, made someprogress in this direction; Schwarz, 2001, provides a detailed conceptual dis-cussion and empirical application to environmental policies). Understandingthis “game” within competing European bureaucracies is the next logical stepin this line of research.
Acknowledgements
We thank Andres Manzanares for excellent research support and Susana Som-maggio for equally excellent editorial assistance. We received many helpful
313
comments from seminar participants at CFS (Frankfurt), the EU Commis-sion, the EPCS Meetings 2002, CESIfo (Munich), the American EnterpriseInstitute, Harvard, Duke, Pompeu Fabra, Universita di Venezia, University ofLeuven, NYU, University of Pennsylvania, Kiel Institute of World Economicsand the European University Institute. The views expressed in this paper donot involve the institutions to which the authors are affiliated.
Notes
1. A similar trade-off in a discussion of the size of countries is emphasized by Alesina andSpolaore (1997).
2. We use the term federation here in an etymological sense (collection of countries tied bya pact), while being aware that this word was deliberately excluded from the EU Treaties.
3. A useful reference is Nugent (1999). His vast bibliography covers the relevant politicalscience literature on the subject. See also McCormick (2000).
4. An exception is Pollack (2000), whose empirical investigation is similar to ours (but morelimited). His conclusions—that EU regulatory action has “continued its relentless growththroughout the last four decades”, whereas budget spending has been contained—are con-sistent with ours. Schwarz (2001) provides, inter alia, a quantitative assessment of EUinvolvement in environmental policies by looking at the number of legal acts and interestgroups.
5. Most of the documentation elaborated for this paper is available on the European Unionwebsite (http://europa.eu.int/). We are grateful to C. Nicasi of the EU Commission foradvising us on the use of Celex, our source of EU legal acts.
6. This means implicitly assuming that resources devoted to administration can be allocatedto the domains pro-quota. This is a convenient, but not necessarily a good assumption. Insome instances it is probably not justified, since as we will see below the policy productionprocess seems to be more resource-efficient in certain areas than in others.
7. An Annexture table explains in detail how all the EU policy actions have been groupedinto the 9 categories.
8. This is one of the rare cases where the Commission has advocated decentralization; seeEuropean Commission (2000). An opposite view is taken by Danthine, Giavazzi, Vives,von Thadden (1999).
9. Padoa-Schioppa (1987).10. See Mundell (1961) for the path breaking contribution and Alesina and Barro (2002) for
recent work.11. Alesina, Barro and Tenreyro (2002).12. A critique of EU fiscal co-ordination (beyond the Stability and Growth Pact) is contained
in Alesina et al. (2001c). On the tax side, harmful tax competition is often cited as theeconomic rationale for EU involvement. But it is not clear whether this should be limitedto a desirable prevention of fraud and evasion or whether this should imply a much lessobvious harmonization of tax provisions across countries.
13. It should be noted, however, that defence is already largely part of the supranational NATOumbrella.
14. See all technical details in: http://europa.eu.int/comm/dg10/epo/eb.html.15. The sub-areas include Eurobarometer questions as follows (in italics, name of category in
brackets): immigration policy, political asylum, accepting refugees, exploitation of humanbeings (migration); police, justice, urban crime, juvenile crime (crime-local); organised

314
crime, drugs (crime-global); health employment, and social protection (same category);regional aid (same category).
16. The relevant question only relates to the desirability of a single monetary policy and notto any other macro/tax related issues.
17. No clear normative prescriptions can be drawn from theory about the proper allocationof cross-country redistribution policies. Recent empirical analyses have questioned theeffectiveness of EU regional policies in fostering convergence (Boldrin & Canova, 2001).
18. For a more complete and extensive discussion see Peterson and Bomberg (1999) andNugent (1999) and the references cited there.
19. An example was the set up, in 1979, of the European Monetary System, as a result of aninformal agreement between heads of state.
20. See Issing, Gaspar, Angeloni and Tristani (2001).21. The Common Market project started out as a White Paper before it became a binding
strategy in the Single European Act. So-called Green Papers are Commission reports thataim at influencing the public debate.
22. For simplicity, Court of Justice for us is intended to include also the Court of First Instance.Created in 1989, the latter has progressively complemented the main Court by issuing firstinstance judgements on a number of relatively simpler cases.
23. See Issing et al. (2001). The legal profiles of the ECB are examined in Zilioli and Selmayr(1999).
24. Due to limited availability of historical data we could not sub-divide the Money and fiscaland the Citizen and social protection categories for these tables.
25. The full centralization is reflected also in the fact that trade negotiations in the context ofthe WTO are conducted by the EU rather than be national delegations.
26. By comparison, in Germany, the Parliament, Bundestag and Bundesrat, employ a total of2300 and 190 staff respectively.
27. For a more detailed discussion of expenditure composition in EU and other industri-alized countries see Alesina, Glaeser and Sacerdote (2001) and Tanzi and Schuknecht(2000).
28. For example, the semi-aggregate Treaty indicator under category 3, money, macro policyand taxation is 0.75. As all Treaty provisions concern money and macro policy and nonetaxation, the former shows a sub-indicator of 1.5 whereas taxation receives a value of 0(hence an average of 0.75).
29. On the basis of Table 10, including sub-categories, the data are as follows: standard devia-tion of the three columns, in order: 2.1, 2.6 and 1.1. The correlation coefficient between thefirst two is equal to −0.16, between the second two 0.58. The correlation between Treatyand Court is −0.19.
30. This normalization implies that, for example, the arithmetic mean for “Common market” isadjusted from 1.32 (following the formula) to 1.41, given that arithmetic means otherwisedo not average 1.
31. For example, consider No 2, Common market. The arithmetic mean of Treaty and Legisla-tion is 1.26 + 0.63 = 0.945. Multiplied by 1.83 Court and taking square root gives 1.315,that divided by the mean of all nine major categories (0.93) yields 1.41.
32. The Treaties provide for some common transport policy, concerning e.g. the provision ofsupra-national public goods (cross-border roads), but this has not developed very far.
33. For reasons similar to ours, Boeri (2000) argues in favor of maintaining unanimity for EUdecisions on social policy.
34. See Alesina and Dollar (2000) on this point.35. See Niskanen (1971). Nugent (1999) provides a historical-institutional account of the
evolution of EU institutions and their involvement in decision-making.

315
Statistical Appendix
All data relating to the number of legislation acts issued and in force havebeen gathered from the European Commission website Celex. This website(http://europa.eu.int/celex/) provides access to all European legislation andenables the user to search through them using a variety of criteria. In particu-lar, Celex classifies documents according to sub-categories which have beenregrouped to obtain our classification in policy chapters.
Data on Court cases were retrieved from the European Court of Justice website search facility under http://curia.eu.int/jurisp/cgi-bin/form.pl?lang=en.Subject categories were reclassified to make them consistent with our policychapters.
The following search patterns have been used to obtain our data:Table 3: Number of Directives, Decision and Regulations in L series re-
trieved by means of a standard search, second menu (“legislative acts”).The historical data on EU expenditures were obtained from the publication
Vademecum 2000 “The facts in figures” by the European Commission underhttp://europa.eu.int/comm/budget/pdf/budget/syntchif2001/en.pdf.
Table 4: All numbers were obtained by means of “standard” searches withrestrictions by date and subject. Legislative acts were then classified accordingto their content (see Annexure table).
Table 5: Numbers on international agreements and recommendations andopinions were obtained by means of “expert” searches with restrictions byform, subject and date. White and Green Papers were obtained from EU website. Non-binding acts and documents were then classified according to theircontent into the defined policy chapters (see Annexure table).
Table 6: Articles in the Treaties were classified according to their content(see Annexture table).
Table 7: All numbers were obtained by means of “expert” searches with re-strictions by form, date and subject. Legislative acts were classified accordingto their content (see Annexture table).
Table 8: Court case numbers were retrieved from the EU Court of Justicewebsite. Court cases were classified according to their content (see Annexturetable).
Table 9: Numbers on international agreements and recommendations andopinions were obtained by means of “expert” searches with restrictions byform, subject and date. White and Green Papers were obtained from EU website. They were classified according to their content (see Annexture table).
The staff numbers broken down by policy chapters were provided by theDG-Personnel and Administration of the European Commission. It regardsthe staff as of 01/03/2001, including temporary posts. The EU administra-tive expenditures (4703.7 mil. EUR) have been allocated to the policy chap-ters/administration/other institutions pro-quota according to the staff size.

316A
ppen
dix
Tabl
e:So
urce
sfo
rm
easu
ring
polic
yin
tens
ity
Tre
aty
ofth
eE
urop
ean
Stee
lT
reat
yon
the
Tre
aty
ofth
eE
urop
ean
and
Coa
lE
urop
ean
Ato
mic
Eur
opea
nC
ourt
ofJu
stic
eC
omm
uniti
esT
reat
yE
nerg
yC
omm
unity
Uni
onC
elex
cate
gori
esw
ebsi
teca
tego
ries
1In
tern
atio
nalt
rade
Art
icle
s23
–30,
131–
135,
184,
185
Inte
rnat
iona
lagr
eem
ents
etc.
11.3
0.10
–30,
11.4
,11
.6,1
1.70
.30
Com
mer
cial
polic
y,A
ssoc
.of
Ove
rsea
sC
ount
ries
&Te
rrito
ries
Goo
ds/c
usto
ms
dutie
s02
free
mov
emen
tof
good
s
2C
omm
onm
arke
tA
rtic
les
31,3
9–50
,56
–69,
87–9
7In
tern
alm
arke
trel
ated
legi
slat
ion
13.3
Com
mun
ityT
rade
Mar
k,ap
prox
imat
ion
ofla
ws
Serv
ices
/est
ablis
hmen
trig
ht06
free
dom
topr
ovid
ese
rvic
es
Cap
ital
10.4
free
mov
emen
tof
capi
tal
Peop
le20
.1fr
eem
ovem
ento
fpe
rson
s
3M
oney
and
fisca
l
3aM
oney
and
mac
ropo
licy
Art
icle
s98
–115
10.2
,10.
1,10
.3ec
onom
icpo
licy
3bTa
xatio
n09
taxa
tion
4E
duca
tion,
rese
arch
and
cultu
reA
rtic
les
163–
173,
149–
151
16re
sear
ch,i
nfor
mat
ion,
educ
atio
n,st
atis
tics
5E
nvir
onm
ent
Art
icle
s17
4–17
615
.1(f
rom
envi
ronm
enta
ndco
nsum
ers)
6Se
ctor
al
6aA
gric
ultu
rean
dfis
heri
esA
rtic
les
32–3
8
Agr
icul
ture
03E
CSC
,EA
EC
,agr
icul
ture
Fish
erie
s04
6bIn
dust
ryan
den
ergy
Art
icle
157
Art
icle
s1–
6,A
rtic
les
1–2,
46–7
54–
51
(Con
tinu
edon
next
page
)

317A
ppen
dix
Tabl
e:(C
onti
nued
) Tre
aty
ofth
eE
urop
ean
Stee
lT
reat
yon
the
Tre
aty
ofth
eE
urop
ean
and
Coa
lE
urop
ean
Ato
mic
Eur
opea
nC
ourt
ofJu
stic
eC
omm
uniti
esT
reat
yE
nerg
yC
omm
unity
Uni
onC
elex
cate
gori
esw
ebsi
teca
tego
ries
Ene
rgy
12en
ergy
Indu
stri
alpo
licy
(ste
elet
c.)
13ex
cept
13.3
indu
stri
alpo
licy
6cT
rans
port
Art
icle
s70
–80
07tr
ansp
ort
7B
usin
ess
non-
sect
oral
Art
icle
s51
–55,
81–8
6
Und
erta
king
sla
w17
law
rela
ted
toun
dert
akin
gs,
inte
llect
ualp
rope
rty
Com
petit
ion
08ex
cept
8.6
com
petit
ion
Subs
idie
s8.
6st
ate
aid
8In
tern
atio
nalr
elat
ions
and
fore
ign
aid
(with
out
inte
rnat
iona
ltra
de)
Art
icle
s17
7–18
3A
rtic
les
11–2
8
Mul
tilat
eral
co-o
pera
tion,
emba
rgos
11.1
,11.
2,11
.30.
40,
11.3
0.50
,11.
30.6
0,11
.30.
70
exte
rnal
rela
tions
,new
acce
ssio
ns
Fore
ign
polic
y,de
fenc
e18
com
mon
fore
ign
and
secu
rity
polic
y
Fore
ign
aid
11.5
,11.
7ex
cept
11.7
0.30
9C
itize
n&
soci
alpr
otec
tion
9aJu
stic
ean
dm
igra
tion
Art
icle
s15
4–15
6,18
6–18
8A
rtic
les
29–4
219
,20.
2ju
stic
ean
dho
me
affa
irs,
Eur
opea
nci
tizen
ship
9bH
ealth
,em
ploy
men
tand
soci
alpr
otec
tion
Art
icle
s12
5–13
0,13
6–14
8,15
2–15
315
.2,1
5.3,
15.4
,05
(fro
men
viro
nmen
tand
cons
umer
s),s
ocia
lpol
icy,
econ
omic
and
soci
alco
hesi
on
9cR
egio
nala
idA
rtic
les
158–
162
14re
gion
alpo
licie
s
Not
e:Po
licy
chap
ters
,sub
-cha
pter
san
dco
rres
pond
ing
cate
gori
es/c
hapt
ers
inE
urop
ean
Tre
atie
s,C
elex
data
base
ofle
gisl
atio
n,an
din
the
Eur
opea
nC
ourt
ofJu
stic
ew
ebsi
te.

318
References
Aghion, P., Alesina, A., & Trebbi, F. (2002). Endogenous political institutions, mimeo.Alesina, A., Angeloni, I., & Etro, F. (2001a). The political economy of international unions,
CEPR Working Paper n. 3117.Alesina, A., Angeloni, I., & Etro, F. (2001b). Institutional rules for federations, NBER Working
Paper n. 8646.Alesina, A., & Barro, R. (2002). Currency unions, Quarterly Journal of Economics, 117(2) ,
409–436.Alesina, A., Barro, R., & Tenreyro, S. (2002). Optimal currency areas, NBER Macroeconomics
Annual 17.Alesina, A., Blanchard, O., Gali, J., Giavazzi, F., & Uhlig, H. (2001c). Defining a macroe-
conomic framework for the Euro area Monitoring European Integration 3, Center forEconomic Policy Research, London.
Alesina, A., & Dollar, D. (2000). Who gives foreign aid to whom and why, Journal of EconomicGrowth, 5, 33–36.
Alesina, A., Glaeser, E., & Sacerdote, B. (2001). Why doesn’t the US have a European-stylewelfare state? Brookings Papers on Economic Activity 2.
Alesina, A., & Spolaore, E. (1997). On the number and size of nations, The Quarterly Journalof Economics.
Alesina, A., & Wacziarg, R. (1999). Is Europe going too far? Carnegie- Rochester Conferenceon Public Policy.
Boeri, T. (2000). Social Europe: Dramatic visions and real complexity, CEPR Discussion PaperNo. 2371
Boldrin, M., & Canova, F. (2001). Inequality and convergence: Reconsidering European re-gional policies, Economic Policy 32.
Danthine, J. P., Giavazzi, F., Vives, X., & von Thadden E. L. (1999). The future ofEuropean banking. Monitoring European Integration 9, Center for Economic PolicyResearch, London.
Dur, R., & Roelfsema, H. (2002). Why does centralisation fail to internalise policy externali-ties?, Tinbergen Institute Discussion Paper No. 02-056/3.
European Commission (2000). Report on financial stability, Economic Paper No.143.
Issing, O., Gaspar, V., Angeloni, I., & Tristani, O. (2001). Monetary policy in the Euro-area, strategy and decision-making at the European central bank. Cambridge: CambridgeUniversity Press.
McCormick, J. (2000). The European Union, politics and policies (2nd ed.) (pp. xiii, 208).Boulder, CO: Westview Press.
Mundell, R. (1961). Theory of optimum currency areas, The American Economic Review.NATO (2001). NATO Handbook, Brussels.Niskanen, W. (1971). Bureaucracy and representative government. New York: Wiley.Nugent, N. (1999). The government and politics of the European Union. Durham, NC: Duke
University Press.Oates, W. (1999). An essay on fiscal federalism, Journal of Economic Literature.Padoa-Schioppa, T. (1987). Efficiency, stability and equity. Oxford: Oxford University
Press.Peterson, J., & Bomberg, E. (1999). Decision-making in the European Union. London:
Macmillan.Pollack, M. A. (2000). The end of creeping competence? EU policy-making since Maastricht.
Journal of Common Market Studies, 38, 519–538.

319
Schwarz, S. (2001). Die Europaeisierung der Umweltpolitik: Politisches Handeln im Mehrebe-nensystem, Berlin: Sigma.
Tanzi, V., & Schuknecht, L. (2000). Public Spending in the 20th Century. A Global Perspective,Cambridge: Cambridge University Press.
Zilioli, C., & Selmayr, M. (1999). The European Central Bank, its system and its law, EURE-DIA.