Embed Size (px)
Citation preview

1
What Does It Mean to be Ranked a “High” or “Low” Value-Added Teacher?
Observing Differences in Instructional Quality Across Districts
David Blazar
Erica Litke
Johanna Barmore
Claire Gogolen
Harvard Graduate School of Education
National Center for Teacher Effectiveness
50 Church Street, 3rd Floor
Cambridge, MA 02138
The research reported here was supported in part by the Institute of Education Sciences, U.S. Department of Education (Grant R305C090023) to the President and Fellows of Harvard College
to support the National Center for Teacher Effectiveness. Additional support comes from the National Science Foundation (Grant 0918383). The opinions expressed are those of the authors and do not represent views of the Institute or the U.S. Department of Education. We thank Mark
Chin, Cassandra Guarino, Heather Hill, and John Papay for their comments on this paper.

2

3
Abstract
Education agencies are evaluating teachers using student achievement data. However,
very little is known about the comparability of test-based or “value-added” metrics across
districts and the extent to which they capture variability in classroom practices. Drawing on data
from four urban districts, we find that teachers are categorized differently when compared within
versus across districts. In addition, analyses of scores from two observation instruments, as well
as qualitative viewing of lesson videos identify stark differences in instructional practices across
districts among teachers who receive similar within-district value-added rankings. Exploratory
analyses suggest that these patterns are not explained by observable background characteristics
of teachers and that factors beyond labor market sorting likely play a key role.
Keywords: teaching quality, teacher effectiveness, value-added models, instruction
4
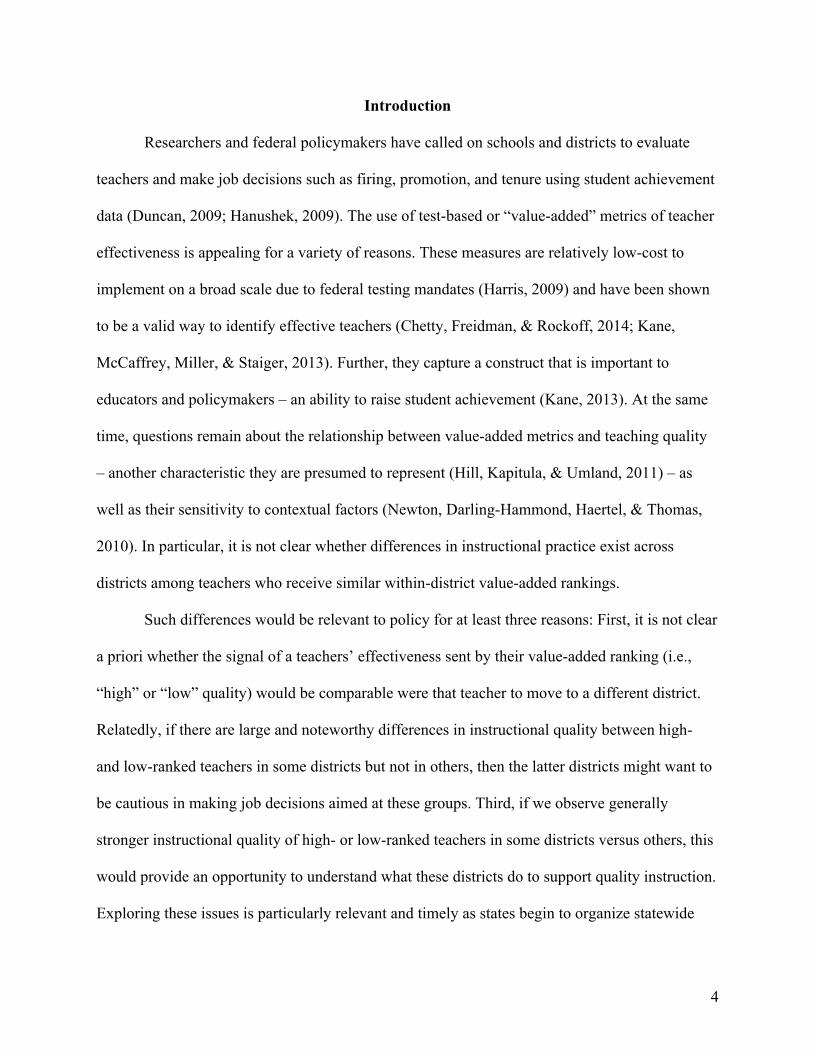
Introduction
Researchers and federal policymakers have called on schools and districts to evaluate
teachers and make job decisions such as firing, promotion, and tenure using student achievement
data (Duncan, 2009; Hanushek, 2009). The use of test-based or “value-added” metrics of teacher
effectiveness is appealing for a variety of reasons. These measures are relatively low-cost to
implement on a broad scale due to federal testing mandates (Harris, 2009) and have been shown
to be a valid way to identify effective teachers (Chetty, Freidman, & Rockoff, 2014; Kane,
McCaffrey, Miller, & Staiger, 2013). Further, they capture a construct that is important to
educators and policymakers – an ability to raise student achievement (Kane, 2013). At the same
time, questions remain about the relationship between value-added metrics and teaching quality
– another characteristic they are presumed to represent (Hill, Kapitula, & Umland, 2011) – as
well as their sensitivity to contextual factors (Newton, Darling-Hammond, Haertel, & Thomas,
2010). In particular, it is not clear whether differences in instructional practice exist across
districts among teachers who receive similar within-district value-added rankings.
Such differences would be relevant to policy for at least three reasons: First, it is not clear
a priori whether the signal of a teachers’ effectiveness sent by their value-added ranking (i.e.,
“high” or “low” quality) would be comparable were that teacher to move to a different district.
Relatedly, if there are large and noteworthy differences in instructional quality between high-
and low-ranked teachers in some districts but not in others, then the latter districts might want to
be cautious in making job decisions aimed at these groups. Third, if we observe generally
stronger instructional quality of high- or low-ranked teachers in some districts versus others, this
would provide an opportunity to understand what these districts do to support quality instruction.
Exploring these issues is particularly relevant and timely as states begin to organize statewide
5
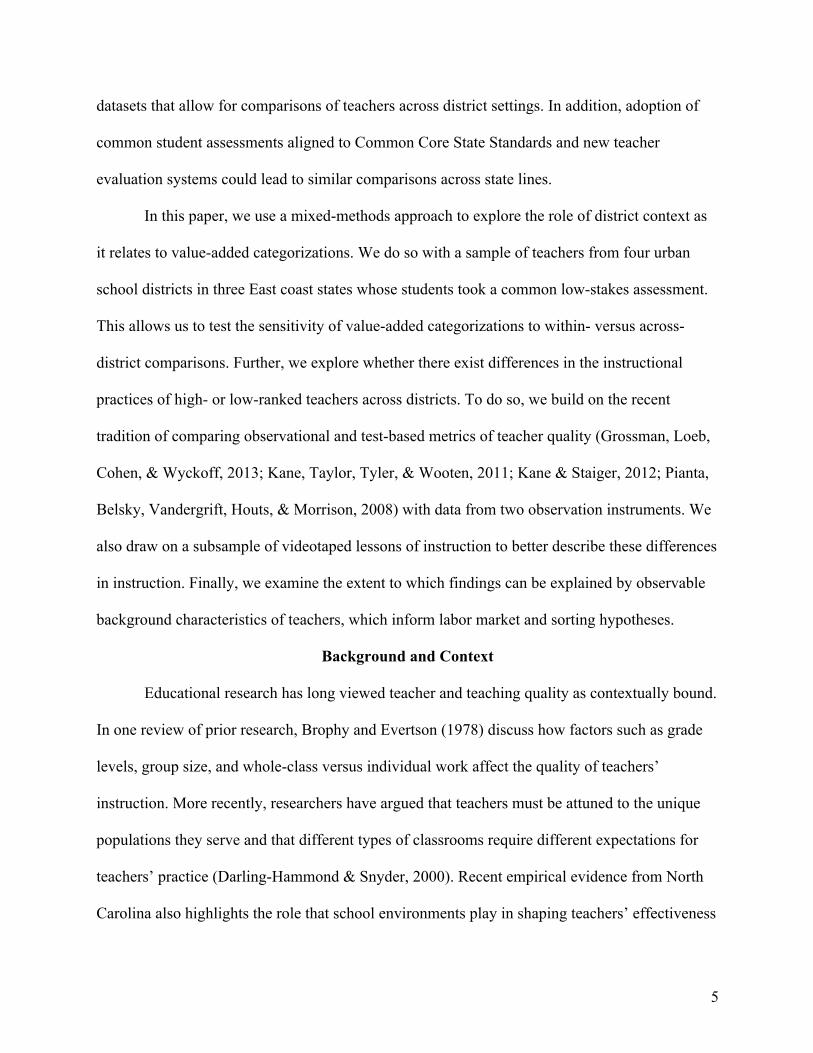
datasets that allow for comparisons of teachers across district settings. In addition, adoption of
common student assessments aligned to Common Core State Standards and new teacher
evaluation systems could lead to similar comparisons across state lines.
In this paper, we use a mixed-methods approach to explore the role of district context as
it relates to value-added categorizations. We do so with a sample of teachers from four urban
school districts in three East coast states whose students took a common low-stakes assessment.
This allows us to test the sensitivity of value-added categorizations to within- versus across-
district comparisons. Further, we explore whether there exist differences in the instructional
practices of high- or low-ranked teachers across districts. To do so, we build on the recent
tradition of comparing observational and test-based metrics of teacher quality (Grossman, Loeb,
Cohen, & Wyckoff, 2013; Kane, Taylor, Tyler, & Wooten, 2011; Kane & Staiger, 2012; Pianta,
Belsky, Vandergrift, Houts, & Morrison, 2008) with data from two observation instruments. We
also draw on a subsample of videotaped lessons of instruction to better describe these differences
in instruction. Finally, we examine the extent to which findings can be explained by observable
background characteristics of teachers, which inform labor market and sorting hypotheses.
Background and Context
Educational research has long viewed teacher and teaching quality as contextually bound.
In one review of prior research, Brophy and Evertson (1978) discuss how factors such as grade
levels, group size, and whole-class versus individual work affect the quality of teachers’
instruction. More recently, researchers have argued that teachers must be attuned to the unique
populations they serve and that different types of classrooms require different expectations for
teachers’ practice (Darling-Hammond & Snyder, 2000). Recent empirical evidence from North
Carolina also highlights the role that school environments play in shaping teachers’ effectiveness

6
over time (Kraft & Papay, 2014). Moving outside of schools, others suggest that districts likely
play a substantial role in molding teacher practice by implementing specific policies and reforms
in ways they deem best for their student populations (Spillane, 2000).
Recently, however, initiatives from federal policymakers that emphasize common
standards and assessments have shifted the discussion on teacher and teaching quality away from
local contexts toward a broader U.S. framework. For example, the push for states to implement
Common Core State Standards in reading and mathematics moves toward a common benchmark
for student performance (National Governors Association, 2010; Porter, McMaken, Hwang, &
Yang, 2011). Similarly, nationwide initiatives such as Race to the Top and waivers for No Child
Left Behind that require the use of student achievement data to identify the most- and least-
effective teachers (Duncan, 2009; Hanushek, 2009) also imply a coalescing common
understanding that effective teachers are those who are able to raise student achievement.
Despite movement towards common measurement of teacher quality based on student
achievement, little is known about the comparability of test-based and value-added evaluation
metrics across contexts. Recent analyses exploring the validity and reliability of value-added
scores indicates that they are not sensitive to an array of student- and peer -level characteristics –
besides prior student achievement – that can be controlled for in the models themselves (Chetty,
Friedman, & Rockoff, 2014; Kane, McCaffrey, Miller, & Staiger, 2013). However, they are
sensitive to schools. Goldhaber and Theobald (2012) demonstrate that, of teachers initially
ranked in the bottom quintile of value-added when controlling for just student- and class-level
covariates, over 11% move out of this category when the model also controls for school fixed
effects, which restricts the comparison group to other teachers within the same school. As
teacher quality varies widely across schools, a teacher considered to be low quality when
7
compared to all teachers in a given sample (e.g., a district) may move up the rankings when only
compared to other teachers in the same school. While school fixed effects models generally are
not used in practice when evaluating teachers, these findings highlight the role that school
context can play when ranking teachers in this way.
A related area of inquiry that we believe is particularly relevant to policy – and for which
we have not found any discussion in the academic literature – is the comparability of teacher
categorizations from value-added models across district contexts. Prior research suggests that
there are several reasons why value-added categorizations may be sensitive to the district in
which teachers are measured. First, teachers are not randomly assigned to districts, with many
factors such as proximity to home, district wealth, and student composition influencing the
choice of where to teach (Boyd, Lankford, Loeb, & Wyckoff, 2004; Guarino, Santibañez, &
Daley, 2006; Hanushek, Kain, & Rivkin, 2004). As such, it is reasonable to assume that, like
schools, some districts may have a higher concentration of effective teachers, while others have a
higher concentration of ineffective ones. Ranking teachers within districts may mask this
variability. Second, teachers work in district contexts in which the resources available to them,
such as curricula and professional development, the strengths and needs of the students in their
classrooms, as well as the ways in which districts implement reform initiatives, likely differ and
influence instructional quality (Hill, Kapitula, & Umland, 2011; Spillane, 2000). For example,
use of a certain set of curriculum materials and professional development provided to teachers
around that curriculum in one district may contribute to generally higher instructional quality
than that in another district without such resources and strong support.
This leads us to ask three related research questions: First, are value-added
categorizations sensitive to district context? Second, when teachers are ranked within districts,

8
are there discernable differences in the nature and quality of instruction of high- or low-ranked
teachers across districts? Third, if differences do exist, is there evidence that these patterns are
related to teacher sorting to districts?
To date, exploring these possibilities has been challenging for two reasons. One stems
from the nature of standardized testing. Up until recent adoption of Common Core State
Standards assessments, states have administered different high-stakes achievement tests, making
it impossible to compare value-added scores across these lines. The question of the sensitivity of
value-added estimates on common low-stakes assessments across contexts also is of interest
given evidence that teachers are ranked quite differently depending on the test of student
achievement used in a given analysis (Lockwood, McCaffrey, Hamilton, Stecher, Le, &
Martinez, 2007; Papay, 2011). A second challenge is the fact that, with only a few exceptions
(e.g., the Measures of Effective Teaching project, TIMSS Vide Study), research projects
generally have not been able to describe the instructional practice of teachers in different district
settings due to lack of broad-scale observational data. We are able to address these challenges
with a unique sample and dataset.
Methods
Data
Data used in this paper come from a large-scale research project conducted by the
National Center for Teacher Effectiveness, which took place in fourth- and fifth-grade
classrooms across four school districts (henceforth numbered 1 through 4) from three states in
the 2010-11 and 2011-12 school years. Our analyses focus on four main data sources.
District Administrative Records. The first data source is administrative records,
including teacher-student links, demographic information, and state test scores, for all fourth-

9
and fifth-grade students in each of the participating districts. These data span the two years of the
study and up to two additional years prior. Teacher-student links were verified for all study
participants based on class rosters provided by these teachers. Verification was not possible for
other teachers whom we include in value-added models but were not part of the videotape study.
Low-Stakes Common Assessment. The second related data source is a low-stakes math
assessment developed by the project and administered to all students across the four districts (see
Hickman, Fu, & Hill, 2012). Students took this test in the fall and spring of each of the two
school years (see Note 1). Validity evidence indicates internal consistency reliability of 0.82 or
higher for each form across the relevant grade levels and school years. Coding of items from this
assessment and the four state standardized assessments (Authors, 2013) indicate that it has a
similar level of average cognitive demand – as assessed using the Surveys of Enacted Curriculum
framework (Porter, 2002) – as the assessment in Districts 1 and 2, which are located in the same
state. The cognitive demand of these assessments also is higher than those in Districts 3 and 4.
Both the common assessment and the state test in Districts 1 and 2 asks students to solve non-
routine problems, including looking for patterns and explaining their reasoning, much more
frequently than the state assessments in Districts 3 and 4 where items tend to focus on
memorization and procedural tasks. In addition, the former assessments includes upwards of
40% short response and open-ended questions, compared to only multiple-choice items on the
latter assessments. The fact that state standardized tests differ widely in their content, level of
cognitive demand, and format is reason that a common assessment such as the one utilized here
is necessary to compare teachers across contexts.
Mathematics Lessons. The third data source is videotaped lessons of mathematics
instruction. As described by Authors (2014), lessons were captured over a two-year period, with

10
three lessons per teacher, on average, per year. Capture occurred with a three-camera, unmanned
unit; site coordinators turned the camera on prior to the lesson and off at its conclusion. Most
lessons lasted between 45 and 60 minutes. Teachers were allowed to select the dates for
videotaping in advance. Project managers only required that teachers select a typical lesson and
exclude days on which students were taking a test. Although it is possible that these lessons are
not representative of teachers’ general instruction, they did not have any incentive to select
lessons strategically as no rewards or sanctions were involved with data collection. Analyses
from the Measures of Effective Teaching project also indicate that teachers are ranked almost
identically when they choose lessons to be observed themselves compared to when lessons are
chosen for them (Ho & Kane, 2013).
We drew on these videotaped lessons for two purposes. First, we relied on pre-existing
instructional quality scores generated by a set of trained raters who scored these lessons on two
established observational instruments, the Mathematical Quality of Instruction (MQI), focused
on mathematics-specific practices, and the Classroom Assessment Scoring System (CLASS),
focused on general teaching practices. Both instruments have been found to support valid
inferences regarding the quality of teachers’ instruction, including moderately high levels of
inter-rater reliability and predictive reliability based on observation of three or more lessons by
two raters (Bell, Gitomer, McCaffrey, Hamre, & Pianta, 2012; Hill, Charalambous, & Kraft,
2012; Kane & Staiger, 2012), as well as moderate relationships to changes in student
achievement (Author, 2014; Kane & Staiger, 2012; Pianta et al., 2008). In addition, we observed
lessons as part of qualitative analyses. This allowed us to illustrate and triangulate findings from
our quantitative analyses.

11
Given the complex nature of score generation for the observation instruments, we
describe this process in detail. For the MQI, two raters watched each lesson and scored teachers’
instruction on 17 items for each seven-and-a-half minute segment on a scale from Low (1) to
High (3), with higher scores indicating higher quality. For the CLASS, one rater watched each
lesson and scored teachers’ instruction on 11 items for each fifteen-minute segment on a scale
from Low (1) to High (7). For both instruments, raters had to complete an online training, pass a
certification exam, and participate in ongoing calibration sessions. These raters were not
provided any information on teachers, such as their district or prior value-added score.
While the MQI and CLASS together identify seven domains of instructional quality, we
narrowed these to a parsimonious list of four based on theory and factor analyses (Authors,
2014). These include: Ambitious Mathematics Instruction (combining the Richness, Working
with Students, and Common Core Aligned Student Practices domains from the MQI), which
focuses on the level of inquiry oriented instruction and activities that occur in the classroom (e.g.,
linking between multiple representations, solving a problem in multiple ways, student and
teacher explanations, teachers’ use of student ideas); Mathematical Errors and Imprecisions,
which assesses the correctness of the content taught; Classroom Emotional Support, which
captures teachers’ interactions with students and the overall climate in the classroom; and
Classroom Organization, which details teachers’ use of behavior management and classroom
productivity. The first two domains encompass elements of the MQI, and the latter two
encompass elements of the CLASS. Though the MQI assigns higher scores for Mathematical
Errors and Imprecisions in cases where teachers make more errors in their instruction, we
reverse coded this to match the valence of the other domains; therefore, higher scores indicate
greater clarity and precision in instruction. Given that teachers provided different numbers of

12
lessons to the project, we utilized empirical Bayes estimation to shrink scores back toward the
mean based on their precision (see Raudenbush & Bryk, 2002) (see Note 2). Final scores were
standardized within the sample.
Teacher Survey. Fourth, we collected data on teachers’ background and personal
resources for teaching in a survey administered at the beginning of each academic year. Survey
items included demographic information, years teaching math, route to certification (i.e.,
traditional, alternative, no certification), other specialized certifications (i.e., elementary math),
whether or not the teacher has a master’s degree (in any subject), whether or not the teacher
majored or minored in math in college, and whether or not the teacher received a bachelor’s
degree in education. In addition, the survey asked about the amount of undergraduate or graduate
coursework in math, math content for teachers, and methods for teaching mathematics (1=No
Classes, 2=One or two classes, 3=Three to Five Classes, 4=Six or More Classes). Finally, there
was a test of teacher’ mathematical content knowledge based on items from the Learning
Mathematics for Teaching (Hill, Schilling, & Ball, 2004) and Massachusetts Test for Educator
Licensure assessments. Teacher scores were generated by IRTPro software and were
standardized in these models, with a marginal reliability of 0.85.
Sample
Given that a key component of this project was collection of videotaped lessons of
instruction, participants with observational data consist of a non-random sample of schools and
teachers who agreed to participate. During recruitment, project managers presented study
information to schools based on district referrals and size; they required a minimum of two
teachers at each of the sampled grades. These procedures were similar across districts. Of
eligible teachers, 56% agreed to participate, also similar across districts. The full sample of

13
teachers for whom we have both observation and test score data includes 220, with 44, 37, 32,
and 107 teachers from Districts 1 through 4, respectively. This sample excludes teachers who
taught self-contained classes for students with disabilities or students with limited English
proficiency (i.e., classes with 50% of students with this designation). We made this exclusion as
we intend findings to generalize to typical classrooms; the excluded classrooms may vary as to
the nature of student needs in ways that are more difficult to generalize or are less typical.
In Table 1, we present descriptive statistics on sample teachers and their students. On
average, teachers in District 1 have roughly ten years of teaching experience, compared to twelve,
nine, and eleven years for Districts 2, 3, and 4, respectively. District 3 also has a larger share of
teachers certified through alternative routes. Further, relative to other teachers in the study, those
in Districts 3 score below average on the test of mathematical content knowledge. Students in
this district also score below those from Districts 1 and 4, on average, but similar to those in
District 2 on the baseline test of mathematical knowledge that is common across districts.
INSERT TABLE 1 HERE
Related analyses from these same data and communication with district coordinators
provide additional information on these districts as a whole (see Authors, 2014). Districts 1 and 2,
which are in the same state, take the same standardized assessment, and utilize the same set of
curriculum materials with a strong focus on inquiry-oriented activities. According to district
coordinators, District 1 has paired these materials with intensive efforts to provide professional
development around ambitious instruction, focused on such practices as identifying multiple
solution pathways for a single problem. In District 3, there have been recent, intensive efforts to
implement a high-stakes teacher evaluation system but little focus specifically on mathematics
instruction. Teachers in District 4 reported using curricula materials considered to be more

14
procedural in nature than those in Districts 1 and 2. Additionally, the District 4 coordinator
reported a moderate amount of standards-aligned teacher professional development, as compared
to those in the other three districts.
Data Analytic Strategy
Estimating Teachers’ Value-Added Scores. Our research questions ask about the extent
to which teachers’ value-added categorizations are sensitive to within- versus across- district
comparisons and whether the instructional quality of high- or low-ranked teachers differs across
districts. In order to answer these questions, we began by specifying a standard value-added
model similar to those used by Kane and colleagues (2013) in the Measures of Effective
Teaching project and by Chetty, Friedman, and Rockoff (2014):
𝐴!" = 𝛼(𝑓(𝐴!"!!))+ 𝛾𝑋!" + 𝜏𝑃!" + 𝜑𝑆!" + 𝜔!" + 𝛿! + 𝑢! + 𝜀!" (1)
The outcome of interest was current-year student test scores, 𝐴!", for student i in year t. Test
scores were modeled as a function of students’ prior achievement, 𝐴!"!!. We controlled for
vectors of student covariates, 𝑋!"; peer covariates, 𝑃!", for all students within classroom c at time
t; and school covariates, 𝑆!", for all students in school s at time t. We also included grade-by-year
fixed effects, 𝜔!", to account for scaling of tests at this level. Class-level random effects, 𝛿!,
were used to account for clustering of observations within each classroom. Finally, we predicted
random effects for each teacher, 𝑢!, as their value-added score. These scores were generated
using all years of available test-score data to increase the precision of our value-added estimates
(Goldhaber & Hansen, 2012; Koedel & Betts 2011; Schochet & Chiang, 2013) (see Note 3).
Although students in this sample were not randomly assigned to teachers, others have found that
similar value-added models identify common sets of effective and ineffective teachers in
experimental and non-experimental settings (Kane, McCaffrey, Miller, & Staiger, 2013).

15
In order to test the sensitivity of value-added categorizations to within- versus across-
district comparisons, it was important to use a test of student achievement common across
districts. Therefore, to answer our first research question, we utilized the achievement test
administered by the project to all students in the study. First, we calculated value-added scores
using equation (1), ranking teachers across all districts. Second, by estimating equation (1) but
adding district fixed effects, we also calculated a value-added score that ranked teachers within
their own district. Then, we examined the extent to which categorizations changed across these
two specifications.
Relating Value-Added and Observational Metrics. In our second set of analyses, we
examined whether there were differences in observation scores within and across districts for
those teachers identified as high or low value-added, focusing on teachers ranked in the top and
bottom quartiles within their respective districts. Here, we considered three samples: teachers
ranked in the highest or lowest value-added quartile using the state assessment, teachers ranked
in the highest or lowest value-added quartile using the project-administered assessment, and
teachers ranked in the highest or lowest value-added quartile using both the state and project-
administered assessments. We considered all three samples given evidence on the sensitivity of
value-added scores to different achievement tests (Lockwood et al., 2007; Papay, 2011). Then,
we examined differences across districts of high- or low-ranked teachers along each of the four
domains of instructional quality – Ambitious Mathematics Instruction, Mathematical Errors and
Imprecisions, Classroom Emotional Support, and Classroom Organization – using a
straightforward regression model:
𝑂𝐵𝑆𝐸𝑅𝑉𝐴𝑇𝐼𝑂𝑁_𝑆𝐶𝑂𝑅𝐸! =
𝛽 𝐷𝐼𝑆𝑇𝑅𝐼𝐶𝑇!" ∗ 𝐿𝑂𝑊_𝑉𝐴!"!!!! + 𝛽( 𝐷𝐼𝑆𝑇𝑅𝐼𝐶𝑇!" ∗ 𝐻𝐼𝐺𝐻_𝑉𝐴!"!
!!! )+ 𝜀! (2)

16
Here, we regressed each individual observation score for teacher j on a set of district-by-value-
added-group dummy variables. In order to estimate the average instructional quality score for
each district and value-added group, we did not include a constant term.
Observations of Lessons and Teachers. The analyses above examine cross-district
differences in instructional quality, as measured by established observational instruments, of
high- or low-ranked teachers. Capitalizing on the availability of lesson videos, we aimed to paint
a more detailed picture of the nature of these instructional differences. We also hypothesized that,
given the multidimensional nature of teaching (Cohen, 2010), re-viewing of classroom video
might allow us to capture additional areas of convergence or divergence that were not included
in the MQI and CLASS instruments. Therefore, building on a tradition of mixed methods in
education research (Johnson & Onwuegbuzie, 2004) and analysis of classrooms and teaching in
particular (Turner & Meyer, 2000), we observed instruction from a subsample of high- and low-
ranked teachers across these districts.
Specifically, we randomly selected three high- and three low-ranked teachers from each
of the four districts for further inspection, for a total of 24 teachers. By randomly selecting a
subset of teachers, we hoped to capture typical instructional practice within each district and
value-added group. When selecting teachers, we only considered those ranked in the highest or
lowest value-added quartile on both the state and project-administered assessment in order to
ensure that rankings were specific to a given test. For each of these teachers, we randomly
selected three lessons for observation, the minimum number identified by Hill, Charalambous,
and Kraft (2012) for moderately high levels of predictive reliability on the MQI. Then, we
randomly assigned two authors to each video, ensuring that each author watched a sample of
lessons from all 24 teachers.

17
Raters utilized two coding schemes while observing each lesson. The first was a broad
observation protocol, asking raters to identify the lesson topic, provide a brief narrative, and
discuss any specific strengths or weaknesses. One rater for each lesson completed this protocol
and then sent it to the second rater to make edits and/or additions. The second protocol included
whole-lesson codes generated from a set of exploratory analyses designed to surface teacher
practices that might be related to student achievement (see Authors, 2013 for a discussion of this
exploratory analysis and Table 2 for a full list of codes). Some whole-lesson codes are similar to
dimensions of instruction described above (i.e., Classroom in Characterized by Mathematical
Inquiry, Mathematics of the Lesson is Clear and Not Distorted, Student Engagement), while
others capture dimensions of instruction not present in either the segment-level codes of the MQI
or CLASS instruments, such as Density of Mathematics is High and Tasks and Activities Develop
the Mathematics. Raters scored each code on a scale from 1 to 5 for each lesson, with high scores
indicating higher quality of instruction.
INSERT TABLE 2 HERE
After watching all lessons for a given district and value-added group (e.g., teachers from
the high value-added quartile in District 1), the authors met to review the lesson summary
protocol, discuss scores on the observational codes, and identify common instructional practices
across lessons. We followed this process first for each teacher and then for the district/value-
added group of teachers as a whole. After each meeting, we wrote detailed memos that
summarized salient features of instruction for each teacher and for each district-by-value-added
group, noting any points of convergence or divergence. After observing lessons for all districts
and value-added groups, we coded the memos collaboratively to identify similarities and
differences in instruction across districts and value-added groups. For this analysis, we

18
purposefully did not blind ourselves to district or value-added group given that we wanted to
uncover themes in instruction that were specific to a given group of teachers and how they
differed, if at all, from those themes present in other groups.
Teacher Sorting as a Possible Mechanism for Instructional Differences. Finally, we
examined the extent to which potential differences in instructional practices of high- or low-
ranked teachers across districts might be related to observable background characteristics of
teachers and, therefore, to teacher labor markets and sorting to districts. To do so, we drew on
data describing teachers’ background (gender, race, coursework in math and math education,
mathematical content knowledge, certification) that could be related to sorting patterns. Then, we
re-ran equations (1) and (2) from above controlling for these characteristics and examined
whether patterns of results remained the same. If they differ, this could indicate possible
evidence that our initial findings were driven by differences in teacher labor markets and
potential sorting of teachers to districts, at least on the observable characteristics available in our
data.
Results
Sensitivity of Value-Added Categorizations to Within- Versus Across-District Comparisons
We find that value-added categorizations are sensitive to district contexts and the specific
subset of teachers to whom an individual teacher is compared. In Figure 1, we show the
distribution of value-added scores calculated from the project-administered test when comparing
teachers both within and across districts. By construction of the value-added model, within-
district distributions are centered at zero and roughly normal. However, this is not the case when
teachers are compared across districts. In Districts 1 and 4, the across-district distribution is
centered slightly above zero, while in District 3 the distribution is centered below zero. Side-by-

19
side box plots also show clear shifts in the tails of these distributions (see Figure 2). In particular,
in District 3, the 25th and 75th percentiles are much lower than they are in the other districts,
indicating that, on average, teachers in District 3 are less effective at raising student achievement
on this common assessment than teachers in the other three. In Districts 1 and 4, the tops of the
distributions are higher than they are for the other two districts, indicating that the most effective
teachers in these districts are more effective than comparable teachers in Districts 2 and 3.
INSERT FIGURE 1 HERE
INSERT FIGURE 2 HERE
Another way to look at this finding is to consider the percent of teachers who fall into
each quartile when compared across districts (see Table 3). When we compare teachers across
districts, 25% of the full sample fall into each quartile. This should also be the case if within-
district value-added scores are not sensitive to district context. However, this is not true when we
examine the cells in Table 3. Compared to teachers in all four districts, 44% of teachers in
District 3 fall into the lowest quartile, while only 13% are in the top. The former estimate is
statistically significantly different from 25%. In addition, 35% percent of teachers in District 2
are in the second quartile, and 31% of teachers in District 4 are in the top quartile, both of which
are statistically significantly different from 25%. Together, these findings suggest that teachers in
District 3 and in District 2 may be less effective at raising student achievement on the common
assessment than teachers in Districts 1 and 4 (see Note 4).
INSERT TABLE 3 HERE
Another possible explanation for these findings may be that the sample of teachers who
agreed to participate in the study was not representative of teachers in the district as a whole.
That is, we might see these results if sampled teachers in District 1 happened to be among the

20
most highly effective in that district and those in District 3 happened to be among the least. We
explore this possibility in Figure 3 by comparing the distribution of value-added scores
calculated on state tests for all teachers in each district to that for the project sample. In Districts
3 and 4, these samples appear roughly equivalent at the ends of the inter-quartile range and at the
25th, 50th, and 75th percentiles; the fact that there are more outliers in the full district sample may
be a function of having many more teachers. In District 2, the samples are roughly equivalent
except at the top end of the inter-quartile range. Finally, in District 1, the 25th percentile is
slightly higher in the project sample than for the entire district, and the ends of the distribution
are more truncated. When we test formally for equality of quantiles between the project sample
of teachers and those in the rest of the district, we only find a marginally statistically significant
difference (p=.07) at the 25th percentile in District 1. This leads us to conclude that the project
sample of teachers is not markedly different from the entire district in a way that would distort
within- versus across-district comparison results above.
INSERT FIGURE 3 HERE
Differences in Instructional Quality Across Districts
We begin this section by exploring the distribution of instructional quality on the MQI
and CLASS instruments across the entire district samples (see Figure 4). Relative to all teachers
in the sample, those in District 1 generally score above average on Ambitious Mathematics
Instruction. Despite using the same set of curriculum materials as District 1, teachers in District
2 are distributed more evenly around the mean of zero. However, District 2 teachers lie slightly
above the mean on Mathematical Errors and Imprecisions, indicating fewer errors made in
instruction. Teachers in District 3 score below average on both of these domains. For Classroom
Emotional Support and Classroom Organization, distributions are more consistent across

21
districts. This indicates that, within our project sample, instruction generally looks stronger in
District 1 than in some of the other districts, namely District 3.
INSERT FIGURE 4 HERE
Comparison of the Gap Between High- and Low-Ranked Teachers Across Districts.
Next, we make formal comparisons of high- or low-ranked teachers across districts. In Table 4,
we present estimates calculated from a regression framework without any constant; this allows
us to present mean values for all district and value-added groups. We also conducted a set of
post-hoc Wald tests to look for differences of these groups both within and across districts.
Though we ran analyses for teachers identified as high- or low-ranked on the high-stakes state
test, the low-stakes project-administered test, and both tests, we note that findings and patterns of
statistical significance generally are consistent across these three. This is noteworthy given that
each assessment identifies slightly different sets of high- or low-ranked teachers and, as a result,
smaller samples of high- or low-ranked teachers on both assessments. We focus our discussion
on the group of high- or low-ranked teachers on both assessments and include results for the
other two groups in an appendix (see Table A1).
INSERT TABLE 4 HERE
Comparing low- versus high-ranked teachers within districts, we generally find that, as
expected the former score lower than the latter, on average, on each dimension of instructional
quality. One exception is for Classroom Emotional Support in District 1, where the average score
for high-ranked teachers is substantively lower than the average score for low-ranked teachers
(and statistically significantly different when comparing teachers using only the project-
administered test; see Table A1).

22
At the same time, the gap between these average scores differs across districts. We
consistently find differences between low- and high-ranked teachers in District 3. Most starkly,
low-ranked teachers in District 3 score almost 2 standard deviations (sd) below high-ranked
teachers in this district on both Classroom Emotional Support and Classroom Organization
(p<.001 for both). For average Ambitious Mathematics Instruction scores in this districts, the gap
of 1 sd is marginally statistically significant (p=.06). We also observe substantive gaps of similar
magnitude in District 1 on Ambitious Mathematics Instruction, Mathematical Errors and
Imprecisions, and Classroom Emotional Support. However, differences between high- and low-
ranked teachers only are statistically significant on the second domain when using larger samples
of teachers identified as high- or low-value added on the state assessment or the project-
administered assessment (see Table A1). Comparatively, gaps in District 2 for all dimensions
except for Classroom Organization and in District 4 for all four dimensions are much smaller,
between roughly 0.1 and 0.5 sd. We illustrate these results in Figure 5 by plotting the distance
between high- and low-ranked teachers on each dimension of instruction by district. We exclude
District 1 for Classroom Emotional Support, given that high-ranked teachers score lower than
low-ranked teachers.
INSERT FIGURE 5 HERE
Similar to the quantitative results presented above, lesson observations also revealed
variability across districts in the gap between high- or low-ranked teachers within districts. We
present scores on whole-lesson codes in the Appendix (see Table A2) but do not describe these
in the text; instead, we focus on salient themes and a narrative description. In District 1,
instruction by high-quartile teachers based on within-district value-added scores was
characterized by a focus on conceptual understanding, purposeful sequencing of tasks and

23
frequent student contributions. Instruction by teachers in the low value-added quartile in District
1, on the other hand, was quite different, characterized by low-level tasks and lessons that
developed without a coherent direction or mathematical purpose. We observed similar variability
between high- and low-ranked teachers in District 3, though the overall level of instructional
quality was lower. High-ranked teachers engaged largely in procedural instruction, with some
focus on remediation of student errors. In contrast, instruction from low-ranked teachers lacked
mathematical depth in any classroom and included frequent errors.
Conversely, in Districts 2 and 4, the instructional differences between teachers ranked in
the highest quartile by within-district value-added scores and those ranked in the lowest quartile
were far less stark. In District 2, we noted a mixture of strong and weak features in the
instruction of both groups – lessons were decently structured and generally free of major errors,
but often lacked depth to the mathematical content and were characterized by teacher talk at the
expense of substantive student contributions. A notable commonality across high- and low-
ranked teachers in District 2 was consistent review and preparation for the state standardized test.
In District 4, teachers in both value-added groups engaged students in the mathematical content
but also tended to offer lower-level tasks. While we observed fewer mathematical errors in the
instruction of teachers in the high value-added quartile than those in the low valued-added
quartile, errors still were present in both sets of lessons. This suggests that being ranked in the
highest value-added quartile versus the lowest quartile may not carry as strong a signal of
instructional quality in these two districts as it does in the others.
Comparisons of High- or Low-Ranked Teachers Across Districts. We also compare
instructional quality scores of high-ranked teachers across districts, and similarly for low-ranked
teachers. Beginning with a comparison of high-ranked teachers, we find differences between

24
some districts for both mathematics and general teaching practices. For example, high-ranked
teachers in District 2 score between 0.7 and 1.2 sd higher than similarly ranked teachers in
Districts 3 and 4 on Mathematical Errors and Imprecisions (p=.028 and .022 for Districts 3 and
4, respectively), indicting fewer errors made in instruction. However, these high-ranked teachers
in District 2 also score between 1.1 and 1.6 sd lower than those in Districts 3 and 4 on Classroom
Emotional Support (p=.001 and .015, respectively), indicating weaker relationships with students.
Lesson observers also saw evidence of these differences, particularly around mathematical errors,
though coding of memos indicated that other elements of instruction were more salient.
Most notable in these comparisons of MQI and CLASS scores, high-ranked teachers in
District 1 score substantially higher than high-ranked teachers in the other three districts on
Ambitious Mathematics Instruction. Specifically, high-ranked teachers in District 1 score 1.6 sd
above the mean, on average, on this dimension, compared to 0.1 sd, 0.3 sd, and 0.2 sd below the
mean for Districts 2 through 4, respectively (p=.001 for Districts 2 and 3, and p<.001 for District
4). These differences indicate greater conceptual focus to instruction and stronger ability to work
with students around the content in District 1 than in other districts.
Observer memos also highlight substantive differences in the nature of ambitious
instruction in District 1 relative to other districts. For high-ranked teachers in District 1, lessons
were characterized by a consistent focus on conceptual understanding of mathematics and an
ability to work with students around the content. In one lesson the teacher pushed students to
find multiple ways to subtract four-digit numbers without using the standard algorithm. In
another lesson from a different teacher, the class investigated the “silhouette” of 3D solids,
making conjectures about what some might look like and identifying patterns they noticed. In
contrast, the instruction offered by high-ranked teachers in District 3 was largely procedural.

25
While students in these lessons consistently worked on mathematics, the instruction had little
focus on conceptual understanding and few instances of ambitious mathematical practices. In
addition, all three teachers made at least one content error (e.g., confusing 0.5% with 50%,
incorrectly solving a problem on permutations), with two teachers also consistently exhibiting
imprecisions in their mathematical language.
For low-ranked teachers, we also find a number of statistically significant differences
between districts for both mathematics and general teaching practices captured on the MQI and
CLASS. Similar to the results above, low-ranked teachers in District 2 make fewer errors than
similarly ranked teachers in all other districts (p=.051, .010, and .003, for Districts 1, 3, and 4,
respectively). Low-ranked teachers in District 4 score higher than those in Districts 2 and 3 on
Classroom Emotional Support (p=.003 and .001, respectively) and on Classroom Organization
(p=.095 and .020, respectively). Finally, low-ranked teachers in District 1 still provide more
ambitious instruction than low-ranked teachers in Districts 2 and 3 (p=.071 and .013,
respectively). This difference is particularly stark in District 3, where low-ranked teachers score
over 1.8 sd lower on this domain, on average, than low-ranked teachers in District 1.
Coding of observer memos highlighted differences across districts of low-ranked teachers
with regard to the nature of ambitious instruction, errors, and classroom organization, but less so
for teachers’ relationship and communication with students. In particular, raters described
instruction in District 3 as especially low quality. Across all three teachers observed, there was
no evidence of mathematical depth in the lessons offered to students. This was due in some cases
to a largely procedural focus of instruction, a lack of clarity when inquiry oriented instruction
was attempted, or, in a few instances, a lack of connectedness of activities to mathematics. For
example, one teacher spent a full class having students design rooms for their homes, focusing

26
on the design itself with only brief mention of dimensions. Many students were off-task for all or
part of the lesson. When teachers attempted more ambitious activities, the teachers often
struggled with the content. Two teachers in particular exhibited a consistent lack of content
knowledge, imprecisely defining key terms and struggling to convey central material.
This was quite different from the instruction observed in the lowest ranked teachers from
Districts 1 and 4. In both of these districts, low-quartile teachers’ lessons were characterized by
procedural instruction. All six of these low-ranked teachers engaged students around
mathematical content. In District 4, there often were attempts to develop mathematical ideas in
meaningful ways, either through math language or tools and manipulatives that had the potential
for conceptual understanding. At the same time, the cognitive demand of tasks was low. In
District 1, tasks were similarly low-level; however, we observed few errors in the presentation of
the math and consistent attention to student difficulty.
Surprisingly, we find that this type of instruction from low-ranked teachers in District 1 is
stronger than the instruction of high-ranked teachers in other districts. This finding is particularly
clear in Figure 5, where we see that the lowest-ranked teachers in District 1 have Ambitious
Mathematics Instruction scores roughly 0.7 and 0.9 sd higher than high-ranked teachers in the
other three districts. Formal comparisons between these scores do not reveal statistically
significant differences for those teachers identified as high or low quality on both assessments.
However, we do observe statistically significant differences when drawing from larger samples
of high- or low-ranked teachers either on the state assessment or on the project-administered
assessment. Using the state assessment to construct value-added rankings, low-ranked teachers in
District 1 score higher on Ambitious Mathematics Instruction than high-ranked teachers in
District 3 and District 4 (p=.069 and p=.039, respectively; not shown in Table A1). Using the

27
project-administered assessment, low-ranked teachers in District 1 score higher on this
dimensions than high-ranked teachers in District 2 and District 4 (p=.018 and p=.010,
respectively). Observations of instruction led to similar conclusions. Raters noted that instruction
from low-ranked teachers in District 1 appeared most similar to the instruction of high-ranked
teachers in District 3.
Taken together, these results indicate significant variability in the instructional quality of
teachers ranked high- or low-value added in one district compared to similarly ranked teachers in
another. In particular, both high- and low-ranked teachers in District 1 appear to provide more
ambitious instruction than teachers in the other districts (see Note 5).Additional Instructional
Themes from Observations of Lessons. In addition to drawing on videotaped lessons to paint a
fuller picture of instruction, we aimed to explore instructional dimensions that differed across
districts and value-added groups but were not included in the four main dimensions of the MQI
and CLASS rubrics. Above, we note that quantitative and qualitative results were fairly
consistent in the patterns they highlight. One additional instructional theme that was salient
across districts and value-added groups was the Density of the Mathematics, which captures to
the amount of mathematics – problems, tasks, or concepts – worked through relative to the
length of the lesson. We draw on this code to identify additional differences between high- or
low-ranked teachers across districts.
In almost all districts, the density of lessons varied between high- and low-ranked
teachers within that district. This was most notable in District 1, where the instruction of teachers
ranked high value-added was characterized by mathematically meaningful work throughout a
lesson, compared to instruction of low-ranked teachers in this district that were consistently
lower density. As described above, in one high-ranked teacher’s lesson, the teacher pushed

28
students to use multiple creative ways to subtract four digit numbers. This led to a
mathematically dense lesson in which students worked through multiple problems in meaningful
ways. In contrast, in one low ranked teacher’s lesson, students completed three simple
conversion problems in 30 minutes. In another it took almost 35 minutes for students to recreate
four different block patterns. Further, these activities were not done with much cognitive depth.
Similar patterns were noted is Districts 3 and 4, such that high-ranked consistently covered more
mathematical ground in lessons compared to low-ranked teachers.
We also observed differences in the mathematical density of lessons from similarly
ranked teachers across districts. This was most evident when comparing low-ranked teachers.
Specifically, we found that lessons of low-ranked teachers in District 3 were even less dense than
lessons from low-ranked teachers in District 1 described above. Among low-ranked teachers in
District 3, there were a number of examples of lessons in which students got through very little
or no math, either because activities were not entirely mathematical in nature or because teachers
did not push students to complete their work. For example, in one lesson on using percentages to
calculate the discount in price at a store, the students solved only one problem, focusing instead
on naming their store and deciding which products to discount.
Teacher Sorting as a Possible Mechanism for Cross-District Differences
Theory and prior research described above suggest that these differences we observe in
instructional quality of high- or low-ranked teachers across districts could stem from multiple
sources, including differences in teacher labor markets and sorting to districts, how teachers’
practices develop through district-specific resources such as curricula and professional
development, and how district policies mediate support to teachers (Boyd, Lankford, Loeb, &
Wyckoff, 2004; Guarino, Santibañez, & Daley, 2006; Hanushek, Kain, & Rivkin, 2004; Hill,

29
Kapitula, & Umland, 2011; Spillane, 2000). While we cannot answer definitively which single
source or weighted combination of these sources account for the differences observed in our
data, we were able to examine whether observable background characteristics explain these
patterns. If so, this this might be related to teacher labor markets and potential sorting to districts.
That is, if some districts are able to recruit and hire a pool of teachers with much stronger
knowledge of math content, for example, we might also expect these teachers to provide stronger
mathematics instruction, even before receiving specific supports from schools and districts.
In our Sample section above, we describe differences in average teacher characteristics
across districts amongst our full sample of teachers. We note that, in fact, relative to teachers in
the other districts in our sample, those in District 3 appear less knowledgeable of math content.
Given the positive association between math content knowledge and teacher quality cited
elsewhere (Wayne & Youngs, 2003) and the general failure of professional development to
improve teacher knowledge in mathematics (Garet et al., 2011), it is plausible that this is an
indicator of the role of labor market differences and teacher sorting in explaining the lower-
quality instruction of high- and low-ranked teachers in District 3. At the same time, when we
focus just on high- and low-ranked teachers, this hypothesis does not hold (see Table 5). In
District 3, high-ranked teachers (using both the state and project-administered assessments) have
lower average math content knowledge scores than high-ranked teachers in the other three
districts (-0.16 sd, compared to 0.11 sd, 0.82 sd, and 0.25 sd for Districts 1, 2, and 4,
respectively). However, low-ranked teachers from this district score higher than those in District
1 (-0.56 sd compared to -1.04), whose instruction was much higher in quality. Therefore, content
knowledge does not consistently explain the differences in instructional quality that we observe.
INSERT TABLE 5 HERE

30
In addition, when we re-run models controlling for observable characteristics of teachers,
these characteristics do not appear to negate original findings. First, we re-calculated across-
district value-added scores using the project-administered assessment, controlling for math
content knowledge and other teacher background characteristics (i.e., race, gender, education,
certification). We do not control for teaching experience or indicators for a teaching having
earned a masters degree, as these variables may describe teacher characteristics after entering the
profession. Math content knowledge also is measured after teachers enter the classroom but, as
noted above, are less likely to be influenced by district-level policies and practices. Here, we still
find an unequal share of teachers in each quartile across district (see Table 6). Forty-one percent
of teachers in District 3 are in the lowest quartile of value-added and 13% of teachers are in the
top, compared to 44% and 13% when we do not control for these teacher characteristics. Further,
when we use our original within-district value added scores, but re-examine cross-district
differences in MQI and CLASS scores of high- or low-ranked teachers controlling for these
observable teacher characteristics, most patterns described earlier remain (see Table 7). Of the
four statistically significant differences in instructional quality scores of high- versus low-ranked
teachers within a given district (e.g., Ambitious Mathematics Instruction for high- versus low-
ranked teachers in District 3), all persist. Of the eight differences of high-ranked teachers across
districts, eight persist. Finally, of the twelve differences for low-ranked teachers across districts,
ten persist. Magnitudes of cross-district differences also are quite similar. Given that observable
teacher characteristics do not fully explain away results, differences in teacher labor markets and
potential sorting to districts on observables likely do not account for all the variability in value-
added categorizations across districts and the large differences in instructional practices in this
sample of high- or low-ranked teachers that we described earlier.

31
INSERT TABLE 6 HERE
INSERT TABLE 7 HERE
Conclusion
Discussion of Key Findings
To our knowledge, this study is the first to examine the sensitivity of value-added
categorizations to district context and the extent to which differences might be related to
instructional quality. There are a variety of limitations to our work. Namely, the study includes a
relatively small sample size of teachers from only four districts. These samples are even smaller
when only considering high- or low-ranked teachers. Further, while the project sample of
teachers appears similar to the rest of the teachers in their respective districts with regard to state
value-added scores, they may differ in other ways; in particular, there may be differences in the
quality of their instruction. At the same time, results are strongly suggestive of a few themes that,
if confirmed, have a number of important implications for policy.
First, value-added categorizations generated from a common assessment do appear to be
sensitive to district contexts. When compared to teachers across all districts, those in Districts 1
and 4 are ranked notably higher than those in the other districts, and those in District 3 are
ranked notably lower. This finding is similar to research indicating the sensitivity of value-added
categorizations to school fixed effects (Goldhaber & Theobald, 2012).
Second, the quality of instruction of our sample of teachers ranked in the highest value-
added quartile within their respective districts does look different across districts, as does the
instruction of teachers in the lowest value-added quartile. In particular, our sample of high- and
low-ranked teachers in District 1 scores substantially higher, on average, on Ambitious
Instruction than their counterparts in other districts. Qualitative analyses corroborate these

32
patterns. Relatedly, both quantitative and qualitative analyses indicate that amongst a subsample
of teachers in some districts (i.e., Districts 1 and 3), being ranked high based on value-added
scores, as opposed to being ranked low, appears to signal key differences in the quality of
instructional practices; however, in other districts (i.e., Districts 2 and 4), these signals do not
appear as strong. In other words, the gap between the quality of instruction of teachers ranked
high and low by value-added scores appears notably wider in Districts 1 and 3 than it does in
Districts 2 and 4. We believe that this is the first study to document these trends, providing
important empirical support for theories regarding district-specific differences in instructional
quality described in other work (Hill, Kapitula, & Umland, 2011; Spillane, 2000).
Finally, we find evidence that these cross-district differences in instructional quality of
high- or low-ranked teachers are not explained by a host of observable background
characteristics of teachers, such as education, math content knowledge, and certification. This
suggests that results are unlikely to related in large part to teacher labor markets and sorting to
districts. Thus, it may be important to understand alternative explanations for the differences we
see. One possibility is that differences are due to district-specific resources to support instruction,
such as curricula and professional development. This is consistent with specific policies and
practices occurring in these four districts over the past several years. Although we do not
currently have a systematic way to test this with our data, we know (as described earlier) that in
District 1, where instruction of both high- and low-ranked teachers was the highest quality,
teachers utilize curriculum materials and a state assessment that are considered more cognitively
demanding than those in other districts. At the same time, District 2 also utilized these resources
yet had weaker instruction across a range of teacher practices. Another factor may be related to
professional development. We suggest this in light of District 1’s long history of intensive efforts

33
to provide teachers with professional development around ambitious instruction. Determining the
causal mechanisms for differences in instructional practices of high- or low-ranked teachers
across districts will be an important area for future research.
Policy Implications
Although our analyses are limited by small samples, we believe that these findings have a
number of important implications for policy and practice. First, despite new discourse around
quality teachers and quality teaching at a national level, it is not clear from these results that
labels such as “highly effective” or “ineffective” based on value-added scores have fixed
meaning. In our sample of teachers, these labels are sensitive to the group of teachers to whom
an individual teacher is compared. They also do not signal common sets of instructional practices.
In fact, we observed that instruction of low-ranked teachers in District 1 was notably stronger
than that of both low- and high-ranked teachers in other districts. These findings, which may be
true for all teachers in these districts and in other district comparisons outside of our data, could
be particularly problematic for recruitment and hiring decisions when veteran teachers apply for
a teaching position in a new district. In these instances, school leaders may not be able to use
prior value-added scores as a proxy for a teachers’ underlying effectiveness or the quality of their
instruction.
Second, the fact that we observe variability across districts in the gap between the quality
of instruction of high- and low-ranked teachers within a district also raises concern about using
these rankings for job decisions. For example, in District 4, we find some differences between
the quality of instruction in classrooms of teachers from the high and low quartiles of value-
added rankings – such as the density of the mathematics and the number of errors that teachers
make; however, these differences were small and made us question whether it would be

34
appropriate to consider one group for firing and another for career advancement or rewards.
Even when the gap is wider, as it is in our sample in District 1, administrators and policymakers
may still want to proceed with caution when using value-added categorizations to make job
decisions. Here, the instructional quality of the lowest ranked teachers was not particularly weak
and, in fact, was as strong as the instructional quality of the highest ranked teachers in other
districts. In this case, it may make sense to invest in improvement efforts over recruitment from
outside the district.
Third, we note that two key tools allowed us to conduct these analyses and discover key
differences across districts: use of a common student assessment and significant time spent
observing instruction. Forthcoming implementation of Common Core State Standards and
common assessments (i.e., PARCC and Smarter Balanced) means that district leaders and
policymakers may be able to replicate these analyses in broader settings. In addition, many
districts are utilizing observations as a component of new teacher evaluation systems. Similar
analyses of data collected from these efforts could prove useful, particularly to determine
whether the results of this study are consistent across other districts.
Lastly, in order to be able to provide quality instruction to all students, it is important that
researchers and practitioners understand why these stark differences in instructional quality exist,
even amongst a common set of high- or low-ranked teachers. Our research provides suggestive
evidence that these differences are unlikely to be related to teacher labor markets and sorting to
districts. Another plausible explanation may be the combination of resources and policy
interventions that districts employ to support ambitious instruction. Because this work is
exploratory, we believe that research should attempt to investigate in more depth the differential
roles of labor market sorting versus development mechanisms in explaining differences in

35
instructional quality across districts. In addition, future work may seek to understand district-
specific policies and contexts that might contribute to comparably higher instructional quality.
Notes
(1) In District 4, students did not take this assessment in the fall of the first year of the study.
In order to account for possibly less reliable value-added estimates in this district, we impute
student test scores for this testing period using predicted values from a regression model of the
project administered assessment on all available demographic information and prior-year state
assessment information. For students in the second year, we calculate a correlation between the
actual and predicted values on the project-administered assessment of 0.82 (p<.001). We test the
robustness of quantitative findings to exclusion of this district and find that patterns of results
generally are unchanged.
(2) Some argue for using conditional measures of instructional quality that control for
classroom characteristics (Whitehurst, Chingos, & Lindquist, 2014). However, we are interested
in the types of instruction that teachers provide in each classroom, irrespective of student
populations. In addition, we find that these scores are correlated with the unconditional scores at
0.92 or above.
(3) For value-added calculated from state assessments, 17% of teachers have data from four
years, 22% from three years, 24% from two years, and 37% from one year; for value-added
calculated from the project-administered assessment, 46% of teachers have data from two years
and 56% from one year. For teachers in the extremes of value-added (i.e., either top or bottom
quartiles), all teachers have at least two years of data on the state assessment, and between 60%
and 75% of teachers have two years of data on the project-administered assessment (depending
on whether value-added is calculated within or across districts).

36
(4) Given imputation of baseline test-score data for the project-administered assessment in
District 4, we also re-run this analysis with across-district value-added scores that exclude
teachers and students in this district. When doing so, we still find a shift in District 3 toward the
bottom of the distribution, with only 16% of teachers ranked in the top quartile, 34% in the
second quartile, and 25% in the bottom. However, these percentages are no longer statistically
significantly different from 25%.
(5) As above, when we exclude District 4 from this analysis, all of these differences in
instructional quality of low- and high-ranked teachers across districts remain, though the
magnitude of these differences change slightly.

37
Works Cited
Authors. (2013). Authors. (2013). Author. (2014). Authors. (2014). Authors. (2014). Bell, C. A., Gitomer, D. H., McCaffrey, D. F., Hamre, B. K., & Pianta, R. C. (2012). An
argument approach to observation protocol validity. Educational Assessment, 17(2-3), 62-87.
Boyd, D., Lankford, H., Loeb, S., & Wyckoff, J. (2004). The draw of home: How teachers’ preferences for proximity disadvantage urban schools. Journal of Policy Analysis and Management, 24(1), 113-132.
Brophy, J., & Everston, C. M. (1978). Context variables in teaching. Educational Psychologist, 12(3), 310-316.
Chetty, R., Friedman, J. N., & Rockoff, J. E. (2014). Measuring the impacts of teachers I: Evaluating bias in teacher value-added estimates. American Economic Review, 104(9), 2593-2632.
Cohen, D. K. (2010). Teacher quality: An American educational dilemma. In M. Kennedy (Ed.), Teacher Assessment and the Quest for Teacher Quality. San Francisco: Jossey-Bass. pp. 375-402.
Darling-Hammond, L., & Snyder, J. (2000). Authentic assessment of teaching in context. Teaching and Teacher Education, 16, 523-545.
Duncan, A. (2009). The race to the top begins: Remarks by Secretary Arne Duncan. Retrieved from http://www.ed.gov/news/speeches/2009/07/07242009.html.
Garet, M. S., Wayne, A. J., Stancavage, F., Taylor, J., Eaton, M., Walters, K., Song, M., Brown, S., Hurlburt, S., Zhu, P., Sepanik, S., & Doolittle, F. (2011). Middle school mathematics professional development impact study: Findings after the second year of implementation. Washington, D.C.: U.S. Department of Education.
Goldhaber, D., & Hansen, M. (2012). Is it Just a Bad Class? Assessing the Long‐term Stability of Estimated Teacher Performance. Economica, 80(319), 589-612.
Goldhaber, D., & Theobald, R. (2012). Do different value-added models tell us the same things? Retrieved from http://www.carnegieknowledgenetwork.org/wp-content/uploads/2012/10/CKN_2012-10_Goldhaber.pdf
Grossman, P., Loeb, S., Cohen, J., & Wyckoff, J. (2013). Measure for measure: The relationship between measures of instructional practice in middle school English language arts and teachers’ value-added. American Journal of Education, 119(3), 445-470.
Guarino, C., Santibañez, L., & Daley, G. (2006). Teacher recruitment and retention: A review of the recent empirical literature. Review of Educational Research, 76(2), 173-208.
Hanushek, E. A. (2009). Teacher deselection. In D. Goldhaber & J. Hannaway (Eds.), Creating a new teaching profession (p. 165-180). Washington, D C: Urban Institute Press.
Hanushek, E. A., Kain, J. F., & Rivkin, S. G. (2004). Why public schools lose teachers. Journal of Human Resources, 39(2), 326-354.
Harris, D. N. (2009). Would accountability based on teacher value added be smart policy? An examination of the statistical properties and policy alternatives. Education Finance and Policy, 4(4), 319-350.
38
Hickman, J. J., Fu, J., & Hill, H. C. (2012). Technical report: Creation and dissemination of upper-elementary mathematics assessment modules. Princeton, NJ: Educational Testing Service.
Hill, H. C., Charalambous, C. Y., & Kraft, M. A. (2012). When rater reliability is not enough: Teacher observation systems and a case for the generalizability study. Educational Researchers, 41(2), 56-64.
Hill, H. C., Kapitula, L., & Umland, K. (2011). A validity argument approach to evaluating teacher value-added scores. American Educational Research Journal, 48(3), 794-831.
Hill, H.C., Schilling, S.G., & Ball, D.L. (2004). Developing measures of teachers’ mathematics knowledge for teaching. Elementary School Journal, 105, 11-30.
Ho, A. D., & Kane, T. J. (2013). The reliability of classroom observations by school personnel. Seattle, WA: Measures of Effective Teaching Project, Bill and Melinda Gates Foundation.
Johnson, R. B., & Onwuegbuzie, A. J. (2004). Mixed methods research: A research paradigm whose time has come. Educational Researcher, 33(7), 14-26.
Kane, T. J., McCaffrey, D. F., Miller, T., & Staiger, D. O. (2013). Have we identified effective teachers? Validating measures of effective teaching using random assignment. Seattle, WA: Measures of Effective Teaching Project, Bill and Melinda Gates Foundation.
Kane, T. J., & Staiger, D. O. (2012). Gathering feedback for teaching: Combining high-quality observations with student surveys and achievement gains. Policy and practice brief. Seattle, WA: Measures of Effective Teaching Project, Bill and Melinda Gates Foundation.
Kane, T. J., Taylor, E. S., Tyler, J. H., & Wooten, A. L. (2011). Identifying effective classroom practices using student achievement data. Journal of Human Resources, 46(3), 587-613.
Koedel, C., & Betts, J. R. (2011). Does student sorting invalidate value-added models of teacher effectiveness? An extended analysis of the Rothstein critique. Education, 6(1), 18-42.
Kraft, M. A., & Papay, J. P. (2014). Can professional environments in schools promote teacher development? Explaining heterogeneity in returns to teaching experience. Educational Evaluation and Policy Analysis,
Lockwood, J. R., McCaffrey, D. F., Hamilton, L. S., Stecher, B., Le V., & Martinez, J. F. (2007). The sensitivity of value-added teacher effect estimates to different mathematics achievement measures. Journal of Educational Measurement, 44(1), 47-67.
National Governors Association. (2010). Common Core State Standards for Mathematics. Washington, DC: National Governors Association Center for Best Practices and the Council of Chief State School Officers.
Newton, X. A., Darling-Hammond, L., Haertel, E., & Thomas, E. (2010). Value-added modeling of teacher effectiveness: An exploration of stability across models and contexts. Education Policy Analysis Archives, 18(23).
Papay, J. P. (2011). Different tests, different answers: The stability of teacher value-added estimates across outcome measures. American Educational Research Journal, 48(1), 163-193.
Pianta, B., Belsky, J. Vandergrift, N. Houts, R. & Morrison, F. (2008) Classroom effects on children’s achievement trajectories in elementary school. American Educational Research Journal, 45(2), 365-387.
Porter, A. C. (2002). Measuring the content of instruction: Uses in research and practice. Educational Researcher, 31(7), 3-14.
Porter, A., McMaken, J., Hwang, J., & Yang, R. (2011). Common core standards: The new US intended curriculum. Educational Researcher, 40(3), 103-116.

39
Raudenbush, S. W., & Bryk, A. S. (2002). Hierarchical linear models: Applications and data analysis methods. Second Edition. Thousand Oaks, CA: Sage Publications.
Schochet, P. Z., & Chiang, H. S. (2013). What are error rates for classifying teacher and school performance using value-added models? Journal of Educational and Behavioral Statistics, 38(2), 142-171.
Spillane, J. P. (2000). Cognition and policy implementation: District policymakers and the reform of mathematics education. Cognition and Instruction, 18(2), 141–179.
Turner, J. C., & Meyer, D. K. (2000). Studying and understanding the instructional contexts of classrooms: Using our past to forge our future. Educational Psychologist, 35(2), 69-85.
Wayne, A. J., & Youngs, P. (2003). Teacher characteristics and student achievement gains: A review. Review of Educational Research, 73(1), 89-122.
Whitehurst, G. J., Chingos, M. M., & Lindquist, K. M. (2014). Evaluating teachers with classroom observations: Lessons learned in four districts. Washington DC: Brown Center on Education Policy at Brookings.

40
Figures
Figure 1. Kernel density plots of value-added scores calculated from the project assessment, comparing teachers within districts (dash line) and across districts (solid line). Vertical lines indicate the median of a given distribution.
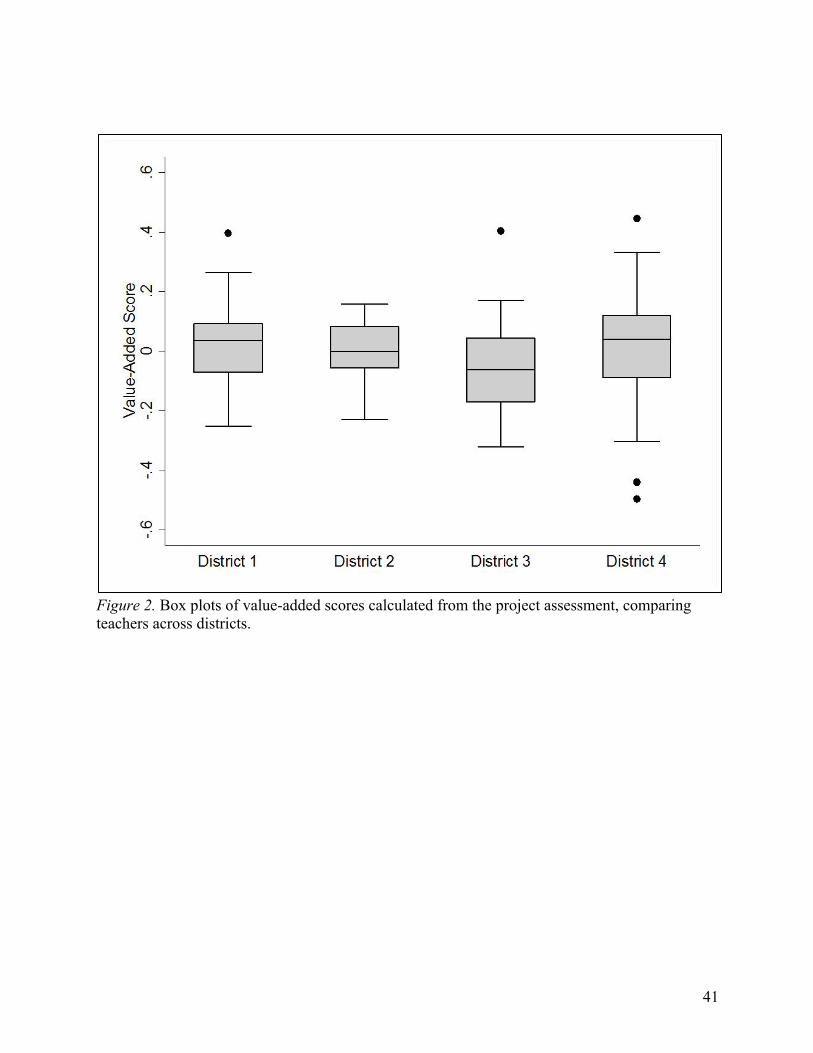
41
Figure 2. Box plots of value-added scores calculated from the project assessment, comparing teachers across districts.

42
Figure 3. Box plots of value-added scores calculated from state standardized assessments for the project sample and all fourth- and fifth-grade teachers in each district.

43
Figure 4. Distributions of MQI and CLASS dimension scores by district.

44
Figure 5. Average MQI and CLASS scores for high-ranked teachers (top bar) and low-ranked teachers (bottom bar) using both the state standardized and common assessments by district.
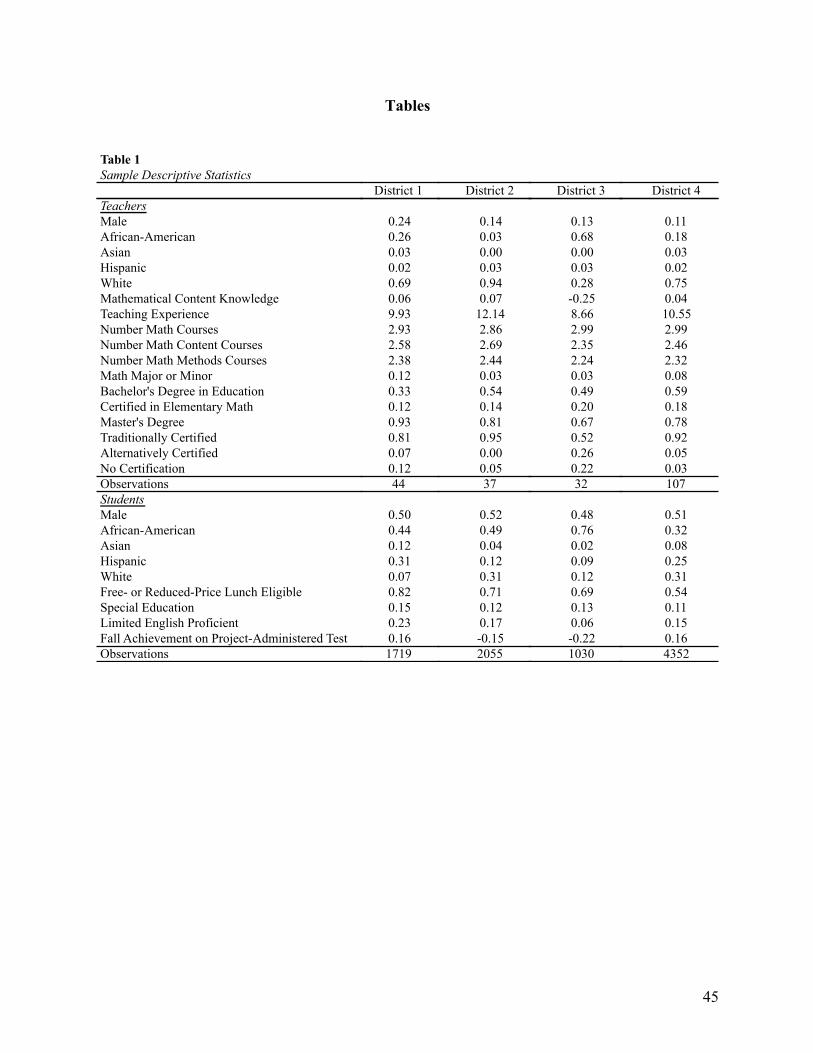
45
Tables
Table 1Sample Descriptive Statistics
District 1 District 2 District 3 District 4TeachersMaleAfrican-AmericanAsianHispanicWhiteMathematical Content KnowledgeTeaching ExperienceNumber Math CoursesNumber Math Content CoursesNumber Math Methods CoursesMath Major or MinorBachelor's Degree in EducationCertified in Elementary MathMaster's DegreeTraditionally CertifiedAlternatively CertifiedNo CertificationObservationsStudentsMaleAfrican-AmericanAsianHispanicWhiteFree- or Reduced-Price Lunch EligibleSpecial EducationLimited English ProficientFall Achievement on Project-Administered TestObservations
0.240.260.030.020.690.069.932.932.582.380.120.330.120.930.810.070.1244
0.500.440.120.310.070.820.150.230.161719
0.140.030.000.030.940.07
12.142.862.692.440.030.540.140.810.950.000.0537
0.520.490.040.120.310.710.120.17-0.152055
0.130.680.000.030.28-0.258.662.992.352.240.030.490.200.670.520.260.2232
0.480.760.020.090.120.690.130.06-0.221030
0.110.180.030.020.750.0410.552.992.462.320.080.590.180.780.920.050.03107
0.510.320.080.250.310.540.110.150.164352

46
Table 2Items generated during exploratory analysis and used to score the analytic sampleItem Description
Teacher Uses Student Ideas Teacher uses student ideas and solutions to move the lesson forward.
Teacher Remediates Student Difficulty Teacher attends to student difficulty with the material.
Students are Engaged Classroom environment is characterized by engagement.
Classroom Characterized by Math Inquiry Students participate in the mathematics of the lesson in a substantive way.
Lesson Time Used Efficiently Lesson time is used efficiently; class is on task, and behavioral issues do not disrupt the flow of the class.
Density of the Mathematics is High The class is working through many problems/tasks/concepts and the pace is reasonable or high.
Launch of Task Launch of the mathematical task(s) was mathematically sensible, well-designed, clear and not confusing to students.
Mathematics is Clear and Not Distorted Mathematics of the lesson is clear and not distorted.
Tasks and Activities Develop Math The tasks and activities done by the class contribute to the development of mathematical ideas, procedures, etc.

47
Table 3
District 1 District 2 District 3 District 4Bottom Quartile 20.5 18.9 43.8* 22.4Second Quartile 20.5 35.1* 21.9 20.6Third Quartile 31.8 24.3 21.9 26.2Top Quartile 27.3 21.6~ 12.5 30.8*Observations 44 37 32 107
Percent of Teachers in Each Value-Added Quartile when Compared Across Districts
Notes: ~ p<.10, * p<.05, ** p<.01, ***p<.001. P-values denote statistically significant differences from 25, the percent of teachers in each quartile when compared within district.

48
Table 4Differences in Observation Scores for Low- and High-Ranked Teachers on Both Assessments by DistrictDifferences in Observation Scores for Low- and High-Ranked Teachers on Both Assessments by District
District 1 High
District 1 Low
District 2 High
District 2 Low
District 3 High
District 3 Low
District 4 High
District 4 Low
P-value on test of differences between districts and value-added groupsDistrict 1 Low = District 1 HighDistrict 2 Low = District 2 HighDistrict 3 Low = District 3 HighDistrict 4 Low = District 4 High
District 1 High = District 2 HighDistrict 1 High = District 3 HighDistrict 1 High = District 4 HighDistrict 2 High = District 3 HighDistrict 2 High = District 4 HighDistrict 3 High = District 4 High
District 1 Low = District 2 LowDistrict 1 Low = District 3 LowDistrict 1 Low = District 4 LowDistrict 2 Low = District 3 LowDistrict 2 Low = District 4 LowDistrict 3 Low = District 4 Low
Ambitious Mathematics Instruction
Mathematical Errors and
Imprecisions
Classroom Emotional Support
Classroom Organization
1.601*** 0.053 -0.481* -0.521(0.450) (0.426) (0.226) (0.416)0.628 -1.069 0.510 -0.543
(0.629) (0.806) (0.585) (0.530)-0.132 0.655** -0.816* 0.261(0.220) (0.218) (0.381) (0.267)-0.634* 0.560** -1.139*** -0.826*(0.306) (0.200) (0.296) (0.364)-0.275 -0.531 0.736** 0.406(0.329) (0.489) (0.240) (0.551)
-1.225** -1.160~ -1.232*** -1.465**(0.383) (0.628) (0.265) (0.533)-0.212 0.012 0.370 0.170(0.172) (0.174) (0.297) (0.330)-0.341* -0.436~ -0.012 -0.111(0.155) (0.264) (0.233) (0.223)
P-value on test of differences between districts and value-added groups0.210 0.219 0.115 0.9730.184 0.749 0.504 0.0170.061 0.430 0.000 0.0150.578 0.158 0.312 0.482
0.001 0.210 0.451 0.1160.001 0.368 0.000 0.1810.000 0.928 0.023 0.1950.717 0.028 0.001 0.8120.775 0.022 0.015 0.8310.864 0.297 0.340 0.713
0.073 0.051 0.013 0.6600.013 0.929 0.007 0.2210.137 0.456 0.408 0.4530.230 0.010 0.815 0.3230.394 0.003 0.003 0.0950.034 0.289 0.001 0.020
Observations of Low- or High-Ranked TeachersNotes: ~ p<.10, * p<.05, ** p<.01, ***p<.001. In bottom panel, p-values below .10 are bolded.Notes: ~ p<.10, * p<.05, ** p<.01, ***p<.001. In bottom panel, p-values below .10 are bolded.
54

49
Tabl
e 5
Pre-
Teac
hing
Cha
ract
eris
tics o
f Low
- and
Hig
h-Ra
nked
Tea
cher
s by
Dis
tric
t
Teac
hers
Mal
eA
fric
an-A
mer
ican
Asi
anH
ispa
nic
Whi
teM
KT
Num
Mat
h C
ours
esN
um M
ath
Con
tent
Cou
rses
Num
Mat
h M
etho
ds C
ours
esM
ath
Maj
or o
r Min
orB
ache
lor's
Deg
ree
in E
duca
tion
Cer
tifie
d in
Ele
men
tary
Mat
hTr
aditi
onal
ly C
ertif
ied
Alte
rnat
ivel
y C
ertif
ied
No
Cer
tific
atio
nO
bser
vatio
ns
Pre-
Teac
hing
Cha
ract
eris
tics o
f Low
- and
Hig
h-Ra
nked
Tea
cher
s by
Dis
tric
t
0.25
0.50
0.00
0.00
0.50
-1.0
42.
502.
252.
250.
250.
000.
250.
500.
250.
25 4Low
Dis
trict
1Pr
e-Te
achi
ng C
hara
cter
istic
s of L
ow- a
nd H
igh-
Rank
ed T
each
ers b
y D
istr
ict
Hig
h
0.25
0.00
0.75
0.17
0.00
0.00
0.00
0.00
0.25
0.83
0.11
-0.4
63.
753.
173.
752.
673.
752.
330.
250.
000.
500.
830.
250.
170.
751.
000.
000.
000.
250.
004
6Low
Dis
trict
1D
istri
ct 2
Hig
h
0.25
0.03
0.00
0.92
0.00
0.00
0.00
0.01
1.00
0.07
0.82
-0.5
62.
002.
492.
501.
842.
251.
550.
000.
010.
750.
350.
000.
301.
000.
380.
000.
320.
000.
294
4Low
Dis
trict
2D
istri
ct 3
Hig
hLo
w
0.00
0.20
0.92
0.00
0.00
0.00
0.01
0.00
0.07
1.00
-0.1
6-0
.37
3.00
2.73
2.00
2.20
2.25
2.00
0.25
0.07
0.75
0.53
0.25
0.13
0.50
1.00
0.50
0.00
0.00
0.00
415
Dis
trict
4D
istri
ct 3
Hig
h
0.08
0.01
0.16
0.00
0.83
0.25
3.08
2.46
2.38
0.23
0.46
0.23
0.92
0.08
0.00 13
Dis
trict
4

50
Table 6
District 1 District 2 District 3 District 4Bottom Quartile 20.5 21.6 40.6* 21.5Second Quartile 20.5 27.0 25.0 25.2Third Quartile 29.5 29.7 21.9 24.3Top Quartile 29.5 21.6~ 12.5 29.0Observations 44 37 32 107
Percent of Teachers in Each Value-Added Quartile when Compared Across Districts, Controlling for Teacher Characteristics
Notes: ~ p<.10, * p<.05, ** p<.01, ***p<.001. P-values denote statistically significant differences from 25, the percent of teachers in each quartile when compared within district. Teacher control variables include: gender, race, mathematical knowledge, mathematics/mathematics education coursework, math major or minor indicator, bachelor's degree in education indicator, and certified in elementary math indicator.

51
Table 7
Ambitious Mathematics Instruction
Mathematical Errors and
Imprecisions
Classroom Emotional Support
Classroom Organization
District 1 High 1.679*** -0.364 -0.650~ -0.562(0.283) (0.354) (0.371) (0.557)
District 1 Low 0.853~ -0.789 0.687 -0.486(0.477) (0.602) (0.529) (0.422)
District 2 High -0.454~ 0.312~ -0.908* 0.077(0.252) (0.187) (0.398) (0.258)
District 2 Low -0.525 0.725* -1.184*** -0.900*(0.330) (0.323) (0.348) (0.362)
District 3 High 0.076 -0.422 0.512~ 0.049(0.295) (0.520) (0.266) (0.461)
District 3 Low -1.102* -0.913 -0.631 -0.966***(0.445) (0.557) (0.547) (0.223)
District 4 High -0.449** -0.197 0.243 -0.071(0.146) (0.195) (0.312) (0.327)
District 4 Low -0.414* -0.426 -0.026 -0.145(0.200) (0.293) (0.222) (0.292)
P-value on test of differences between districts and value-added groupsDistrict 1 Low = District 1 High 0.124 0.530 0.038 0.908District 2 Low = District 2 High 0.862 0.254 0.597 0.028District 3 Low = District 3 High 0.022 0.490 0.043 0.030District 4 Low = District 4 High 0.869 0.494 0.450 0.863
District 1 High = District 2 High 0.000 0.079 0.621 0.284District 1 High = District 3 High 0.000 0.922 0.007 0.374District 1 High = District 4 High 0.000 0.678 0.056 0.430District 2 High = District 3 High 0.166 0.192 0.003 0.958District 2 High = District 4 High 0.985 0.052 0.020 0.705District 3 High = District 4 High 0.112 0.684 0.496 0.829
District 1 Low = District 2 Low 0.019 0.027 0.003 0.456District 1 Low = District 3 Low 0.002 0.876 0.079 0.263District 1 Low = District 4 Low 0.015 0.586 0.208 0.524District 2 Low = District 3 Low 0.298 0.010 0.393 0.875District 2 Low = District 4 Low 0.753 0.006 0.003 0.083District 3 Low = District 4 Low 0.170 0.436 0.306 0.036
Differences in Observation Scores for Low- and High-Ranked Teachers on Both Assessments by District, Controlling for Teacher Characteristics
Observations of Low- or High-Ranked TeachersNotes: ~ p<.10, * p<.05, ** p<.01, ***p<.001. In bottom panel, p-values below .10 are bolded.
54

52
Appendices
App
endi
x A
1D
iffer
ence
s in
Obs
erva
tion
Scor
es fo
r Low
- and
Hig
h-Ra
nked
Tea
cher
s by
Dis
tric
t and
Ass
essm
ent
Am
bitio
us
Mat
hem
atic
s In
stru
ctio
n
Mat
hem
atic
al
Erro
rs a
nd
Impr
ecis
ions
Cla
ssro
om
Emot
iona
l Su
ppor
t
Cla
ssro
om
Org
aniz
atio
n
Am
bitio
us
Mat
hem
atic
s In
stru
ctio
n
Mat
hem
atic
al
Erro
rs a
nd
Impr
ecis
ions
Cla
ssro
om
Emot
iona
l Su
ppor
t
Cla
ssro
om
Org
aniz
atio
n
Dis
trict
1 H
igh
1.85
8***
0.37
50.
073
-0.3
021.
669*
**0.
567*
-0.4
30*
-0.0
01(0
.384
)(0
.240
)(0
.227
)(0
.367
)(0
.301
)(0
.236
)(0
.210
)(0
.296
)D
istri
ct 1
Low
0.84
3-0
.870
0.08
3-0
.894
~0.
829*
-0.4
010.
415
-0.1
82(0
.516
)(0
.702
)(0
.502
)(0
.470
)(0
.415
)(0
.438
)(0
.264
)(0
.257
)D
istri
ct 2
Hig
h0.
005
0.60
0*-0
.265
0.62
2*-0
.202
~0.
389~
-0.5
78-0
.147
(0.2
05)
(0.2
40)
(0.4
36)
(0.2
78)
(0.1
12)
(0.2
31)
(0.3
53)
(0.2
38)
Dis
trict
2 L
ow-0
.541
*0.
442*
-0.7
20*
-0.7
71*
-0.3
970.
614*
**-0
.887
***
-0.4
74(0
.216
)(0
.200
)(0
.338
)(0
.310
)(0
.279
)(0
.136
)(0
.250
)(0
.393
)D
istri
ct 3
Hig
h-0
.275
-0.5
310.
736*
*0.
406
0.09
50.
004
0.57
8*0.
070
(0.3
29)
(0.4
89)
(0.2
40)
(0.5
51)
(0.3
49)
(0.4
55)
(0.2
47)
(0.4
20)
Dis
trict
3 L
ow-0
.828
***
-0.4
64-0
.392
-0.6
54~
-0.9
23**
*-1
.052
*-0
.618
~-0
.582
(0.1
94)
(0.3
97)
(0.2
78)
(0.3
39)
(0.2
49)
(0.4
12)
(0.3
50)
(0.4
26)
Dis
trict
4 H
igh
-0.2
56*
-0.0
780.
134
0.11
7-0
.307
*-0
.062
0.31
20.
151
(0.1
11)
(0.1
39)
(0.1
69)
(0.1
64)
(0.1
27)
(0.1
84)
(0.2
05)
(0.1
98)
Dis
trict
4 L
ow-0
.166
-0.3
95~
-0.1
20-0
.070
-0.1
39-0
.124
0.19
9-0
.017
(0.1
57)
(0.2
02)
(0.1
86)
(0.1
85)
(0.1
36)
(0.1
75)
(0.1
73)
(0.1
71)
P-v
alue
on
test
of d
iffer
ence
s bet
wee
n di
stric
ts a
nd v
alue
-add
ed g
roup
sD
istri
ct 1
Low
= D
istri
ct 1
Hig
h0.
116
0.09
50.
986
0.32
20.
103
0.05
30.
013
0.64
4D
istri
ct 2
Low
= D
istri
ct 2
Hig
h0.
068
0.61
30.
411
0.00
10.
517
0.40
20.
476
0.47
7D
istri
ct 3
Low
= D
istri
ct 3
Hig
h0.
149
0.91
60.
002
0.10
30.
019
0.08
70.
006
0.27
7D
istri
ct 4
Low
= D
istri
ct 4
Hig
h0.
643
0.19
80.
313
0.45
10.
367
0.80
90.
672
0.52
0
Dis
trict
1 H
igh
= D
istri
ct 2
Hig
h0.
000
0.50
80.
493
0.04
60.
000
0.58
90.
719
0.70
1D
istri
ct 1
Hig
h =
Dis
trict
3 H
igh
0.00
00.
097
0.04
60.
286
0.00
10.
273
0.00
20.
890
Dis
trict
1 H
igh
= D
istri
ct 4
Hig
h0.
000
0.10
40.
831
0.29
90.
000
0.03
60.
012
0.66
9D
istri
ct 2
Hig
h =
Dis
trict
3 H
igh
0.47
00.
039
0.04
60.
727
0.42
00.
452
0.00
80.
654
Dis
trict
2 H
igh
= D
istri
ct 4
Hig
h0.
265
0.01
50.
395
0.11
90.
537
0.12
80.
030
0.33
6D
istri
ct 3
Hig
h =
Dis
trict
4 H
igh
0.95
50.
373
0.04
20.
615
0.28
10.
893
0.41
00.
861
Dis
trict
1 L
ow =
Dis
trict
2 L
ow0.
014
0.07
40.
186
0.82
70.
015
0.02
80.
000
0.53
5D
istri
ct 1
Low
= D
istri
ct 3
Low
0.00
30.
616
0.41
00.
679
0.00
00.
280
0.01
90.
423
Dis
trict
1 L
ow =
Dis
trict
4 L
ow0.
063
0.51
60.
705
0.10
40.
028
0.55
70.
493
0.59
3D
istri
ct 2
Low
= D
istri
ct 3
Low
0.32
40.
043
0.45
40.
800
0.16
00.
000
0.53
20.
852
Dis
trict
2 L
ow =
Dis
trict
4 L
ow0.
162
0.00
40.
122
0.05
30.
406
0.00
10.
000
0.28
8D
istri
ct 3
Low
= D
istri
ct 4
Low
0.00
90.
876
0.41
90.
131
0.00
60.
039
0.03
80.
220
Stat
e Ass
essm
ent
Proj
ect-A
dmin
iste
red
Ass
essm
ent
Obs
erva
tions
of L
ow- o
r Hig
h-R
anke
d Te
ache
rsN
otes
: ~ p
<.10
, * p
<.05
, **
p<.0
1, *
**p<
.001
. In
botto
m p
anel
, p-v
alue
s bel
ow .1
0 ar
e bo
lded
.10
510
7

53
Tabl
e A2
Aver
age
Scor
es o
n W
hole
-Les
son
Cod
es b
y D
istr
ict a
nd V
alue
-Add
ed Q
uart
ileD
istri
ct 1
Hig
h
Aver
age
Scor
es o
n W
hole
-Les
son
Cod
es b
y D
istr
ict a
nd V
alue
-Add
ed Q
uart
ileD
istri
ct 1 Lo
w
Aver
age
Scor
es o
n W
hole
-Les
son
Cod
es b
y D
istr
ict a
nd V
alue
-Add
ed Q
uart
ileD
istri
ct 2
Hig
hDis
trict
2 Low
Dis
trict
3H
ighDis
trict
3 Low
Dis
trict
4H
ighDis
trict
4 Low
Teac
her U
ses S
tude
nt Id
eas
4.22
Teac
her A
ttend
s to
and
Rem
edia
tes S
tude
nt D
iffic
ulty
4.28
Stud
ents
are
Eng
aged
3.67
Cla
ssro
om is
Cha
ract
eriz
ed b
y M
athe
mat
ical
Inqu
iry4.
33Le
sson
Tim
e is
Use
d Ef
ficie
ntly
3.
17D
ensi
ty o
f the
Mat
hem
atic
s is H
igh
3.78
Laun
ch o
f Tas
k3.
17M
athe
mat
ics o
f the
Les
son
is C
lear
and
not
Dis
torte
d4.
28Ta
sks a
nd A
ctiv
ities
Dev
elop
Mat
hem
atic
s 4.
00N
otes
: Mea
ns a
re c
alcu
late
d ac
ross
rate
rs, l
esso
ns, a
nd te
ache
rs.
2.83
3.11
3.11
2.72
2.39
2.22
2.83
3.33
2.61
2.33
2.89
3.28
2.28
2.89
2.39
3.17
3.33
2.56
2.22
3.06
2.78
2.44
2.50
2.22
3.00
3.61
2.78
3.08
3.42
3.92
3.08
3.00
2.50
2.92
3.08
2.75
2.06
2.56
2.94
2.28
2.50
2.00
2.67
2.28
2.00
3.39
3.50
3.83
3.00
3.00
3.22
3.06
3.22
3.28
2.33
2.78
3.11
2.17
2.67
2.17
2.94
2.61
2.67