Embed Size (px)
Citation preview
What do we need to have a good design? Good sampling, changing one variable and keeping everything else the same
Design refers to the total architectural plan and the underlying structure of the research framework.
Experimental design refers to the entire experimental approach to a research problem.
1
1
2
2
3
1
4

3
5
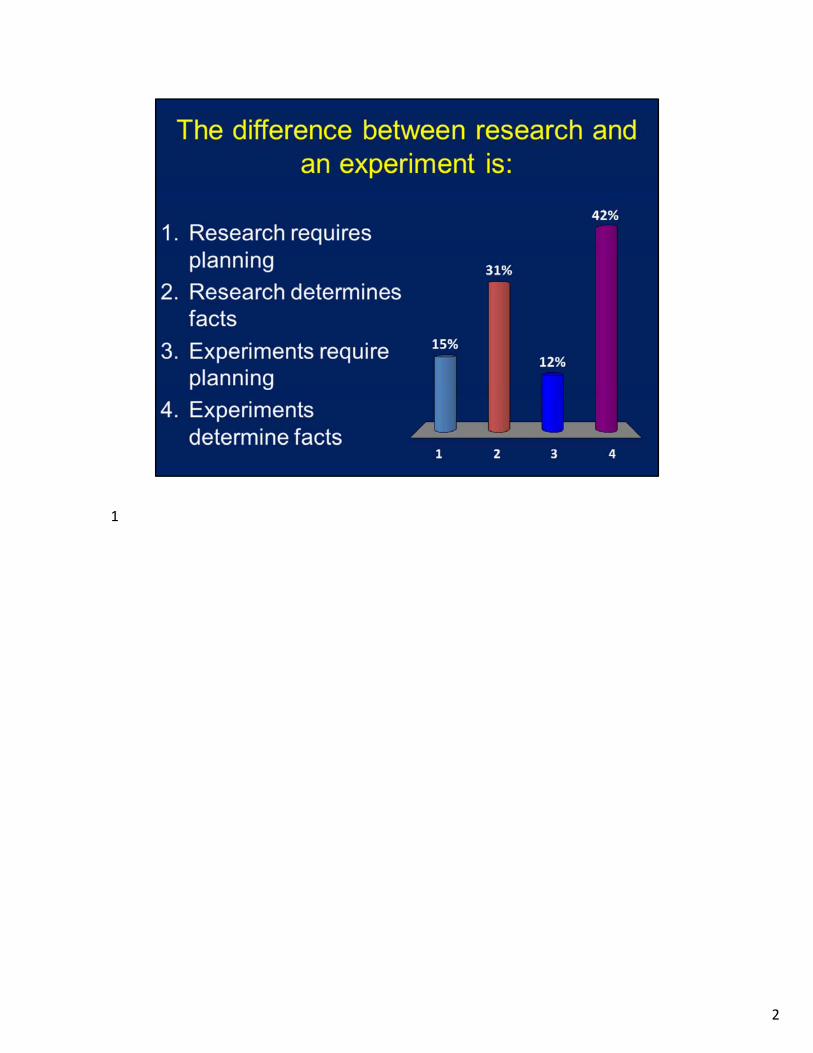
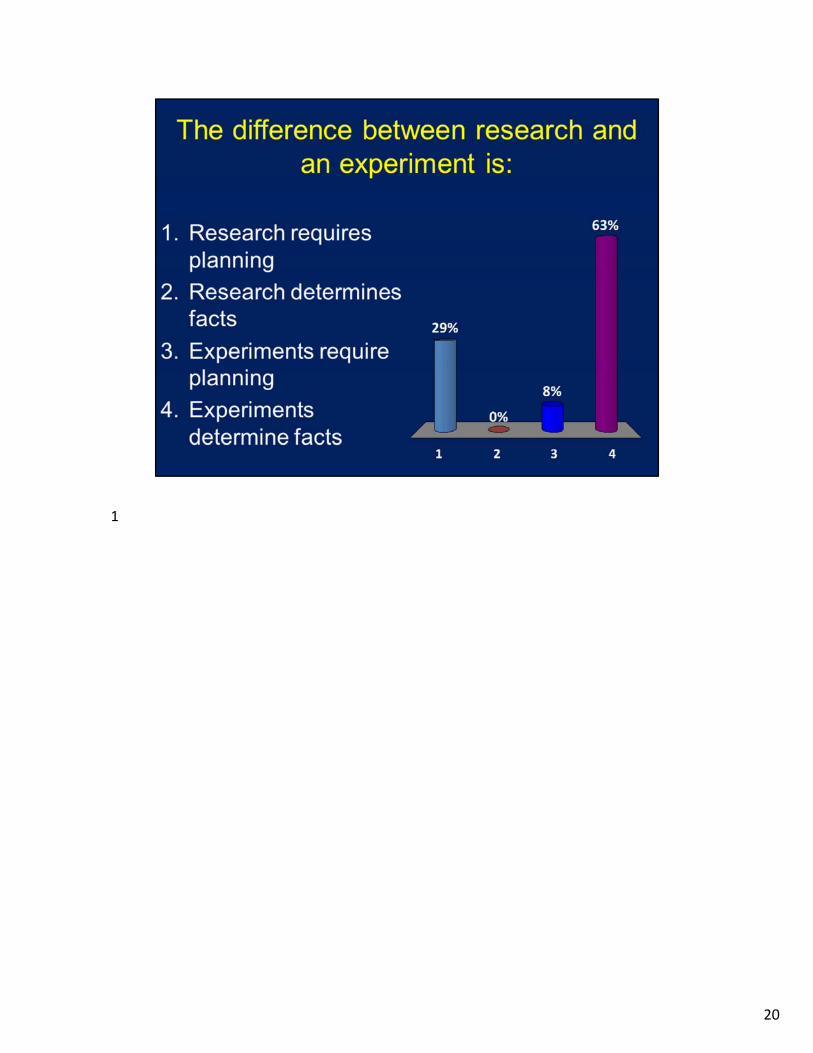
Experiment: determining a fact…measuring N content of soil (for a farmer)Research: determining a fact but also includes interpreting findings…measuring N content of soil under different types of vegetation, different landscape position, etc…..must be plannedAlso research needs to be planned
6
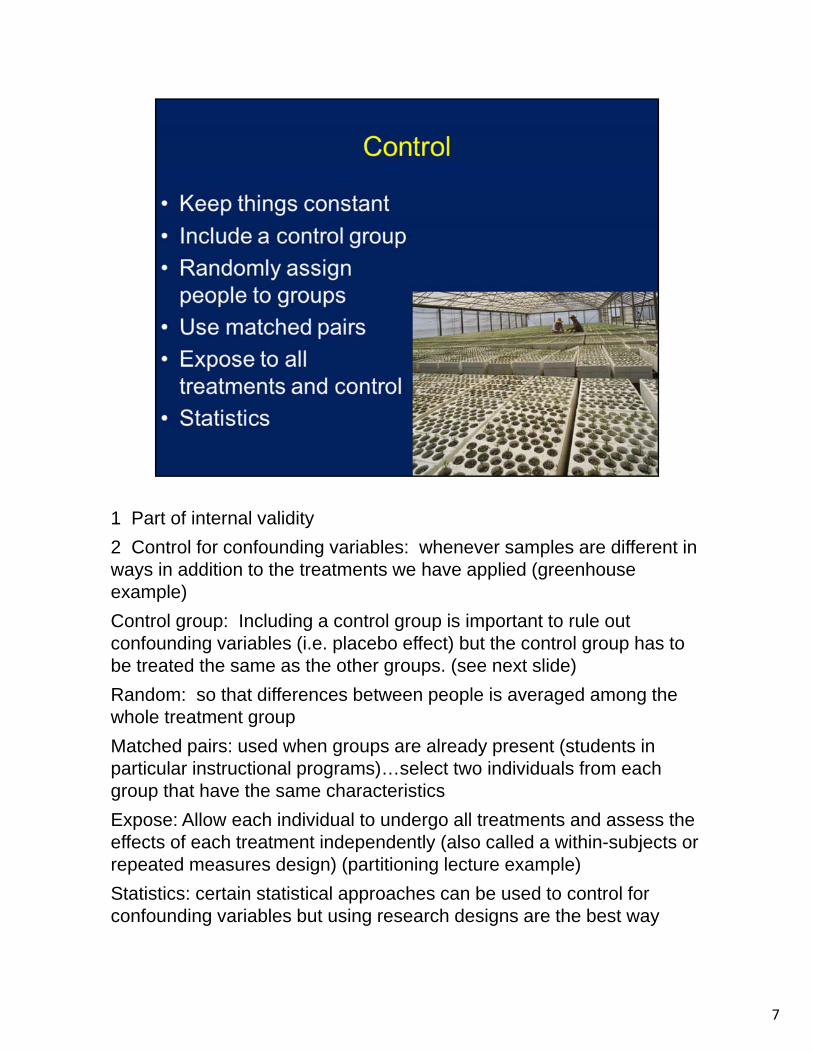
1 Part of internal validity
2 Control for confounding variables: whenever samples are different in ways in addition to the treatments we have applied (greenhouse example)
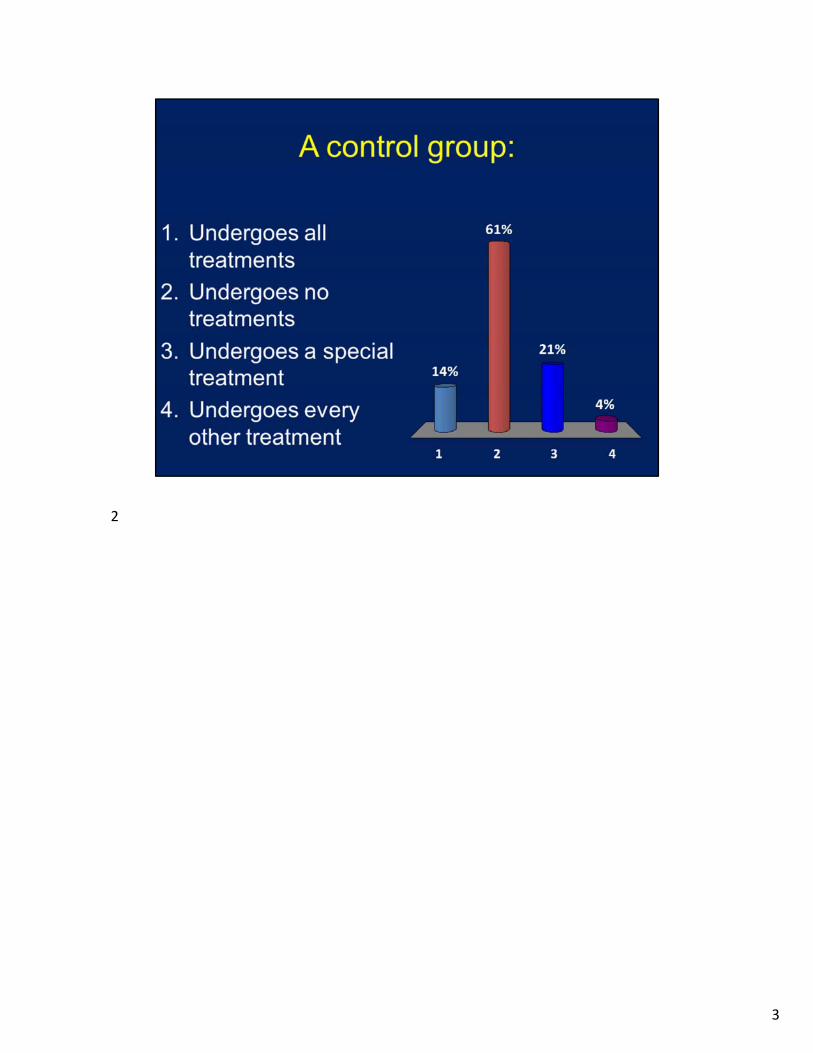
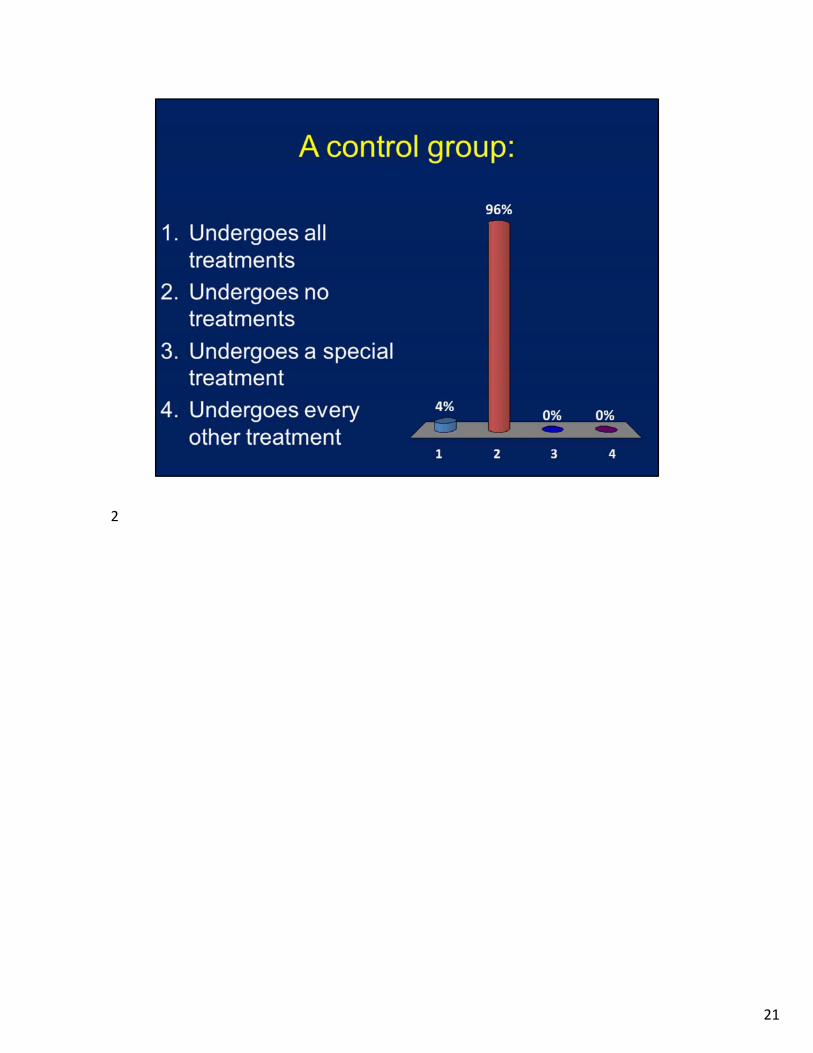
Control group: Including a control group is important to rule out confounding variables (i.e. placebo effect) but the control group has to be treated the same as the other groups. (see next slide)
Random: so that differences between people is averaged among the whole treatment group
Matched pairs: used when groups are already present (students in particular instructional programs)…select two individuals from each group that have the same characteristics
Expose: Allow each individual to undergo all treatments and assess the effects of each treatment independently (also called a within-subjects or repeated measures design) (partitioning lecture example)
Statistics: certain statistical approaches can be used to control for confounding variables but using research designs are the best way
7

It is very important to do the same thing to the control group as is done to the variable groups, everything except for the variable itself.
In applying biosolids a large truck was used for spreading. The truck was driven over the control plot without spreading manure to make everything the same.
8
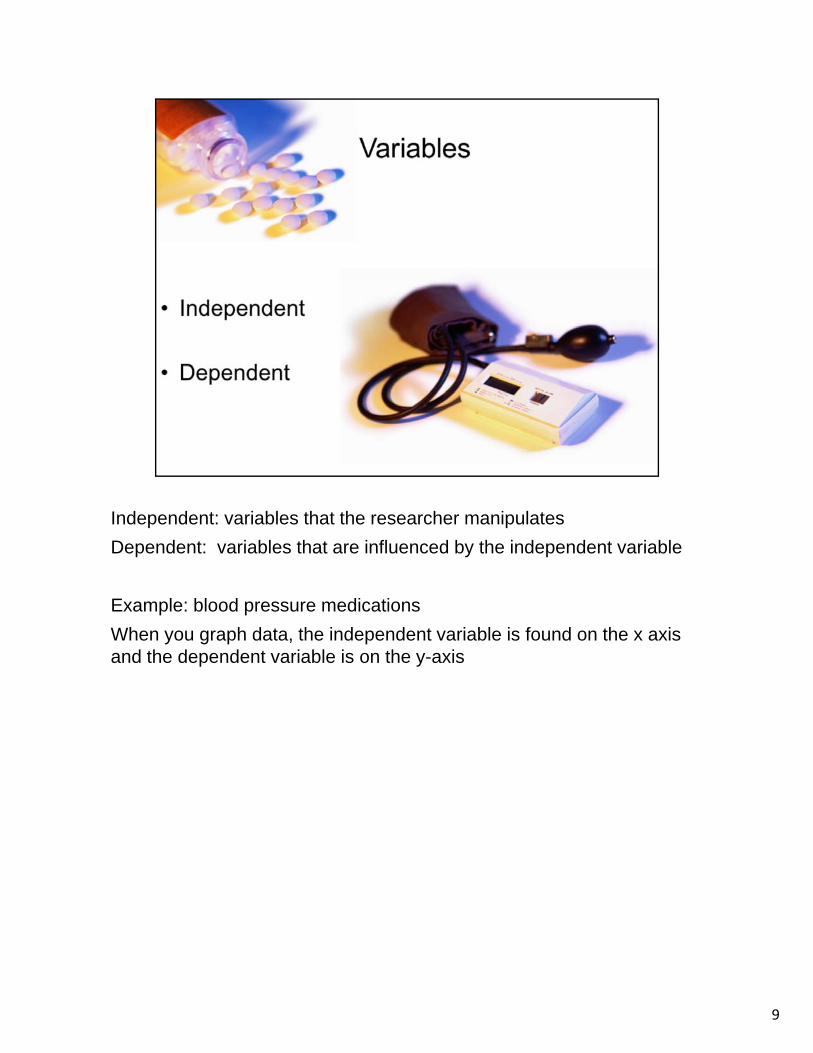
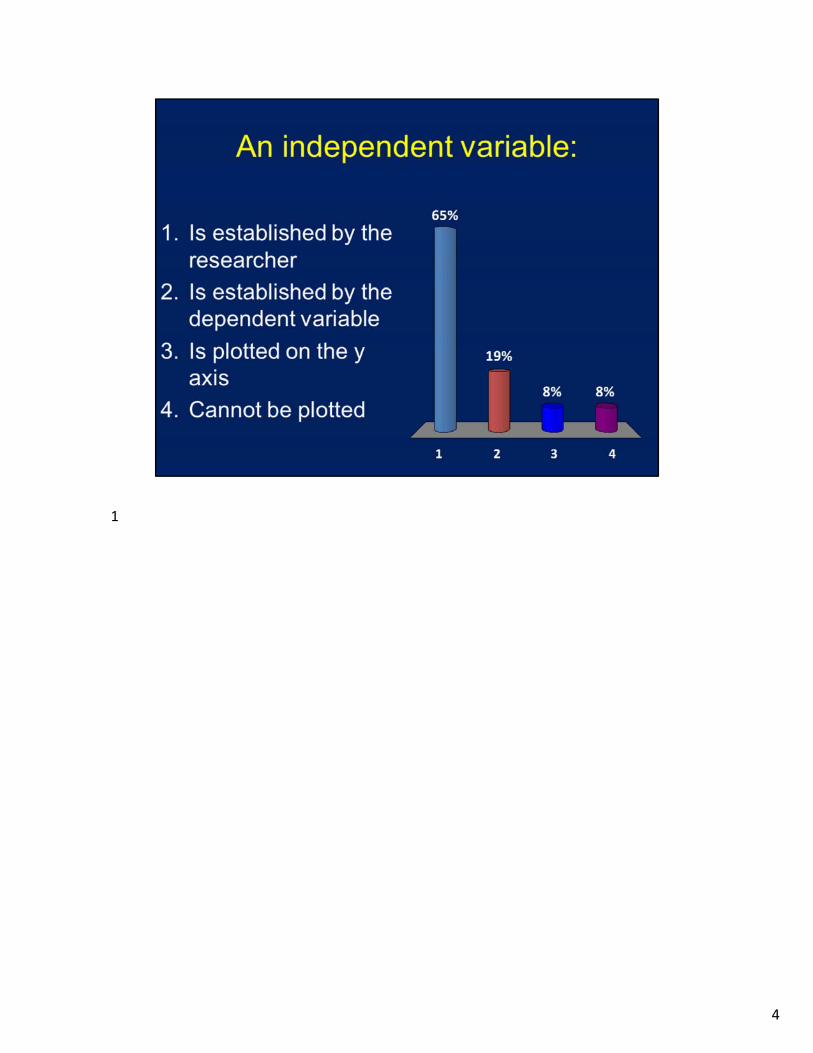
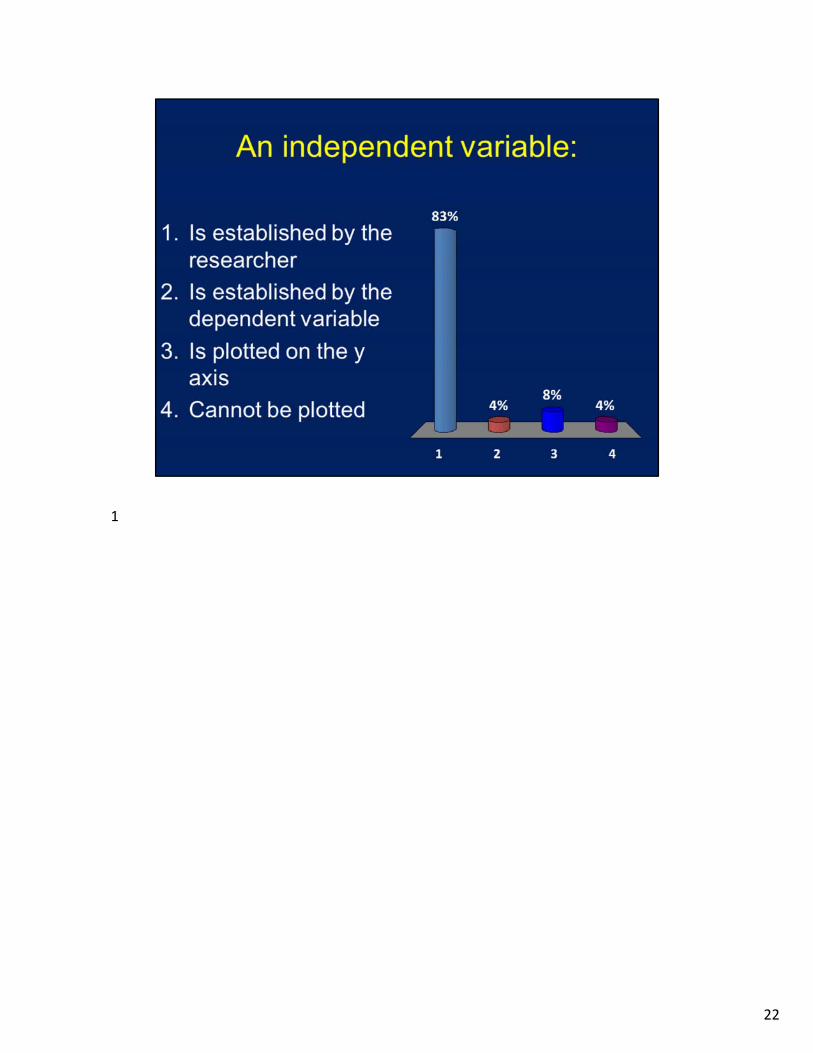
Independent: variables that the researcher manipulates
Dependent: variables that are influenced by the independent variable
Example: blood pressure medications
When you graph data, the independent variable is found on the x axis and the dependent variable is on the y-axis
9
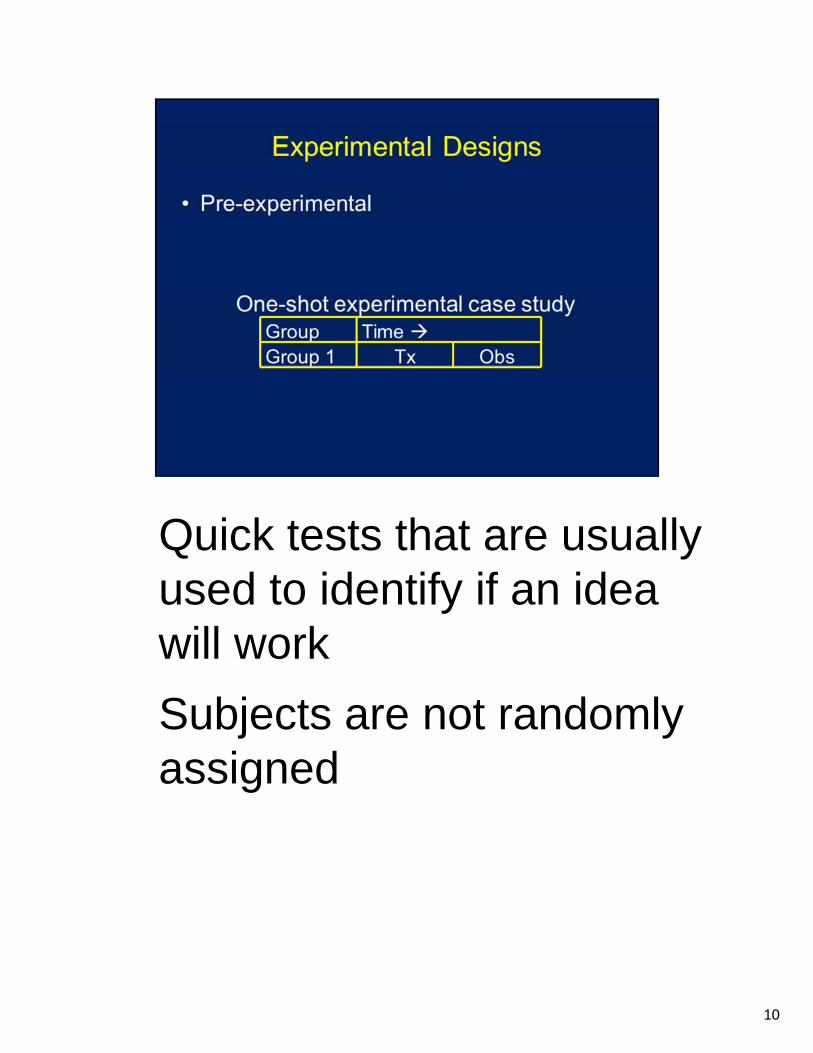
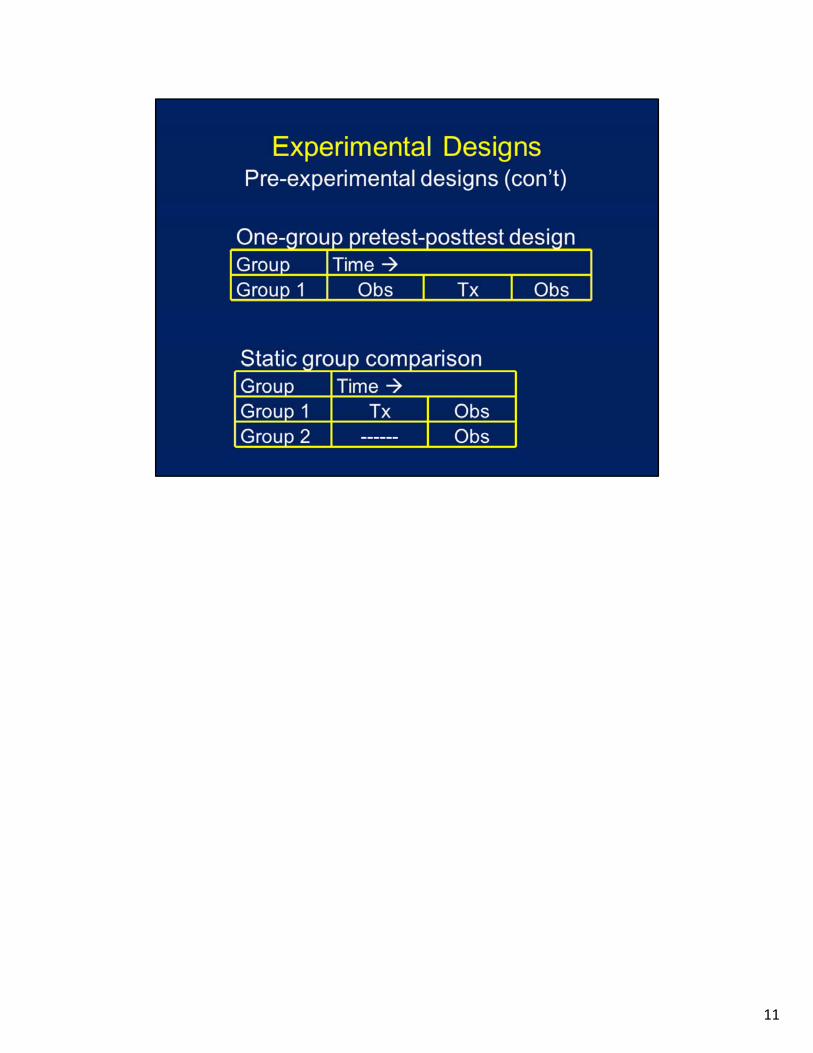
Quick tests that are usually used to identify if an idea will work
Subjects are not randomly assigned
10
11
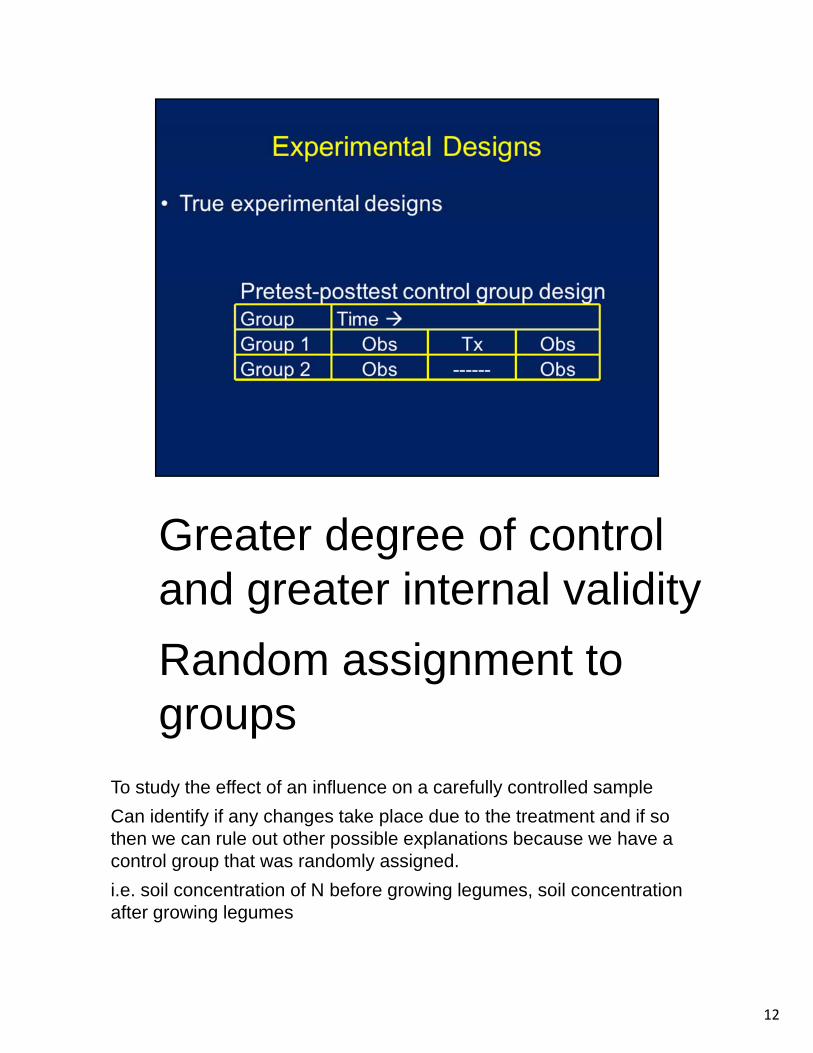
Greater degree of control and greater internal validity
Random assignment to groups
To study the effect of an influence on a carefully controlled sample
Can identify if any changes take place due to the treatment and if so then we can rule out other possible explanations because we have a control group that was randomly assigned.
i.e. soil concentration of N before growing legumes, soil concentration after growing legumes
12
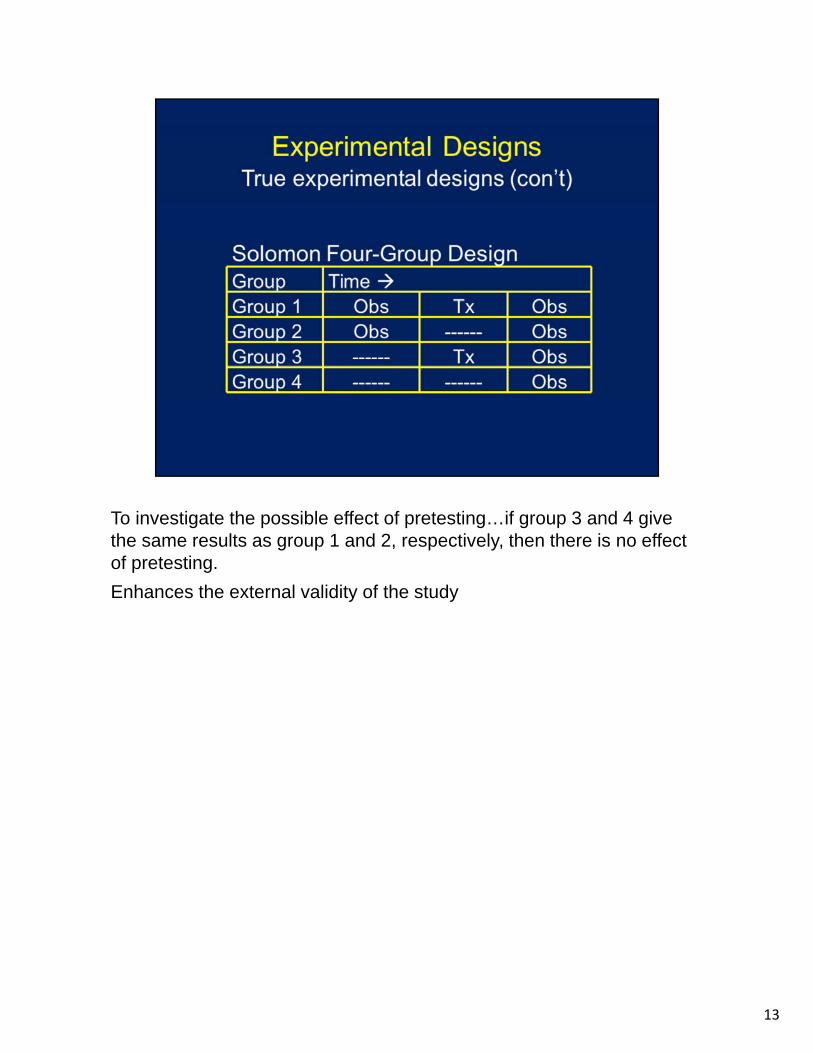
To investigate the possible effect of pretesting…if group 3 and 4 give the same results as group 1 and 2, respectively, then there is no effect of pretesting.
Enhances the external validity of the study
13
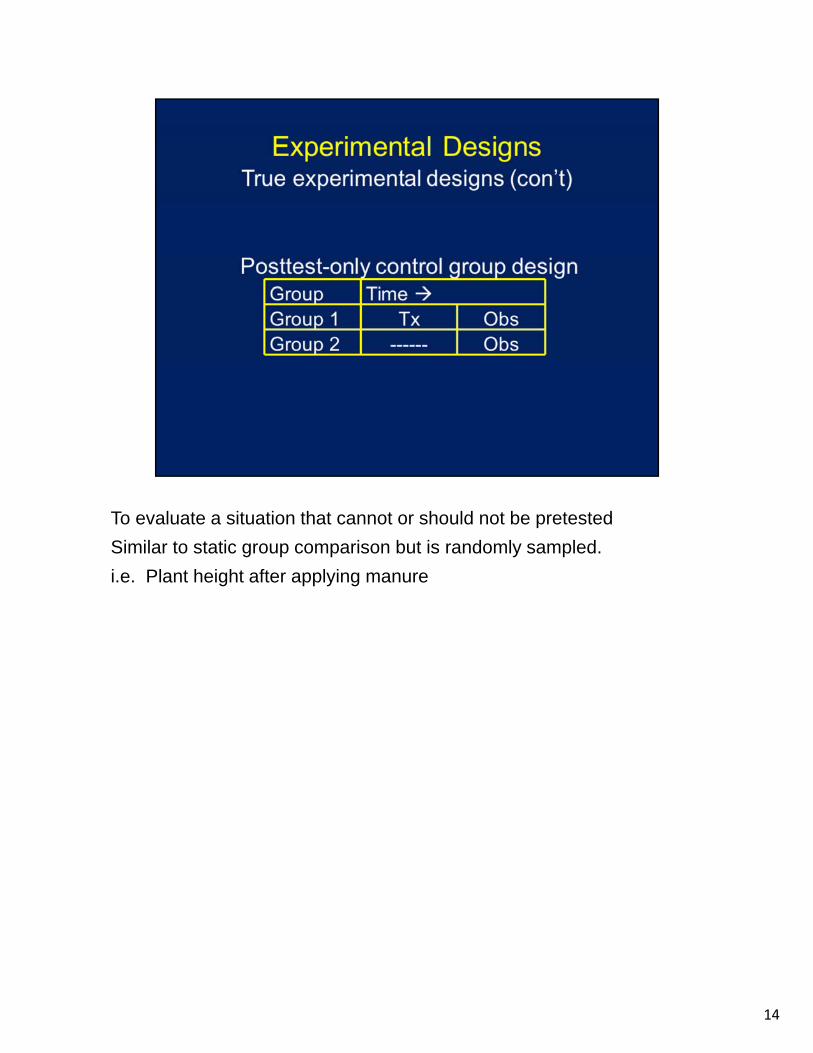
To evaluate a situation that cannot or should not be pretested
Similar to static group comparison but is randomly sampled.
i.e. Plant height after applying manure
14
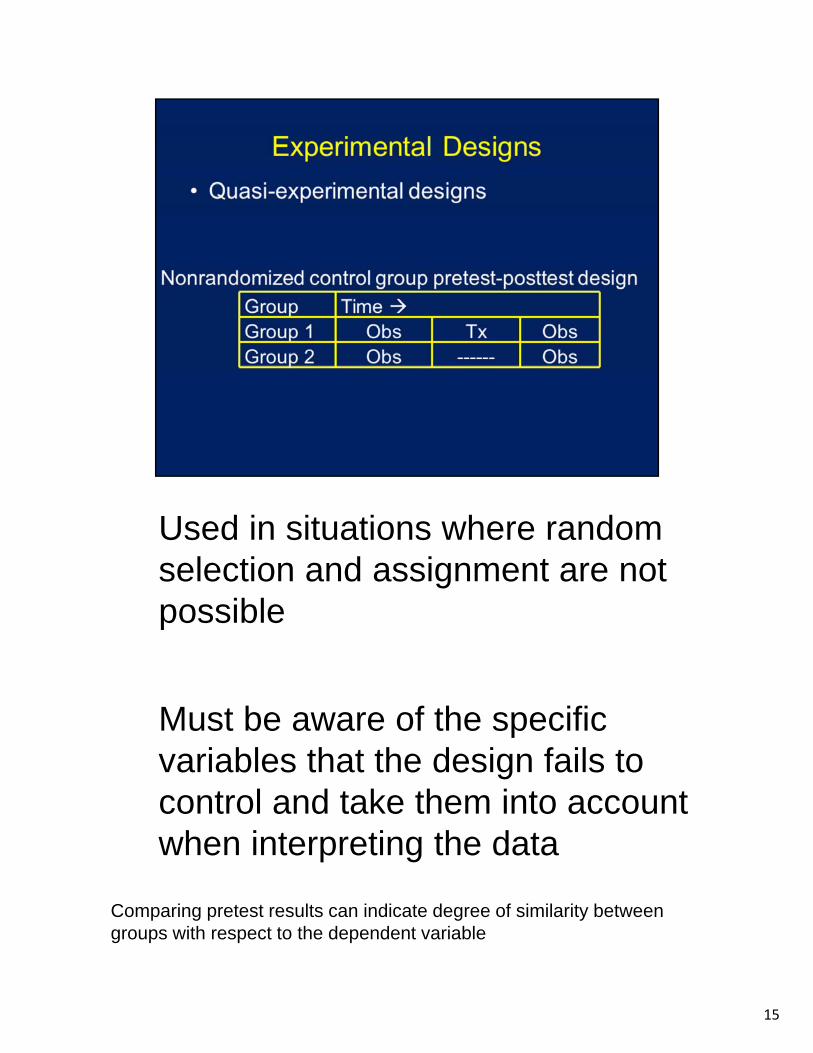
Used in situations where random selection and assignment are not possible
Must be aware of the specific variables that the design fails to control and take them into account when interpreting the data
Comparing pretest results can indicate degree of similarity between groups with respect to the dependent variable
15
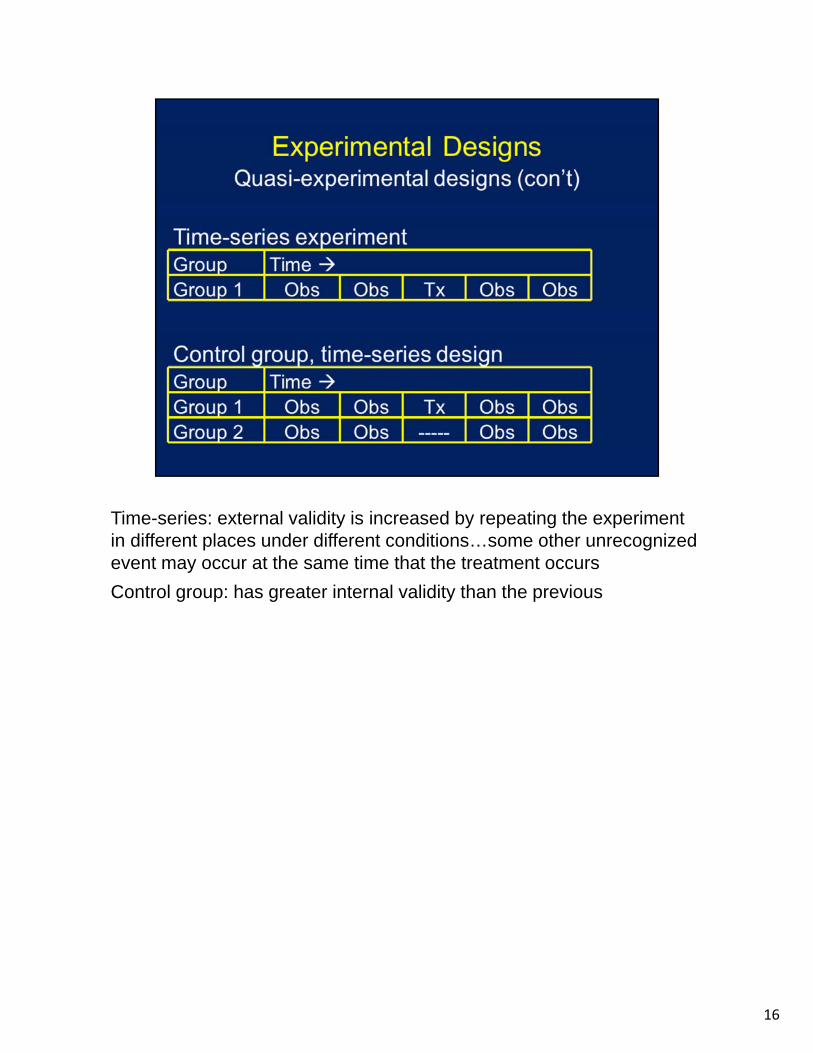
Time-series: external validity is increased by repeating the experiment in different places under different conditions…some other unrecognized event may occur at the same time that the treatment occurs
Control group: has greater internal validity than the previous
16
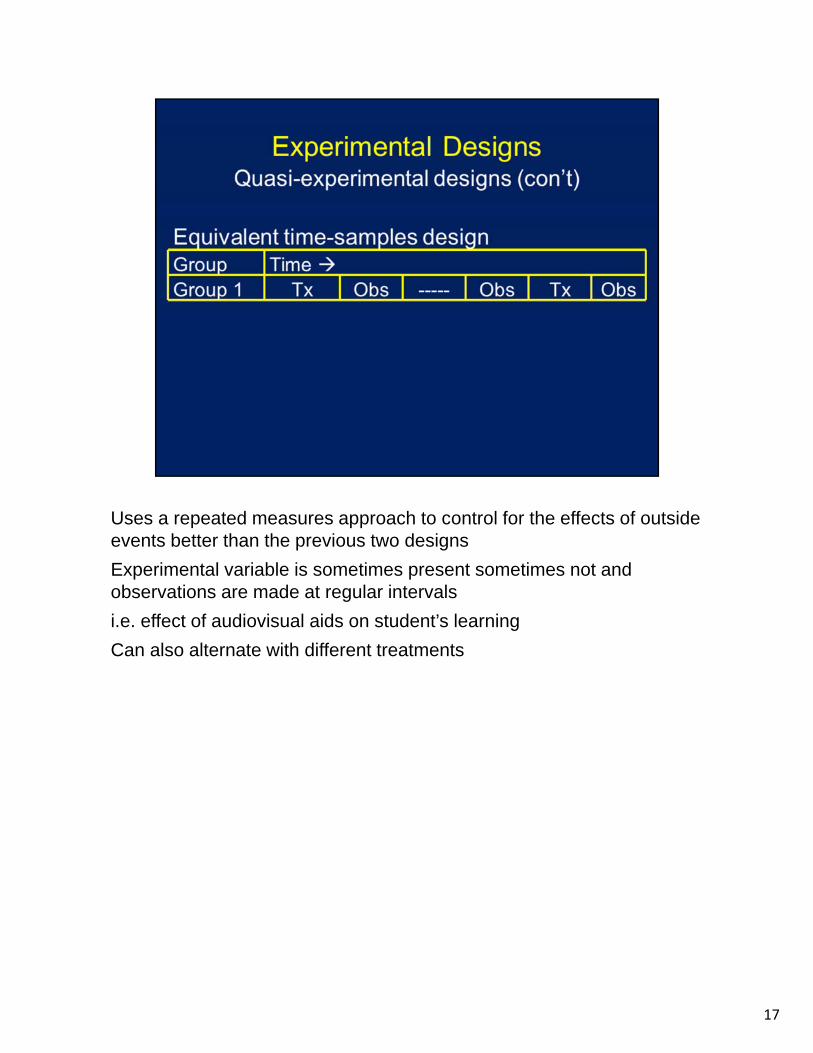
Uses a repeated measures approach to control for the effects of outside events better than the previous two designs
Experimental variable is sometimes present sometimes not and observations are made at regular intervals
i.e. effect of audiovisual aids on student’s learning
Can also alternate with different treatments
17
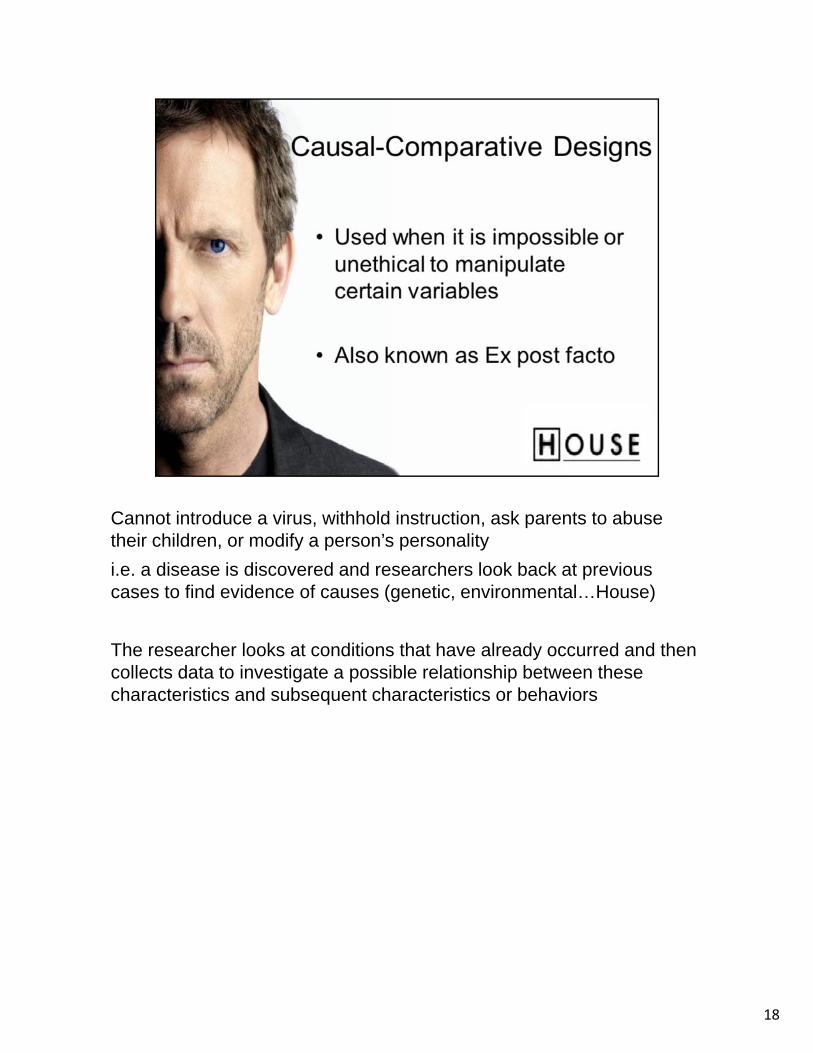
Cannot introduce a virus, withhold instruction, ask parents to abuse their children, or modify a person’s personality
i.e. a disease is discovered and researchers look back at previous cases to find evidence of causes (genetic, environmental…House)
The researcher looks at conditions that have already occurred and then collects data to investigate a possible relationship between these characteristics and subsequent characteristics or behaviors
18
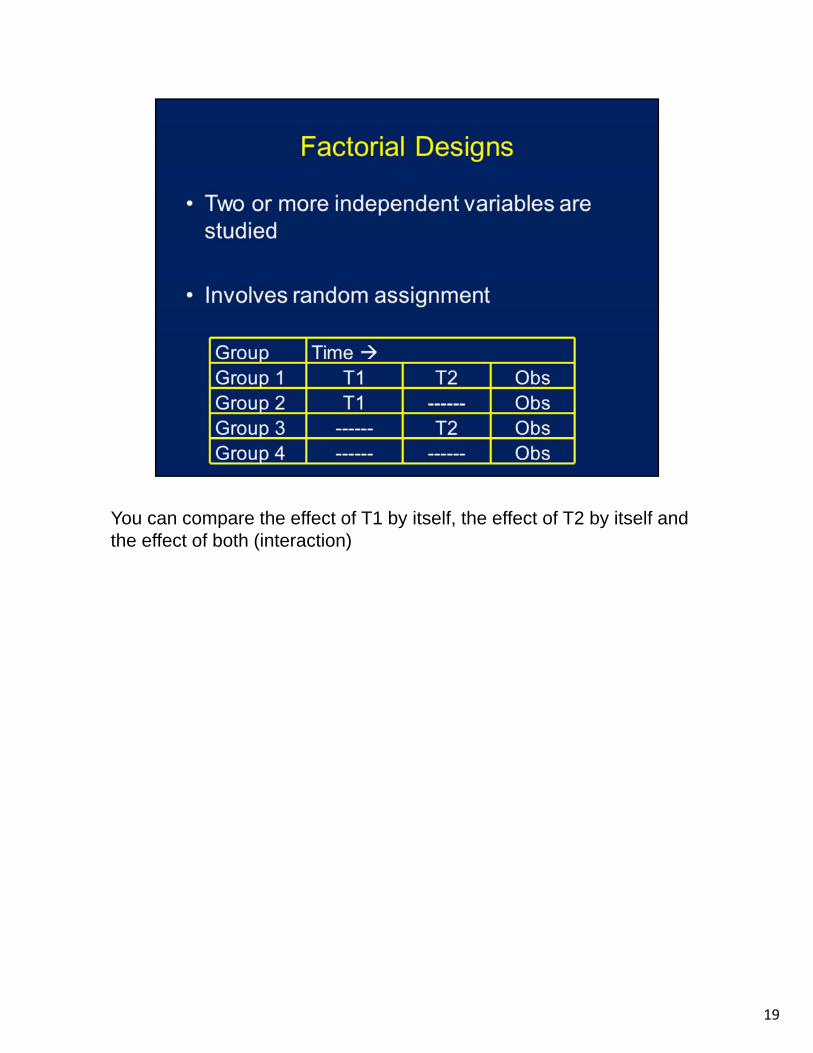
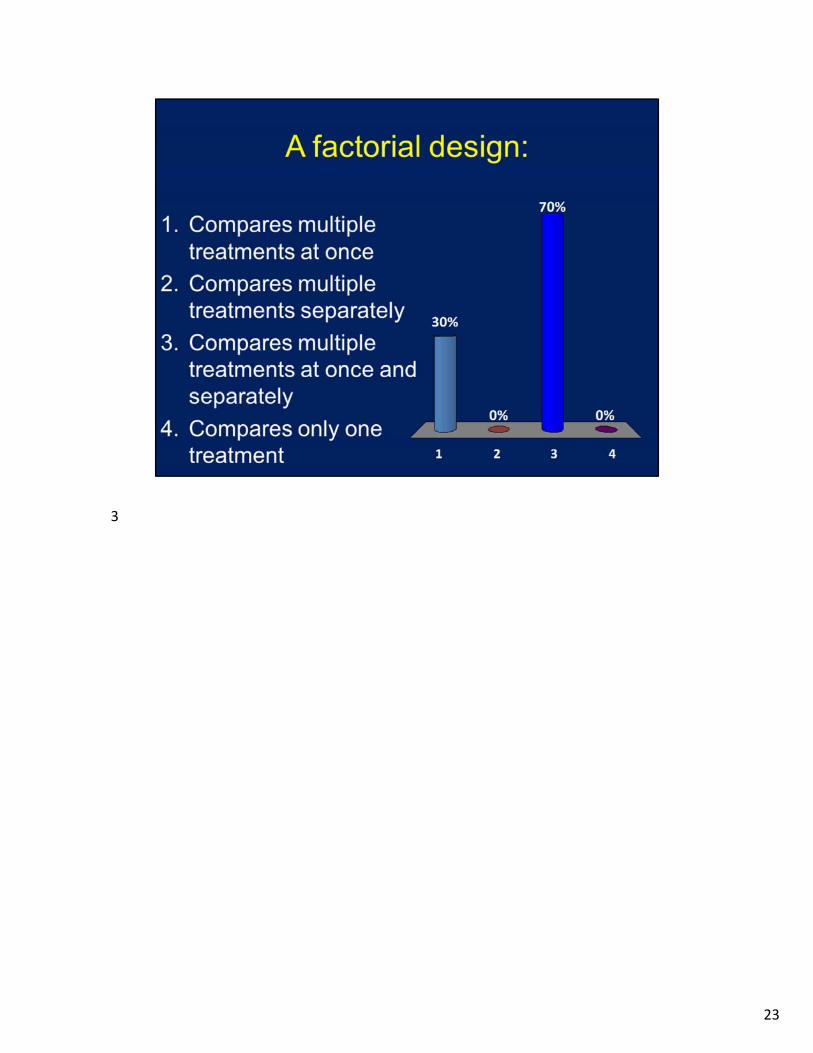
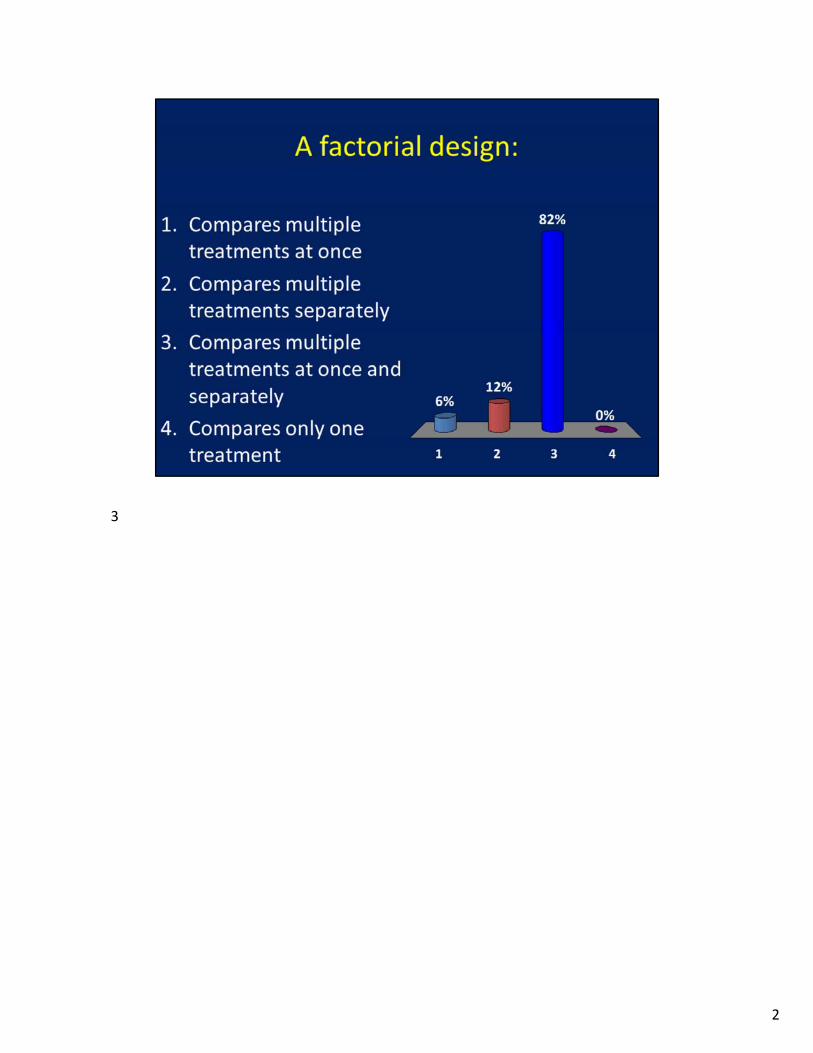
You can compare the effect of T1 by itself, the effect of T2 by itself and the effect of both (interaction)
19
1
20
2
21
1
22
3
23

1
3
2
1
3

3
4
3
5
2
6
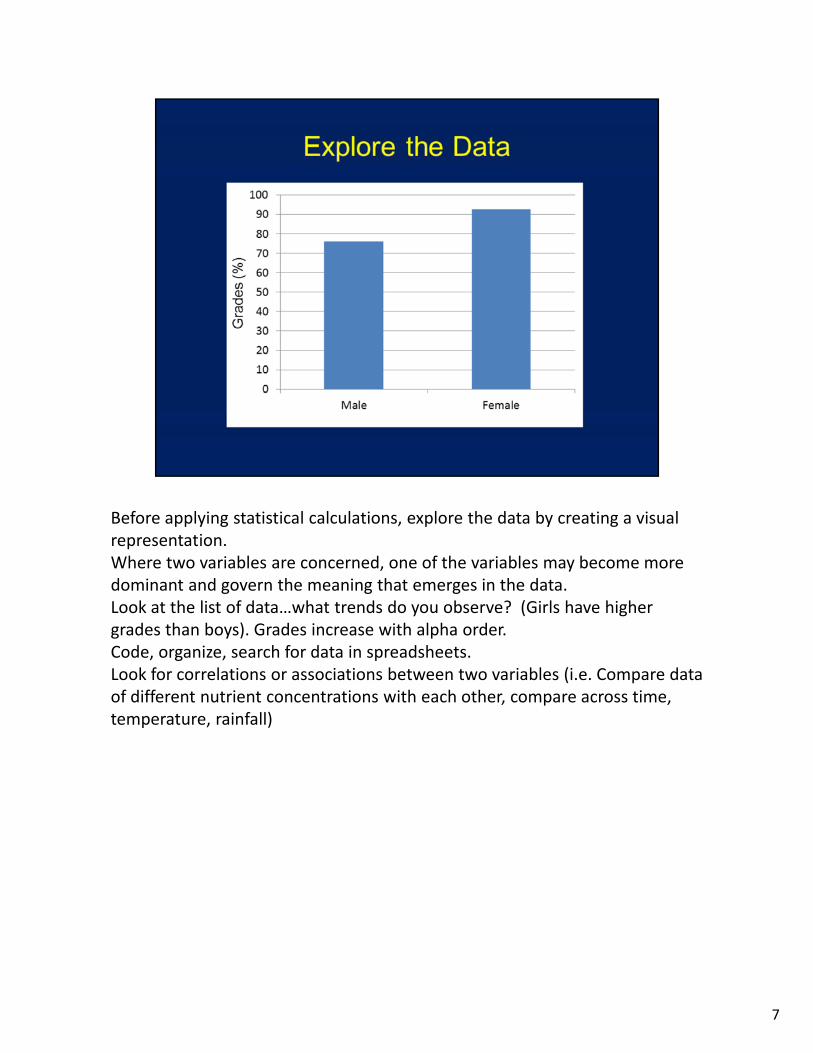
Before applying statistical calculations, explore the data by creating a visual representation.Where two variables are concerned, one of the variables may become more dominant and govern the meaning that emerges in the data.Look at the list of data…what trends do you observe? (Girls have higher grades than boys). Grades increase with alpha order.Code, organize, search for data in spreadsheets. Look for correlations or associations between two variables (i.e. Compare data of different nutrient concentrations with each other, compare across time, temperature, rainfall)
7
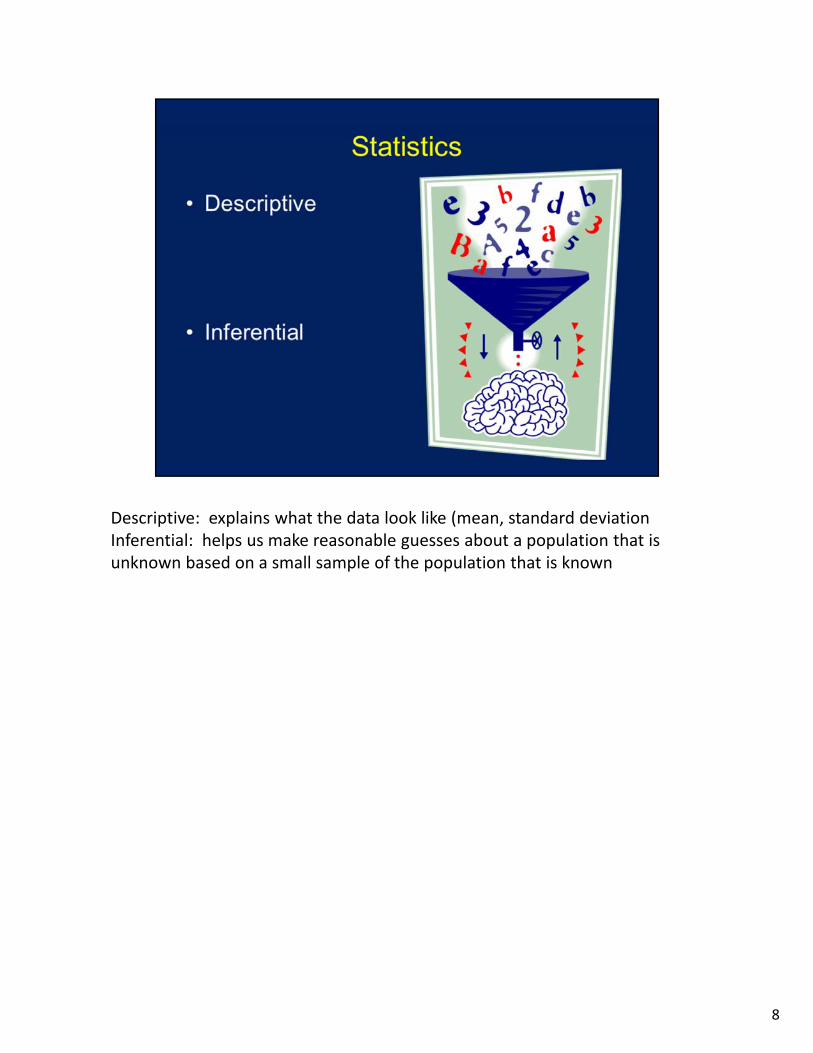
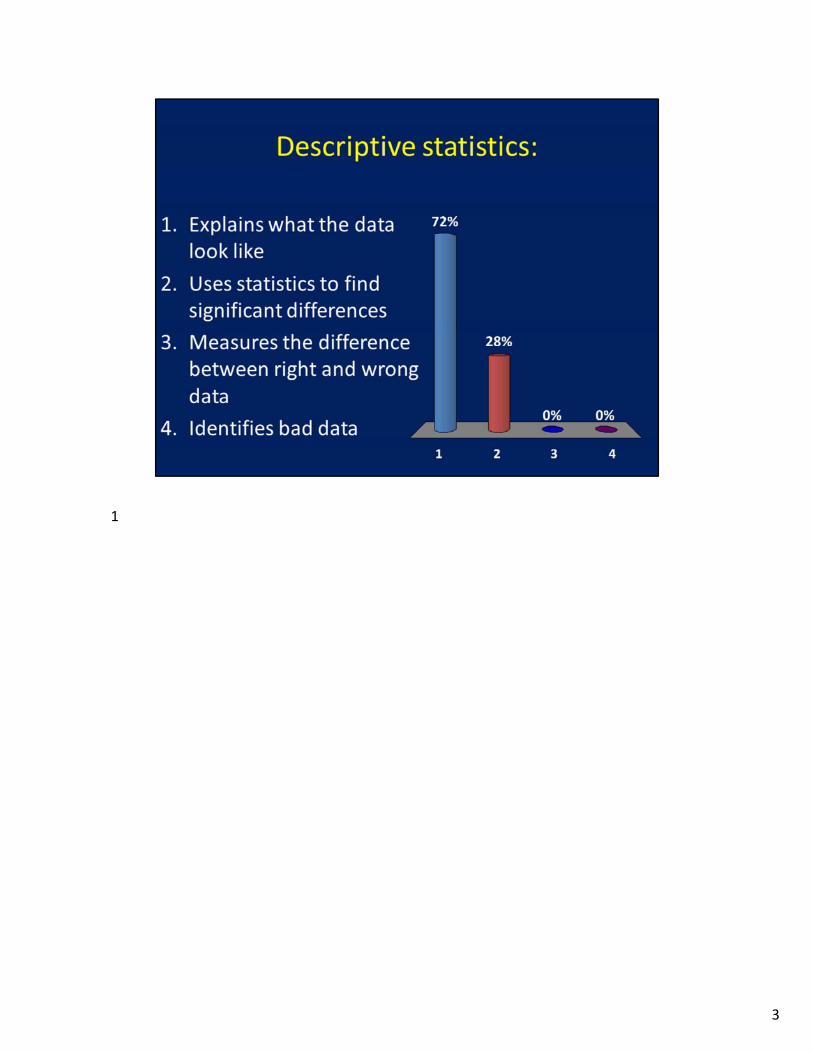
Descriptive: explains what the data look like (mean, standard deviationInferential: helps us make reasonable guesses about a population that is unknown based on a small sample of the population that is known
8
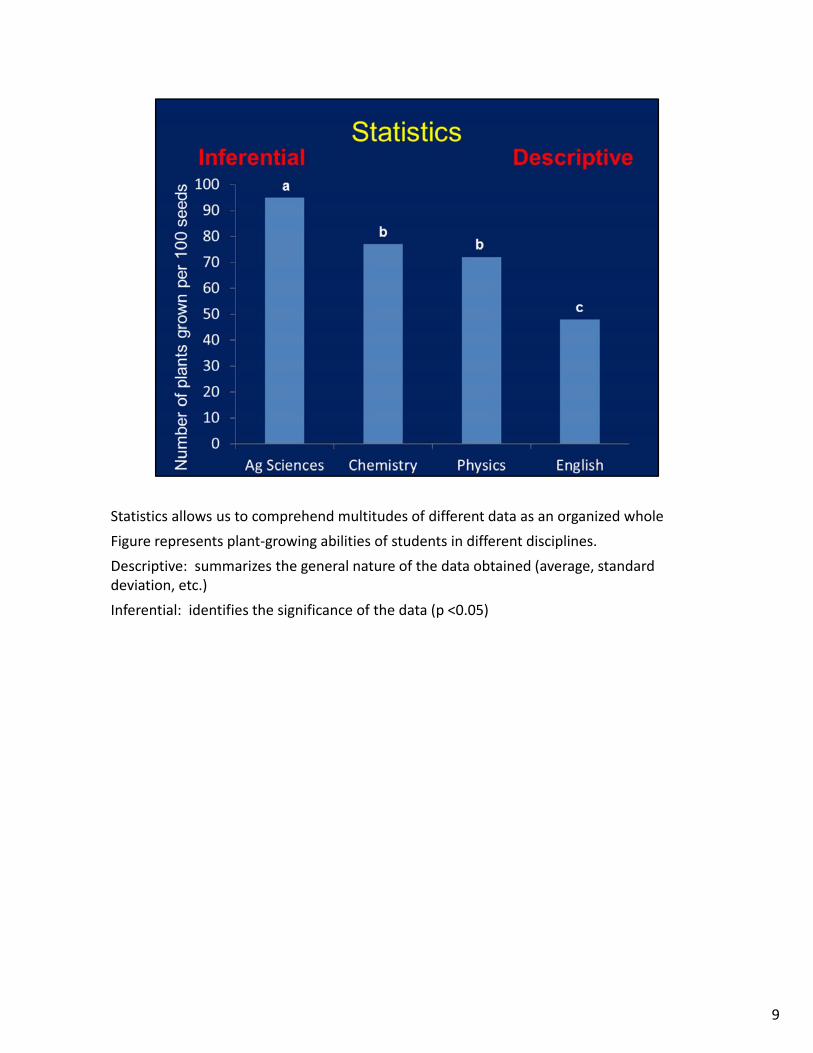
Statistics allows us to comprehend multitudes of different data as an organized whole
Figure represents plant‐growing abilities of students in different disciplines.
Descriptive: summarizes the general nature of the data obtained (average, standard deviation, etc.)
Inferential: identifies the significance of the data (p <0.05)
9
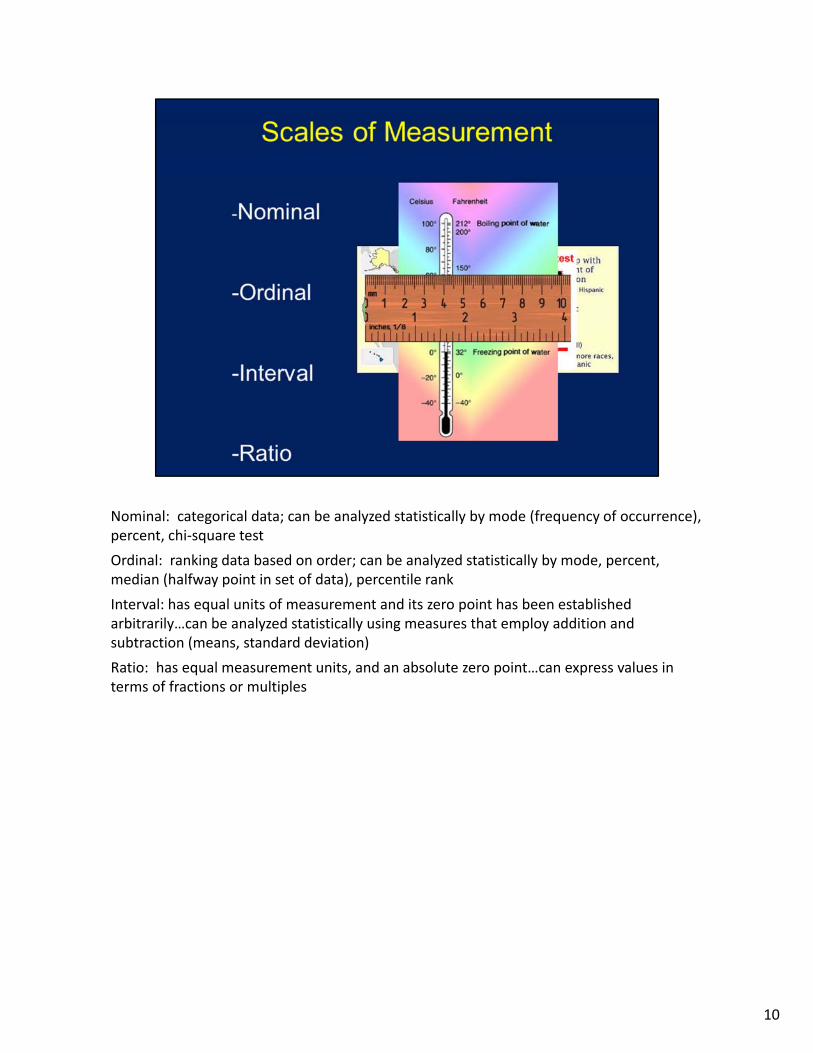
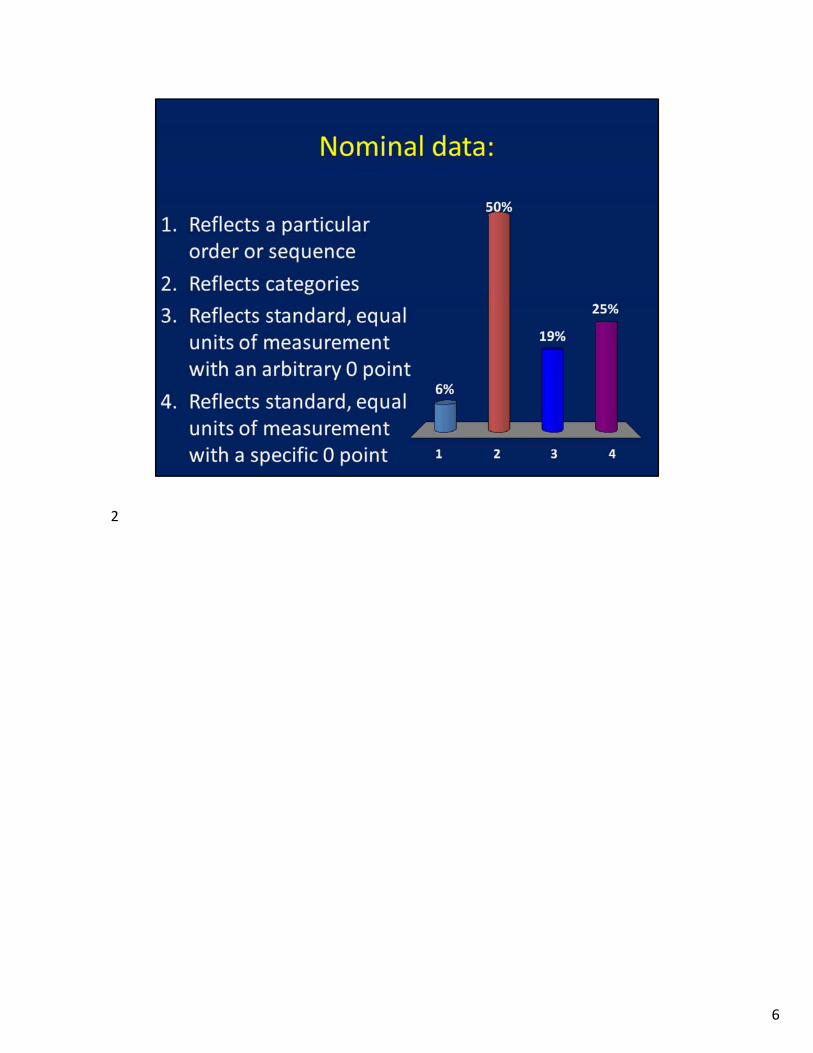
Nominal: categorical data; can be analyzed statistically by mode (frequency of occurrence), percent, chi‐square test
Ordinal: ranking data based on order; can be analyzed statistically by mode, percent, median (halfway point in set of data), percentile rank
Interval: has equal units of measurement and its zero point has been established arbitrarily…can be analyzed statistically using measures that employ addition and subtraction (means, standard deviation)
Ratio: has equal measurement units, and an absolute zero point…can express values in terms of fractions or multiples
10
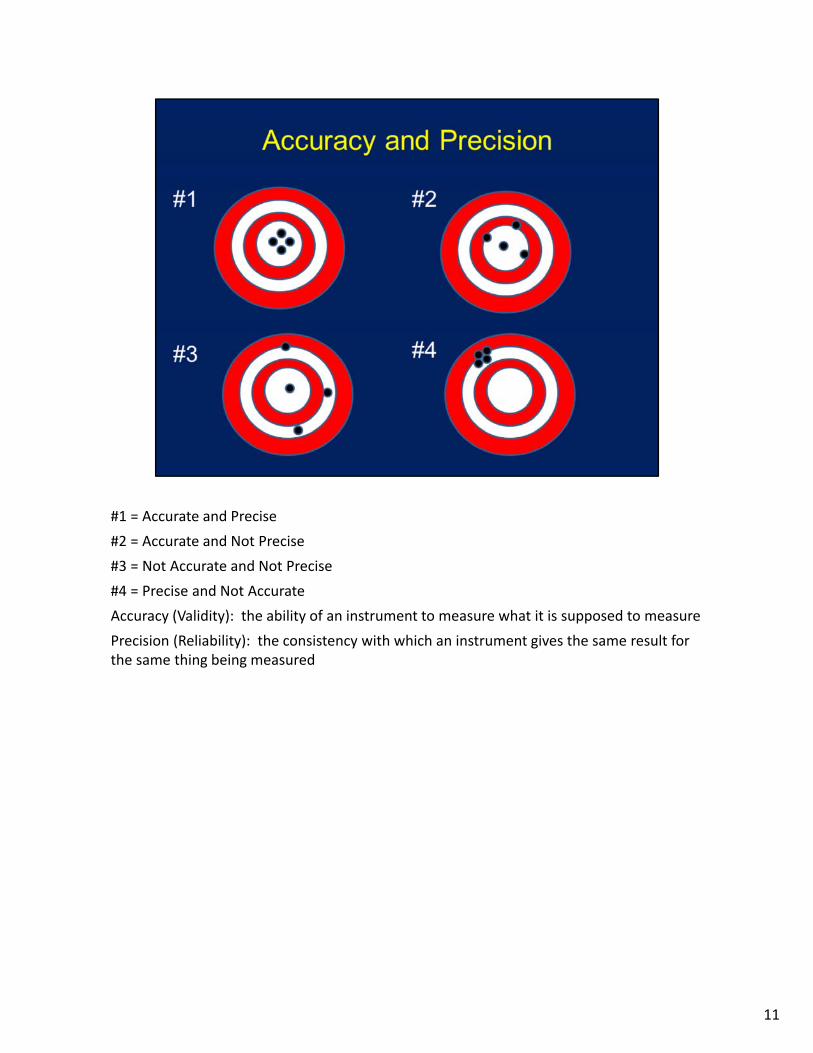
#1 = Accurate and Precise
#2 = Accurate and Not Precise
#3 = Not Accurate and Not Precise
#4 = Precise and Not Accurate
Accuracy (Validity): the ability of an instrument to measure what it is supposed to measure
Precision (Reliability): the consistency with which an instrument gives the same result for the same thing being measured
11
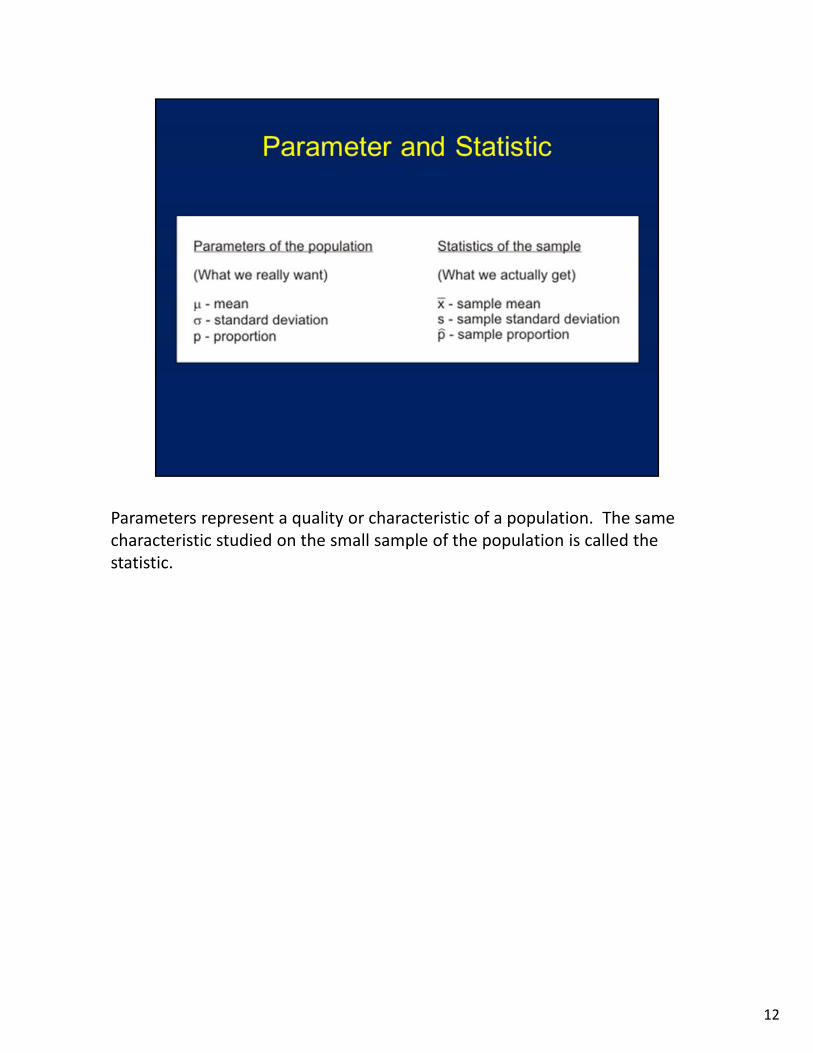
Parameters represent a quality or characteristic of a population. The same characteristic studied on the small sample of the population is called the statistic.
12

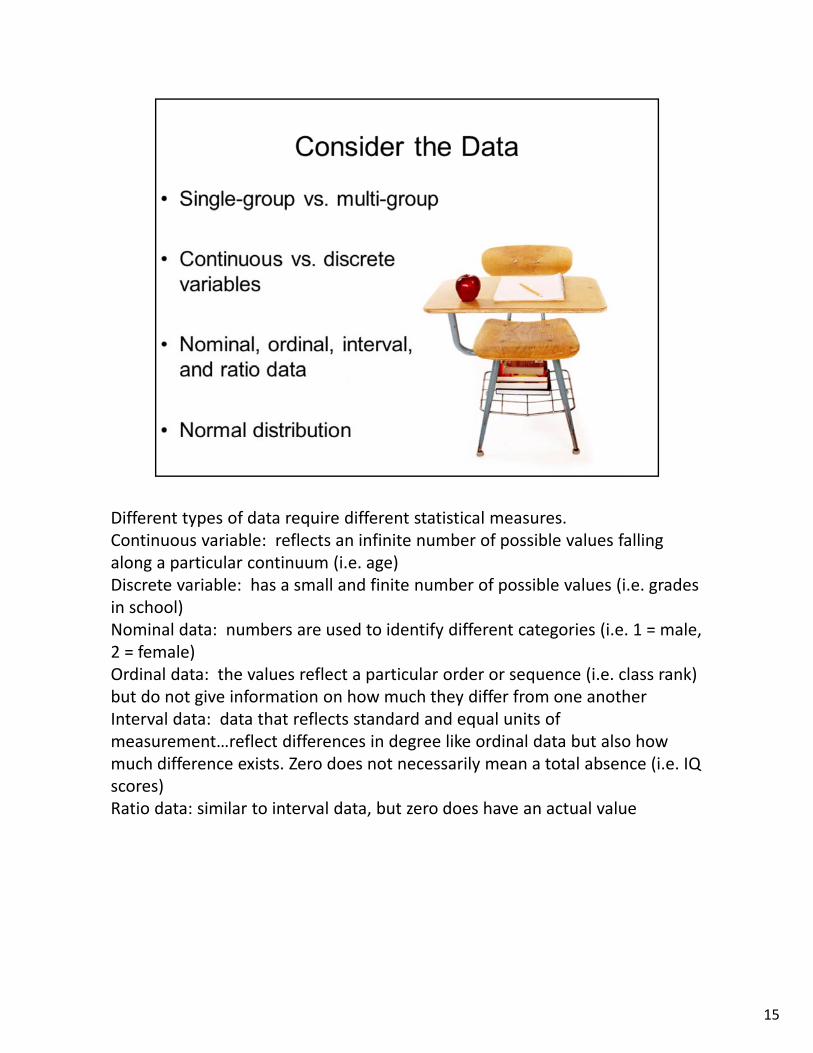
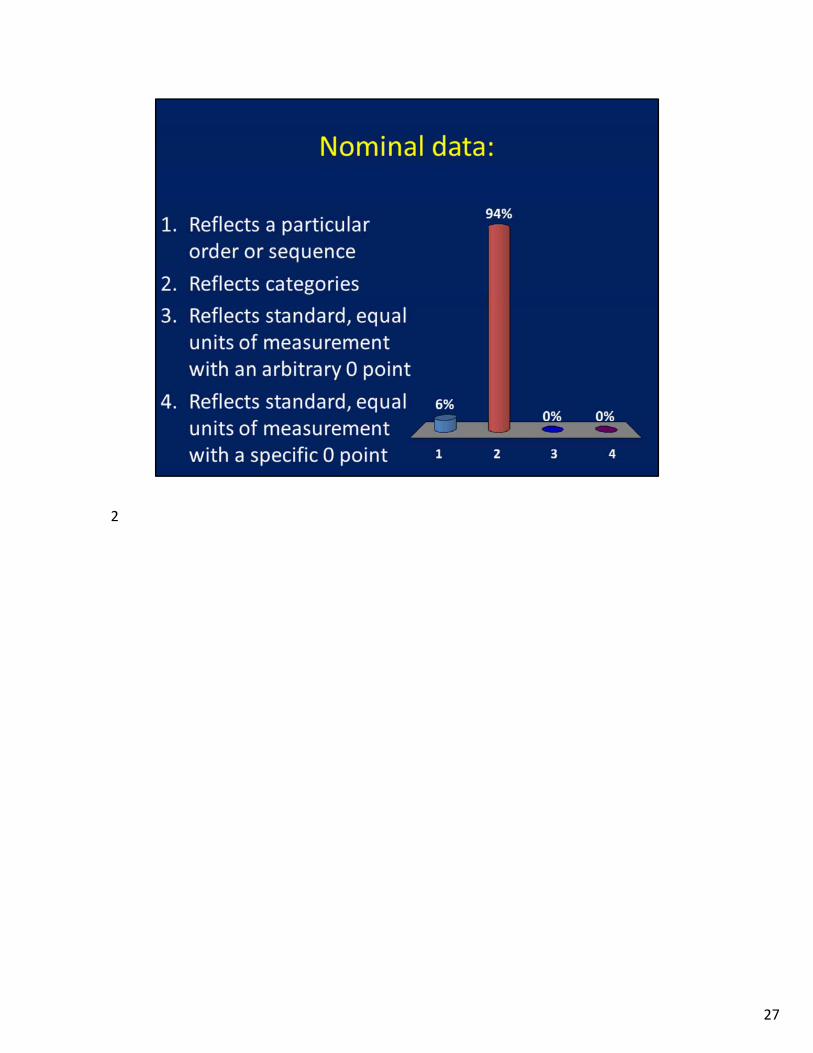
Different types of data require different statistical measures.Continuous variable: reflects an infinite number of possible values falling along a particular continuum (i.e. age)Discrete variable: has a small and finite number of possible values (i.e. grades in school)Nominal data: numbers are used to identify different categories (i.e. 1 = male, 2 = female)Ordinal data: the values reflect a particular order or sequence (i.e. class rank) but do not give information on how much they differ from one anotherInterval data: data that reflects standard and equal units of measurement…reflect differences in degree like ordinal data but also how much difference exists. Zero does not necessarily mean a total absence (i.e. IQ scores)Ratio data: similar to interval data, but zero does have an actual value
13
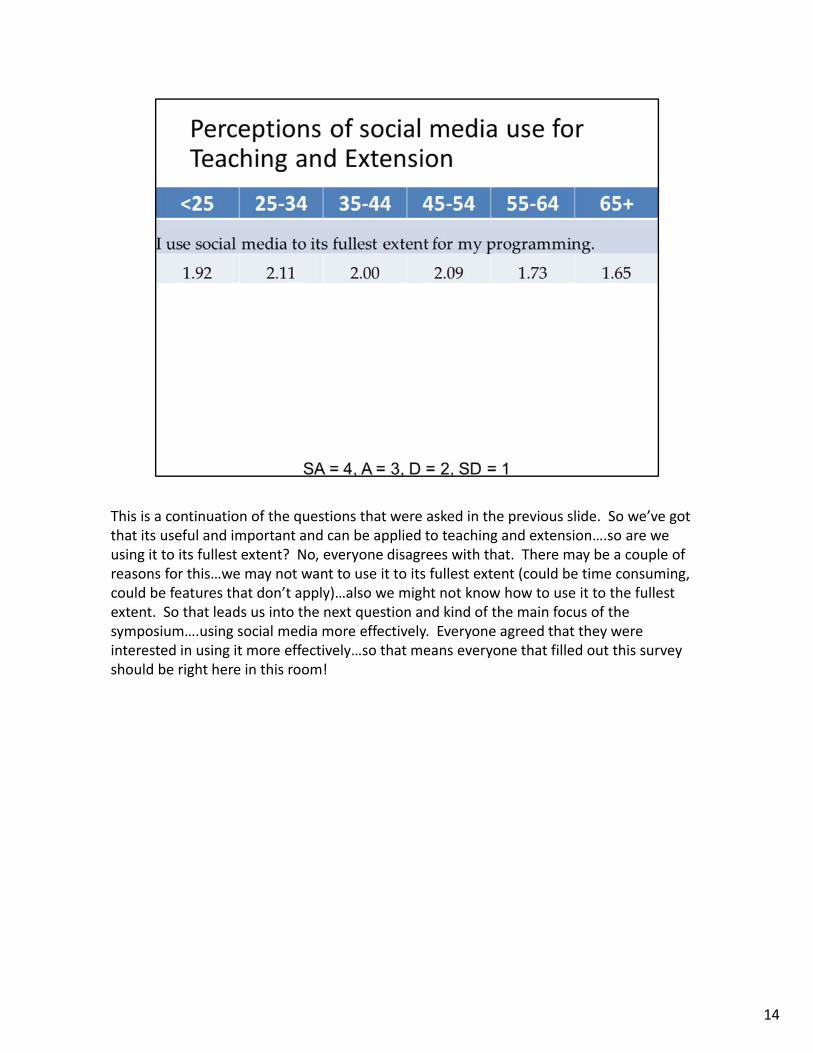
This is a continuation of the questions that were asked in the previous slide. So we’ve got that its useful and important and can be applied to teaching and extension….so are we using it to its fullest extent? No, everyone disagrees with that. There may be a couple of reasons for this…we may not want to use it to its fullest extent (could be time consuming, could be features that don’t apply)…also we might not know how to use it to the fullest extent. So that leads us into the next question and kind of the main focus of the symposium….using social media more effectively. Everyone agreed that they were interested in using it more effectively…so that means everyone that filled out this survey should be right here in this room!
14
Different types of data require different statistical measures.Continuous variable: reflects an infinite number of possible values falling along a particular continuum (i.e. age)Discrete variable: has a small and finite number of possible values (i.e. grades in school)Nominal data: numbers are used to identify different categories (i.e. 1 = male, 2 = female)Ordinal data: the values reflect a particular order or sequence (i.e. class rank) but do not give information on how much they differ from one anotherInterval data: data that reflects standard and equal units of measurement…reflect differences in degree like ordinal data but also how much difference exists. Zero does not necessarily mean a total absence (i.e. IQ scores)Ratio data: similar to interval data, but zero does have an actual value
15
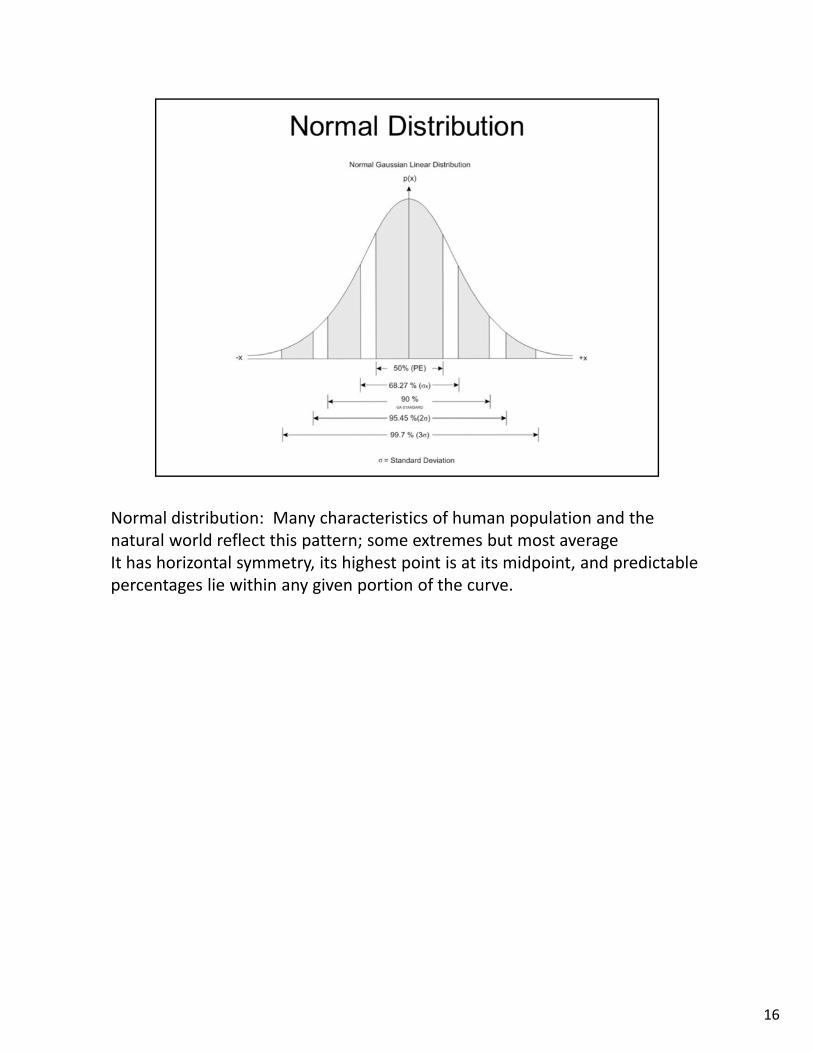
Normal distribution: Many characteristics of human population and the natural world reflect this pattern; some extremes but most averageIt has horizontal symmetry, its highest point is at its midpoint, and predictable percentages lie within any given portion of the curve.
16
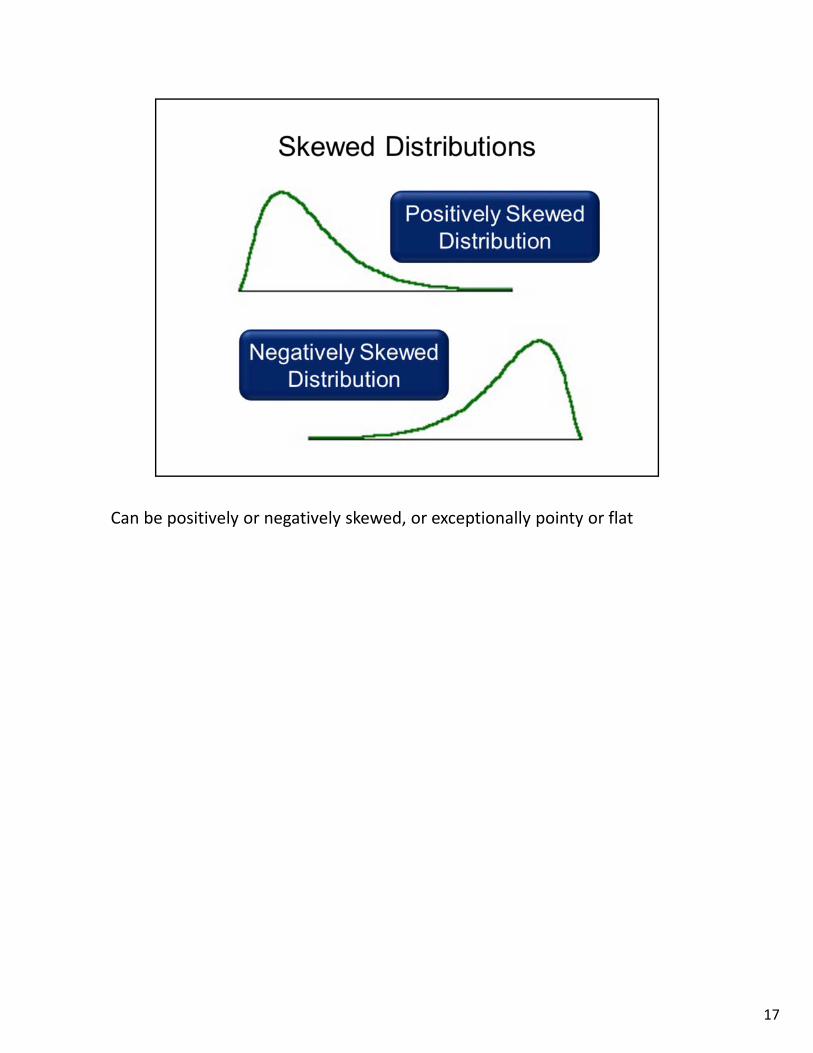
Can be positively or negatively skewed, or exceptionally pointy or flat
17
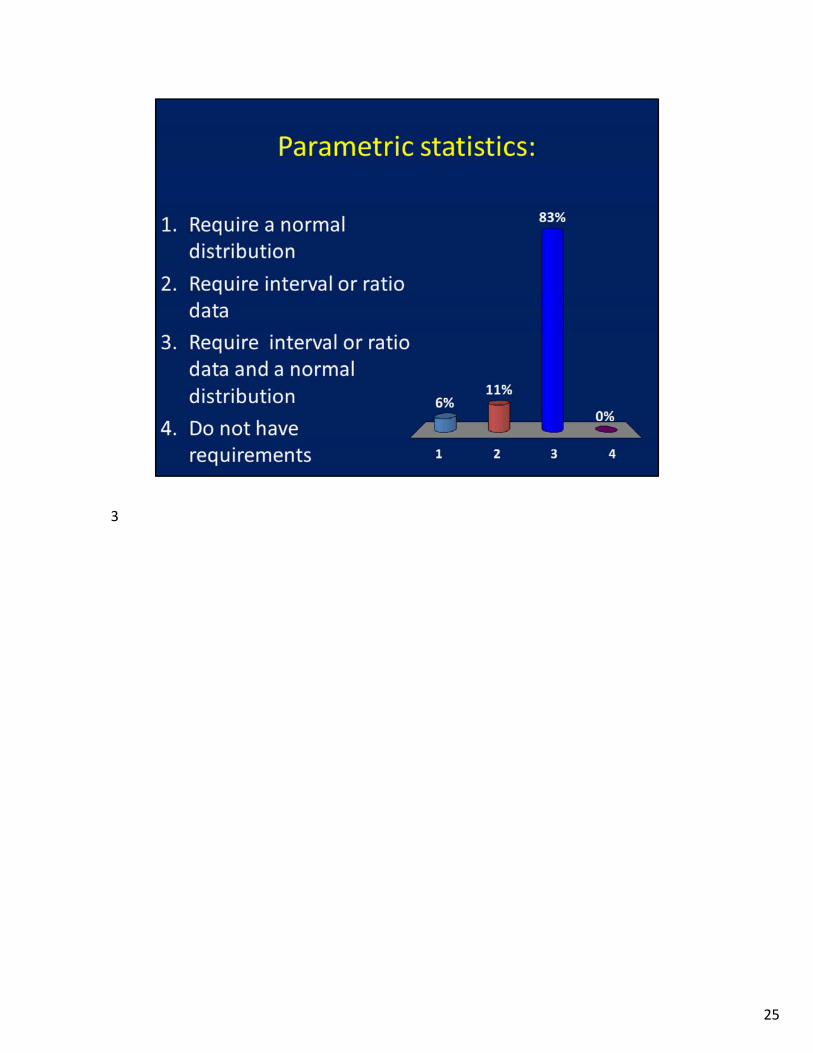
Parametric: The data reflect an interval or ratio scale, the data fall in a normal distributionNonparametric: does not include the above assumptions
Parametric statistics are the most powerful statistical procedures while nonparametric procedures are appropriate for relatively simple analyses.Some statistical analyses produce valid results for data that are normal or nonnormal, it depends upon the assumptions for each test.Speak with professors that are involved in the same type of research that you are involved in to get an idea of some of the statistical tests that might be appropriate in your work.
18
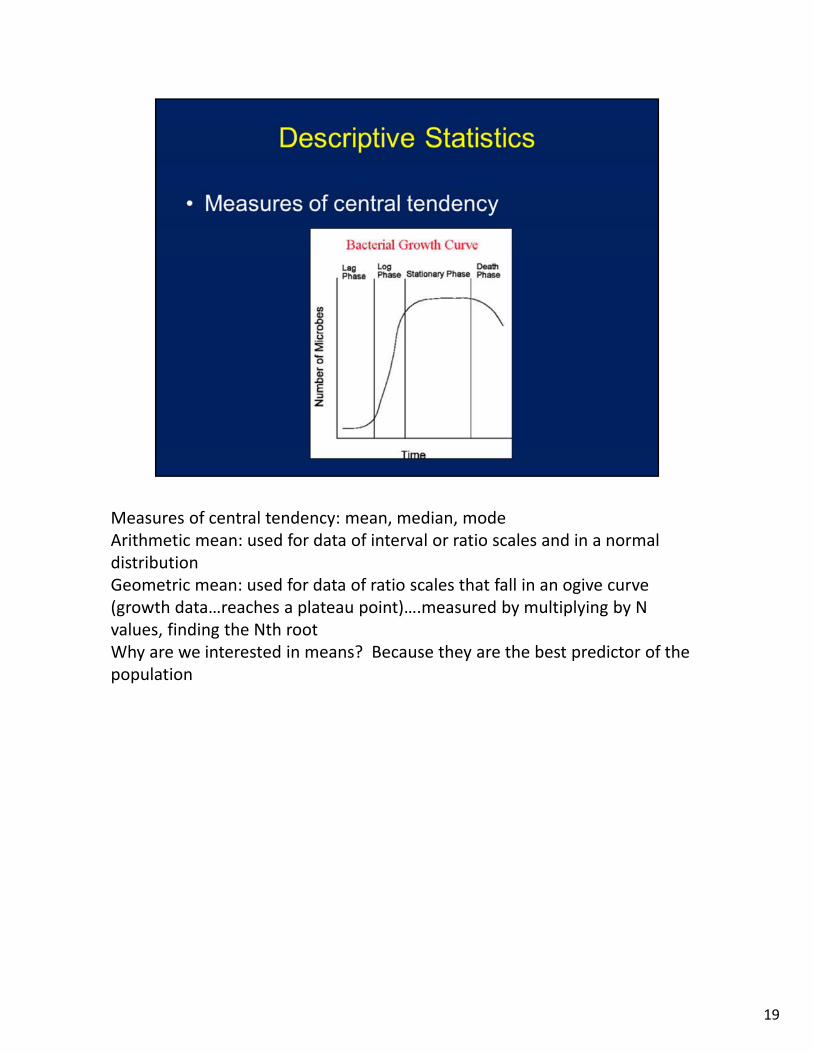
Measures of central tendency: mean, median, modeArithmetic mean: used for data of interval or ratio scales and in a normal distributionGeometric mean: used for data of ratio scales that fall in an ogive curve (growth data…reaches a plateau point)….measured by multiplying by N values, finding the Nth rootWhy are we interested in means? Because they are the best predictor of the population
19
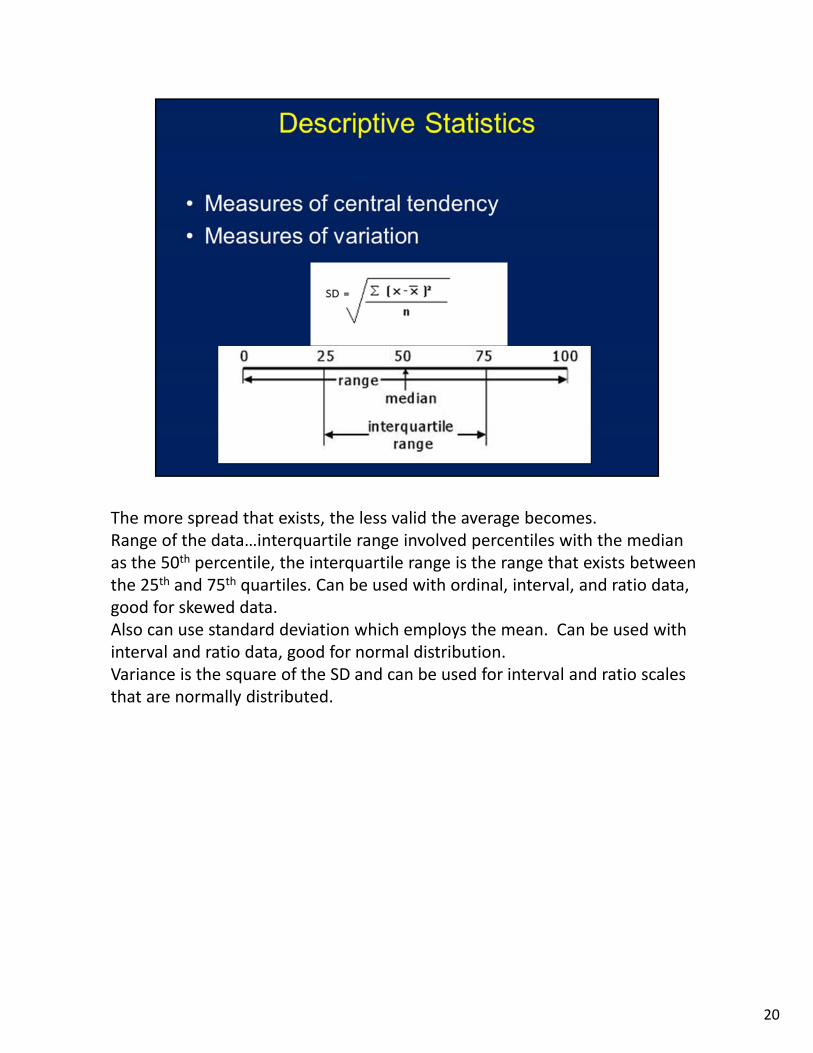
The more spread that exists, the less valid the average becomes.Range of the data…interquartile range involved percentiles with the median as the 50th percentile, the interquartile range is the range that exists between the 25th and 75th quartiles. Can be used with ordinal, interval, and ratio data, good for skewed data.Also can use standard deviation which employs the mean. Can be used with interval and ratio data, good for normal distribution.Variance is the square of the SD and can be used for interval and ratio scales that are normally distributed.
20
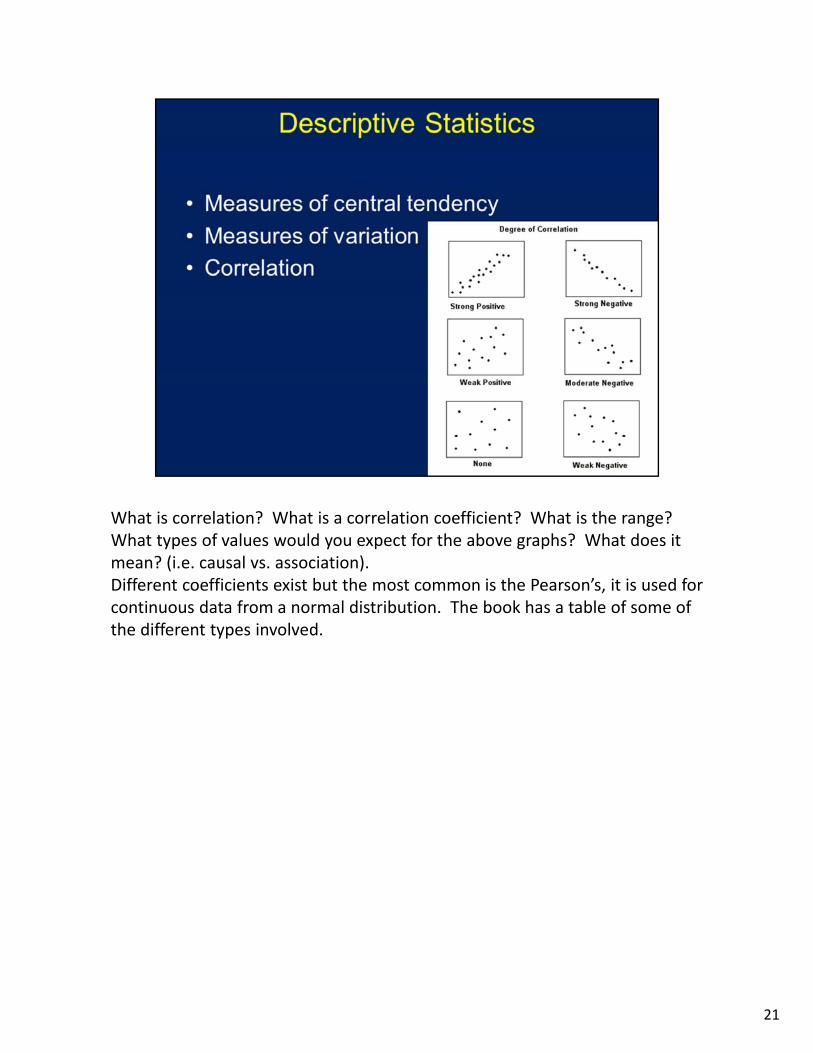
What is correlation? What is a correlation coefficient? What is the range? What types of values would you expect for the above graphs? What does it mean? (i.e. causal vs. association).Different coefficients exist but the most common is the Pearson’s, it is used for continuous data from a normal distribution. The book has a table of some of the different types involved.
21
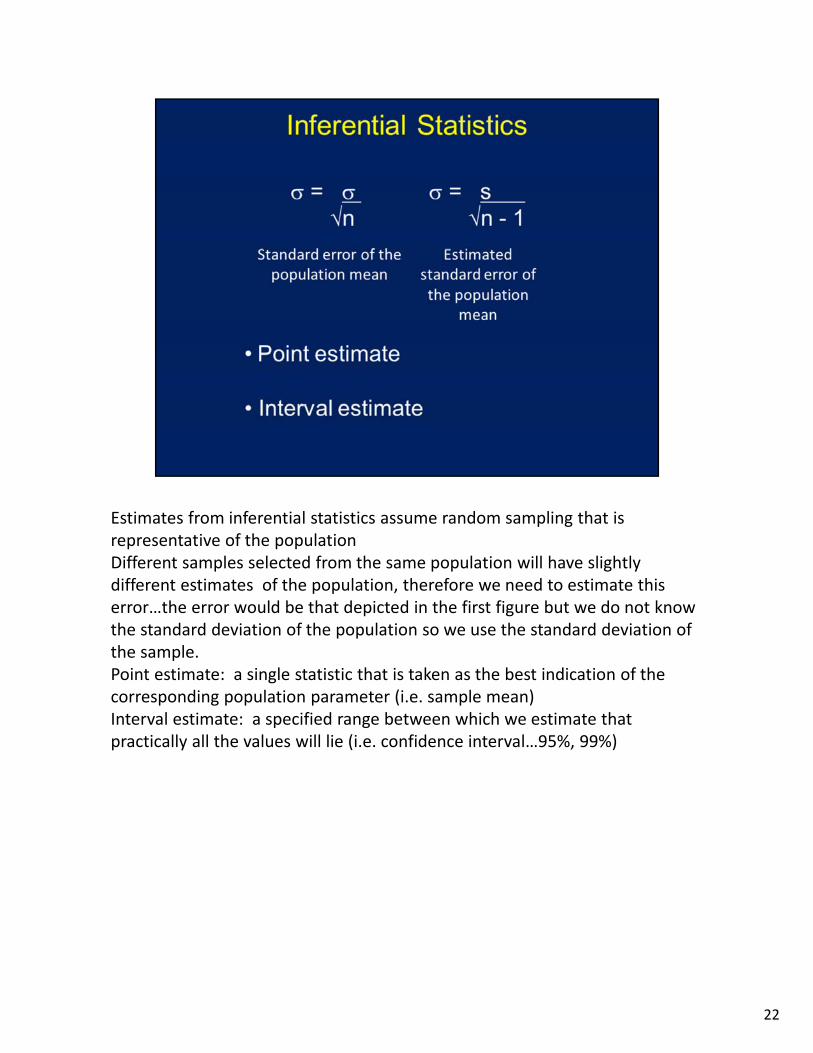
Estimates from inferential statistics assume random sampling that is representative of the populationDifferent samples selected from the same population will have slightly different estimates of the population, therefore we need to estimate this error…the error would be that depicted in the first figure but we do not know the standard deviation of the population so we use the standard deviation of the sample.Point estimate: a single statistic that is taken as the best indication of the corresponding population parameter (i.e. sample mean)Interval estimate: a specified range between which we estimate that practically all the values will lie (i.e. confidence interval…95%, 99%)
22
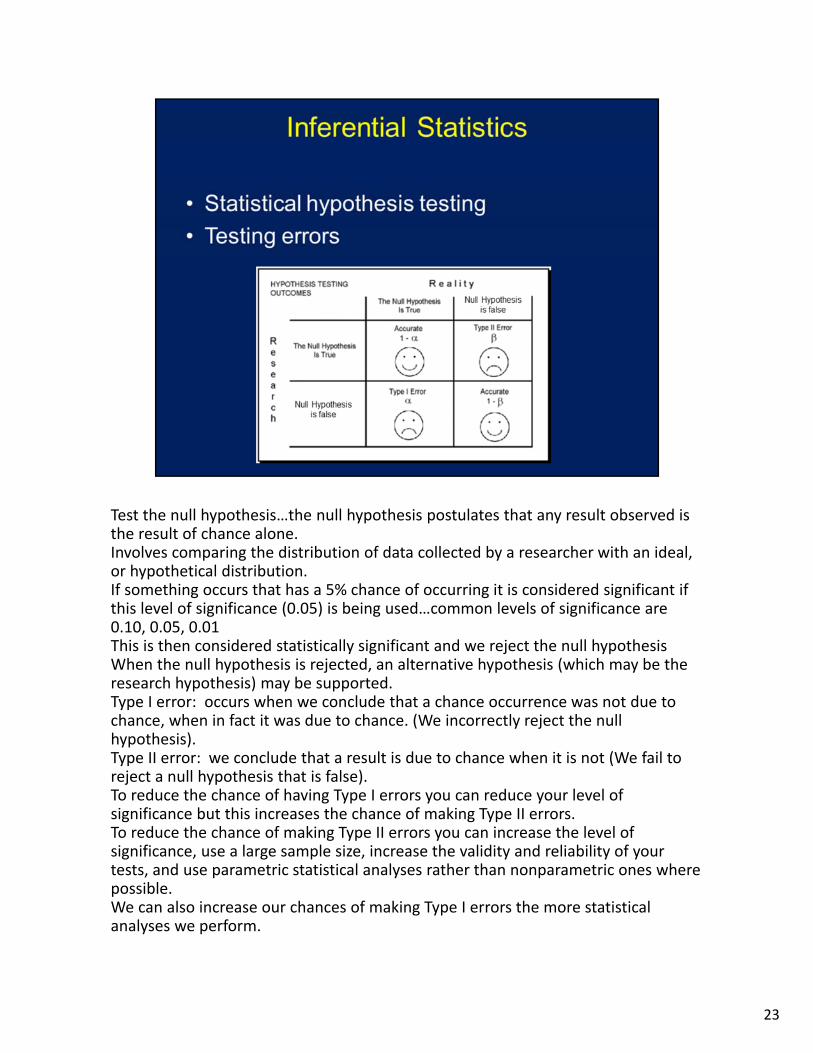
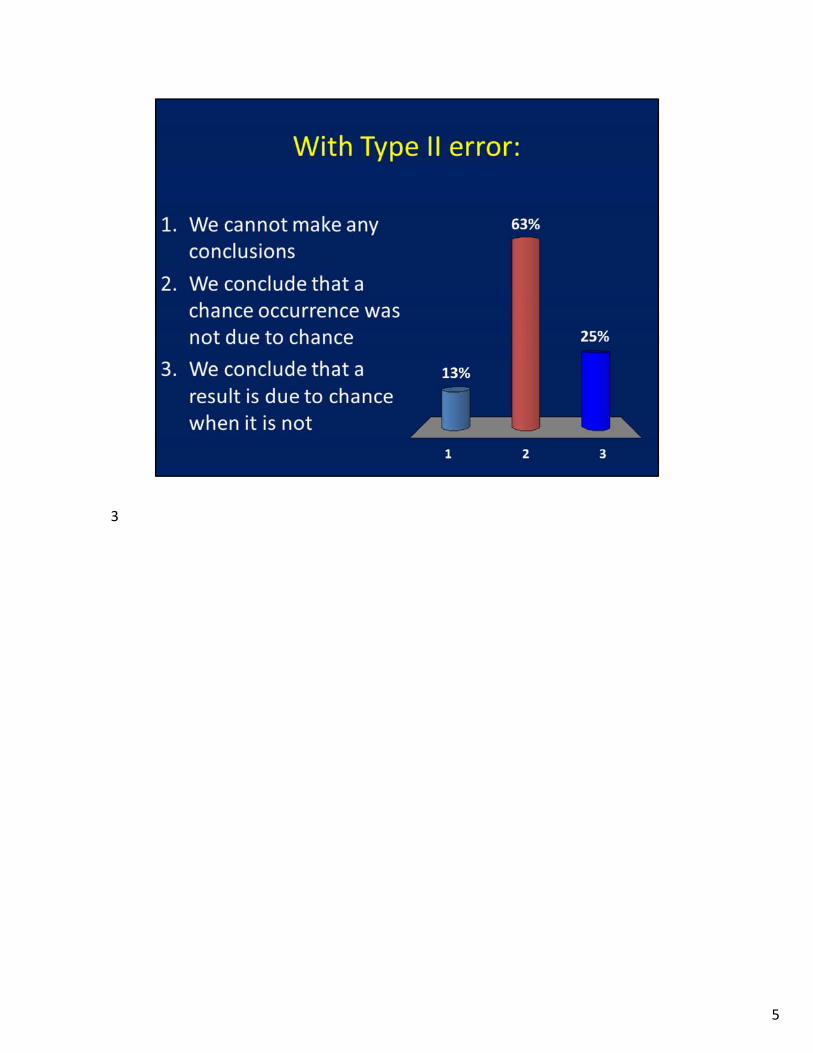
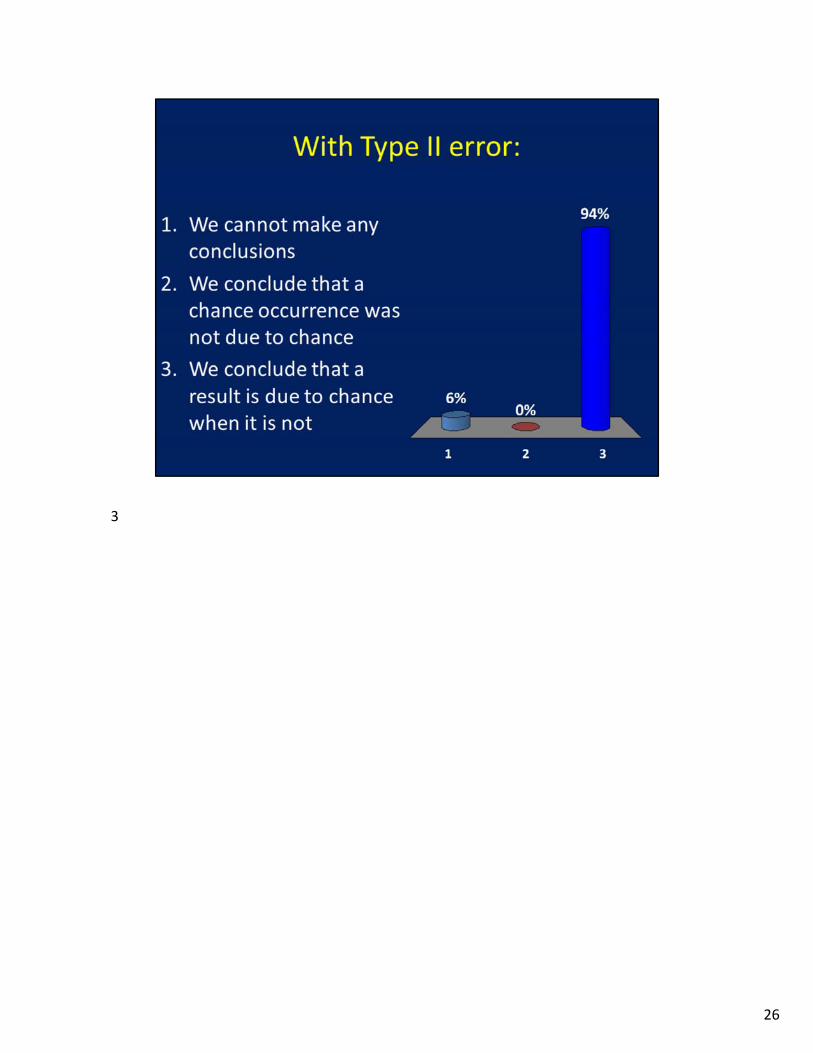
Test the null hypothesis…the null hypothesis postulates that any result observed is the result of chance alone.Involves comparing the distribution of data collected by a researcher with an ideal, or hypothetical distribution.If something occurs that has a 5% chance of occurring it is considered significant if this level of significance (0.05) is being used…common levels of significance are 0.10, 0.05, 0.01 This is then considered statistically significant and we reject the null hypothesisWhen the null hypothesis is rejected, an alternative hypothesis (which may be the research hypothesis) may be supported.Type I error: occurs when we conclude that a chance occurrence was not due to chance, when in fact it was due to chance. (We incorrectly reject the null hypothesis). Type II error: we conclude that a result is due to chance when it is not (We fail to reject a null hypothesis that is false).To reduce the chance of having Type I errors you can reduce your level of significance but this increases the chance of making Type II errors.To reduce the chance of making Type II errors you can increase the level of significance, use a large sample size, increase the validity and reliability of your tests, and use parametric statistical analyses rather than nonparametric ones where possible.We can also increase our chances of making Type I errors the more statistical analyses we perform.
23

1
24
3
25
3
26
2
27