Embed Size (px)
Citation preview

What do voters want? Dimensions and configurations in
individual-level preferences and party choice
Silja Häusermann Hanspeter Kriesi
University of Konstanz University of Zurich
[email protected] [email protected]
June 2011, first draft
Paper prepared for the conference „The Future of Democratic Capitalism“,
June 16-18th, 2011, Zurich, Switzerland

2
Abstract
In this paper, we map the political space of individual-level voter preferences throughout European capitalist regimes, and we assess both its socio-structural determinants and its impact on party choice. We argue that both the cultural and the economic conflict dimensions need to be reconceptualized, and their respective impact on party choice combined in order to understand the electoral dynamics in contemporary capitalism. Based on ESS-data, we show that cultural conflict in Europe today involves not only issues of cultural liberalism, immigration and EU integration, but also distributive questions regarding welfare chauvinism and welfare misuse. Hence, the boundaries between economic and cultural conflict are blurred. At the same time, the economic-distributive conflict has become heterogeneous, since preferences regarding issues such as redistribution, social investment and social insurance do not simply align on a single dimension. We then show that despite stark differences in the average levels of voter preferences regarding economic and cultural conflict, their configuration and socio-structural determinants are very similar across Europe: education is the main determinant of cultural preferences, while economic preferences are structured by income and a new class conflict dividing the middle class. Finally, we assess the impact of cultural and economic preferences for party choice. It appears very clearly that the vote choice for green and radical right-wing populist parties (the challenger parties) is explained by cultural attitudes. Economic preferences, by contrast, are relevant for voters’ choice of the mainstream parties of the moderate right and left. Overall, our findings show that the culturally mobilized challenger parties alter the dynamics of party competition throughout Europe, even with regard to the moderate parties that still distinguish themselves with regard to economic issues. Therefore, an analysis of contemporary capitalist politics needs to take into account both cultural and economic dimensions of political conflict.

3
1. Introduction
There is a contrast in the way voter preferences are conceptualized in two strands of
current literature: while most of the comparative political economy literature implicitly or
explicitly theorizes voter preferences and their relevance for party choice in terms of –
mostly unidimensional - economic/distributive conflict (see e.g. Meltzer and Richard 1981,
Iversen and Soskice 2006, Anderson and Beramendi 2008, Pontusson and Rueda 2010) the
literature on political parties and elections that deals with the determinants of party choice
has always emphasized the importance of alternative, non-economic conflicts (see e.g.
Lipset and Rokkan 1967, Kitschelt 1994, Kitschelt and McGann 1995, Rokkan 2000,
Bartolini 2000, Hooghe et al. 2002, Kriesi et al. 2006, 2008, De la O and Rodden 2008).
To be sure, in the literature on political parties and elections there has always been another
strand, which argued that in West-European countries, the behavior of parties and voters
alike has been structured by one single ideological dimension – left-right (e.g. Van der Eijk
& Franklin 1996;Van der Eijk et al. 1999, Fuchs and Klingemann 1990; Klingemann, et al.
1994; Hix 1999). In this alternative strand, left-right is sometimes seen as the equivalent of
a socioeconomic dimension. However, some representatives of this strand allow for the
substantive meaning of left-right to vary across countries and over time. They argue that
the left-right dimension has assimilated new political issues so that the left-right position of
parties summarizes their positions on a large number of specific issues, both economic and
non-economic (e.g. van der Brug and van Spanje 2009, Kitschelt and McGann 1995, Fuchs
and Klingemann 1990).

4
We argue in this paper that both strands of literature should integrate each other’s insights.
More specifically, we contend that in order to understand the challenges political parties
face in contemporary capitalist democracies, the findings from both strands of literature
need to be combined for several reasons.
First of all, the European political space cannot be reduced to a single dimension, but has
always been and still is structured by at least two dimensions – an economic and a cultural
one. The coexistence of two (or more) dimensions of conflict fundamentally alters the way
we ought to view the electoral landscape and has critical implications for the way
preferences shape party choice. The CPE-literature always struggled with the existence of
parties based on religion – the Christian-democratic conundrum (see Manow 2009). As de
la O and Rodden (2008) have confirmed once again, the poor do not necessarily vote for
the left and this influences the whole micro-logic of politics in democratic capitalist
countries. Even if, under the impact of the structural transformation of European societies,
religion has been loosing some of its structuring capacity for politics, this by no means
implies that the cultural dimension has lost its power.
Second, the boundaries between distributional (economic) and cultural conflicts have
become blurred: issues such as welfare chauvinism or the unequal effects of welfare states
on men and women have a strong cultural connotation and are related to issues such as
immigration or universalism/particularism. Cultural conflicts interfere in economic,
distributive struggles (see e.g. Manow 2002, Manow and van Kersbergen 2009, Kitschelt
and Mc Gann 1995, Kitschelt and Rehm 2005, Häusermann 2010), which means that some
economic issues cannot be analyzed exclusively in terms of economic left-right conflicts.
Third, the traditional left-right economic dimension (state intervention vs. market
liberalism) itself needs to be reconceptualized in the context of welfare state maturation
(Pierson 2001) and post-industrialism (Esping-Anderson 1999), and in the light of new
5
theories on the institutional configuration and rationale of capitalist regimes, the Varieties
of capitalism literature (Hall and Soskice 2001). The economic conflict dimension can no
longer be analyzed in terms of "more vs. less welfare spending", since post-industrial
capitalism faces a range of different and distinct challenges, such as the conflicts between
social insurance and redistribution, or between social protection and social investment.
The goal of this contribution is to map the structure of the political space of individual-
level preferences throughout democratic Western capitalism. We address three questions.
First, we ask what are the key conflict lines in contemporary capitalism? We shall argue
that there are at least two fundamental dimensions of conflict structuring the individual
level preferences in European societies – an economic and a cultural one. We shall analyze
and discuss the meaning of each one of these dimensions under contemporary conditions,
and discuss possible explanations for cross-country differences in the composition and
relevance of these dimensions. Second, we turn to the question of the socio-structural
factors determining the individual level preferences with regard to these two conflict
dimensions. We shall analyze and discuss the usual suspects (education and class in
particular) and show the pattern of factors, which account for the polarization on each of
the two fundamental dimensions. Third, we address the question of the consequences of
these preferences with respect to party choice. To what extent do the preferences on these
two dimensions allow us to explain the election outcomes in European societies.
For our empirical analyses, we shall use the most recent version of the European Social
Survey (ESS 2008). This survey includes no less than 29 countries from all parts of Europe
and beyond (Israel, Turkey, Ukraine and Russia). These data will allow us to compare the

6
preference formation, its social structural origins and its political implications in different
types of capitalist production regimes – liberal market economies (LMEs), continental
coordinated market economies (CMEs), Nordic coordinated market economies (NMEs),
state market economies (SMEs), and Central and Eastern European market economies
(CEEs). In the next section, we elaborate our theoretical ideas, before we turn to answering
our three questions based on the comparative survey data.
2. Theory Religion and class have traditionally been the two conflicts structuring European politics.
Arguably, both have been losing much of their structuring capacity as a result of the large-
scale processes of secularization, value change, rising standards of living and the
pacification of industrial relations. In line with this societal transformation, many observers
have declared the decline of cleavage politics and the rise of individualized political
choices (e.g. Dalton et al. 1984; Franklin et al. 1992; Inglehart 1990, van der Brug 2010).
Others, among whom we count ourselves, have argued that the cleavages have not
disappeared. While the large-scale transformations of European societies may have
weakened traditional cleavages, we argue that new cleavages have risen in their place –
cleavages related to fundamental value conflicts on the one hand and to transformed
economic conflicts of class on the other hand. The new structuring conflicts that have
developed since the late sixties have been embedded into the two-dimensional traditional
preference structure, and have thereby fundamentally transformed the meaning of both
original dimensions.

7
2.1. The cultural dimension
The cultural dimension has been profoundly transformed in two waves of political
mobilization (see paper by Hutter and Kriesi). The first wave reaches back to the late
1960s and is the result of a set of large-scale processes that started to profoundly transform
European societies in the post-war era: secularization, the educational revolution, rising
living standards, tertiarization and the establishment of the welfare states. These processes
have been driving the profound value change, which has been theorized above all by
Inglehart (1977, 1997) and his collaborators (Baker and Inglehart 2000, Inglehart and
Welzel 2005), but also by others such as Flanagan and Lee (2003) or Kitschelt (1994). As a
result of this set of processes, ‘self-expression’ values, as Inglehart has come to call them,
have become central. The value priorities shifted from an overwhelming emphasis on
economic and physical security toward an increasing emphasis on subjective well-being
and quality-of-life. Flanagan and Lee (2003) describe the same kind of shift as a change
from authoritarian to libertarian values, implying an erosion of both clerical and secular
authority. The individual has become fully autonomous and views others primarily as
instruments in achieving maximum self-actualization.
In the aftermath of the ‘cultural revolution’ of the late 1960s, throughout the 1970s/80s,
these new values have mainly been expressed politically by the so-called new social
movements. They mobilized in the name of human rights, peace, the emancipation of
women, solidarity with the poor and the oppressed of the world, and the protection of the
environment. Their vision was one of cultural liberalism and social justice/protection.
These were movements of the left, which, in due course, spawned a new set of parties – the
New Left and Green parties and often found close allies in the established parties of the left
(thereby deeply transforming them). It is very important to keep in mind that the
mobilization of these new social movements and the parties that they spawned did not add

8
any fundamentally new dimension to the political space, but transformed the meaning of
the cultural dimension.
The second wave of political mobilization, the wave of the 1990s/2000s. is linked to yet
another set of large-scale processes which have been conveniently summarized under the
term globalization or denationalization. In addition to its economic implications,
globalization is responsible for a significant increase in cultural diversity within European
societies. Since the 1960s, West European societies in particular have seen massive
immigration of groups that are in many respects distinct from the already resident
population. These migration processes may have various causes, including the dissolution
of colonial empires, civic wars and the decline of statehood, scarcity of national resources,
or political persecution, but they all contribute to a strong increase in socio-cultural
diversity in European societies. One of the crucial questions then is how these societies
cope with immigration and the resulting new, culturally defined diversity.
Immigration might intensify economic competition over scarce jobs and shrinking welfare
benefits. However, a growing body of empirical research shows that the actual effects of
immigration flows on income, employment, and unemployment are quite small
(Hainmueller and Hiscox 2007). One might argue that the actual economic effects of
immigration are less relevant than people’s perceptions of those effects. But, as
Hainmueller and Hiscox (2007: 406) observe, this type of assertion begs the question of
how and why individuals misperceive the threat posed by immigration. They find that
‘anti-immigration sentiments are far more powerfully associated with cultural values that
have more to do with conceptions of national identity than they do with concerns about
personal, economic circumstances’ (p. 437).1 As a result, cultural diversity has the
1 This confirms the results of studies of racial group competition in the United States, which show that economic self interest constitutes only a weak foundation for perceived threat by other racial groups (Bobo and Hutchings 1996).

9
potential to activate traditional, and above all nationalist values and to create new political
conflicts.
The groups in the resident population who feel threatened by the increasing cultural
diversity seek to defend their traditional way of life. Feelings of competitive threat from
members of other ethnic or racial groups have complex determinants. Among these
determinants are the individuals’ values and beliefs such as ethnic and racial tolerance and
the preference for cultural diversity. Crucially, such values are more widespread among the
more highly educated. Education has a ‘liberalizing’ effect, i.e. it induces a general shift of
political value orientations towards cultural liberalism, cosmopolitanism and universalism.
It contributes to cultural tolerance and openness; it provides the language skills, which give
access to other cultures. Thus, Hainmueller and Hiscox (2007) show that across Europe,
there is a correlation between higher education and higher skill levels with support for all
types of immigrants and vice versa. These findings show that conflict over immigration is
related to larger cultural, rather than economic conflict lines. Nevertheless, its emergence
is crucial for the understanding of (distributive) political dynamics in contemporary
capitalism, because it depends so closely on education (i.e. the distribution of human
capital), and because it transforms the electoral constituencies and policy profiles of
political parties.
Yet another source of conflicts related to globalization is political integration, i.e. the
transfer of political authority to institutions beyond the nation-state (Grande and Pauly
2005). This is particularly true for cases in which such a transfer jeopardizes national
political sovereignty. This is obvious in the European context, where the transfer of
economic policy competences to the Union level is increasingly limiting the manoeuvring
space of national governments. Individuals who possess a strong identification with their
national community and who are attached to its exclusionary norms will perceive a

10
weakening of the national institutions as a loss. Conversely, citizens with universalistic or
cosmopolitan norms may perceive this weakening as a gain, if it implies a strengthening of
a specific type of cosmopolitan political institutions, rather than a mere ‘retreat of the state’
(Mau 2007).
Crucially again, across most advanced industrial countries, the lower classes attach greater
value to the nation than the upper classes (Shayo 2009). As is argued by Shayo (2009:
156), there are two factors at work here: first, the lower classes have a lower status than the
upper classes2. This means that for them, the identification with the nation serves to
compensate for their low social status, a compensation, which the upper classes do not
need. In line with this argument, Greenfeld (1999: 52) maintains that the national identity
has the remarkable quality, which distinguishes it from other identities that it ‘guarantees
status with dignity to every member of whatever is defined as a polity or society’. Tamir
(1995) refers to four aspects of the national identity, which all bestow dignity on the
individual member of a nation, among which is equality with other members. Second, most
of the members of the nation belong to the lower classes, which means that the lower
classes are in general more similar to the national prototype than the upper classes. As a
result of their greater identification with the nation, the lower classes are bound to lose
more when their nation-state loses parts of its sovereignty to supra- or international
institutions.
As Greenfeld (1992: 10) has also pointed out, the idea of democracy is intimately bound up
with the idea of the nation-state. It is at the level of the nation-state that democratic rights
are most fully developed today. To the extent that the decision-making authority shifts to
the supra-national level, the individual’s democratic rights at the national level are at risk.
2 Shayo refers to the ‚poor‘ and the ‚rich‘ instead of lower and upper classes.

11
Therefore, such shifts are bound to incite nationalist reactions among those who feel that
their democratic rights are hollowed out.
The same type of nationalist reactions may also be provoked by domestic factors, which
lead to a malfunctioning of democracy. Such factors are above all at work in Central and
Eastern Europe (CEE). To be sure, CEE is also deeply affected by denationalization:
foreign companies own the bulk of the industry and of the financial sector in the region, a
growing part of agricultural land is in the hands of foreigners, and many home owners have
been severely hit by the financial crisis, because they had indebted themselves in foreign
currencies. As a result of the regime transition, domestic factors are, however, of particular
relevance here. The democratic experience of CEE countries is still relatively short, large
parts of their populations have lived through traumatic economic upheavals in the course
of the transition and the recent economic crisis, they have been faced with political crises
in the newly democratic states, many may perceive the status of their formerly communist
states as diminished (akin to military defeat), and the abrupt change in the official ideology
(from Marxism to liberalism, from authoritarian control to democracy) is likely to have
created a great deal of ideological disarray and/or political cynicism. Faced with such a
conjunction of factors, it is the ‘transition losers’ (similar to the globalization losers in
Western Europe) who experience a sense of insecurity, are frustrated with the democratic
experience, and seek refuge in nationalist values.
A similar line of reasoning may also apply to Southern Europe. Some countries in this
region (Cyprus, Greece, Portugal, Spain) have also made their transition to democracy
rather late, and it is precisely these countries, which have been most severely hit by the
recent economic crisis. In the aftermath of this crisis, their governments found their
manoeuvering space severely limited by supranational institutions (the Troika of IMF,
European commission and European Central Bank).
12
We would like to suggest that globalization is politically more consequential in its cultural
and political dimension than in its economic dimension. First of all, as is observed by
Kalmijn and Kraaykamp (2007), there is a shift from an economic to a cultural basis of
stratification, worldwide. As countries modernize, cognitive skills and cultural resources
become more important for an individual’s place in society. Education thereby becomes a
more important source for politically relevant attitudes, not only in the domain of ethnic
relations. Second, as we have argued previously (Kriesi et al. 2006, 2008), the political
actors who mobilize the globalization losers mainly do so in cultural and political, and not
in economic terms. Most importantly, the new groups of ‘winners’ and ‘losers’ of
globalization are not ideologically pre-defined. The parties of the new populist right have
been the key promoters of the cause of the globalization losers. Third, the transformation
of the economic dimension, to which we turn now, also contributed to the increasing
relevance of the cultural and political aspects of globalization.
2.2. The economic dimension
Compared to the cultural dimension, the economic dimension of voter preferences and
party choice has always occupied an important place in the literature on democracy and
capitalism. However, there have been major controversies about the relevance and the
substance of this dimension.
With regard to the relevance of the economic dimension of voter preferences, the question
is whether the positions of parties with regard to macro-economic policies are still
sufficiently distinct to structure voter preferences and party choice. Structural factors such
as deindustrialization, reduced transportation- and communication costs and the exposure
of a growing number of economic sectors to international competition, the growing

13
internationalization of finance and the higher mobility of capital (Kitschelt et al. 1999: 445-
8) might suggest that macro-economic policies of advanced capitalist democracies tend to
converge on a neoliberal consensus (Streeck 2009). Irrespective of the actual pressure
towards convergence, parties might use globalization or the economic liberalization
pressure as a tool to blame poor domestic economic performance on factors beyond their
control. Hence, the public may perceive the economic manoeuvring space of the national
governments as being heavily constrained. This could remove macroeconomic issues from
the electoral arena, since voters would refrain from making party choices based on attitudes
towards issues they think their governments do not control anyway3. As a matter of fact,
Hellwig and Samuels (2007) provide empirical support for their ‘government constraint
hypothesis’, which suggests that greater exposure to the world economy reduces electoral
accountability in the world’s democracies. They find that voters in more open economies
are less likely to evaluate incumbents on the basis of fluctuations in economic growth.
Similarly, Duch and Stevenson (2008) argue that voters are attentive to the constraining
implications of economic openness for the government’s economic policy choices, and they
find that economic voting is less pronounced in situations, where the government’s
competence in economic policy making is constrained by economic openness.
However, for at least two reasons it would be premature to argue that the economic
dimension of voter preferences and party competition has become irrelevant to the electoral
dynamics of democratic capitalism: first, the convergence argument has been theoretically
and empirically challenged. Structural and institutional factors support continued, if altered,
divergence in macro-economic policies (Kitschelt et al. 1999: 449-57; Scharpf and Schmidt
2000). Most prominently, the Varieties of Capitalism approach has stressed the stability of
3 This is the core of the convergence hypothesis, which argues that in a world where centre-right and centre-left parties, i.e. the parties that habitually govern, converge over economics, voters become indifferent to them and increasingly vote for parties clearly distinguishable on cultural grounds (Kitschelt 2007).

14
different production regimes, which precisely draw economic viability and efficiency from
distinct sets of institutional coordination mechanisms, which are interdependent and
complementary (Hall and Soskice 2001: 56-60, Hall and Gingerich 2009). Second, even if
macro-economic policy-making was indeed removed from the national electoral arenas
(because of convergence, or because of its transfer to the supranational level), this would
not imply that preferences and attitudes on economic issues in general have become
irrelevant to voters and electoral dynamics. Contrary to what some have argued (Mair 2008,
Hardin 2000), a world without (perceived) macro-economic alternatives is not
characterized by a generalized lack of alternatives. It may be true that issues related to
market liberalization, industrial policy, as well as monetary and fiscal policy are
increasingly taken out of the hands of national governments in Europe, and that the policies
of left- and right-wing governments are therefore converging on these issues (as Boix
(2000), e.g. has demonstrated for fiscal and monetary policy). Nevertheless, important
alternative economic issues such as labor market regulation and the distributive design of
welfare policies remain within the discretion of national governments, and on these issues,
both party policies and voter preferences continue to diverge (Allan and Scruggs 2004).
This implies that, in substantive terms, the conceptualization of the economic preference
dimension today should focus on labor market and welfare issues, rather than on macro-
economic policies. However, if we only analyze economic conflict with regard to the extent
of welfare spending, we might underestimate its polarization, since the overall welfare
effort is driven so strongly by structural factors (Huber and Stephens 2001). In the wake of
welfare state maturation, post-industrialism and denationalization, the economic conflict
dimension itself has been transformed. Pierson (1996, 2001) has shown that welfare state
maturation has transformed the issues at stake in post-industrial capitalism: the main
conflict concerns no longer the extent of welfare state expansion. In times of financial

15
austerity, when cutbacks are difficult to implement and the room for expansion is limited,
distributive conflict becomes more complex and the dominant issues are shaped by the
institutional regime in place (Pierson 2001: 455; see Esping-Andersen 1999 for a similar
argument): while in continental Europe, e.g., retrenchment, societal modernization and
insider-outsider conflicts are supposed to dominate the agenda, welfare reform in liberal
countries is expected to focus on activation policies and cost containment. The upshot of
this argument is that the substance of the economic conflict dimension is altered: from the
size of the welfare state (the generosity of the overall benefit levels) to its actual
distributive design (who gets what in times of limited resources). Hence, similar to the
transformation of the cultural dimension from religious issues to cultural liberalism and
integration/demarcation, the economic dimension is also being transformed.
A range of theoretical work in comparative political economy and welfare state research
deals with this redefinition of economic conflicts. Three concepts are particularly relevant
for our discussion of voter preferences in contemporary capitalism: redistribution, social
insurance and social investment.
The first relevant distinction is between redistribution and social insurance. As the major
works on the institutional design of different welfare regimes have consistently shown, the
size of the welfare state does not predict its redistributive effect (see in particular Esping-
Andersen 1990, Bradley et al. 2003), because the continental social insurance regimes –
despite being “big” welfare states – typically distribute benefits for old age, unemployment,
sickness or disability on the basis of contributions, rather than on the basis of need. This
implies that social insurance schemes tend to stabilize and reproduce income stratification,
rather than redistributing resources from the rich to the poor. In continental Europe,
eligibility to social insurance benefits is still typically tied to labor market participation,

16
contributions are paid by pay-roll taxes and benefits are earnings-related (Palier 2010). The
micro-foundations of preferences for social insurance vs. redistribution have been
developed with regard to the literature on varieties of capitalism. Estevez-Abe et al. (2001),
as well as Iversen and Soskice (2001) and Mares (2003) show that the preferences of both
high- and specifically skilled workers and employers in coordinated market economies
converge on social insurance as a means of rewarding investment in human capital
formation. In that sense, preferences for social insurance differ from preferences for
overall income redistribution or income equality. While the former are structured by the
level and specificity of individuals’ skill profiles, the latter depend on people’s situation in
the income distribution. Until the 1980s, both issues could be subsumed under the level of
welfare generosity, since both redistributive and insurance programs were expanded. In the
era of austerity, however, welfare conflicts tend to become a zero sum game, with
expansions for some groups coming at the expense of cuts for others (Häusermann 2010).
In this context, social insurance for labor market insiders competes with needs-based
benefits for outsiders and low-income workers, and this “dualization of benefits” (Palier
2010, Palier and Thelen 2010, Emmenegger et al. forthcoming) becomes politically
relevant, especially in the social insurance regimes of continental Europe.
Financial transfers are, however, only one aspect of the distributive profile of welfare
states. Services – which have been strongly developed in the Nordic countries from the
1960s onwards already (Huber and Stephens 2001) – play an increasingly important role in
all post-industrial economies, because they typically allow and enhance overall labor
market participation, an issue that has become crucial for the economic performance of
liberal and continental welfare regimes (Iversen and Wren 1998). Esping-Andersen’s
(1999b) analysis of the structure of social risks in post-industrial economies has
emphasized the importance of active labor market policies, investment in human capital

17
and care services for current welfare reform. In a similar vein, Bonoli (2005) has shown
that the “new social risks groups” of young labor market participants, single-parent
household and working parents have welfare needs in terms of services that are very
different from the “income insurance needs” of the standard workers, for whom the
industrial welfare state was built (see also Armingeon and Bonoli 2006). Rather than
income insurance, these risk groups need services that help them participate in the labor
market. Such social investment policies (Esping-Andersen et al. 2002) have become
important on the reform agendas of both liberal and continental regimes, and the socio-
structural factors driving individual preferences for them again differ to some extent from
those driving preferences for passive income replacement or redistributive policies. Rueda
(2007) has shown that workers tend to be divided on the issue of passive vs. active labor
market policies, with insiders privileging employment protection and earnings-related
income replacement, while outsiders prefer active labor market measures. As with the
distinction between redistribution and social insurance, social investment policies have the
potential of dividing the working class, whose support for “general welfare expansion” was
supposed to be homogenous in the industrial era. In this sense, economic conflict has
become more heterogeneous and potentially cross-cutting, which needs to be taken into
account when measuring economic voter preferences in the electoral arena.
Finally, in line with the idea that intra-labor heterogeneity has increased in the post-
industrial era, welfare conflicts in advanced capitalist democracies also increasingly
involve debates on distributive deservingness, i.e. on the scope of beneficiaries who should
be entitled to benefits and services. Predominantly, this debate takes the form of welfare
chauvinism (Kitschelt 1995; Andersen and Björklund 1990), i.e. the idea that welfare
benefits and services should be granted only to nationals, who are considered “deserving”,
because they are part of the community of solidarity and/or because they have contributed

18
to social security schemes. Hence, the issue at stake here is not the level or structure of
benefits or services, but the entitlement. If entitlement is mostly discussed with regard to
immigrants, as van Oorschot (2000, 2006) has shown, narrow conceptions of welfare
deservingness (what he calls “conditionality”) also exist with respect to the disabled or
unemployed. Education turns out to be the single most important factor explaining attitudes
on welfare chauvinism and narrow definitions of deservingness or welfare misuse (van der
Waal et al. 2010, van Oorschot 2006): the lower the education level of respondents, the
more they want to narrow down welfare entitlement to a limited circle of “deserving”
citizens. The authors consider this finding paradoxical, because the lower classes (in terms
of education, income and class) also tend to be the ones supporting welfare generosity most
strongly.
It seems that welfare deservingness follows a different logic from preferences over
redistribution, social insurance and social investment more generally. Indeed, such
preferences – even though relevant for economic policies in the realm of welfare and labor
market regulation – may primarily be structured by cultural, rather than economic
mechanisms. This hypothesis is closely related to Gilen’s (1995) widely cited finding,
according to which opposition to welfare in the US is driven by racial prejudices.
Van der Waal et al. (2010) empirically test three mechanisms that might explain the link
between low levels of education and attitudes on welfare deservingness: political
competence, i.e. the lower educated do not understand the ideological incoherence of their
pro-redistribution and welfare chauvinistic attitudes; ethnic competition, i.e. the lower
educated “rationally” fear for their own scarce resources; and cultural capital; i.e. the lower
educated are more culturally insecure and experience cultural diversity as a threat,
triggering feelings of distrust. The evidence they find on the basis of Dutch data clearly

19
points to the importance of the third, cultural mechanism, whereas the cognitive and
economic mechanisms are disconfirmed.
Derks’s (2004) concept of ‘economic populism’ supports their findings. He conceives of
this ‘syndrome’ as a specific reaction against feelings of social deprivation that are
prevalent among the underprivileged. Economic populists reject social achievements such
as the welfare state not for their content, but because of their elitist origin. Derks shows for
Flemish data that economic populism is particularly widespread among low-income groups,
manual workers and people with low educational attainment. He tries to explain this
phenomenon by existential insecurity and moral disorientation. Little equipped to deal with
the societal changes which we have described, and morally disoriented, these groups not
only turn against the unresponsive elites, but also against undeserving welfare recipients,
such as the long-term unemployed, ethnic minorities and asylum seekers, who become
targets of their resentment. ‘From this point of view, anti-welfare statism does not reflect a
belief in neo-liberal market capitalism, but rather a radical expression of welfare
chauvinism, inspired by a rigid form of social conservatism and a profound distrust of
current social policy arrangements’ (Derks 2004: 519).
Eger’s (2010) and van Oorschot’s (2006) finding of a strong correlation between
immigration, anti-immigration attitudes and narrow conceptions of welfare deservingness
point in a similar direction: in a context of increasing cultural diversity, people with low
levels of cognitive and educational resources develop feelings of insecurity and distrust,
which become manifest in their beliefs that “others” i.e. outgroup members take advantage
of undeserved benefits and privileges.
All these findings provide a final argument why studies on the development of democratic
capitalism should take cultural preferences into account when explaining change in
economic and social policies. The distinction between the realm of economic and cultural

20
politics becomes increasingly blurred, since cultural beliefs drive preferences on economic
policies. This in turn influences party choice and party competition, thereby altering the
partisan dynamics in contemporary capitalism.
2.3. Regime differences We expect that the importance of the economic and cultural preference scales, as well as
the mean level of attitudes on these dimensions vary across countries and across specific
capitalist regimes. In line with Inglehart’s (1990) arguments based on modernization
theory, one might expect that the “new” cultural dimension becomes both more coherent
and more important in more advanced economies relative to more developing regions,
because economic conflict becomes “pacified” and preoccupations shift to more cultural
issues. Hence, we would expect the cultural dimension in liberal, nordic and continental
Europe to be more clearly consistent (i.e. the different items should load on a same factor)
than in southern and eastern Europe. A similar reasoning applies to the economic
dimension, but in the reverse order. Here, the ongoing post-industrialization of economies
in the northern and western part of Europe would lead us to expect an economic dimension
of somewhat less importance and of a somewhat less coherent composition. The
heterogeneity of the economic dimension that we have elaborated above should be most
advanced and most developed in the clearly post-industrial countries.
We also expect that the mean levels of country preferences on these scales differ across
countries and across capitalist regimes. Again reasoning with modernization theory, the
mean level of universalism or progressive values may depend on the level of economic
develoment. Inglehard and Welzel (2005: 61) argue that post-industrialization leads to a
rise in self-expression values, a concept relatively close to our idea of cultural liberalism.
The underlying mechanism could be that the growing share of people who are employed in

21
the service sector tend to be highly skilled and in an interpersonal work logic (Oesch
2006). Both factors contribute to/depend on the development of liberal self-expression
values, and they also enhance these people’s resources and opportunities in their countries
(which contributes to their liberalism, since they do not experience structural change as a
threat). Hence, we would expect that the more post-industrialized countries on average
display higher levels of cultural liberalism and universalism. Thus, on the cultural
dimension, we expect more liberal attitudes in the West European countries, relative to
eastern and southern Europe.
Country level differences are more difficult to theorize with regard to the economic
dimension. On the one hand, one might expect that high levels of affluence, economic
regulation and welfare state development shape people’s attitudes towards economic
liberalism and state interventionism in the sense that they become generally more
supportive of the principles of state intervention, regulation and redistribution. Svallfors
(1997) has, for example, shown that the welfare regime affects people’s ideas of social
justice in the sense that they become supportive of the regime they experience themselves.
On the other hand, one might expect some kind of a “saturation effect”, which implies that,
with growing affluence and welfare, people adopt more economically liberal positions: the
“main battles” have been fought and won, and people feel less strongly about the further
development of economic regulation and social welfare. This hypothesis would suggest
that the more people are satisfied with the state of the economy and welfare in their
country, the more economically liberal positions they defend. One would again expect the
differences to separate most clearly the western from the eastern and maybe southern
European states.
Even though we expect relative differences with regard to the importance and mean level
of the two dimensions across different capitalist production regimes, we nevertheless

22
basically expect the same substantive configuration for both of these dimensions and
similar trends with regard to their impact on party choice across Europe.
3. Empirical analysis
3.1. Dimensions
For the empirical analysis, we use the data of the ESS4, which, depending on the country,
went into the field between fall 2008 and spring 2009. The file includes random samples
for 29 European countries4, which, for the purpose of our analyses, we categorize into five
types of capitalist production regimes5. For our analyses, the ESS4 data has the advantage
that it includes a rotating module on attitudes towards the welfare state.
To operationalize the cultural dimension, we create indicators for the most important issues
of the two steps that have profoundly transformed the cultural dimension over the past five
decades. For the concerns of the new social movements of the seventies and eighties, we
build a scale for cultural liberalism. We use five items to build this scale (for the
formulation of the items, see Table in Appendix I): two items referring to women’s
emancipation, one item dealing with rights of homosexuals, and two items with
authoritarianism (in school and in criminal law). Exploratory factor analysis reveals that the
five items constitute a weak uniform scale (Eigenvalue of 1.23) across all countries. The
women’s emancipation items are most closely associated with the overall scale. We also
tested the scale for each regime, and found the same pattern, although the scales are even
weaker in individual regimes.
4 The countries included are: Belgium, Bulgaria, Croatia, Cyprus, the Czech Republic, Denmark, Estonia, Finland, France, Germany, Greece, Hungary, Ireland, Israel, Latvia, the Netherlands, Norway, Poland, Portugal, Romania, Russia, Spain, Sweden, Slovenia, Slovakia, Switzerland, Turkey, UK, Ukraine. 5 The categorization is done with regard to the relevant literature on varities of capitalism (Hall and Soskice 2001, Schmidt 2009.) For the Eastern European countries, we base our categorization on Bohle and Greskovits (2007), who show that Slovenia must be included with the continental CMEs, because of ist strong neo-corporatist character.

23
For the concerns of the new populist right and the globalization losers, we chose to
operationalize two issues – their opposition to immigration and their Euroscepticism. For
immigration, we build a scale based on six items (see Appendix I), which form a strong
uniform scale (Eigenvalue of 3.40). The scale is equally strong across all five regime types.
In addition, we try to operationalize that aspect of welfare conflicts in advanced capitalist
democracies, which we expect to be mainly associated with the cultural dimension – the
question of distributive deservingness. We use two indicators for this question. First, an
individual item is chosen to operationalize welfare chauvinism. This item asks whether
immigrants receive more or less (in terms of social benefits and services) than they
contribute (in terms of taxes). Second, we also use a set of three items to measure economic
populism, welfare deservingness, or welfare misuse. These items measure negative
attitudes with regard to welfare dependents, many of whom are conceived as undeserving
(unemployed people not really trying to find a job, people managing to obtain benefits to
which they are not really entitled to, and people pretending to be sick to stay at home).
Although the three items only form a very weak uniform scale (Eigenvalue=.83) and
equally weak regime-specific scales, we still use this scale for lack of a better alternative as
an indicator of attitudes towards welfare state misuse. The empirical analysis (below)
confirms that these issues (welfare chauvinism and welfare misuse) are part of the cultural
dimension structuring people’s attitudes, rather than of the economic dimension.
To operationalize the economic dimension, we create indicators for all aspects of economic
distributive conflict that we have discussed above: redistribution, social insurance and
social investment. We measure preferences on redistribution with two items from the ESS
survey: the question whether governments should reduce differences in income levels and
the question asking respondents whether they think that for a society to be fair, the
difference in standards of living should be small. This second item measures preferences

24
for egalitarianism, but it can be read as a measurement of income redistribution
preferences. In order to measure social insurance, we use two questions of the ESS survey
that precisely ask respondents how welfare benefits should be distributed – according to
needs or according to the contributions they have made. The two items refer to
unemployment insurance and pension insurance respectively and they measure whether
people think that higher benefits should go to those individuals who have contributed most
to the insurance scheme (instead of those who have the greatest financial needs). For social
investment, we also use two items, which relate to policies promoting participation in the
workforce. The first item asks respondents whether they think that governments should be
responsible to provide a job to everyone who wants one and the second item asks
preferences on government responsibility for providing sufficient childcare infrastructure.
In an exploratory factor analysis across all countries, it becomes clear that, as expected, the
six items, all of them related to welfare politics, do not form a single dimension, but at least
two separate components of economic preferences. As is shown in Table 1, the
redistribution and social investment items form a first weak factor, while the social
insurance items load on a different, very weak factor6. The same pattern emerges for each
and every regime time. It relates to the distinction between size and design we made earlier:
whereas all social investment and redistribution items measure some sort of welfare
generosity, the social insurance items measure the distributive logic, not the level of
benefits. Given that the social insurance items are empirically clearly different from the
other items, we include only the four redistribution and social investment items for our final
operationalization of the two scales.
<Table 1 >
6 It is important to note that even the indicators of redistribution and social investment are only weakly
related. If one constrains the factor analysis to three instead of two factors, these items load on different factors. However, none of the resulting three factors achieves an EV higher than 1.

25
With the five items designed to operationalize the cultural dimension, and the four items
designed for the economic dimension, we have then performed an exploratory factor
analysis both including all countries, and per regime. The results are presented in Table 2.
Most importantly, we find the expected two dimensions – a cultural and an economic
dimension. Apart from two exceptions, the pattern of correlations of the original items with
the two factors is very similar across all regime types: the five cultural items all load
appreciably on the cultural, but not on the economic scale, and the four economic items all
load on the economic, but not on the cultural scale. Note that, as expected, welfare
chauvinism and welfare misuse/deservingness are part of the cultural, but not of the
economic dimension. The two exceptions concern the CEE countries, which we labeled
Eastern European Capitalism. First, in these countries, cultural liberalism surprisingly is
more closely associated with the economic dimension than with the cultural dimension,
where it goes together with economic liberalism and not with redistributive or social
investment concerns. Second, welfare misuse or deservingness is not associated with any of
the two dimensions in CEE countries. The CEE regime also differs from the rest of the
regimes insofar as, in these countries, the economic scale is stronger than cultural one,
while the reverse is true for the LMEs, the CMEs, and the Scandinavian CMEs.
<Table 2 >
In addition to the regime-specific scales, we also have constructed uniform scales, which
are identical for all five regime types. The advantage of such uniform scales is that they
allow a comparison of corresponding levels across regime types. While these uniform
scales are not exactly identical to the regime-specific scales, the two are nevertheless very
highly correlated in each and every case, as is indicated in Table 3. This means that we do
not lose much information by opting for the uniform scales. Although these scales are
weak, their pattern is remarkably similar across European societies, which means that the
26
cultural and economic preoccupations of the Europeans are quite similar across the
continent. The cultural preference scale is dominated everywhere by immigration – the
most important issue of the demarcation-integration conflict of the 1990s/2000s. The
economic preference scale is more equally determined by its two components – the
redistributive and the social investment issues.
<Table 3 >
3.2. Preference levels across countries
We start by comparing the mean levels of economic liberalism and cultural
liberalism/openness across all countries in our sample. Figure 1 shows strong country
differences, as well as a rather strong bivariate correlation between mean levels of
economic and cultural openness (r=0.63). Where people are on average more culturally
open, they also on average defend more economically liberal (i.e. economically
conservative) positions.
<Figure 1 >
Figure 2 shows that mean country levels differ across capitalist regimes. The clear
differences between CME, LME, SME and CEE countries tend to validate the
categorization in different regimes.
<Figure 2 >
Nordic and continental CME are the most culturally open countries, whereas the SME,
LME and CEE countries are on similar levels of cultural traditionalism/nationalism.
Economically, the differences are even more striking. Here, CMEs and LMEs display
clearly higher levels of economic liberalism than the countries of southern and Eastern
Europe. One can also see that Turkey fits in neither of the regimes, because it is both

27
culturally and economically more conservative (also, there are no clear factors identifiable
in the Turkish case, which is why we leave this country out of the further analyses).
We do not intend to explain these country level differences in detail, but since they are so
striking, we propose to explore a few macro-level explanations. With regard to the
economic preference dimension, we have argued that the link between economic and
welfare development, on the one hand, and preferences on the other, could go either way:
with economic development, we may either see people becoming economically more
interventionist (because they experience the benefits of affluence and economic security),
or they may become more economically liberal (because they take economic security for
granted). We explore these links first with bivariate analyses. Figure 3 correlates the level
of economic affluence in a country (GDP/capita) with the mean level of economic
liberalism and shows a very strong link between the two. The Nordic countries, the
Netherlands, Switzerland and the UK have the highest level of economic development and
– this may come as a surprise – the on average most economically liberal population.
<Figure 3 >
In order to test the mechanism linking affluence and economic liberalism, we have
constructed an indicator of individual satisfaction with the economic and welfare
performance of a country. This indicator includes items measuring people’s evaluation of
pension provision, unemployment benefits, childcare infrastructure, opportunities for young
people to find a first full-time job, poverty and also people’s evaluation of the present state
of the economy (see Appendix I for the precise operationalization). A factor analysis shows
that all items form a single factor (factor loadings between 0.46 and 0.67, EV=2.17), which
we use as an indicator of economic satisfaction. Figure 4 shows the very strong link of
mean economic satisfaction with economic liberalism at the macro-level. In countries,
where people on average evaluate the standard of living and economic conditions

28
positively, they are economically less interventionist when it comes to preferences for
redistribution and social insurance. We have also tested this link at the micro-level,
including socio-structural controls7 and country dummies (results not shown). Throughout
all capitalist regimes, the individual economic satisfaction has a positive and clearly
significant effect on economic liberalism.
<Figure 4 >
With regard to the determinants of country levels of cultural openness, we referred to
modernization theory, which postulates a link between post-industrialization and the
development of self-expression values. We choose the difference between the share of the
new middle class (the typically post-industrial workers, including socio-cultural specialists,
managers and technical experts) in the workforce and production workers (the typically
industrial workers) as an indicator of post-industrialization. Figure 5 documents the strong
link between this indicator of post-industrialization and the level of cultural openness,
which confirms the hypothesis of modernization theory. The more the new middle class
outnumbers production workers, the more culturally open people are on average. The
Nordic countries, the Netherlands and Switzerland form the “post-industrial pole”, whereas,
at the opposite end of the scale, Turkey and Hungary are both more industrial and
conservative.
<Figure 5 >
Modernization theory is not that clear on the link between structure and values, but
education certainly plays a role. At the level of attitudes, we think that the higher cognitive
and material resources of the middle-class workers (as the “winners” of modernization)
imply that they experience structural change less as a threat. By contrast, industrial workers
7 Controls are the same variables we use in the regressions in Tables 5 and 6 below, i.e. age, gender, education, income public sector employment, class, trade union membership, religiosity and catholicism.

29
whose qualifications are in diminishing demand, may become frustrated with the direction
of structural change, therefore developing feelings of disempowerment and alienation. We
try to capture these feelings with an indicator measuring the satisfaction of a respondent
with the way democracy works in his or her country. We assume that structural “losers”
develop more generally negative attitudes towards political institutions and processes. The
link shown in Figure 6 seems to confirm this hypothesis. In countries such as the Ukraine,
Hungary, Latvia, Turkey or Russia, people are generally more dissatisfied with democracy,
and these countries also show lower mean levels of cultural liberalism. In the most post-
industrial country group (Scandinavia, the Netherlands and Switzerland), by contrast,
people are on average both happier with democracy and culturally more open. Again, we
have tested this mechanism at the micro-level, predicting cultural openness with individual
satisfaction with democracy (including socio-structural controls8 and country dummies
(results not shown)) and the results are unambiguous: satisfaction with democracy
consistently and strongly predicts cultural openness in all countries.
<Figure 6 >
In order to see whether our hypothesis of an indirect effect of structural change (economic
development, post-industrialization) on attitudes and thus on economic and cultural
liberalism holds, we have included both sets of variables in a simple macro-level regression
shown in Table 4. When economic satisfaction is introduced in the model, the direct effect
of economic affluences disappears. The results are similar, although not exactly the same
for cultural openness: post-industrialization retains a small, but still significant direct effect
on average levels of cultural openness, even when we control for satisfaction with
democracy.
8 Controls are the same variables we use in the regressions in tables 5 and 6 below, i.e. age, gender, education, income public sector employment, class, trade union membership, religiosity and catholicism.

30
<Table 4 >
In sum, the analysis of country means with regard to economic liberalism and cultural
openness shows strong differences in the average levels, which can be linked to structural
development. However, despite the different levels, we expect similar configurations of
socio-structural determinants of the two types of preferences.
3.3. The social-structural determinants of political preferences
Tables 5 and 6 present the results of OLS-regression analyses, predicting individual levels
of economic and cultural liberalism with a range of variables related to people’s socio-
economic status and socio-demographic characteristics. Country dummies are included, but
not shown in the tables. The overall explanatory power of our models is relatively weak
(R2 between 0.12 and 0.21), with preferences appearing least socially structured in those
regimes where the coherence of the preference scales is weakest (the cultural scale for CEE
countries and the economic scale for LMEs, see Table 2).
<Table 5 >
Age, education and class have clear and consistent direct effects on cultural openness in all
five capitalist regimes, with younger people, the highly educated and members of the
middle class (socio-cultural specialists, technicians and managers), as well as the self-
employed and office clerks being more open. We use Oesch’s (2006) class scheme, because
it allows differentiating between different sections of the middle and the working class. The
reference class in our analysis is the production workers, who constitute the most
conservative class in all regimes, together with service workers in state market economies,
i.e. southern Europe. Since the class scheme entails a skill-component, too, Table 5 clearly
reveals the very strong effect of education and training. The less cognitive and human

31
capital resources people have, the more they reject openness with regard to immigration,
EU integration, universalism and welfare state chauvinism. Apart from this dominant effect
that we see in Table 5, a few other variables have strong effects but not in all regimes.
Women are more open in Scandinavia, southern and eastern Europe, but – surprisingly so –
more conservative in anglo-saxon countries. Income has no effect on cultural values, when
we control for education and class, nor has the interaction of income and education any
effect at all. Finally, religiosity and Catholicism still determine people’s cultural values in
all regimes, except for Eastern Europe, with surprising variation. While in SME’s, religious
practice and Catholicism have a similar effect (which makes sense, since these are mostly
catholic countries), catholics are also more conservative in LME’s but apart from them,
religious people display more culturally open values. Overall, the effect of education and
skill is the most important finding in this table, since it is so consistent.
Things look different when it comes to economic preferences. As Table 6 shows, education
levels do not explain preferences for redistribution and social investment, when we control
for other class indicators such as income and class. Only when education goes together with
a high income do people display economically more liberal (i.e. right-wing) preferences.
The second striking difference to the social structuration of cultural preferences is to be
found in the class analysis. Contrary to what we saw in Table 5, the upper classes are not
consistently more liberal than production workers when it comes to economic liberalism.
The socio-cultural specialists, i.e. high-skilled workers in interpersonal service occupations
(see Oesch 2006) are not consistently more liberal, even though they have higher positions
in the vertical stratification than production workers. In Scandinavia and in southern
European SMEs, they do not differ from production workers in their economic preference,
while they are only moderately more economically liberal in continental Europe. The self-
employed, the technical experts, small business entrepreneurs and managers, however, are

32
economically more clearly to the right than production workers, which corresponds to the
old industrial class conflict, opposing labor and capital. This result demonstrates that the
new middle class has become heterogenous with regard to the economic dimension of
political conflict. We also find that trade union members have more interventionist attitudes
in all regimes and that religiosity and Catholicism drive economically more interventionist
values in LMEs and CEE’s but not in other regimes.
Country differences are interesting with regard to public sector workers, who have more
economically liberal preferences in continental and southern Europe. This could be due to
the fact that those regimes have more regulated labor markets, which lead to strong
employment protection for public sector workers (insider-outsider divides), who therefore
depend less on welfare state generosity.
<Table 6 >
Let us point out again: throughout the different capitalist regimes, we find similar structural
determinants of individual preferences, with education and class showing the strongest and
most consistent effects. Figures 7 and 8 locate the relevant socio-structural groups in the
political space and illustrate how important they are for voter preference formation.
<Figure 7 >
Despite differences in levels, education structures cultural openness in all regimes. In
LMEs and CMES, the polarization on the cultural dimension between different educational
groups is clearly stronger than on the economic dimension. This adds evidence to the
hypothesis of a liberating effect of education, driving the development of universalistic
values. In SMEs, educational groups differ on both the cultural and the economic
dimension, whereas in CEEs, education structures economic values more strongly than

33
cultural ones. However, in al regimes, there seems to be a linear relationship between
education level and cultural openness.
With regard to class, differences between the economic and cultural dimensions become
visible, too. Figure 8 shows only three classes: production workers (the “old” working
class), as well as technicians and socio-cultural professionals as the two representatives of
the new middle classes9. When looking at the triangles per capitalist regime type separately,
one detects a common pattern: the economic conflict is between production workers and
technical experts, whereas the “new class conflict” between production workers and socio-
cultural specialists differentiates these groups mainly on the cultural dimension, much less
so on the economic one. With regard to economic conflict in post-industrial societies, this
finding is crucial, since it shows that the middle class has become divided with regard to
distributive justice (redistribution and social investment). Therefore, economic conflict can
no longer be portrayed simply as a conflict between the upper and the lower classes (even
though income continues to play a role in differentiating the highly educated among each
other). The upper classes have become very heterogeneous with regard to economic
preferences, and this has important implications for party choice and the electoral landscape
in general, to which we turn now.
<Figure 8 >
3.4. The electoral implications of political preferences
In this section, we analyze the electoral implications of political preferences on the
economic and cultural dimension. We want to explore what drives party choice in the post-
9 We also calculated the configuration of class interests with managers instead of technicians as the second
part of the new middle class. Results are largely the same. The economic distance between socio-cultural professionals and managers is somewhat larger in Nordic and continental European countries and smaller in southern Euroepan countries and CEE countries.

34
industrial capitalist democracies. As we have shown in the socio-structural analysis above,
characteristics such as class and education, which have traditionally shaped vote for
economically left- and right-wing parties are increasingly associated with cultural
preferences, rather than economic ones. If this translates into party choice – and it does, as
we will show below – it changes not only the socio-structural profile of the constituencies
these parties are supposed to represent, but it also changes the entire underlying dynamic of
party competition in contemporary capitalism. Hence, our guiding question in this section
concerns the relative importance of cultural and economic preferences as determinants of
party choice in different capitalist regimes: which parties and party families are elected for
economic reasons, and which are elected for cultural reasons?
The analysis and comparison across countries is complicated by the fact that each country
has a party system of its own. To allow for cross-country and cross-regime comparisons,
we have classified the parties into party families. We shall analyze preferences for the
following families: the radical left, greens, social democrats, liberals, conservative/christian
democrats, radical populist right, based on the party the respondents voted for in the last
national elections, or, if they did not participate in the last elections, the party they feel
close to (see appendix I for the operationalization). We include only parties with at least 50
respondents in our country-specific ESS samples. Conservatives and Christian-democrats
have been put into the same category, since they are functional equivalents in most,
although not quite all countries. The liberal party family only includes conservative liberal
parties, while social liberals have not been analyzed (except for the Liberal Democrats in
the UK). The classification of the parties into families has been particularly challenging for
CEE countries. In these countries, the party systems have not yet been institutionalized to
the same extent as in Western Europe, parties disappear and new parties arise in every
election and it is particularly difficult to classify the parties on the right in ideological

35
terms. We have established the classification on the basis of party-specific information on
their programs, but it must be kept in mind that these party families are more volatile than
in the other regimes.
There are different methods to analyze the electoral choices in multi-party systems. Given
the great differences in the party systems of the European countries, we have opted for a
rather simple methodology. For each party family, we analyze the contrast with the group
of the non-voters/non-partisans. This means that we have made binary regressions for each
party family (up to 6) in each of the 5 regime types, 28 regressions altogether. In each
regression, our key independent variables are the two preference scales, plus an interaction
between the two scales. The interaction term is added to take into account possible
reinforcement effects. In addition to these scales, which are of primary interest to us, we
add a set of control variables – age, gender, education, income, public sector employment,
class, union membership, religion (catholics) and church attendance – and a set of country
dummies10.
Table 7 presents the detailed results for continental CMEs in the form of odds ratios (i.e.
how much more likely an individual is to choose a certain party type rather than not
voting/not feeling close to any party). It includes the effects of the preference scales and of
the controls, but not of the country dummies. For the continental CMEs, the table shows the
strong effects cultural preferences have on the choice of the green parties and the parties of
the new populist right, i.e. of the main protagonists of the last two waves of political
mobilization. The more culturally liberal or open a voter, the greater her chance to vote for
the Greens. The more culturally conservative or nationalistic a voter, the greater her chance
to vote for the radical populist right. The corresponding effects are among the strongest we
find in all our 28 regressions. In these countries, culturally liberal or open voters are also 10 For the CEE countries, we had to leave out income and public sector employment, because it was not available for all the countries.

36
much more likely to vote for the social democrats and for the radical left. By contrast,
culturally conservative voters are not more likely to vote for moderate parties on the right.
In continental CMEs, the effects of the economic preferences are considerable, too, even if
more limited than the effects of the cultural preferences. As we would expect, economic
preferences mainly distinguish between, on the one hand, voters of the radical and
moderate (social democratic) mainstream left, who favor more redistribution and social
investment, and, on the other hand, voters of the moderate (liberal and conservative) and
radical right, who want less of both. The more economically liberal an individual is, the
more likely he or she is to choose a party of the moderate right. There is one significant
interaction effect between the two types of preferences – for the Greens: this effect implies
that the combination of an economically left preference with a culturally liberal/open
preference enhances the vote for the Greens beyond the additive effect of the two types of
preferences.
<Table 7>
For the continental CME countries, this table also presents the effects of the control
variables. While not our main preoccupation, some results are worth reporting. First of all,
age is a key factor for the choice of the mainstream parties – social democrats, liberals, and
conservatives/ christian democrats. The older the citizens are, the more they participate in
the vote and choose mainstream parties. The age effects are of the size of magnitude of the
preference scales. Younger voters (younger than 40) are more likely to abstain or to choose
new challengers from the left or the right11. Religion (church attendance for the
conservative/ christian democratic parties) is the only other control variable with a similarly
strong effect in CMEs. This means that the classic cultural cleavage has not faded away
completely yet. Independently of the cultural preferences as we measure them here, religion 11 In a separate analysis (not shown here), we have looked at the pattern of effects in the younger generation: overall, this pattern is not all too different from the one we have found for the population as a whole.

37
is still a crucial determinant in these countries. As it turns out, age and religion are key
determinants of vote choices in all the other regime types, too. Gender, by contrast, is
generally insignificant, except for the radical populist right in CME countries, which is
much more frequently chosen by men than by women.
Class related patterns are more complex. The middle classes and the more highly educated
generally participate more frequently in the vote than the working classes and the less
educated, with particularly great differences in CEEs. In the continental CME countries, the
highly educated vote disproportionately for the Greens. Generally, the parties that benefit
least from the highly educated are the radical left and the radical right, but also the social
democrats. As far as income is concerned, in all regimes, voters with higher incomes
disproportionately opt for the mainstream parties of the right, to some extent also for the
social democrats. Public sector employees with higher incomes are especially likely to vote
for the social democrats in CMEs and in NCMEs, but not elsewhere. Among the new
middle classes, one result clearly stands out: relative to the production workers as the
reference class, the socio-cultural professionals are clearly more likely to vote for the social
democrats. They opt more strongly than production workers for this party family in all
regimes, except for the Nordic CMEs (results not shown). Moreover, in all regimes, both
the new (socio-cultural professionals and managers, but not technicians) and the old (liberal
professions and small business owners) middle classes opt more strongly for the
mainstream parties of the right than production workers. Surprisingly, with the notable
exception of SMEs, not only the new, but also the old middle classes disproportionately
choose the greens, too. Trade union members generally vote disproportionately for the left,
greens included. Finally, note that the vote for the radical populist right does not seem to be
class-specific in any of our regime types.

38
After this brief account of the effect of control variables, let us return to the impact of the
preference scales, in order to test whether party choice is driven by economic or cultural
attitudes. Table 8 presents the corresponding effects for all regime types. In order to
facilitate the interpretation of these results, we have drawn two figures (9 and 10), which
situate the party families from the various regimes in the two-dimensional space, based on
the combination of their dimension-specific odds ratios. In these figures, odds ratios
smaller than one have been transformed according to a simple formula (transformed odds
ratio=-1/odds ratio) so as to make them comparable to the ratios greater than one. Figure 9
presents the overall configuration. As is immediately apparent, the spread of the party
families on the cultural dimension is much greater than the corresponding spread on the
economic dimension. As is also immediately apparent, the extended spread on the cultural
axis is entirely due to the contrast between the green parties, on the one hand, and the
radical populist right parties, on the other hand. The contrast between the determinants of
green and right-wing populist party choice is particularly important for the continental
CME countries, which we have presented in more detail above, and slightly less strong for
the Nordic CME countries. For the SMEs, the radical populist parties – the French Front
National and the Greek LAOS – are quite distinct, too, but the French Greens (the only
Greens in this regime with a non-negligible support) – do not distinguish themselves from
the mainstream parties. The same applies for the Greens in LME, and both types of challen-
gers in CEE countries. In fact, the Greens in CEE countries are quite different from the
Green parties in the other parts of Europe, since their preference profile closely resembles
that of the liberal parties. The only other outliers are the radical left parties in CME and
NCME countries.
<Table 8, Figure 9 >

39
Based on these results, some readers might be tempted to argue that the relative importance
of the cultural dimension is entirely due to some marginal parties in only two out of five
regime types. Thus, one might conclude that these specific, culturally mobilized parties are
irrelevant to the electoral dynamics that affect politics and policies concerned with
capitalism. As far as the Greens are concerned, it is true that they are still relatively small in
most of these countries. But one should not forget that they are on the way of becoming the
main party on the left in Germany – with 24.1 percent they obtained a larger share of votes
than the social democrats (23.1 percent) and became the second largest party in the recent
regional elections (spring 2011) in Baden-Württemberg. With respect to the radical populist
right, it is true that, in LME and to some extent also in SME countries, the electoral system
has prevented its rise so far12. Moreover, in CEE countries, the populism of the mainstream
right parties may have served to limit its electoral weight. In most of the continental and
Nordic CME countries, however, the radical populist right has become an important party.
Thus, in the NCMEs, the Norwegian Progress Party is the country’s second largest party
with 22.9 percent (2009), and the True Finns have equally become the country’s second
largest party with 19.1 percent (2011). The Danish People’s Party with 7.5 percent (2009)
and the Swedish Democrats with 5.7 percent (2010) are smaller by comparison. In the
CMEs, the Swiss People’s Party has become the country’s largest party with 28.9 percent
(2007), combined the separatist Belgian New Flemish Alliance together with the radical
populist Vlaams Belang take 25.2 percent (2010), i.e. more than any other party, and the
Dutch PVV takes third place with 15.5 percent (2010). In line with our general argument,
the relative importance of these two challenger party families has been increasing over the
last couple of elections in the countries, where they had a chance of getting a foot on the
ground in the first place. Hence, these parties have arrived at the center of electoral 12 France also has a majoritarian system, and the proportional systems of Greece and Spain are known to be little proportional because of their large average district size. Accordingly, Powell (2000) classifies them together with the majoritarian systems. In our sample, only Portugal has a rather proportional system.

40
competition in contemporary capitalism, with effects that go beyond their core policies,
such as environmental policy or immigration. Both green and populist right-wing parties
are important enough to form part of government and to shape politics and policy in
contemporary capitalism. Thus, it is important to take into account that their electoral
constituencies differ strongly from the ones that have traditionally been associated with
left- vs. right-wing electorates. Green voters are highly educated members of the new
middle classes, whereas right-wing populist parties collect the votes of low-educated
groups, with no distinct class profile discernable in our analyses. Even though driven by
cultural concerns, these shifts in voter preferences eventually also affect those parties’
profiles in economic and social policy making.
Even among the moderate mainstream parties, economic conflict is not the primary driver
of party competition anymore. In order to be able to distinguish more clearly the
configuration of the mainstream parties, Figure 10 zooms in on the centre of the space in
the previous figure. In this figure, the three main party families in each regime – social
democrats, liberals and conservatives/christian democrats – are connected to each other to
form a triangle. The overall orientation of the resulting triangles tells us something about
the relative importance of the two dimensions for the choice between these three
mainstream parties. In two regimes – Nordic CMEs and CEEs, the economic dimension is
clearly more important given the horizontal spread of the corresponding triangles. This is
particularly evident for the Scandinavian CMEs. Here, cultural conflict seems to be
“delegated” to the new left and populist right, whereas the mainstream parties represent
voter attitudes towards social insurance and redistribution. In the CEE countries, however,
the three main families are located quite closely together, which suggests that their voters
are not very distinct.

41
By contrast, in the other three regimes – LMEs, continental CMEs, and SMEs – the
economic dimension does not seem to dominate choice for the mainstream parties, quite the
contrary. Triangles are rather more spread across the vertical, i.e. cultural dimension. This
result is very clear in the LME countries (UK and Ireland), whereas in continental CMEs
and in SMEs, both dimensions matter, with the cultural one prevailing over the economic
one. In these three regimes, the conservatives distinguish themselves from the social
democrats above all on the cultural dimension. In the SMEs and in the UK and Ireland (the
LME triangle in the figure), they are also quite clearly distinct from the liberals on the
cultural dimension, whereas they are culturally close to the liberals in CMEs and in Ireland
(triangle not drawn to avoid too many lines).
<Figure 10>
The upshot of this discussion can be summarized succinctly by two observations: first, the
cultural dimension is crucial for the distinction of the increasing number of voters who
choose the new challengers in the party system in all but the LME and CEE regimes.
Second, the cultural dimension is also more important for distinguishing between the voters
of the mainstream party families in LMEs, and at least as important as the economic
dimension in continental CMEs and in SMEs. The economic dimension prevails for the
choice of mainstream parties in Northern CMEs. The lack of ideological structuration in the
CEE countries may explain the relative lack of importance of both dimensions for this
regime. And the LME exception is primarily institutionally determined (i.e. the electoral
systems suppresses the emergence of challenger parties). Overall, the analysis of electoral
configurations clearly shows that both the socio-structural profile of political parties and
the motivations that drive people’s vote choices cannot be analyzed in purely economic
left-right terms. Economic preferences remain an important driver of party choice, but only
for the mainstream parties (and not in LMEs and Eastern Europe). This transformation is

42
also reflected in the socio-structural profile of the electorates. Education, income and class
are not related unidimensionally to party vote (anymore). The highly educated and the new
middle classes are spread across the entire party spectrum, with a particular preference for
the green parties. And right-wing populist parties are particularly attractive for young men
with low levels of education.
4. Conclusion
Our goal in this contribution was to map the structure of the political space of individual-
level preferences throughout democratic European capitalist regimes, in order to discuss
and assess its impact on party choice and electoral politics. In this conclusion, we review
the findings and discuss their implications for the analysis of the politics of contemporary
capitalist democracies.
In line with previous analyses, we have argued theoretically and shown empirically that
there are at least two fundamental dimensions of conflict structuring voter preferences, one
economic and one cultural. We add to the existing literature with regard to the composition
of these dimension: the conflict line opposing cultural openness to cultural conservatism
integrates not only the issues of immigration (which dominates the cultural dimension
everywhere), EU integration and cultural liberalism, but in most countries (the exception
refers to CEE countries, where the cultural dimension is very inconsistent in general and
the economic scale much stronger) also questions of welfare chauvinism and welfare
misuse. Even though these latter two issues refer to welfare policies (i.e. distributive
issues), voters’ attitudes towards them are clearly disconnected from their attitudes towards
welfare generosity more generally. At the same time, we show that attitudes on the
economic dimension have become very heterogeneous. People’s opinions on distributive

43
principles (social insurance vs. redistribution), for instance, do not load on the same factor
as people’s attitudes towards redistribution and social investment policies. These findings
show that the analysis of voter preferences towards economic policies must take into
account that the boundaries between economic and cultural issues have become blurred,
and that distributive conflict has become complex and heterogeneous, and thus cannot be
reduced to a single left-right dimension.
We found striking differences in the average levels on these two dimensions across
countries, with the Nordic and continental CME’s being much more culturally open than
the other countries, and all Western European countries being more economically liberal
(i.e. right-wing) than people in southern and eastern Europe. While these regime
differences confirm the distinction of types of capitalist regimes, their reasons need to be
explained. We referred to modernization theory to explore some of these differences (at
both the micro and macro levels) and found strong correlations between structural
development and average attitudes. The richer a country in terms of GDP/capita, the more
people are satisfied with the economic performance of their economy and with welfare
benefits, and the more they defend economically market-liberal attitudes. This “saturation-
effect” seems to be indirect, i.e. affluence looses its impact once we control for satisfaction
with economic performance. On the cultural side, we find strong evidence for post-
industrialization as a determinant of average attitudes. The more an economy is post-
industrialized (i.e. the new middle class outweighs production workers), the more people
have culturally open values. We tried to explain the mechanism behind this effect with
reference to losers of deindustrialization developing feelings of disempowerment and
alienation, which we measured with their dissatisfaction with the way democracy works in
their country. The effect is strong: the more dissatisfied people are with democracy, the
more culturally conservative they are. The upshot of the regime comparison is that politics

44
in contemporary capitalism develop at very different base levels of support for economic
liberalism and cultural openness.
Interestingly, however, despite these differences in average country levels, the
configurations of interests, i.e. the socio-structural determinants of values and party choice,
are very similar across countries and regimes. In terms of these socio-structural factors
determining individual level preferences on both dimensions, we find clear patterns:
education, class and age drive cultural openness. The older people are and the less
cognitive and human capital resources they have, the more they reject openness with regard
to immigration, EU integration, universalism and welfare state chauvinism. Also, middle
class respondents are more likely to be culturally open than members of the working class.
However, education is the strongest and most consistent predictor of cultural openness.
Things are different when it comes to the economic preference scale. Here, we find no
direct effect of education on economic liberalism, but a stronger impact of income (alone or
in interaction with education). This difference is due to a split within the new middle class:
socio-cultural specialists, i.e. high-skilled service workers in interpersonal occupations,
have more economically interventionist preferences than managers or technical specialists.
Hence, these socio-cultural specialists differ only weakly from the (lower-skilled) working
class in their preferences for redistribution and social investment, which implies that the
new middle class has become heterogeneous with regard to the economic dimension of
political conflict. Distributive conflict can no longer be portrayed simply as a conflict
between the upper and the lower classes (even though income continues to play a role in
differentiating the highly educated among each other). Rather, as we show graphically,
parts of the new middle class have aligned with lower classes with regard to economic
preferences.

45
These (re)configurations of socio-structural groups and their preferences have important
electoral implications. Class and education are increasingly associated with cultural
preferences, in addition to or even instead of economic ones. Since this translates into party
choice, it changes both the socio-structural profile of party constituencies and the
underlying dynamic of party competition in contemporary capitalism. Two major findings
result from our analysis of party choice: first, cultural attitudes explain the vote choice for
green and radical right-wing populist parties. Also, the spread of party families across the
cultural dimension is much greater than the corresponding spread across the economic
dimension, especially in Nordic and continental CMEs and in southern European SMEs.
Hence, green and radical right-wing populist parties as two specific, culturally mobilized
parties are reshaping the European party systems profoundly. In some countries, they
receive up to 30 percent of the votes and more, which makes them likely to enter
government coalitions. Even though driven by mostly cultural concerns, these shifts in
voter preferences thus also affect parties and governments with regard to economic and
social policy making.
The second finding is that economic preferences have a more limited effect on electoral
preferences, distinguishing mostly between the choice of moderate right-wing parties and
(radical and moderate) left-wing parties. In Nordic CMEs and Eastern Europe, the
economic dimension is clearly more important in differentiating moderate right- from
moderate left-wing parties than the cultural dimension. Especially in Scandinavia, cultural
conflict seems to be “delegated” to the new left and populist right, whereas the mainstream
parties represent voter attitudes towards social insurance and redistribution. In continental
CMEs and LMEs, however, the choice for these mainstream parties is at least equally
strongly structured by cultural preferences than economic ones.

46
Overall, our analysis of electoral dynamics shows that both dimensions need to be taken
into account in order to understand party politics in contemporary capitalist regimes.
Culturally mobilized challenger parties alter the dynamics of party competition, even with
regard to the moderate parties that still distinguish themselves with regard to economic
issues. This economic dimension itself has been transformed by parallel processes of
globalization and welfare state maturation. Parties do not compete with regard to macro-
economic policies anymore, but with regard to rather specific welfare policies such as
redistribution and social investment. Of course, the correct conceptualization of individual
level preferences in both cultural and economic terms depends on the research question one
wants to answer. It may make sense to define cultural and economic preferences more
narrowly to analyze specific socio-structural configuration or a particular party family.
However, if our goal is to understand what voters want, why they choose specific parties
and what this choice implies for politics and policies in contemporary capitalist
democracies, we need to take both preferences scales into account.

47
References
Andersen, Jørgen Goul and Tor Björklund 1990. Structural Changes and New Cleavages:
the Progress Parties in Denmark and Norway, Acta Sociologica 33, 3: 195-217.
Armingeon, Klaus and Giuliano Bonoli (2006). The Politics of Post-Industrial Welfare
States. London: Routledge.
Bartolini, Stefano 2000. The Political Mobilization of the European Left, 1860-1980: The
Class Cleavage. Cambridge: Cambridge University Press.
Bohle, Dorothee and Bela Greskovits (2007). “Neoliberalism, embedded neloberalism and
neocorporatism: towards transnational capitalism in Central-Eastern Europe”, West
European Politics 30, 3: 443-466.
Boix, Carles 2000. Partisan governments, the international economy, and macroeconomic
policies in advanced nations, 1960-93, World Politics 53, October: 38-73.
Bonoli, Giuliano (2005). „The Politics of the new social policies: providing coverage
against new social risks in mature welfare states“, Policy and Politics, 33(3): 431-
449.
Bradley, David, Evelyne Huber, Steaphie Moller, François Nielsen, and John D. Stephens
2003. Distribution and redistribution in postindustrial democracies, World Politics 55,
January: 193-228.
De la O, Ana and Jonathan A. Rodden 2008. Does Religion distract the poor? Income and
issue voting around the world, Comparative Political Studies 41, 4/5: 437-476.

48
Derks, Anton 2004. “Are the Underprivileged really that Economically Leftist? Attitudes
towards Economic Redistribution and the Welfare State in Flanders”, European
Journal of Political Research, 43, 4: 509–521.
Duch, Raymond M. And Randolph T. Stevenson 2008. The Economic Vote. How Political
and Economic Institutions Condition Election Results. Cambridge University Press.
Eger, Maureen A. (2010). “Even in Sweden: The Effect of Immigration on Support for
Welfare State Spending”, European Sociological Review 26, 2: 203-217.
Emmenegger, Patrick, Silja Häusermann, Bruno Palier and Martin Seeleib-Kaiser
(forthcoming). The Age of Dualization. The Changing Face of Inequality in Europe.
Oxford and New York: Oxford University Press.
Esping-Andersen, Gösta, Duncan Gallie, Anton Hemerijck and Maurizio Ferrera (2002).
Why We Need a New Welfare State. Oxford: Oxford University Press.
Esping-Andersen, Gösta (1999). Social Foundations of Postindustrial Economies. Oxford
and New York: Oxford University Press.
Esping-Andersen, Gösta (1999b). „Politics without Class? Post-industrial Cleavages in
Europe and America“,in Herbert Kitschelt, Peter Lange, Gary Marks, John D.
Stephens (eds.). Continuity and Change in Contemporary Capitalism. Cambridge:
Cambridge University Press.
Estevez-Abe, Margarita, Torben Iversen and David Soskice (2001). „Social Protection and
the Formation of Skills: A Reinterpretation of the Welfare State“, in Peter A. Hall and
David Soskice (eds.). Varieties of Capitalism. The Institutional Foundations of
Comparative Advantage. New York: Oxford University Press.

49
Flanagan, Scott C. and Aie-Rie Lee 2003. The New Politics, Culture Wars, and The
Authoritarian-Libertarian Value Change in Advanced Industrial Democracies
Comparative Political Studies 36: 235-270.
Fuchs, Dieter and Hans-Dieter Klingemann 1990. The left-right schema. In M.K. Jennings
& J. Van Deth.(eds), Continuities in political action. Berlin: DeGruyter.
Grande, Edgar and Louis W. Pauly (eds) 2005) Complex Sovereignty. Reconstituting
Political Authority in the 21st Century, Toronto: Toronto University Press.
Greenfeld, Liah 1992. Nationalism. Five Roads to Modernity. Cambridge, Mass : Harvard
University Press.
Greenfeld, Liah 1999. Is Nation Unavoidable? Is Nation Unavoidable Today?, pp. 37-54 in
Nation and National Identity. The European Experience in Perspective, edited by
Hanspeter Kriesi, Klaus Armingeon, Hannes Siegrist and Andreas Wimmer. Chur:
Rüegger.¨
Hall, Peter A. and David Soskice (2001). Varieties of Capitalism. The Institutional
Foundations of Comparative Advantage. New York: Oxford University Press.
Hall, Peter and Daniel W. Gingerich (2009). “Varieties of Capitalism and Institutional
Complementarities in the Political Economy: An Empirical Analysis”, British Journal
of Political Science 39: 449-482.
Hainmueller, Jens and Michael J. Hiscox (2007). ‚Educated preferences: explaining
attitudes toward immigration in Europe‘, International Organization 61, Spring: 399-
442.
Hardin, Russell 2000. The Public Trust, pp. 31-51 in Disaffected Democracies: What’s
Troubling the Trialteral Countries?, edited by Susan J. Pharr and Robert D. Putnam,
Cambridge: Cambridge University Press.
50
Häusermann, Silja (2010). The Politics of Welfare Reform in Continental Europe.
Modernization in Hard Times. New York: Cambridge University Press.
Hellwig, Timothy and David Samuels 2007. Voting in Open Economies. The Electoral
Consequences of Globalization, Comparative Political Studies 40, 3: 283-306.
Hix, Simon 1999. Dimensions and alignments in European Union politics: Cognitive
constraints and partisan responses. European Journal of Political Research 35(1):
69–106.
Hooghe, Lisbeth, Gary Marks and Carol J. Wilson 2002. Does left/right structure party
positions on European Integration? Comparative Political Studies 35: 965–989.
Huber, Evelyne and John D. Stephens (2001). Development and Crisis of the Welfare State.
Parties and Policies in Global Markets. Chicago: Chicago University Press.
Inglehart, Ronald 1997. Modernization and Postmodernization. Cultural, economic and
political change in 43 societies. Princeton: Princeton University Press.
Inglehart, Ronald 1990. Culture shift in advanced industrial societies. Princeton: Princeton
University Press.
Inglehart, Ronald 1977. The Silent Revolution - Changing Values and Political Styles
among Western Publics. Princeton University Press (The Nature of Value Change:
19-71).
Inglehart, Ronald and W.E. Baker 2000. Modernization, Cultural Change and the
Persistence of Traditional Values. American Sociological Review 65: 19-51.
Inglehart, Ronald and Christian Welzel 2005. Modernization, Cultural Change and
Democracy. The Human Development Sequence. Cambridge University Press.

51
Iversen, Torben and Anne Wren (1998). „Equality, Employment and Budgetary Restraint:
The Trilemma of the Service Economy“, World Politics 50 (July): 507-546.
Iversen, Torben and David Soskice (2001). “An Asset Theory of Social Policy
Preferences”, American Political Science Review 95(4): 875-893.
Kalmijn, Matthijs and Gerbert Kraaykamp 2007. Social stratification and attitudes: a
comparative analysis of the effects of class and education in Europe, British Journal
of Sociology 58, 4: 547-576.
Kitschelt, Herbert 2007. Review Article: Growth and Persistence of the Radical Right in
Postindustrial Democracies: Advances and Challenges in Comparative Research,
West European Politics 30, 5: 1176 – 1206.
Kitschelt, Herbert 1994. The Transformation of European Social Democracy. Cambridge:
Cambridge University Press.
Kitschelt, Herbert, Peter Lange, Gary Marks and John D. Stephens 1999. ‘Convergence
and Divergence in Advanced Capitalist Democracies’, pp. 427-460 in Continuity and
Change in Contemporary Capitalism, hrsg. von H. Kitschelt und al., Cambridge
University Press.
Kitschelt, Herbert in collaboration with Anthony J. McGann 1995. The Radical Right in
Western Europe. Ann Arbor: The University of Michigan Press.
Lipset, Seymour M. und Stein Rokkan 1967 (1985). ‘Cleavage Structures, Party Systems,
and Voter Alignments,’ neu gedruckt als S. 113-85 in Consensus and Conflict.
Essays in Political Sociology, hrsg. von Seymour M. Lipset, New Brunswick:
Transaction Books.
Mair, Peter 2008. The Challenge to Party Government, West European Politics 31, 1-2:
211-234.

52
Mares, Isabela (2003). The Politics of Social Risk. Cambridge and New York: Cambridge
University Press.
Mau, Steffen 2007. Transnationale Vergesellschaftung. Die Entgrenzung sozialer
Lebenswelten. Frankfurt a.M.: Campus.
Oesch, Daniel (2006). Redrawing the Class Map. London: Palgrave Macmillan.
Palier, Bruno (2010). A long Good Bye to Bismarck? The politics of welfare reforms in
Continental Europe. Amsterdam: Amsterdam University Press.
Palier, Bruno and Kathleen Thelen (2010). Institutionalizing Dualism: Complementarities
and Change in France and Germany”, Politics and Society.
Pierson, Paul (1996). „The New Politics of the Welfare State“, World Politics 48(2): 143-
179.
Pierson, Paul (2001). „Coping with Permanent Austerity: Welfare State Restructuring in
Affluent Democracies“, in Paul Pierson (ed.). The New Politics of the Welfare State.
Oxford and New York: Oxford University Press.
Rokkan, Stein 2000. Staat, Nation und Demokratie in Europa. Die Theorie Stein Rokkans
aus seinen gesammelten Werken rekonstruiert und eingeleitet von Peter Flora.
Frankfurt: Suhrkamp.
Rueda, David 2005. Insider-Outsider Politics in Industrialized Democracies: The Challenge
to Social Democratic Parties, American Political Science Review 99, 1: 61-74.
Scharpf, Fritz W. and Vivien A. Schmidt 2000. Welfare and Work in the Open Economy. 2
Volumes. Oxford: Oxford University Press.
Schmidt, Vivien A. (2009). „Putting the political back into political economy by bringing
the state back in yet again“, World Politics 61, 3: 516-46.
53
Shayo, Moses 2009. A model of social identity with an application to political economy:
nation, class,a nd redistribution, American Political Science Review 103, 2: 147-174.
Streeck, Wolfgang 2009. Re-Forming Capitalism. Institutional Change in the German
Political Economy. Oxford U Press.
Svallfors, Stefan (1997). “Worlds of Welfare and Attitudes to Redistribution: A
Comparison of Eight Western Nations”, European Sociological Review, 13(3): 283-
304.
Tamir, Yael 1995. ‘The Enigma of Nationalism’, World Politics 47, April: 418-40.
Van der Brug, Wouter 2010. Structural and ideological voting in age cohorts, West
European Politics 33, 3: 586-607.
Van der Brug, Wouter and Joost van Spanje 2009. Immigration, Europe and the ‘new’
cultural dimension, European Journal of Political Research 48: 309-334.
Van der Eijk, Cees and Mark N. Franklin 1996. Choosing Europe? The European
electorate and national politics in the face of union. Ann Arbor, MI: University of
Michigan Press.
Van der Eijk, Cees, Mark N. Franklin, and Wouter Van der Brug 1999. Policy preferences
and party choice. In H. Schmitt & J. Thomassen (eds), Political representation and
legitimacy in theEuropean Union. Oxford: Oxford University Press.
Van der Waal, Jeroen, Peter Achterberg, Dick Houtman, Willem de Koster and Katerina
Manevska (2010). “’Some are more equal than others’: ecomomic egalitarianism and
welfare chauvinism in the Netherlands” Journal of European Social Policy 20: 350-
363.

54
Van Oorschot, Wim (2000). “Who should get what and why? On deservingness criteria
and the conditionality of solidarity among the public”, Policy and Politics 28, 1: 33-
48.
Van Oorschot, Wim (2006). “Making the difference in social Europe: deservingness
perceptions among citizens of European welfare states”, Journal of European Social
Policy 16: 23-42.

55
Appendix I: List of variables Indicators1314 Original ESS
variables Survey question
Immigration imsmetn … allow many/few immigrants of the same ethnic group/race as majority
imdfetn .. . allow many/few immigrants of different ethnic group/race as majority
impcntr … allow many/few immigrants from poorer countries outside Europe
imbgeco … immigration bad or good for country’s economy imueclt … countries cultural life undermined/enriched by
immigrants imwbcn … immigrants make country better/worse place to live Cultural liberalism
wmcpwrk ... women should be prepared to cut down on paid work for sake of family
mnrgtjb ... men should have more right to job than women when jobs are scarce
freehms ... gays and lesbians free to live life as they wish schtaut ... school teach children obey authority hrshsnt ... people who break the law much harsher sentences Welfare misuse
uentrjb ... most unemployed people do not really try to find a job
bennent ... many manage to obtain benefits/services not entitled to prtsick ... employees often pretend they are sick to stay at home Welfare Chauvinism
imrccon ... immigrants receive more or less than they contribute
EU Integration
euftf ... European unification go further/gone too far
Egalitarianism smdfslv ... for fair society, differences in standard of living should be small
Redistribution gincdif1 ... governments should reduce differences in income levels Job for everyone
gvjbevn ... government should be responsible to provide a job to everyone who wants one
Childcare gvpdlwk ... government should be responsible to ensure sufficient child care services for working parents
Pension insurance
earnpen ... higher or lower earners should get larger old age pensions
Unempl. insurance
earnueb ... higher or lower earners should get larger unemployment benefits
Economic satisfaction
slvpens ... pensioners’ standard of living is good
slvuemp … unemployed people’s standard of living is good cldcrsv … the provision of affordable child care is good
13 Immig, cultlib, wmisuse: constructed by factor analyses for the entire file, based on corresponding original ESS variables; missing values on the original variables have been imputed based on the other original variables of the respective set. 14 wchauv2_s, eu1_s, gresp1_s, incdiff_s, fairsoc_s, govinc_s: transformed original variables; missing values on the original variables have been imputed based on related variables (wchauv2_s: imsclbn, imsmetn-imwbcn; eu1_s: trstep, trstun, immig; gresp1_s: gvhlthc-gvslvue; incdiff_s: gincdif, smdfslv; fairsoc_s: gincdif,dfincac; govinc: smdfslv dfincac).

56
vngfnjb … the opportunities for young people to find a first full-time job are good
stfeco ... satisfied with the present state of the economy in their country
nmnybsc … of every 100 people of working age in your country, how many would you say do not have enough money for basic necessities? (high values reflect low poverty rates)
Satisfaction with democracy
stfdem … people are satisfied with the way democracy works in their country
Church attendance
rlgatnd How often attend religious service apart from special occasions
Catholicism rlgdnm Religion belonging to at present: catholicism Party choice prtvt ... for which party did you vote in the last election? prtcl ... which party do you feel close to?

57
Table 1: Factor analyses for the economic preference scale: factor loadings for uniform sclae, rotated solution1)
Variable Factor 1 Factor 2 Egalitarianism 0.53 0.10 Redistribution 0.51 0.12 Job for everyone 0.58 0.02 Childcare 0.49 -‐0.05 Pension insurance 0.03 0.63 Unempl. Insurance 0.05 0.63
Eigenvalue 1.12 0.82
1) All scales based on exploratory factor analysis reported in the above table
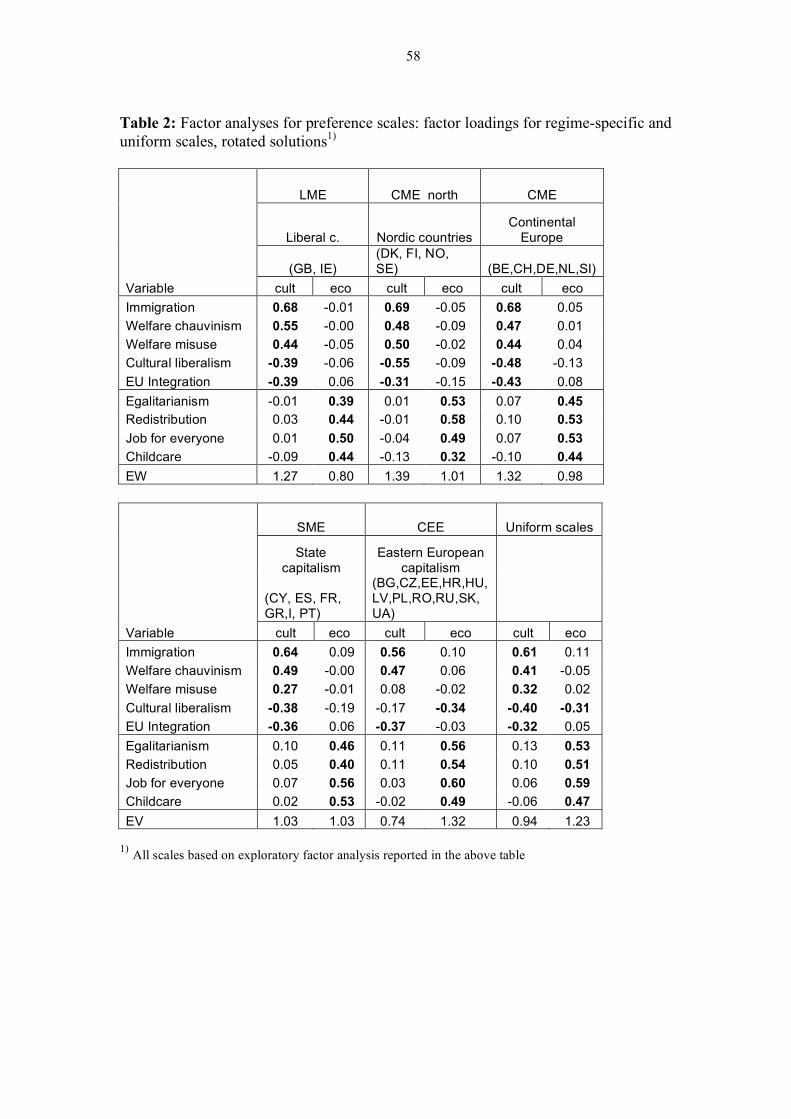
58
Table 2: Factor analyses for preference scales: factor loadings for regime-specific and uniform scales, rotated solutions1)
LME CME north CME
Liberal c. Nordic countries Continental
Europe
(GB, IE) (DK, FI, NO, SE) (BE,CH,DE,NL,SI)
Variable cult eco cult eco cult eco Immigration 0.68 -0.01 0.69 -0.05 0.68 0.05 Welfare chauvinism 0.55 -0.00 0.48 -0.09 0.47 0.01 Welfare misuse 0.44 -0.05 0.50 -0.02 0.44 0.04 Cultural liberalism -0.39 -0.06 -0.55 -0.09 -0.48 -0.13 EU Integration -0.39 0.06 -0.31 -0.15 -0.43 0.08 Egalitarianism -0.01 0.39 0.01 0.53 0.07 0.45 Redistribution 0.03 0.44 -0.01 0.58 0.10 0.53 Job for everyone 0.01 0.50 -0.04 0.49 0.07 0.53 Childcare -0.09 0.44 -0.13 0.32 -0.10 0.44 EW 1.27 0.80 1.39 1.01 1.32 0.98
SME CEE Uniform scales
State
capitalism Eastern European
capitalism
(CY, ES, FR, GR,I, PT)
(BG,CZ,EE,HR,HU, LV,PL,RO,RU,SK,UA)
Variable cult eco cult eco cult eco Immigration 0.64 0.09 0.56 0.10 0.61 0.11 Welfare chauvinism 0.49 -0.00 0.47 0.06 0.41 -0.05 Welfare misuse 0.27 -0.01 0.08 -0.02 0.32 0.02 Cultural liberalism -0.38 -0.19 -0.17 -0.34 -0.40 -0.31 EU Integration -0.36 0.06 -0.37 -0.03 -0.32 0.05 Egalitarianism 0.10 0.46 0.11 0.56 0.13 0.53 Redistribution 0.05 0.40 0.11 0.54 0.10 0.51 Job for everyone 0.07 0.56 0.03 0.60 0.06 0.59 Childcare 0.02 0.53 -0.02 0.49 -0.06 0.47 EV 1.03 1.03 0.74 1.32 0.94 1.23
1) All scales based on exploratory factor analysis reported in the above table

59
Table 3: Correlation between the capitalism-specific scales and the uniform scales, per region
capitalism cultural economic LME 0.99 0.99 CME North 0.99 0.98 CME Continental 0.99 0.99 SME 0.99 0.99 CEE 0.96 0.99

60
Figure 1: Overall level of political preferences by country: country means

61
Figure 2: Overall level of political preferences by capitalist regime type

62
Figure 3: Mean country levels of economic liberalism and level of economic affluence
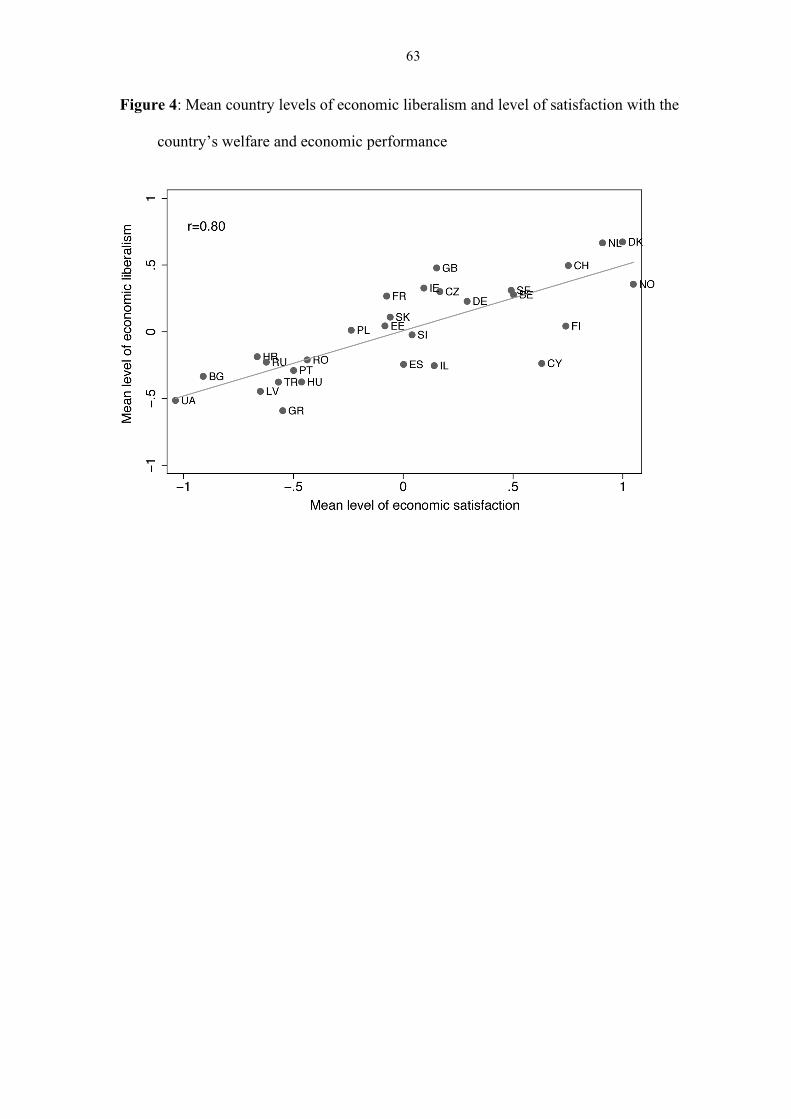
63
Figure 4: Mean country levels of economic liberalism and level of satisfaction with the
country’s welfare and economic performance

64
Figure 5: Mean country levels of cultural liberalism and post-industrialization

65
Figure 6: Mean country levels of cultural liberalism and satisfaction with democracy

66
Table 4: Determinants of mean country levels of economic and cultural liberalism, OLS-regression
Economic liberalism
Economic liberalism
Cultural liberalism
Cultural liberalism
b/se b/se b/se b/se GDP/capita 0.032*** 0.005 (0.01) (0.01) Mean economic satisfaction 0.451*** (0.15) Post-‐industrialization 0.013*** 0.007* (0.00) (0.00) Mean satisfaction with democracy 0.094** (0.03) _cons -‐0.705*** -‐0.111 -‐0.036 -‐0.472*** (0.14) (0.24) (0.04) (0.16) Adj. R2 0.51 0.62 0.32 0.45 N 29 29 29 29

67
Table 5: Determinants of cultural preferences, by capitalist regime type: OLS-regression LME CME North CME Cont SME CEE b/se b/se b/se b/se b/se Age -‐0.006*** -‐0.004*** -‐0.006*** -‐0.002*** -‐0.005*** (0.00) (0.00) (0.00) (0.00) (0.00) Gender (female) -‐0.082*** 0.042** 0.015 0.042** 0.048*** (0.03) (0.02) (0.02) (0.02) (0.01) Education 0.109*** 0.201*** 0.161*** 0.193*** 0.052*** (0.03) (0.03) (0.03) (0.03) (0.02) Income -‐0.002 0.014 0.006 0.015 0.005 (0.01) (0.01) (0.01) (0.01) (0.01) Educ*Income 0.007 -‐0.003 0.005 0.003 0.005 (0.01) (0.00) (0.00) (0.00) (0.00) Public sector -‐0.063 -‐0.039 -‐0.030 -‐0.086* -‐0.007 (0.06) (0.04) (0.04) (0.05) (0.03) Income*PubSector 0.021** 0.017*** 0.017*** 0.010 0.000 (0.01) (0.01) (0.01) (0.01) (0.00) Socio-‐cultural specialist 0.318*** 0.248*** 0.267*** 0.216*** 0.166*** (0.06) (0.04) (0.04) (0.04) (0.03) Self-‐employed 0.395*** 0.191*** 0.379*** 0.166*** 0.164*** (0.08) (0.05) (0.05) (0.06) (0.05) Technical Expert 0.288*** 0.119*** 0.213*** 0.174*** 0.136*** (0.07) (0.04) (0.04) (0.04) (0.03) Manager 0.190*** 0.154*** 0.194*** 0.088** 0.124*** (0.05) (0.04) (0.03) (0.03) (0.03) Office clerk 0.168*** 0.135*** 0.108*** 0.068** 0.088*** (0.05) (0.03) (0.03) (0.03) (0.03) Service worker 0.069* 0.082*** 0.051* 0.030 0.040** (0.04) (0.03) (0.03) (0.03) (0.02) Small Business Entrepr. 0.129*** -‐0.042 0.150*** 0.025 0.075** (0.05) (0.04) (0.03) (0.03) (0.03) Trade union member 0.086** 0.073*** 0.042* 0.068** -‐0.014 (0.04) (0.03) (0.02) (0.03) (0.02) Prod. worker * Union member -‐0.040 -‐0.105*** -‐0.009 0.039 0.017 (0.05) (0.04) (0.03) (0.04) (0.03) Religiosity 0.022*** -‐0.017** -‐0.008 -‐0.029*** -‐0.009* (0.01) (0.01) (0.01) (0.01) (0.01) Catholicism -‐0.146*** -‐0.093 -‐0.058*** -‐0.198*** -‐0.033 (0.04) (0.09) (0.02) (0.02) (0.02) Const -‐0.020 0.054 -‐0.260*** -‐0.749*** -‐0.006 (0.09) (0.08) (0.08) (0.08) (0.06) R2 0.18 0.21 0.16 0.18 0.12 N 3339 6394 7131 6208 10267
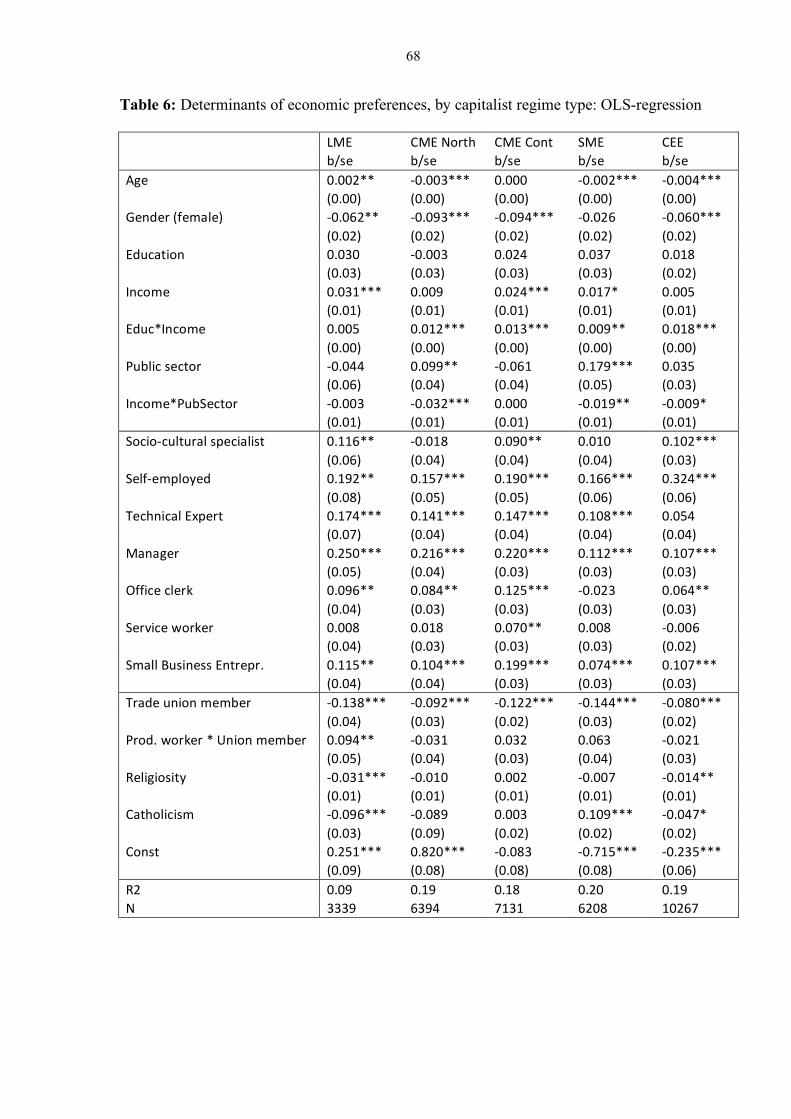
68
Table 6: Determinants of economic preferences, by capitalist regime type: OLS-regression
LME CME North CME Cont SME CEE b/se b/se b/se b/se b/se Age 0.002** -‐0.003*** 0.000 -‐0.002*** -‐0.004*** (0.00) (0.00) (0.00) (0.00) (0.00) Gender (female) -‐0.062** -‐0.093*** -‐0.094*** -‐0.026 -‐0.060*** (0.02) (0.02) (0.02) (0.02) (0.02) Education 0.030 -‐0.003 0.024 0.037 0.018 (0.03) (0.03) (0.03) (0.03) (0.02) Income 0.031*** 0.009 0.024*** 0.017* 0.005 (0.01) (0.01) (0.01) (0.01) (0.01) Educ*Income 0.005 0.012*** 0.013*** 0.009** 0.018*** (0.00) (0.00) (0.00) (0.00) (0.00) Public sector -‐0.044 0.099** -‐0.061 0.179*** 0.035 (0.06) (0.04) (0.04) (0.05) (0.03) Income*PubSector -‐0.003 -‐0.032*** 0.000 -‐0.019** -‐0.009* (0.01) (0.01) (0.01) (0.01) (0.01) Socio-‐cultural specialist 0.116** -‐0.018 0.090** 0.010 0.102*** (0.06) (0.04) (0.04) (0.04) (0.03) Self-‐employed 0.192** 0.157*** 0.190*** 0.166*** 0.324*** (0.08) (0.05) (0.05) (0.06) (0.06) Technical Expert 0.174*** 0.141*** 0.147*** 0.108*** 0.054 (0.07) (0.04) (0.04) (0.04) (0.04) Manager 0.250*** 0.216*** 0.220*** 0.112*** 0.107*** (0.05) (0.04) (0.03) (0.03) (0.03) Office clerk 0.096** 0.084** 0.125*** -‐0.023 0.064** (0.04) (0.03) (0.03) (0.03) (0.03) Service worker 0.008 0.018 0.070** 0.008 -‐0.006 (0.04) (0.03) (0.03) (0.03) (0.02) Small Business Entrepr. 0.115** 0.104*** 0.199*** 0.074*** 0.107*** (0.04) (0.04) (0.03) (0.03) (0.03) Trade union member -‐0.138*** -‐0.092*** -‐0.122*** -‐0.144*** -‐0.080*** (0.04) (0.03) (0.02) (0.03) (0.02) Prod. worker * Union member 0.094** -‐0.031 0.032 0.063 -‐0.021 (0.05) (0.04) (0.03) (0.04) (0.03) Religiosity -‐0.031*** -‐0.010 0.002 -‐0.007 -‐0.014** (0.01) (0.01) (0.01) (0.01) (0.01) Catholicism -‐0.096*** -‐0.089 0.003 0.109*** -‐0.047* (0.03) (0.09) (0.02) (0.02) (0.02) Const 0.251*** 0.820*** -‐0.083 -‐0.715*** -‐0.235*** (0.09) (0.08) (0.08) (0.08) (0.06) R2 0.09 0.19 0.18 0.20 0.19 N 3339 6394 7131 6208 10267

69
Figure 7: Political preferences by level of education and capitalist regimes, mean values

70
Figure 8: Political preferences by class and capitalist regimes, mean values

71
Table 7: Determinants of the vote in continental CMEs, for six party families, odds ratios, t-values, and significance levels1)
radleft green socdem lib conscd rpp b/t b/t b/t b/t b/t b/t cultural2 2.314*** 3.511*** 1.719*** 0.991 1.018 0.251*** (6.66) (11.70) (8.73) (-0.11) (0.25) (-10.30) economic2 0.631*** 0.885 0.865* 1.392*** 1.196** 1.368** (-3.63) (-1.10) (-2.38) (4.82) (2.81) (3.17) inter 0.817 0.755* 0.988 1.036 1.011 1.134 (-1.40) (-2.21) (-0.16) (0.43) (0.13) (0.92) age 1.021*** 0.997 1.028*** 1.028*** 1.029*** 1.007 (3.98) (-0.67) (10.91) (8.84) (10.43) (1.64) gender 0.717 1.068 1.025 0.889 0.963 0.688* (-1.94) (0.51) (0.29) (-1.17) (-0.41) (-2.54) education 1.275 1.740*** 1.166* 1.332*** 1.329*** 1.257* (1.80) (5.24) (2.24) (3.60) (3.82) (1.97) income 0.933 0.983 1.043* 1.115*** 1.077*** 0.994 (-1.74) (-0.58) (2.19) (4.69) (3.46) (-0.19) pubsector 0.875 0.886 0.752 1.268 0.673 0.692 (-0.38) (-0.39) (-1.50) (0.99) (-1.80) (-0.90) Income*public 1.075 1.097 1.084** 0.993 1.093* 1.042 sector (1.11) (1.94) (2.63) (-0.18) (2.52) (0.65) Socio-cultural 1.819 2.001** 1.436* 1.535* 1.381 0.887 professionals (1.74) (2.75) (2.11) (2.04) (1.65) (-0.38) Liberal 1.486 4.704*** 1.347 3.253*** 1.720* 1.219 professions (0.74) (4.89) (1.13) (4.42) (1.98) (0.44) technicians 1.996 1.54 1.377 1.623* 1.501* 1.189 (1.69) (1.54) (1.74) (2.19) (1.97) (0.55) managers 2.330* 1.800* 1.577** 2.446*** 2.240*** 1.499 (2.55) (2.41) (2.97) (5.03) (4.87) (1.64) clerks 1.402 1.446 1.204 1.131 1.481** 1.091 (1.25) (1.51) (1.35) (0.69) (2.66) (0.35) Service 2.161** 1.22 1.247 1.002 1.029 0.885 workers (3.00) (0.88) (1.80) (0.01) (0.20) (-0.54) Small business 1.306 2.225** 0.975 2.308*** 1.544* 1.094 owners (0.73) (3.22) (-0.15) (4.61) (2.52) (0.36) unions 2.358*** 1.411* 1.389** 0.724* 1.009 1.027 (3.48) (2.08) (2.81) (-2.39) (0.07) (0.12) Worker*unions 0.973 0.952 1.16 1.426 1.266 1.088 (-0.09) (-0.19) (0.98) (1.89) (1.37) (0.29) Church 0.771*** 0.987 0.96 1.004 1.338*** 0.983 attendance (-3.67) (-0.27) (-1.32) (0.09) (9.49) (-0.34) catholics 0.737 0.779 0.812* 1.171 1.746*** 0.761 (-1.23) (-1.54) (-2.19) (1.42) (5.80) (-1.74) _cons 0.388 0.042*** 0.112*** 0.045*** 0.025*** 0.308* (-1.93) (-7.33) (-7.92) (-9.26) (-11.83) (-2.53) Pseudo-R2 0.21 0.23 0.13 0.17 0.22 0.14 N 1100 2061 3337 2720 3202 1391
1)*=.05, **=.01, ***=.001
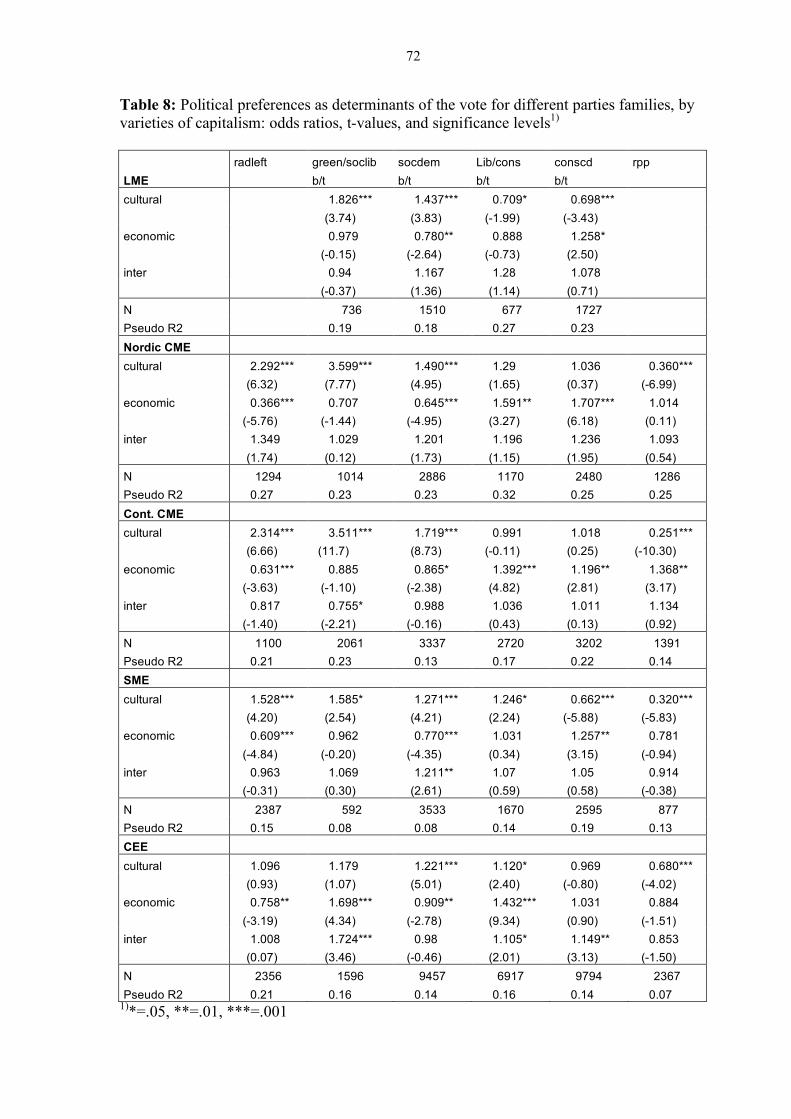
72
Table 8: Political preferences as determinants of the vote for different parties families, by varieties of capitalism: odds ratios, t-values, and significance levels1)
radleft green/soclib socdem Lib/cons conscd rpp LME b/t b/t b/t b/t cultural 1.826*** 1.437*** 0.709* 0.698*** (3.74) (3.83) (-1.99) (-3.43) economic 0.979 0.780** 0.888 1.258* (-0.15) (-2.64) (-0.73) (2.50) inter 0.94 1.167 1.28 1.078 (-0.37) (1.36) (1.14) (0.71) N 736 1510 677 1727 Pseudo R2 0.19 0.18 0.27 0.23 Nordic CME cultural 2.292*** 3.599*** 1.490*** 1.29 1.036 0.360*** (6.32) (7.77) (4.95) (1.65) (0.37) (-6.99) economic 0.366*** 0.707 0.645*** 1.591** 1.707*** 1.014 (-5.76) (-1.44) (-4.95) (3.27) (6.18) (0.11) inter 1.349 1.029 1.201 1.196 1.236 1.093 (1.74) (0.12) (1.73) (1.15) (1.95) (0.54) N 1294 1014 2886 1170 2480 1286 Pseudo R2 0.27 0.23 0.23 0.32 0.25 0.25 Cont. CME cultural 2.314*** 3.511*** 1.719*** 0.991 1.018 0.251*** (6.66) (11.7) (8.73) (-0.11) (0.25) (-10.30) economic 0.631*** 0.885 0.865* 1.392*** 1.196** 1.368** (-3.63) (-1.10) (-2.38) (4.82) (2.81) (3.17) inter 0.817 0.755* 0.988 1.036 1.011 1.134 (-1.40) (-2.21) (-0.16) (0.43) (0.13) (0.92) N 1100 2061 3337 2720 3202 1391 Pseudo R2 0.21 0.23 0.13 0.17 0.22 0.14 SME cultural 1.528*** 1.585* 1.271*** 1.246* 0.662*** 0.320*** (4.20) (2.54) (4.21) (2.24) (-5.88) (-5.83) economic 0.609*** 0.962 0.770*** 1.031 1.257** 0.781 (-4.84) (-0.20) (-4.35) (0.34) (3.15) (-0.94) inter 0.963 1.069 1.211** 1.07 1.05 0.914 (-0.31) (0.30) (2.61) (0.59) (0.58) (-0.38) N 2387 592 3533 1670 2595 877 Pseudo R2 0.15 0.08 0.08 0.14 0.19 0.13 CEE cultural 1.096 1.179 1.221*** 1.120* 0.969 0.680*** (0.93) (1.07) (5.01) (2.40) (-0.80) (-4.02) economic 0.758** 1.698*** 0.909** 1.432*** 1.031 0.884 (-3.19) (4.34) (-2.78) (9.34) (0.90) (-1.51) inter 1.008 1.724*** 0.98 1.105* 1.149** 0.853 (0.07) (3.46) (-0.46) (2.01) (3.13) (-1.50) N 2356 1596 9457 6917 9794 2367 Pseudo R2 0.21 0.16 0.14 0.16 0.14 0.07
1)*=.05, **=.01, ***=.001

73
Figure 9: odds ratios for cultural and economic preferences1
1The negative odds ratios have been transformed according to the formula -1/odds in order to make them comparable to the positive odds ratios.

74
Figure 10: odds ratios for cultural and economic preferences, only major parties1
1The negative odds ratios have been transformed according to the formula -1/odds in order to make them comparable to the positive odds ratios.

75