Embed Size (px)
Citation preview
What Do Transnational Terrorists Target? Has ItChanged? Are We Safer?∗
Patrick T. [email protected]
School of Economic, Political and Policy SciencesThe University of Texas, Dallas800 W. Campbell Road, GR 31
Richardson, TX 75080-3021 USATel: 1-972-883-4923Fax: 1-972-883-6486
Todd [email protected]
School of Economic, Political and Policy SciencesThe University of Texas, Dallas800 W. Campbell Road, GR 31
Richardson, TX 75080-3021 USATel: 1-972-883-6725Fax: 1-972-883-6486
October 3, 2009
Keywords: Bayesian Poisson changepoint regression, transnational terrorism, targetchoice dynamics, homeland security
∗Brandt is an Assistant Professor of Political Science. Sandler is the Vibhooti Shukla Professor of Eco-nomics and Political Economy. This study was funded by the US Department of Homeland Security (DHS)through the Center for Risk and Economic Analysis of Terrorism Events (CREATE) at the University ofSouthern California, grant number 2007-ST-061-000001. However, any opinions, findings, conclusions orrecommendations are solely those of the authors and do not necessarily reflect the views of DHS or CRE-ATE. We are grateful for the code provided by Jong Hee Park for the analysis conducted here. Replicationmaterials are available from the Journal’s website or from the first author. We have greatly profited fromthe anonymous referees’ comments.
1
Abstract
This paper utilizes Bayesian Poisson changepoint regression models to
demonstrate how transnational terrorists adjusted their target choices in response to
target hardening. In addition, changes in the collective tastes of terrorists and their
sponsorship have played a role in target selection over time. For each of four target
types — officials, military, business, and private parties — we identify the number of
regimes and the probable predictors of the events. Regime changes are tied to the rise
of modern transnational terrorism, the deployment of technological barriers, the start
of state-sponsorship, and the dominance of the fundamentalists. We also include two
sets of covariates — logistical outcome and victim’s nature — to better explain the
dynamics. As other targets were fortified and terrorists sought greater carnage,
private parties have become the preferred target type. In recent years, terrorists have
increasingly favored people over property for all target types. Moreover, authorities
have been more successful at stopping attacks against officials and the military,
thereby motivating terrorists to attack business targets and private parties.
2
Terrorists who employ violence to extort political concessions now are understood to
be rational actors who respond predictably to changes in their constraints (Landes 1978;
Sandler et al. 1983). Rationality in political economy is not judged by the desirability of an
agent’s goals, but rather by his or her reactions to the environment in which the agent
operates. Enders and Sandler (1993) showed that policy measures that made certain
terrorist modes of attack more difficult resulted in the terrorists immediately substituting
into other attack modes. For instance, efforts to secure embassies in the 1980s shifted
attacks from embassy grounds to diplomatic officials outside of secure compounds.
Terrorists’ innovations (e.g., the use of fueled airplanes as bombs) and their ability to
adopt the successful methods of other groups underscore their rationality and acuity.
Even though the notion of transference is now well understood in the literature,
some important kinds of transference have yet to be scrutinized empirically. In particular,
transference among target classes — government or its officials, military, business, and
private parties — have not been examined. The primary purpose of this paper is to
investigate how the targets of transnational terrorism have changed over time. We are
particularly interested in identifying the underlying drivers of the dynamics behind
terrorists’ choice of targets — i.e., is it driven by actions of the authorities, by the
dominant orientation of the terrorists, or by other considerations? Are we safer today
because of recent changes in terrorists’ choice of targets? Have defensive security measures
induced some unfortunate responses by terrorists? To accomplish these tasks and to
answer these questions, we apply advanced time series methods — Bayesian Poisson
changepoint models — to document how terrorists have responded to their evolving
collective tastes and changing governmental policies when choosing their targeted group.
Not only do we show the changing risks to specific interests, but we also pinpoint when
these changes took place. Once we know when terrorists switched their targeting decisions,
we can identify what motivated the change. Our methods allow the data to identify the
changepoints so that our priors (e.g., the date of a policy change) do not bias the results
3
(see also Brandt and Sandler 2009; Kollias et al. 2009). As a secondary purpose, we include
two essential sets of covariates — the logistical outcome of terrorist incidents and the
nature of the victim — to better identify and understand the dynamic drivers of the
change over time. Our tertiary purpose is to draw policy conclusions, germane to the
practice of homeland security. The current target regime appears stable because its
underlying causes — the dominance of the fundamentalist terrorists, governments’ foci on
defensive measures, and limited state-sponsorship — show no hint of changing.
Our study contains policy relevance for homeland security worldwide for several
reasons. First, our analysis indicates that transnational terrorists as a group have gradually
shifted their focus from officials and military to business targets and finally to private
parties. This then suggests that security measures that protect private interests are most
in need of augmentation. Second, since the 1990s and the global dominance of Islamic
fundamentalist terrorists, private parties are the most attacked interests, followed by
officials. The public at large needs to be informed of their growing vulnerability, so that
they can increase their vigilance. Third, transnational terrorists have increasingly favored
attacking people over property for all target types in recent years. Homeland security has
succeeded in hardening countries’ infrastructure but, apparently, at the expense of people.
Fourth, the shift in targets appears to respond to three main factors: increasing security,
declining state-sponsorship, and changing tastes of transnational terrorists. Fifth, as
governments succeeded in stopping missions against some target groups, terrorists shifted
their attention to harder-to-defend targets where logistical success is more assured. This
highlights a security dilemma: terrorists’ response to security upgrades is to direct attacks
against the most vulnerable groups. At some point, governments must eschew their
reliance on defense and adopt proactive measures to limit terrorist resources. Such
measures are to make the most vulnerable target — private parties — safer. Sixth, we
establish that current targeting trends were in place well before 9/11, so that the latter is
not a targeting changepoint (in a different context, see Brandt and Sandler 2009; Lee et al.
4
2009; Enders and Sandler 2005).
This study differs from earlier intervention analyses of terrorism. Specifically, we
investigate changepoints for target classes and not for the mode or geographical place of
attack (e.g., Enders and Sandler 1993, 2006). That is, we do not pool over targets. We also
endogenize the changepoint determination using more advanced methods. Unlike all earlier
terrorism analyses, we introduce covariates as additional dynamic drivers. Even though the
rise of fundamentalist terrorism was important in an earlier study (Enders and Sandler
2000), its influence here is both negative and positive, depending on the target class. Some
previously identified interventions (e.g., technological barriers) have a different impact on
target classes, while others (e.g., Abu Ghraib torture revelations) have no impact here. Our
paper is the first to identify target regimes over time. Unlike conventional wisdom, we
show that target choices depend on more than just the orientation of terrorists.
Preliminaries
Terrorism is the premeditated use of threat to use violence by individuals or
subnational groups against noncombatants to obtain political or social objectives through
the intimidation of a large audience. This definition concurs with that of our data set,
upon which our results rest. Terrorism can be categorized into domestic and transnational
events. Domestic terrorism involves homegrown terrorists, who are financed and trained at
home. The bombing of the Alfred P. Murrah Federal Building on April 19, 1995 in
Oklahoma City by Timothy McVeigh is a domestic incident. Such incidents only have
implications within the host country. In contrast, transnational terrorism involves
perpetrators, victims, institutions, governments, or citizens from two or more countries.
The 9/11 hijackings are transnational terrorist incidents with victims from over 80
countries. The perpetrators were foreigners — mostly citizens from Saudi Arabia — who
crossed into the United States. Economically, the 9/11 attacks influenced economies
5
worldwide (Enders and Sandler 2006).
In this study, we focus on transnational terrorist events, for which we have daily
data from 1968 to 2007. There is no other long-term data set, suitable for time series
analysis, for global domestic terrorism. A major security concern today for countries
worldwide come from transnational terrorism, as terrorists try to influence policy while
trying to overcome their clear power disadvantage vis-a-vis the military assets of targeted
governments. Terrorists are also temporally advantaged in identifying soft targets, as they
wait until governments harden targets before deciding what to attack. To investigate these
relationships we look at daily data to discern cumulative aggregate patterns over nearly the
last 40 years (Figure 1, below), quarterly data to discern local or episodic trends and
patterns (Figure 2, below), and then monthly data for our changepoint analyses (Figure 3,
below).
The transnational terrorist threat has changed over time since the rise of the modern
era of terrorism with the hijacking of an El Al flight en route from Rome to Tel Aviv on
July 22, 1968 by three Popular Front for the Liberation of Palestine (PFLP) terrorists.
This hijacking was a watershed event because it demonstrated that a transnational terrorist
event can, if properly executed with lives hanging in the balance, capture media attention
for weeks leading to significant concessions — e.g., the Israelis recognizing Palestinian
interests during negotiations and eventual exchange of prisoners (Hoffman 2006). Following
this hijacking, terrorism assumed a more transnational orientation. Palestinian terrorists
were a major influence for the first two decades of the modern era of transnational
terrorism. Up until the start of the 1990s, the dominant transnational terrorists were either
left-wing groups (e.g., the Red Army Faction, the Italian Red Brigades, or Shining Path) or
ethno-separatist groups (Alexander and Pluchinsky 1992; Rapoport 2004). The left-wing
terrorists seldom targeted private parties and focused on officials and passive military
targets in the hopes of attracting popular support. Leftists targeted businesses either to
protest the company’s host-country’s policies or to extort ransoms from kidnappings.
6
As transnational terrorism grew in the 1970s and 1980s, metal detectors and other
screening devices were installed in airports, embassies and military bases to make them
more secure. With the introduction of metal detectors in US airports on January 5, 1973,
technological barriers were increasingly deployed to protect high-valued targets. As
terrorists innovated, new technologies were created to counter novel threats. Thus,
bomb-sniffing devices were installed at airports after on-board bombs brought down planes
(e.g., Air India flight on June 23, 1985). Improved barriers were placed along the
perimeters of government buildings to minimize damage from car and truck bombs.
Businesses increased the protection of their property and personnel as their vulnerability
grew with enhanced official and military defensive measures.
Another major development was the rise of state-sponsorship in the 1980s, when
nations financed or otherwise assisted terrorists to attack other nations’ assets. Hoffman
(2006, 258-63) traced the modern genesis of state-sponsored terrorism to the November 4,
1979 capture of 52 American hostages at the US embassy in Tehran — an incident that
lasted 444 days. Many high-profile state-sponsored incidents followed in the 1980s,
including the bombing of the US embassy in Beirut in April 1983, the bombing of the US
Marine barracks in Beirut in October 1983, the downing of a Korean Airline flight in
November 1987, and the downing of Pan Am flight 103 in December 1988 (Hoffman 2006).
The era of state-sponsorship was marked by a number of characteristics: mercenary
terrorists (e.g., the Abu Nidal Organization), soft targets, greater carnage, and
professionalism. The latter would result in a smaller share of aborted missions and a higher
share of successfully completed incidents.
The so-called fourth wave of terrorism concerns the fundamentalist terrorists, whose
rise is traced to the last quarter of 1979 with the takeover of the US embassy in Tehran by
radical students and the Soviet invasion of Afghanistan (Enders and Sandler 2000;
Rapoport 2004). A major fundamentalist terrorist group is al-Qaida, whose emergence is
traced to 1988 after the Soviets left Afghanistan (Sageman 2004, 34-9). The al-Qaida
7
network became a dominant terrorist influence during the first half of the 1990s after the
first Gulf War. Other fundamentalist groups — e.g., Hamas and Jemaah Islamiyah — had
their roots in the early 1990s. The start of the 1990s marked a real shift in the dominant
influence of transnational terrorism owing to at least three developments: (i) the end of
considerable state-sponsorship of terrorism, (ii) the demise of many left-wing European
groups, and (iii) the forging of the loose global network by al-Qaida. With the end of the
Cold War, terrorists found less sponsorship as state surrogates. A few states in North
Africa and the Middle East still sponsored terrorism. The end of many communist regimes
meant that left-wing groups had a less sympathetic public. These factors shifted the
dominant force in transnational terrorism to the fundamentalists, who engaged in fewer
incidents with greater bloodshed (Enders and Sandler 2000). The stationing of US and
European troops in Muslim countries also fueled the mobilization of Islamic fundamentalist
terrorists.
In summary, we anticipate at least four potential target regimes. The first regime
begins somewhere between 1968 to 1970 and involves the rise of modern transnational
terrorism. As the dominant terrorist influence in the 1970s, the Palestinian terrorists
pushed for a homeland and an end to Israeli occupation. They favored attacks on officials
to air their frustration and gain publicity. Moreover, the Palestinian terrorists limited
attacks against private parties in hopes of gaining global sympathy. The latter was also
true of the second most influential group — the leftist terrorists. A second target regime
concerns the introduction of technological barriers in 1973, which differentially protected
the four target groups. These security measures influenced the marginal costs associated
with attacks against alternative target groups, thereby making less (more) protected
targets more (less) attractive to terrorists. The third regime ensues around 1979 with
state-sponsorship, while the fourth regime begins around 1990 with the growing dominance
of the fundamentalist terrorists. State-sponsorship resulted in larger scale, better planned
missions so that aborted and unsuccessful missions decreased, especially against softer
8
target groups, such as businesses and private parties. Fundamentalist terrorists are
interested in well-planned missions that target the “infidels.” These terrorists are less
concern about a constituency, so that private parties are legitimate targets.
Theoretical Model
As a conceptual foundation, we use a simple terrorist-choice model in which a
terrorist group allocates its resources, R, in a giving period among four target types,
denoted by Ti, i = 1, 2, 3, 4. In particular, the terrorist group chooses among targets to
maximize its expected utility or payoff,
U = U(T1, . . . , T4), (1)
subject to its resource constraint,
4∑i=1
CiTi = R. (2)
In (2), Ci is the per-incident expected cost of attacking target type i and Ti is the
continuous number of attacks on target type i. For simplicity, we assume that the average
cost per incident is constant and not dependent on the number of attacks. If, however, Ci
is not constant so that Ci = Ci(Ti), then the marginal cost of attacking target i (C ′i) would
replace Ci in the solution presented below. Each Ci is influenced, in part, by the
countermeasures or protection taken by either the government or the target itself. Greater
protection or hardening raises Ci, thereby making the attack more difficult for the
terrorists. Greater state-sponsorship will increase terrorist resources, R, and will give rise
to an increase in all attacks, which was true of transnational terrorist attacks in the 1980s.
If the state-sponsor favors one type of target (say, the military), then there will be
relatively more incidents against that target class.
9
The terrorists derive a payoff from attacking alternative targets, since such attacks
put more costs on the government. If these costs are sufficiently great, then the
government may concede to some of the terrorists’ political demands. More attacks also
provide the terrorists with more publicity for their cause, which also augments their payoff
or utility. Some targets — e.g., official targets — may have a larger marginal utility or
payoff than other targets owing to their symbolic nature.
The first-order conditions (FOCs) associated with an interior solution for this
continuous choice-theoretic problem is:
U1
C1
= · · · = U4
C4
, (3)
where Ui is the marginal expected utility associated with attacking target i. In addition,
the resource constraint in (2) must be satisfied as part of the FOCs. Equation (3) indicates
that resources are allocated among targets so that the marginal gain per dollar spent is
equated over all target types.
If, say, C1 goes up relative to the other Ci’s based on added protection taken by the
first target class, then the terrorists will reduce the number of attacks against target type
1. In so doing, they will increase the number of attacks on the now relatively cheaper other
types of targets. Thus, as countries secured their embassies, official buildings, and their
official personnel, the marginal costs of attacking officials rose in the latter 1970s and
during the 1980s, thereby shifting terrorist incidents to other target groups. Over time, the
least organized group — private parties — came to have the lowest marginal attack costs
and attracted greater attention by the terrorists.
As the marginal expected utility attached to one type of target rises, the terrorists
will redirect their attacks to this more valuable prize. Therefore, if the government takes
actions that enrage the terrorists, then the terrorists may increase the proportion of attacks
against officials or the military even if they are well-guarded. An increase in marginal gains
10
or a decrease in marginal costs for a target class will augment the share of attacks directed
at that particular target class. Corner solutions are possible where Ti = 0 for some i if the
terrorists either view the marginal gains as too modest or the marginal costs as too great.
Any target not attacked would have a Ui
Cistrictly less than the other ratios for any
nonnegative Ti.
In our empirical exercise, we are aggregating over all transnational terrorist groups
so that the utility or preference function represents some average taste pattern, subject to
change over time. As the fundamentalist terrorists became a more dominant influence over
the leftist terrorists, we would anticipate a higher marginal utility being placed on
targeting private parties. This became particularly true after Osama bin Laden issued his
fatwa in February 1998 against Americans, even women and children. This fatwa increased
the relative marginal gain of attacks against private parties, thereby making this target
class more desirable. Consequently, attacks against private parties may increase over time
not only because they became softer targets as public and private security measures
protected the other three target types, but also because transnational terrorists
increasingly favored private parties as targets. This latter targeting bias was bolstered by
the reduced influence of leftist terrorists in the 1990s.
Data
Our estimates are based on transnational terrorist event data, drawn from
International Terrorism: Attributes of Terrorist Events (ITERATE). This data set was
originally compiled by Mickolus (1982) for 1968–1977 and subsequently updated through
2007 by Mickolus et al. (2008). ITERATE is based on published reports of transnational
terrorist incidents found in print and electronic media. ITERATE currently contains
13,087 terrorist incidents, listed under various modes of attack.
ITERATE’s COMMON file records numerous general observations about each
11

terrorist event including the incident type, country location, and the number of deaths.
Incident types are broken down to myriad categories. For events without a fully specified
date (either a missing month or day), a modal date is assigned — i.e., 15th of the month
for missing day and June for a missing month. Almost all of the incidents have a specified
date. We combine incident types into three general event type — specifically, hostage
incidents, bombings, and assassinations. Hostage incidents include kidnappings, barricade
and hostage seizures, skyjackings, and nonaerial hijackings (i.e., boats, trains, and buses).
Bombings include letter bombs, incendiary bombs, explosive bombs, armed attacks with
missiles, armed attacks with mortars and bazookas, car bombings, suicide car bombings,
and other suicide bombings. Finally, assassinations are included. We left out some minor
categories — sabotage, exotic pollution, and nuclear-related weapons attack — because
there were only a handful of such incidents. In addition, we excluded arms smuggling and
break-in of facilities, because these incidents were not tied to specific terrorist attacks.
Finally, we did not include threats (i.e., the promise of a future attack) or hoaxes (i.e., the
false claim of a past attack) because such events are impervious to added security, the
subject of this study.
The terrorism time series for our three classes of incidents are combined into daily,
monthly, and quarterly time series for each of the four target types — Officials, Military,
Business, and Private Parties — based on the ITERATE variables for the dates and the
“type of immediate victim.” For the Officials and Military attacks series, we combine
incidents directed against host and foreign government (immediate victim types 1 and 2)
and incidents directed against host and foreign military (types 3 and 4). Business targets
consist of just type 5 — corporate targets. Finally, the Private Parties series encompasses
prominent opinion leaders and private citizens in general — type 6 and 7, respectively. We
left out terrorists as an immediate victim since their safety is of no concern. We employ a
mix of the daily, monthly, and quarterly aggregations in the figures and results reported
here.
12

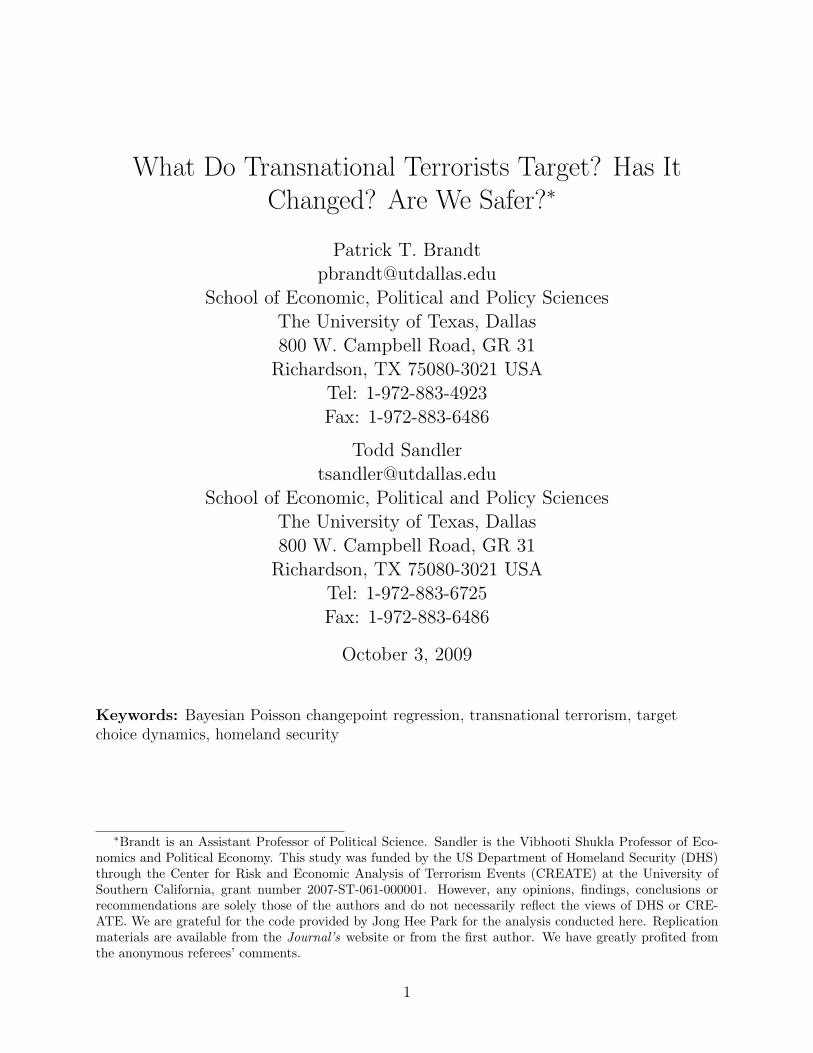
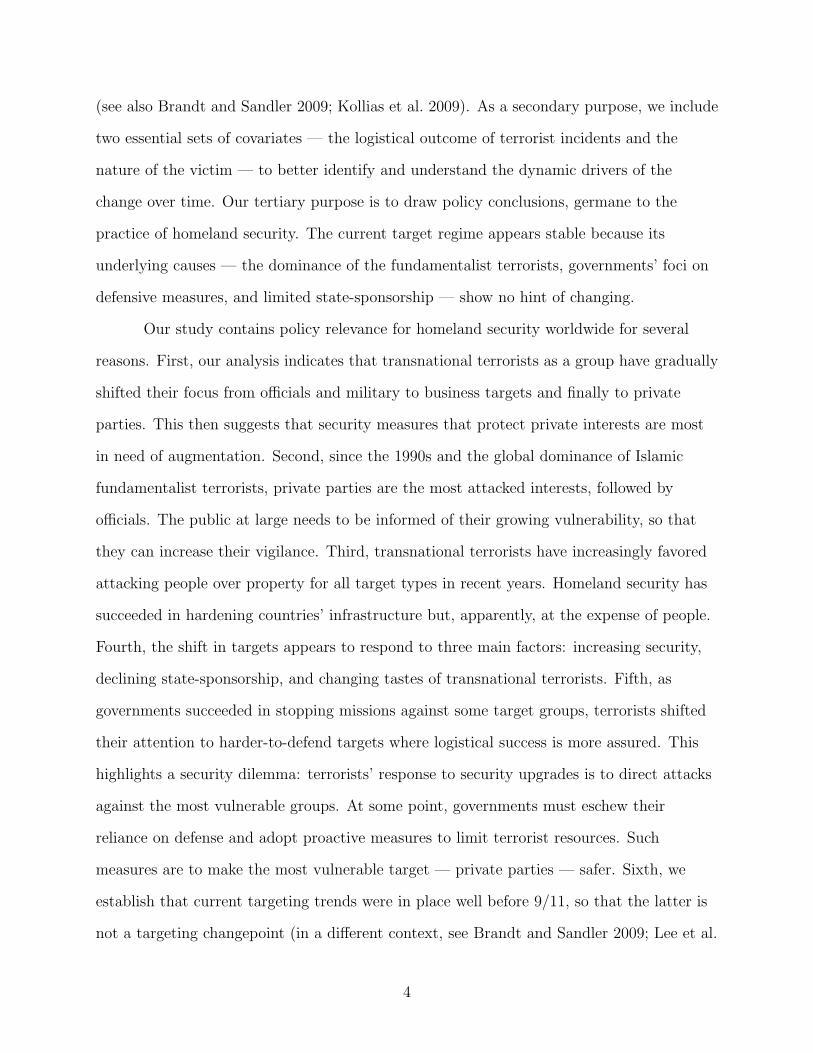
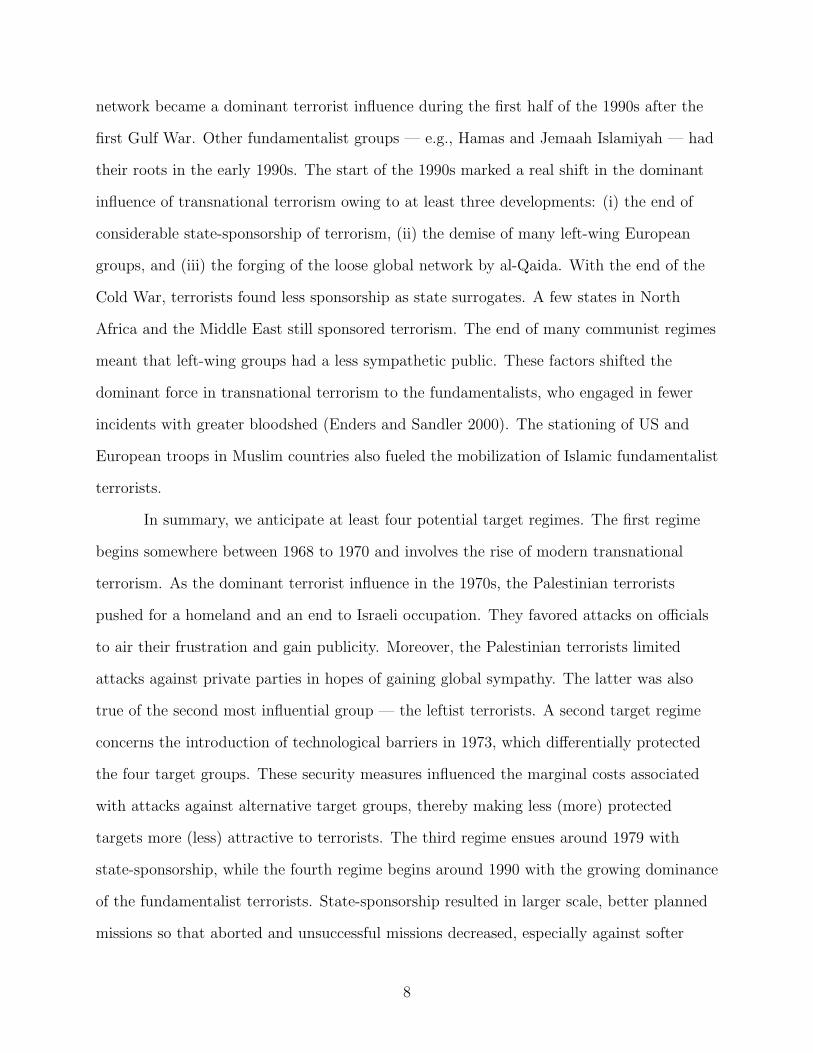
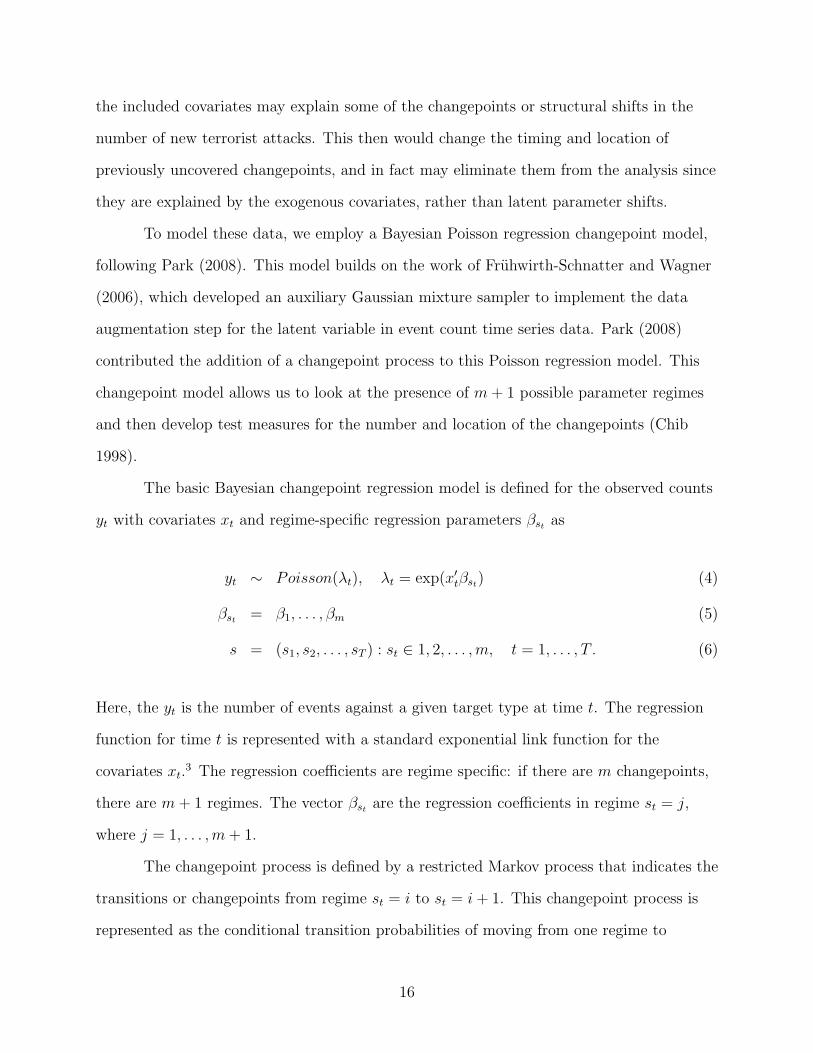
Figure 1 displays the cumulative number of incidents against each of the four target
classes using daily observations. At the start of the modern era of terrorism, most attacks
were against official targets, motivated initially by the defeat of the Arab countries by the
Israelis in the late 1960s and early 1970s. Business targets were second in popularity at the
start of the modern era of transnational terrorism. By the mid-1980s, private parties,
however, surpassed business targets, as the latter took protective actions. In the early
1990s, private parties even surpassed officials as the most attacked group. This last
crossover corresponds to the waning influence of the left-wing terrorists, the dominance of
the fundamentalist terrorists, and the reduction in state-sponsorship. The gap between
private-party and official attacks has grown after 9/11 with the augmentation of homeland
security. This progression is driven by the hardening of official and business targets and the
increasing dominance of the fundamentalists. Although Figure 1 is illustrative, the
cumulative incident counts neither indicate directly the changes in arrival rates (i.e.,
changepoints), nor calibrate the average number of attacks in the various target regimes.
We determine these things in the next section.
[Figure 1 about here.]
We also rely on two sets of covariates to understand better the induced changes in
terrorists’ target selection over time (coded at the monthly aggregation of the data). A
first set of covariates is constructed from the “nature of victim” variable in ITERATE that
identifies whether the attack only involved property or involved people. Incidents that
involved people and property are included with people attacks. The nature of victim is
infrequently unknown.1 Because property is easier to harden than people, we anticipate
that heightened security will shift attacks within each target class from property to people.
This shift is also affected by changes in state-sponsorship and terrorists’ tastes as the
marginal gain associated with people attacks began to increase relative to property attacks
in the 1980s and beyond. State-sponsors and fundamentalist terrorists favored greater
carnage, so that people attacks are anticipated to outnumber property attacks for each
13

target type starting in the latter 1980s. We code separate covariates for the number of
attacks on people, property, and unknown victims.
The second set of covariates concerns logistical success as to whether the terrorists
completed their missions as planned — e.g., they secured one or more hostages in a
kidnapping or they planted a bomb that subsequently exploded. From this covariate’s
three subcategories — mission aborted, mission stopped by authority, or mission completed
as planned — we code three separate variables. We anticipate seeing more missions
stopped for target classes receiving enhanced security - especially, officials and the military.
In recent years, more missions against people rather than property should be completed as
planned for all target types owing to relative cost considerations as property was hardened.
Finally, a large portion of missions against private individuals should be completed as
planned over time as their vulnerability remains high.2
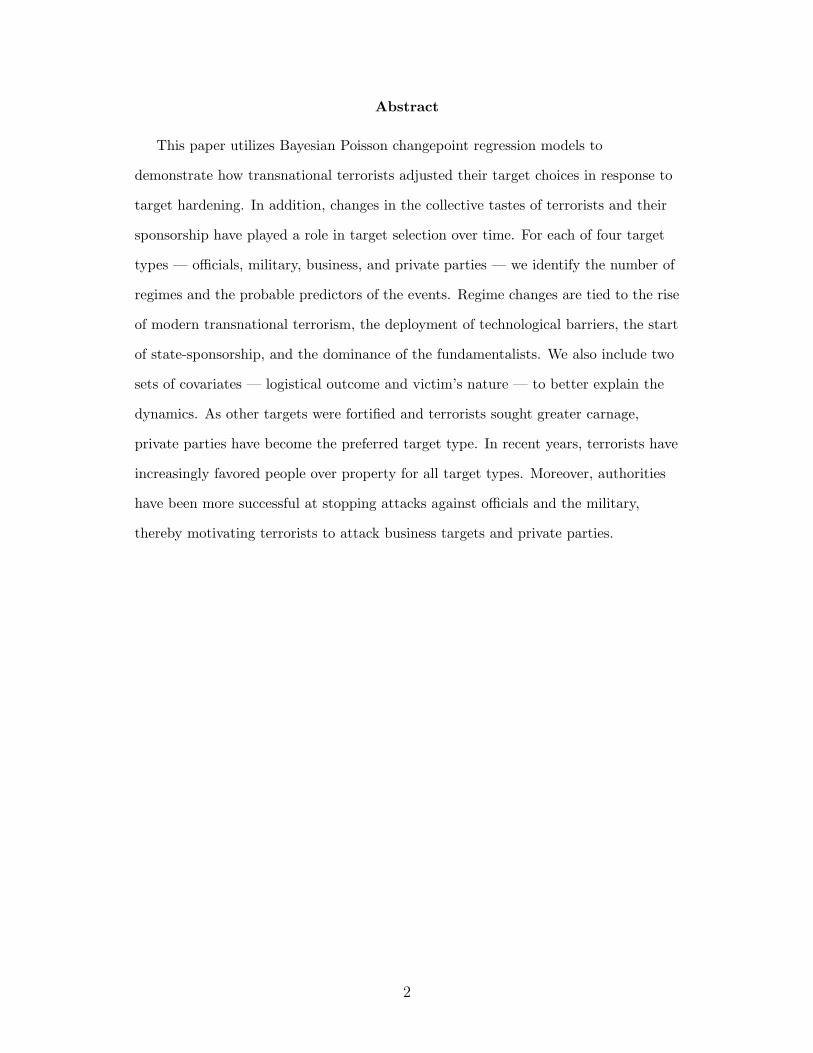
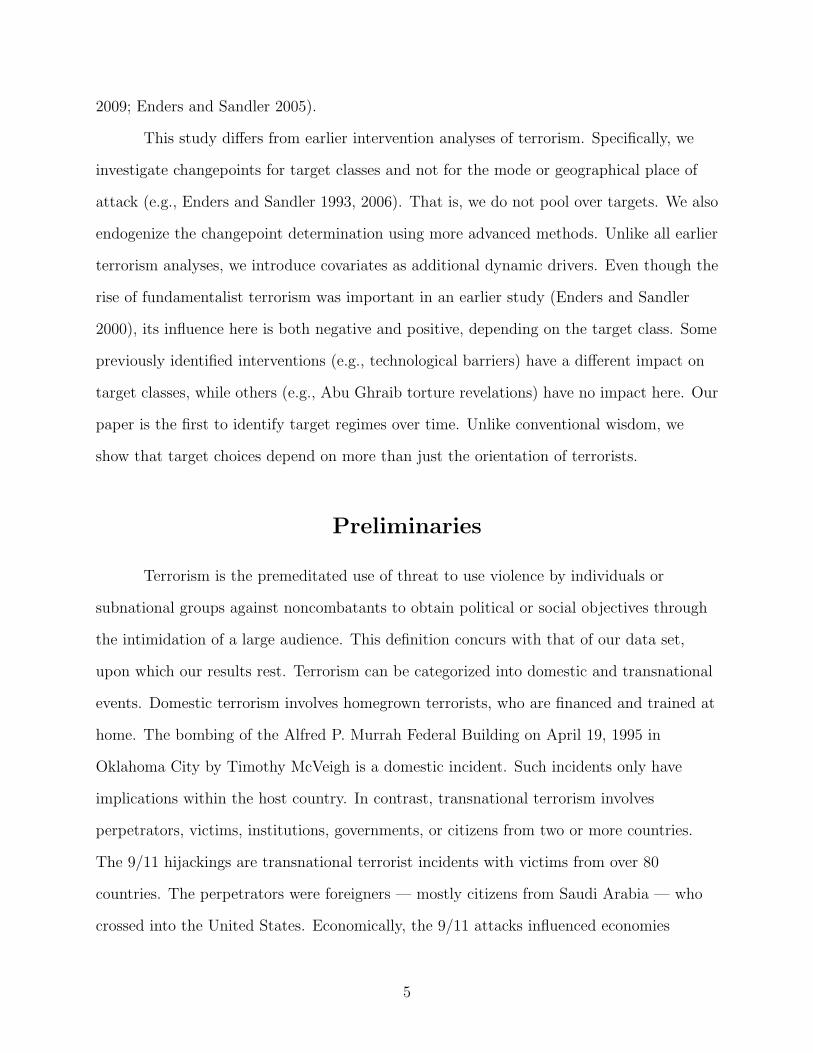
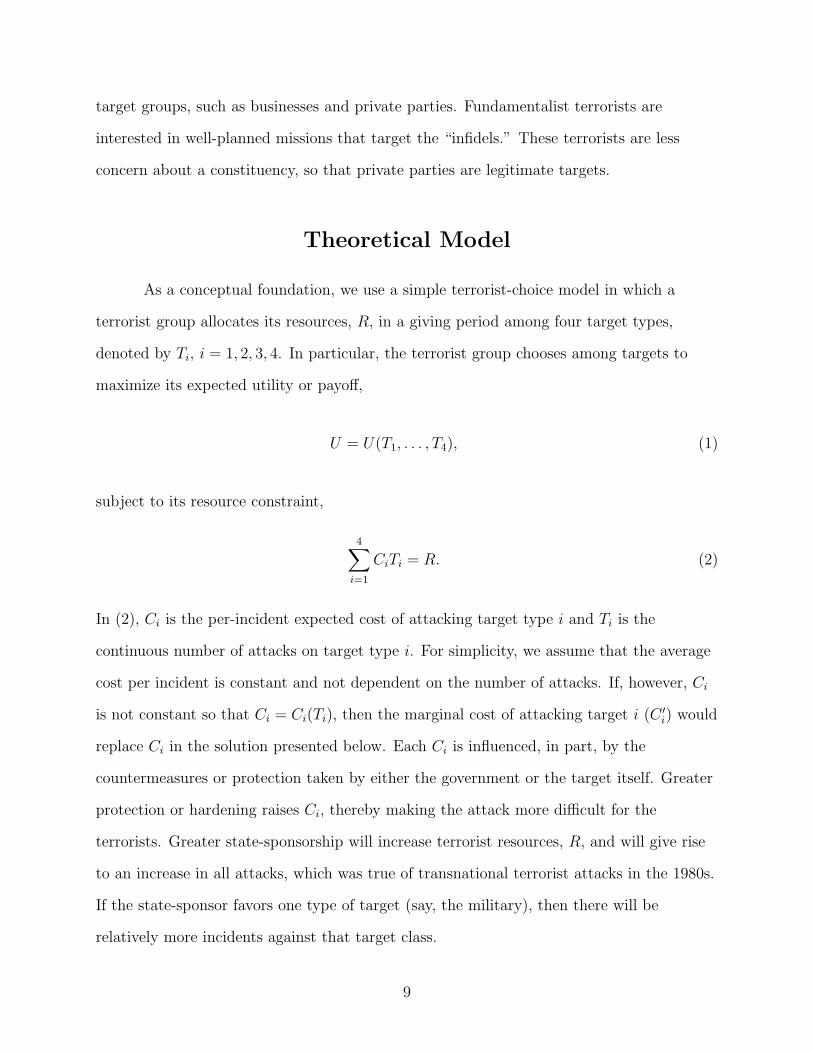
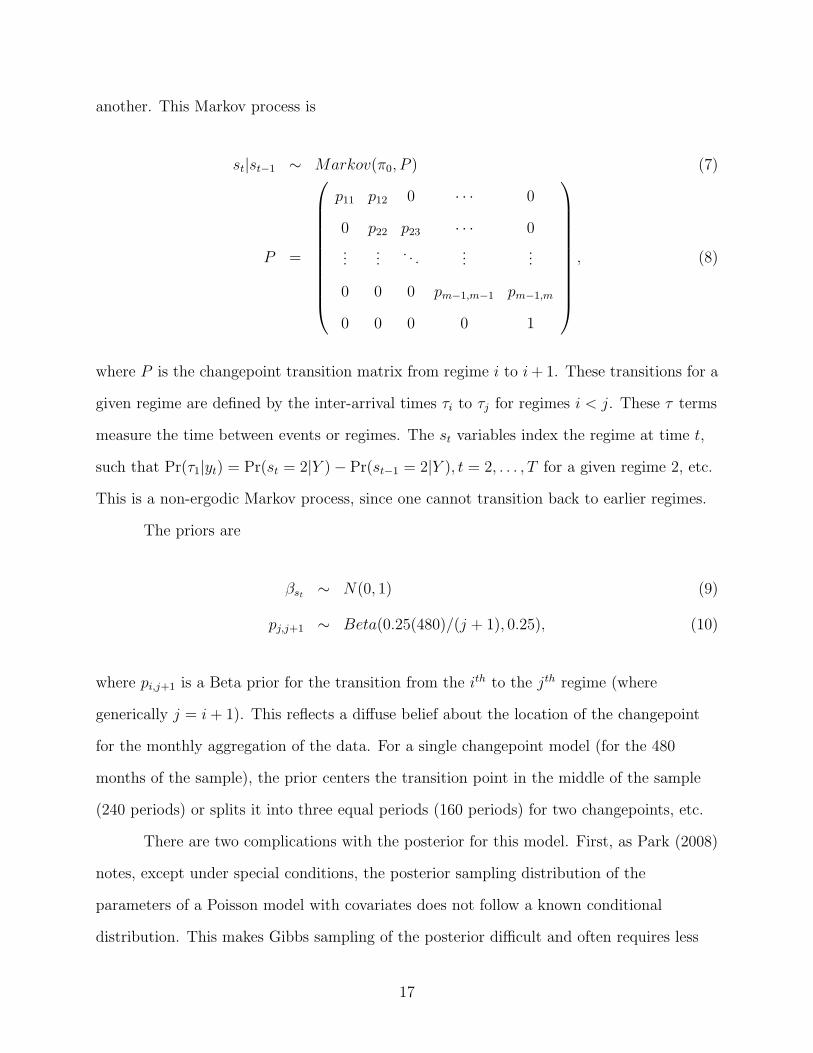
In Figure 2, each of the four rows corresponds to the target classes, while the three
columns correspond to the logistical success categories. In each panel, we display attacks
against either property, people, or unknown victims. For a given row, the proportion of
attacks at any point of time for the nine time series in the three panels adds to 100
percent. If, therefore, there are no aborted or stopped attacks for official targets, then the
proportion of completed attacks against official people and property must sum to 100
percent, assuming no unknown victims. If, however, the share of aborted and stopped
attacks against officials are together 20 percent of the total, then the share of completed
attacks against official people and property must equal 80 percent. To better display the
trends, we filter these percentages or shares using a quarterly seasonal-trend loess
decomposition (Cleveland et al. 1990). There are a number of interesting trends. First,
there are almost no aborted attacks after the start of the 1990s, indicating greater
determination and planning by terrorists in recent years. Second, most stopped attacks
involve official and military targets, which are receiving the most security enhancement.
Third, after 9/11, successful terrorist missions are mainly against people rather than
14

property. This is true for all four target types and represents a real downside to homeland
security. Fourth, almost all private party attacks are now against people, the hardest
target to protect. Fifth, in recent years, authorities have been better able to stop people
attacks for officials and the military, and property attacks for business and official targets.
[Figure 2 about here.]
Bayesian Poisson Changepoint Models
To empirically test the effects of logistical success and victim type on the number of
attacks for a specific type of target, we need a model that satisfies a couple of desiderata.
First, the number of terrorist attacks on a given target is an event count variable. So we
need a model for event count data. Second, previous research has shown that there are
structural changes or breaks in the number of terrorist attacks over time (Brandt and
Sandler 2009; Enders and Sandler 2005). Thus, we need to employ a model that can
estimate changepoints and regression effects simultaneously. Previous work did not model
terrorist event data series recognizing both of these desiderata.
The use of event count models with changepoints and covariates are critical because
of our expectations about how these specification decisions will affect our conclusions.
First, our prior belief is that while past analyses, focused on mode of attack, have found
multiple changepoints related to intended and unintended policy choices, we may see fewer
changepoints in this analysis. This is because aggregating across targets is very different
than aggregating across modes of attack — the latter being much more responsive to policy
innovations and changes. For example, the adoption of metal detectors in airports is known
to have had a pronounced effect on skyjackings and other attack modes; but such effects
operate differently across targets, owing to fewer substitution possibilities over the four
target types. Some target classes are differentially influenced by security enhancements —
e.g., metal detectors and cement barriers help officials the most. Second, it is possible that
15
the included covariates may explain some of the changepoints or structural shifts in the
number of new terrorist attacks. This then would change the timing and location of
previously uncovered changepoints, and in fact may eliminate them from the analysis since
they are explained by the exogenous covariates, rather than latent parameter shifts.
To model these data, we employ a Bayesian Poisson regression changepoint model,
following Park (2008). This model builds on the work of Fruhwirth-Schnatter and Wagner
(2006), which developed an auxiliary Gaussian mixture sampler to implement the data
augmentation step for the latent variable in event count time series data. Park (2008)
contributed the addition of a changepoint process to this Poisson regression model. This
changepoint model allows us to look at the presence of m+ 1 possible parameter regimes
and then develop test measures for the number and location of the changepoints (Chib
1998).
The basic Bayesian changepoint regression model is defined for the observed counts
yt with covariates xt and regime-specific regression parameters βst as
yt ∼ Poisson(λt), λt = exp(x′tβst) (4)
βst = β1, . . . , βm (5)
s = (s1, s2, . . . , sT ) : st ∈ 1, 2, . . . ,m, t = 1, . . . , T . (6)
Here, the yt is the number of events against a given target type at time t. The regression
function for time t is represented with a standard exponential link function for the
covariates xt.3 The regression coefficients are regime specific: if there are m changepoints,
there are m+ 1 regimes. The vector βst are the regression coefficients in regime st = j,
where j = 1, . . . ,m+ 1.
The changepoint process is defined by a restricted Markov process that indicates the
transitions or changepoints from regime st = i to st = i+ 1. This changepoint process is
represented as the conditional transition probabilities of moving from one regime to
16
another. This Markov process is
st|st−1 ∼ Markov(π0, P ) (7)
P =
p11 p12 0 · · · 0
0 p22 p23 · · · 0
......
. . ....
...
0 0 0 pm−1,m−1 pm−1,m
0 0 0 0 1
, (8)
where P is the changepoint transition matrix from regime i to i+ 1. These transitions for a
given regime are defined by the inter-arrival times τi to τj for regimes i < j. These τ terms
measure the time between events or regimes. The st variables index the regime at time t,
such that Pr(τ1|yt) = Pr(st = 2|Y )− Pr(st−1 = 2|Y ), t = 2, . . . , T for a given regime 2, etc.
This is a non-ergodic Markov process, since one cannot transition back to earlier regimes.
The priors are
βst ∼ N(0, 1) (9)
pj,j+1 ∼ Beta(0.25(480)/(j + 1), 0.25), (10)
where pi,j+1 is a Beta prior for the transition from the ith to the jth regime (where
generically j = i+ 1). This reflects a diffuse belief about the location of the changepoint
for the monthly aggregation of the data. For a single changepoint model (for the 480
months of the sample), the prior centers the transition point in the middle of the sample
(240 periods) or splits it into three equal periods (160 periods) for two changepoints, etc.
There are two complications with the posterior for this model. First, as Park (2008)
notes, except under special conditions, the posterior sampling distribution of the
parameters of a Poisson model with covariates does not follow a known conditional
distribution. This makes Gibbs sampling of the posterior difficult and often requires less
17

efficient Metropolis-Hastings sampling. Second, the presence of the changepoint
specification further complicates the Bayesian posterior sampling and choice of the number
of changepoints. These problems can be addressed using an approximation for the former,
and a series of Metropolis-Hastings steps for models with different numbers of
changepoints. The approximation for the Poisson regression (conditional on the
changepoints) is based on a highly accurate Gaussian approximation (see
Fruhwirth-Schnatter and Wagner 2006) of the log transform of the inter-arrival times of the
Poisson events. This approximation generates a regression with log exponential error terms
(which are easily approximated by a mixture of Gaussian terms).4
The second problem — modeling and selecting the number of changepoints — is
addressed by Park (2008) who implements a changepoint model based on Chib (1998). To
select the optimal number of changepoints, posterior log marginal data densities are
computed and then used to form log Bayes factors, which are the differences in the log
marginal densities of the two models. Evidence of a model fitting better is that it has a
positive log Bayes factor greater than 1.1 on a natural logarithm scale.
In the next two sections, we report the results from the Bayesian estimation of this
model. The Markov chain Monte Carlo algorithm that we used to sample from the
posterior was run for 10000 iterations. We discarded the first 2000 iterations as a burn-in.
All subsequent results are based on a sample of 8000 draws from the posterior distribution.
The estimated Markov chains pass standard convergence diagnostics.
Testing for the Number and Location of Changepoints
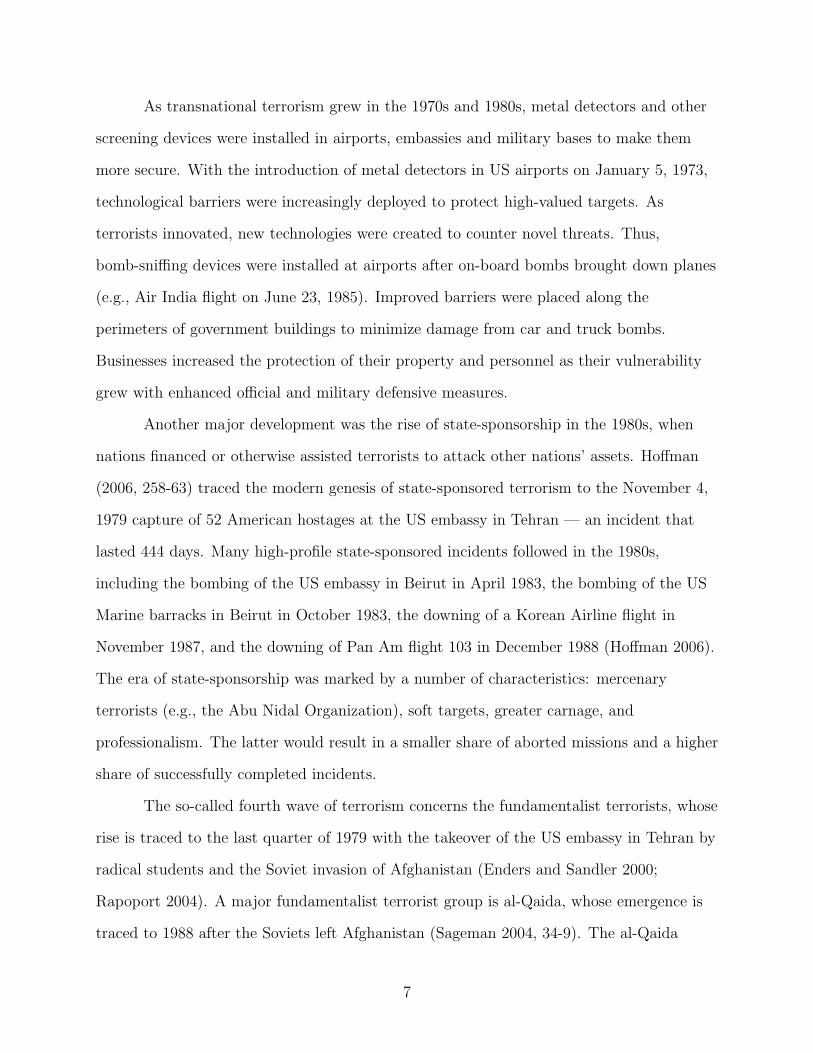
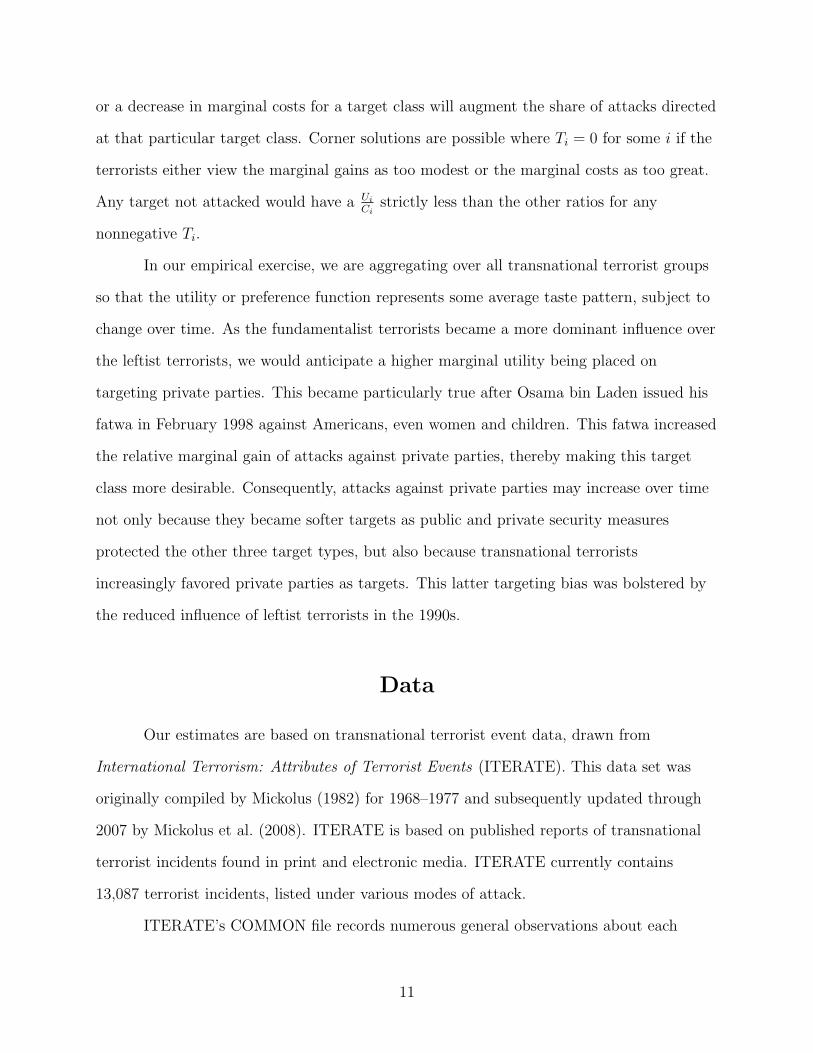
Table 1 presents the log Bayes factors comparing models with one to four
changepoints. Each cell corresponds to a comparison of the number of changepoints in the
first entry of the row to the number of alternative changepoints in a column. So for the
first row in the Officials model, the log Bayes factor for a one versus two changepoint
18

model is -6.68. Since this is negative, it is evidence against the one changepoint model in
favor of the two changepoint model. A log Bayes factor value greater than log(10) = 2.3 is
considered “strong evidence” for one model over another (Kass and Raftery 1995). The
highlighted rows show the models with the “best” fit (i.e., those for which the Bayes factor
for that model is strongly positive, thus meaning it outranks the others). There is evidence
for two changepoints in the Officials and Business series, and three changepoints for the
Military and Private Parties series.
[Table 1 about here.]
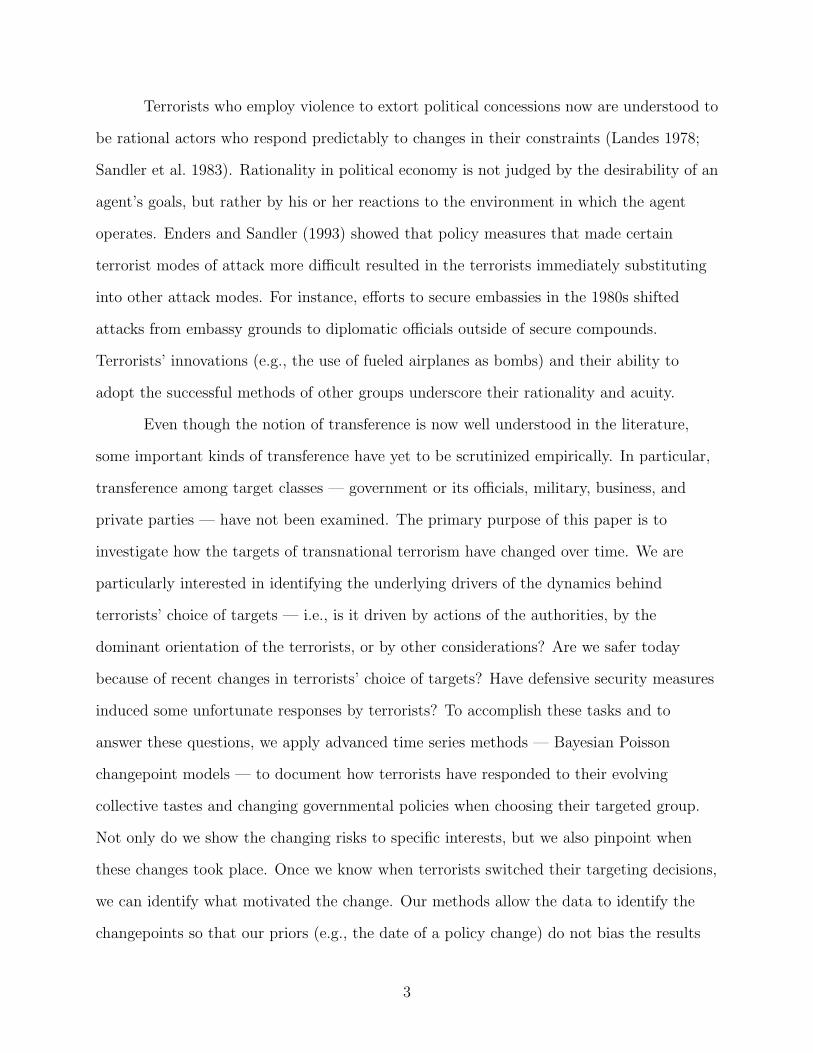
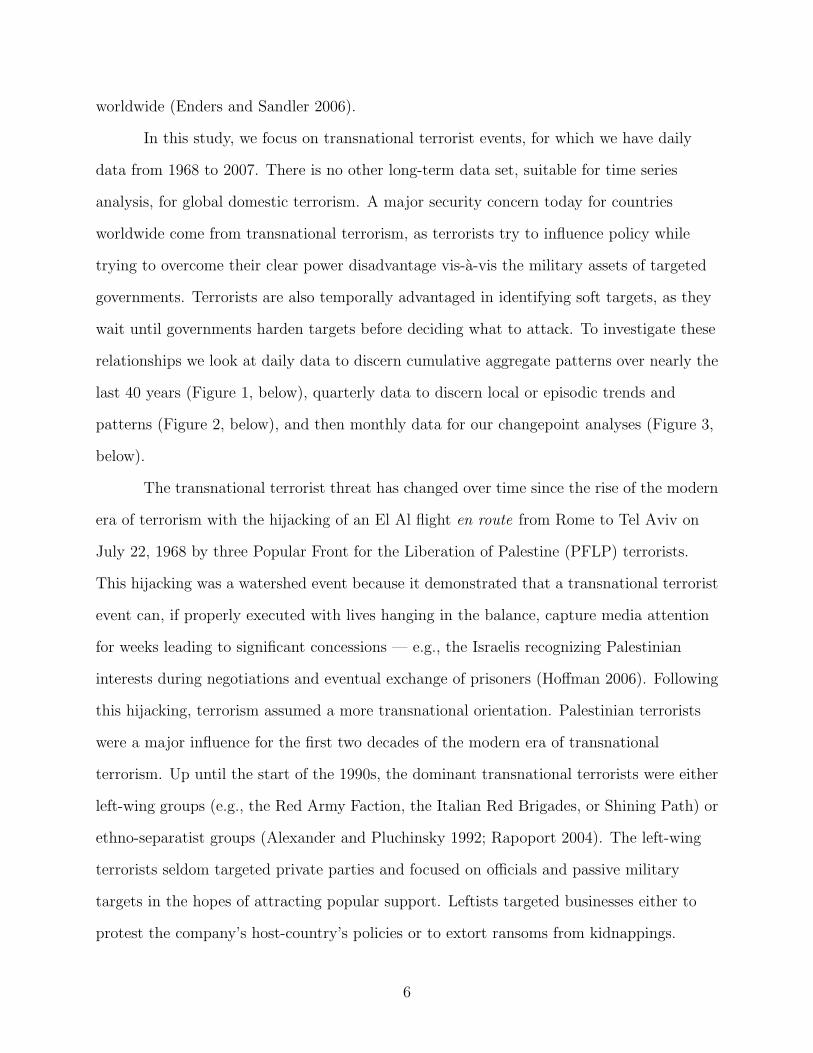
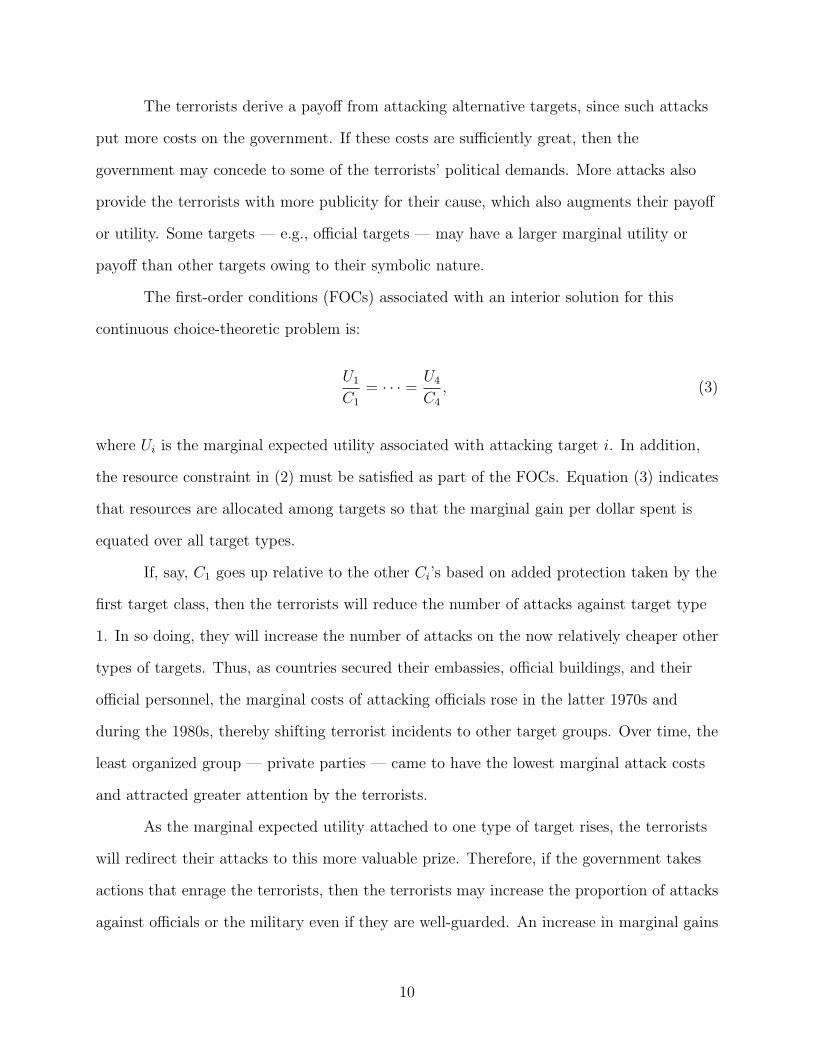
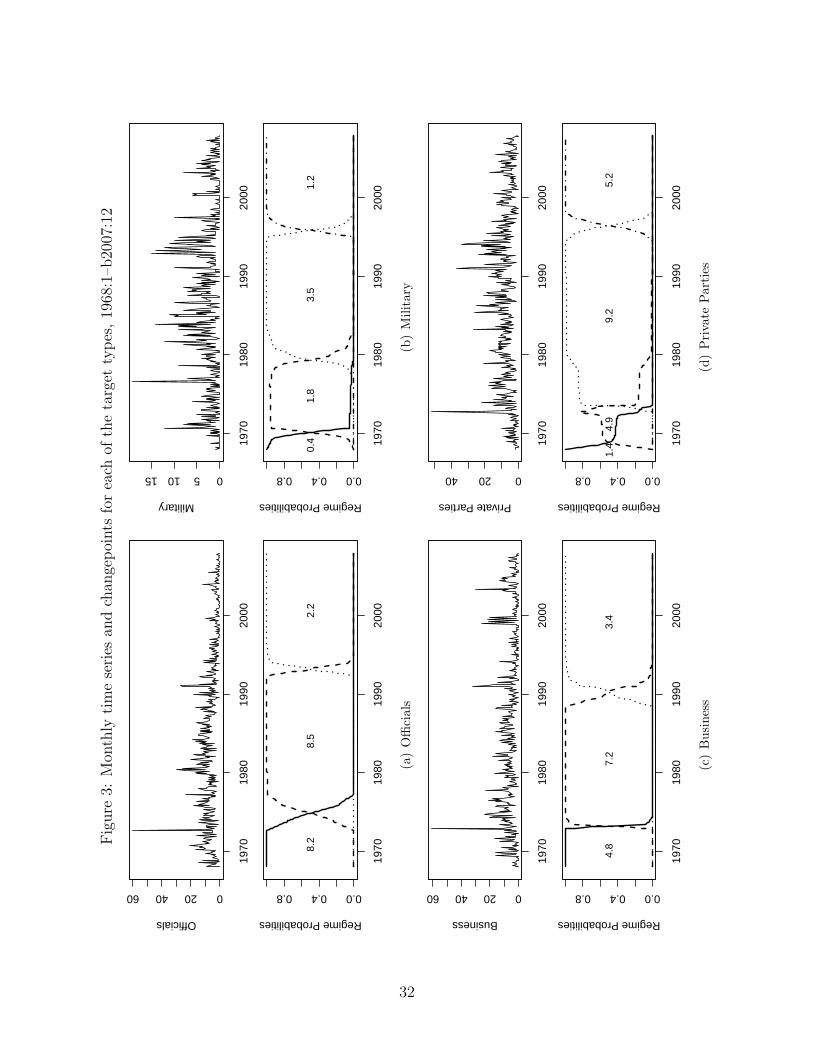
The panels in Figure 3 plot the monthly data series and the regime probabilities.
For each data series variable in a subfigure, the top panel is the monthly raw event count
data and the bottom panel presents the regime probabilities using a solid line for the first
regime, a dashed line for the second, dotted line for the third, and a dot-dash for the
fourth. The numbers in the middle of each regime of the second panel are the average
number of events per month in each of the regimes.
[Figure 3 about here.]
The panels in Figure 3(a) show two changepoints with modal dates of October 1974
and March 1993 for the Officials series. The mean number of attacks on officials in the first
regime for 1968:1–1974:10 is 8.2 events per month. After the changepoint, the mean
increases slightly to 8.5 attacks on officials per month. The second regime ends in March
1993 and is followed by a period where the number of attacks on officials plummets to 2.2
per month. This final regime is coterminous with the end of the Cold War, and the
emerging dominance of fundamentalists. Transnational terrorism fell precipitously
following the Cold War (Enders and Sandler 2000); Islamic fundamentalist terrorists are
more interested in murdering private parties. This changepoint is rather sharply estimated
with a density that is tightly clustered in the early to mid-1990s.
19

The three changepoints for the Military series are presented in the panels of Figure
3(b). The modal dates for these changepoints are February 1970, May 1979, and November
1995. The first of these changepoints, marking the rise of modern terrorism, has a very low
number of average monthly attacks on military targets. This increases in the 1970–1979
regime to 1.8 events per month. It nearly doubles to 3.5 attacks per month on military
targets in the third regime from 1979–1995, a period of rising state-sponsorship of
terrorism and the birth and growing importance of Islamic terrorists. The final period
closely matches the period of fundamentalist dominance described earlier. All three of the
changepoints for this series have wide densities: there is a reasonable range of several years
around the timing of each of these estimates.
Figure 3(c) shows that the two changepoints for the Business series are March 1973
and April 1990 (5 months after the fall of the Berlin Wall). The first changepoint
corresponds to heightened airport security and is very sharply estimated. Prior to March
1973, there were 4.8 attacks per month on business targets. After March 1973, this jumps
to 7.2 attacks per month as leftists targeted soft business targets. The last changepoint
separates the regime of fundamentalist dominance from earlier periods. Although this is a
period where the number of attacks on business targets drops from 7.2 to 3.4 events per
month, this decline is, in part, explained by the fall in transnational terrorism following the
Cold War. Interestingly, business attacks do not fall as much as attacks on officals or the
military. The pattern in the middle panel is consistent with the transition from leftist and
state-sponsored terrorism to the current fundamentalist regime where softest people targets
are sought.
Finally, Figure 3(d) displays the regimes for the Private Parties series. The first
regime, in November 1968, marks the beginning of modern transnational terrorism. The
second, after June 1973, corresponds almost exactly to the provision of metal detectors in
airports. This defines the start of a regime where terrorists face additional technological
hurdles. Note further than the density for the location of this chanegpoint is very tightly
20
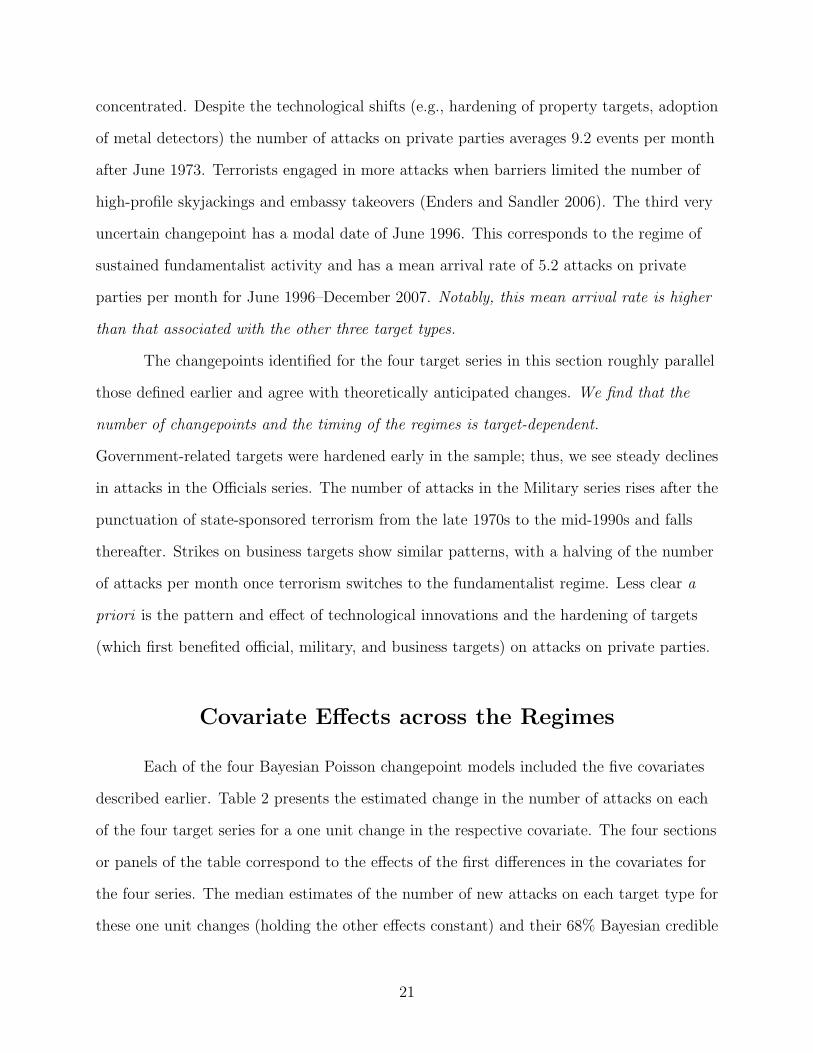
concentrated. Despite the technological shifts (e.g., hardening of property targets, adoption
of metal detectors) the number of attacks on private parties averages 9.2 events per month
after June 1973. Terrorists engaged in more attacks when barriers limited the number of
high-profile skyjackings and embassy takeovers (Enders and Sandler 2006). The third very
uncertain changepoint has a modal date of June 1996. This corresponds to the regime of
sustained fundamentalist activity and has a mean arrival rate of 5.2 attacks on private
parties per month for June 1996–December 2007. Notably, this mean arrival rate is higher
than that associated with the other three target types.
The changepoints identified for the four target series in this section roughly parallel
those defined earlier and agree with theoretically anticipated changes. We find that the
number of changepoints and the timing of the regimes is target-dependent.
Government-related targets were hardened early in the sample; thus, we see steady declines
in attacks in the Officials series. The number of attacks in the Military series rises after the
punctuation of state-sponsored terrorism from the late 1970s to the mid-1990s and falls
thereafter. Strikes on business targets show similar patterns, with a halving of the number
of attacks per month once terrorism switches to the fundamentalist regime. Less clear a
priori is the pattern and effect of technological innovations and the hardening of targets
(which first benefited official, military, and business targets) on attacks on private parties.
Covariate Effects across the Regimes
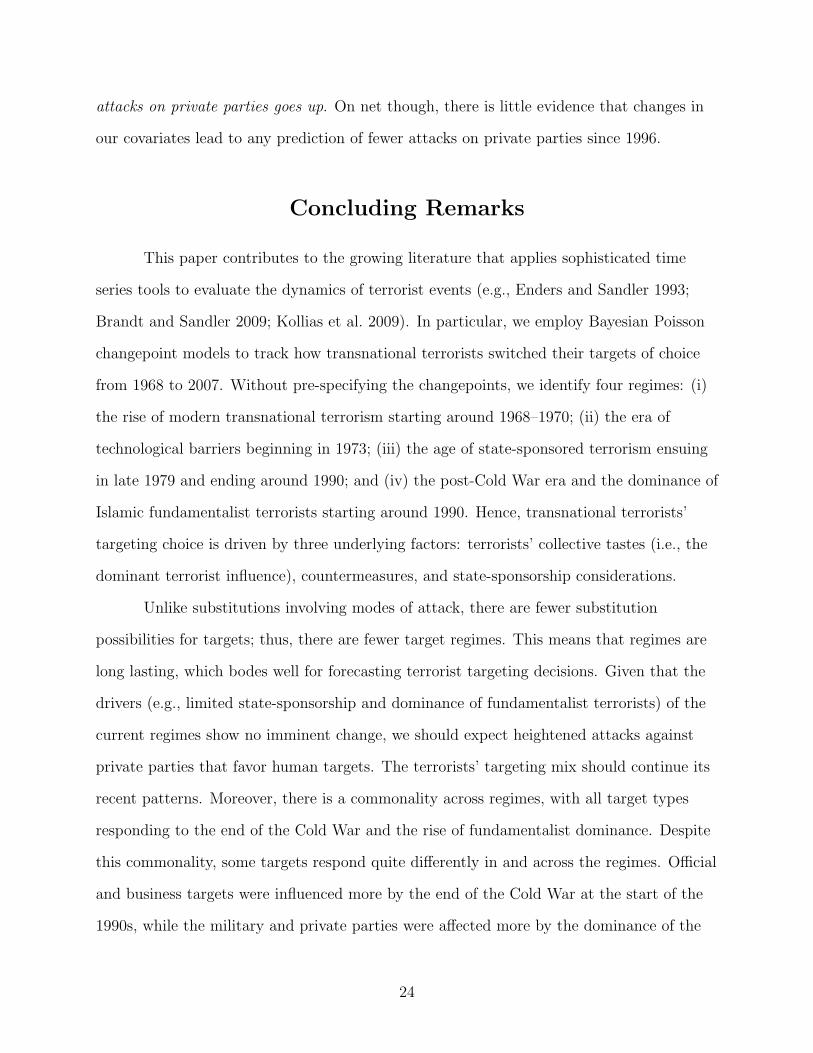
Each of the four Bayesian Poisson changepoint models included the five covariates
described earlier. Table 2 presents the estimated change in the number of attacks on each
of the four target series for a one unit change in the respective covariate. The four sections
or panels of the table correspond to the effects of the first differences in the covariates for
the four series. The median estimates of the number of new attacks on each target type for
these one unit changes (holding the other effects constant) and their 68% Bayesian credible
21

intervals are reported for each regime (in the columns).5 The estimated first differences in
italics have 68% confidence regsion that do not include zero.
[Table 2 about here.]
The effects of the five covariates on the Officials series vary across the three regimes.
The number of completed attacks has no effect on attacks in the first regime (68% CI,
[-0.39, 2.61]), but generates 0.49 more attacks in the second regime (68% CI, [0.06,0.92]).
The latter is a possible demonstration effect where successful attacks on officials beget
more such attacks. Attacks on property also have an effect on the number of attacks on
officials in the first regime: each attack on property leads to 0.57 more attacks on officials
(68% CI, [0.13, 1.05]), but a property attack in the later regimes, leads to no more attacks
on officials.
The second panel of Table 2 shows the first differences estimates for the Military
series. Most of the estimates over the regimes are centered around zero — evidence that
few of the covariates play a role in explaining the number of attacks on military targets.
For the Military series, the only two covariates that have a substantive effect across the
four regimes are the number of completed attacks in the first regime from 1968–1970 and
the number of aborted attacks in the third regime from 1979–1995. Each completed attack
generates 0.57 more attacks on military targets (68% CI [0.12, 1.07]) in the first regime and
each aborted attack generates 0.56 more attacks in the third regime (68% CI [0.23, 0.89]).
With respect to the impacts of one unit covariate changes on the number of attacks
on Business targets series, the third panel of Table 2 shows that aborted attacks lead to
1.26 more attacks on business targets in the first regime, no additional attacks in the
second regime, and 1.64 more attacks in the third regime. Thus, the effects of the logistical
outcomes of the events are regime specific with aborted incidents generating attacks on
business targets prior to 1973 and after April 1990. Completed attacks generate more
attacks on business targets in the first and third regimes: we see 1.93 (68% CI [0.13, 4.62])
new attacks for each completed attack on business targets prior to 1973 and 0.88 (68% CI
22

[0.71, 1.04]) new attacks after April 1990. Terrorists behavior responded, in two of the
three regimes, consistent with the softness of the business targets.
Attacks on people prior to 1973 led to a decrease in the number of incidents directed
at business personnel. The reverse is seen in the post-1990 period when each new attack on
people generates 1.31 new attacks (68% CI [0.69, 1.93]). Attacks on property resulted in
more attacks in the 1973–1990 regime when each property attack gave rise to 1.62 more
attacks on business targets (68% CI [1.22, 2.08]). These findings support the increased
targeting of people over property, and correspond with the increased lethality of terrorism
since the 1990s.
Finally we look at the impacts of the covariates in the number of attacks on Private
Parties series, presented in the bottom panel of Table 2. In the first regime
(1968:1–1968:10), stopped attacks generate 0.85 additional attacks on private parties (68%
CI [0.09, 1.66]), during the start of the modern terrorism era. In the 1968–1973 regime,
aborted attacks generate 0.38 additional attacks on private parties (68% CI [0.26, 0.59]).
Property attacks in this period lead to 1.12 new attacks on private parties (68% CI [0.63,
1.54]). During the 1973–1996 regime, each attack on people generates 0.13 more such
attacks on private parties (68% CI [0.07, 0.27]), while attacks on property generate 0.95
additional property attacks on private parties (68% CI [0.75, 1.13]). This is evidence of the
shift from property attacks to people attacks since we see an increased effect of attacks on
property in the previous regime. By the final regime (post-1996:6), attacks on people
generate 0.72 additional attacks on private parties (68% CI [0.52, 0.91]), indicating a solid
shift to people attacks when the fundamentalists dominated. This is the only predictor
whose credible interval does not cover zero in the most recent regime for the private parties
analysis.
All of this is evidence that the lethality of terrorist attacks in the initial regime at
the start of modern terrorism gave way to a hardening of targets to which terrorists
adapted. However, recall from Figure 3(d) that after the 1973 changepoint, the number of
23
attacks on private parties goes up. On net though, there is little evidence that changes in
our covariates lead to any prediction of fewer attacks on private parties since 1996.
Concluding Remarks
This paper contributes to the growing literature that applies sophisticated time
series tools to evaluate the dynamics of terrorist events (e.g., Enders and Sandler 1993;
Brandt and Sandler 2009; Kollias et al. 2009). In particular, we employ Bayesian Poisson
changepoint models to track how transnational terrorists switched their targets of choice
from 1968 to 2007. Without pre-specifying the changepoints, we identify four regimes: (i)
the rise of modern transnational terrorism starting around 1968–1970; (ii) the era of
technological barriers beginning in 1973; (iii) the age of state-sponsored terrorism ensuing
in late 1979 and ending around 1990; and (iv) the post-Cold War era and the dominance of
Islamic fundamentalist terrorists starting around 1990. Hence, transnational terrorists’
targeting choice is driven by three underlying factors: terrorists’ collective tastes (i.e., the
dominant terrorist influence), countermeasures, and state-sponsorship considerations.
Unlike substitutions involving modes of attack, there are fewer substitution
possibilities for targets; thus, there are fewer target regimes. This means that regimes are
long lasting, which bodes well for forecasting terrorist targeting decisions. Given that the
drivers (e.g., limited state-sponsorship and dominance of fundamentalist terrorists) of the
current regimes show no imminent change, we should expect heightened attacks against
private parties that favor human targets. The terrorists’ targeting mix should continue its
recent patterns. Moreover, there is a commonality across regimes, with all target types
responding to the end of the Cold War and the rise of fundamentalist dominance. Despite
this commonality, some targets respond quite differently in and across the regimes. Official
and business targets were influenced more by the end of the Cold War at the start of the
1990s, while the military and private parties were affected more by the dominance of the
24
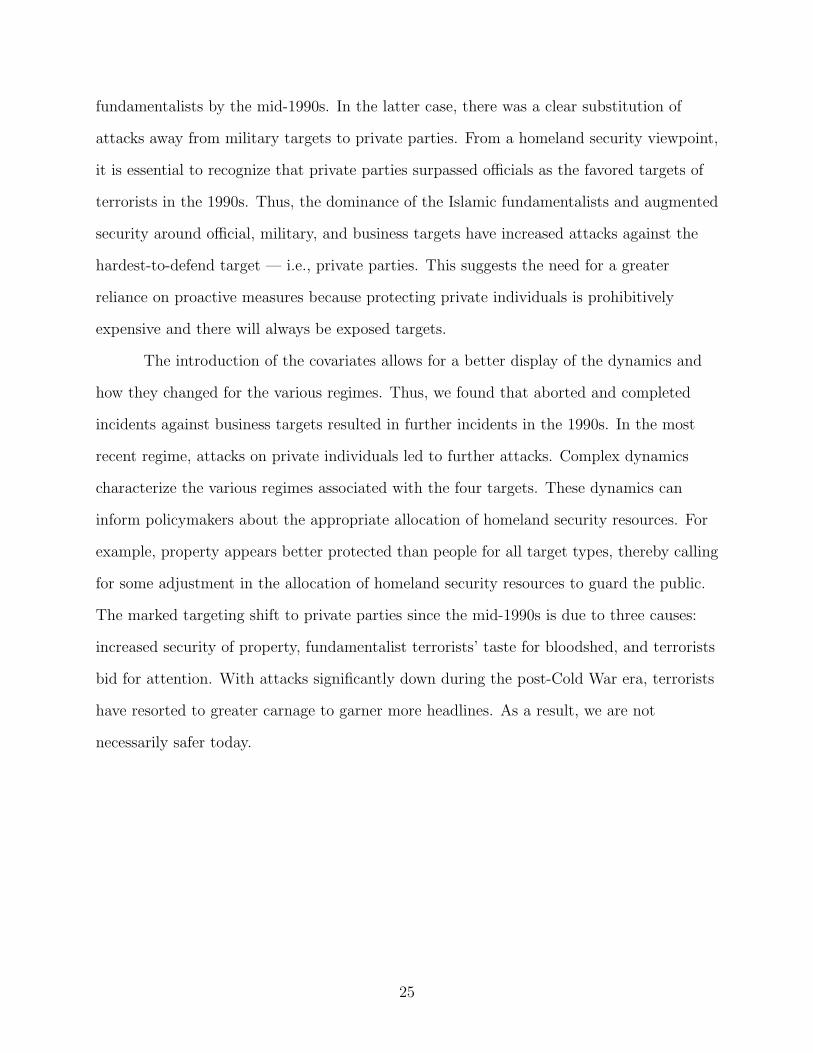
fundamentalists by the mid-1990s. In the latter case, there was a clear substitution of
attacks away from military targets to private parties. From a homeland security viewpoint,
it is essential to recognize that private parties surpassed officials as the favored targets of
terrorists in the 1990s. Thus, the dominance of the Islamic fundamentalists and augmented
security around official, military, and business targets have increased attacks against the
hardest-to-defend target — i.e., private parties. This suggests the need for a greater
reliance on proactive measures because protecting private individuals is prohibitively
expensive and there will always be exposed targets.
The introduction of the covariates allows for a better display of the dynamics and
how they changed for the various regimes. Thus, we found that aborted and completed
incidents against business targets resulted in further incidents in the 1990s. In the most
recent regime, attacks on private individuals led to further attacks. Complex dynamics
characterize the various regimes associated with the four targets. These dynamics can
inform policymakers about the appropriate allocation of homeland security resources. For
example, property appears better protected than people for all target types, thereby calling
for some adjustment in the allocation of homeland security resources to guard the public.
The marked targeting shift to private parties since the mid-1990s is due to three causes:
increased security of property, fundamentalist terrorists’ taste for bloodshed, and terrorists
bid for attention. With attacks significantly down during the post-Cold War era, terrorists
have resorted to greater carnage to garner more headlines. As a result, we are not
necessarily safer today.
25

Notes
1Across the four target series, less than 0.9% of the events have an unknown nature of the victim.
2In addition, we also looked at the effects of a set of covariates measuring the total number of deaths, the
number of government deaths, and the number of terrorist deaths. These analyses produce substantively
similar results to those reported below.
3We also investigated the effect of using lagged covariates. Using one to three lagged values of the
covariates did not produce any substantively significant effects across the covariates — i.e., the estimated
credible intervals covered zero.
4To see how this works, consider the regime-specific Poisson regression model in (4). Based on standard
Poisson process properties, the inter-arrival times between successive events, τtj , at time t in regime j follow
an exponential distribution with arrival rate λt, or
τtj ∼ Exp(λt) =Exp(1)λt
.
where Exp(·) is an exponential distribution. Substituting in the regression function from (4) into the above
equation and taking logarithms yields
log(τtj) = x′tβst + εtj , εtj ∼ log(Exp(1)).
The log linear regression representation of the Poisson regression in the equation above has exponentially
distributed error terms. While this generates a non-standard posterior distribution, this parameterization
of the posterior is well approximated using a mixture of five normal densities for each regime (Fruhwirth-
Schnatter and Wagner 2006).
5In this context, such an interval is preferable, since it summarizes the region that is approximately one
standard deviation above and below the mean (from the 16% to the 84% percentile).
26
References
Alexander, Yonah, and Dennis A. Pluchinsky. 1992. Europe’s red terrorists: The fighting
communist organizations. London: Frank Cass.
Brandt, Patrick T., and Todd Sandler. 2009. Hostage taking: Understanding terrorism
event dynamics. Journal of Policy Modeling 31 (5):758–78.
Chib, Siddhartha. 1998. Estimation and comparison of multiple change-point models.
Journal of Econometrics 86 (2):221–41.
Cleveland, Robert B., William S. Cleveland, Jean E. McRae, and Irma Terpenning. 1990.
STL: A seasonal-trend decomposition procedure based on loess. Journal of Official
Statistics 6 (1):3–73.
Enders, Walter, and Todd Sandler. 1993. The effectiveness of anti-terrorism policies: A
vector-autoregression-intervention analysis. American Political Science Review
87 (4):829–44.
———. 2000. Is transnational terrorism becoming more threatening? A time-series
investigation. Journal of Conflict Resolution 44 (3):307–32.
———. 2005. After 9/11: Is it all different now? Journal of Conflict Resolution
49 (2):259–77.
———. 2006. The political economy of terrorism. Cambridge: Cambridge University Press.
Fruhwirth-Schnatter, Sylvia, and Helga Wagner. 2006. Auxiliary mixture sampling for
parameter-driven models of time series of counts with applications to state space
modeling. Biometrika 93 (4):827–41.
Hoffman, Bruce. 2006. Inside terrorism: Revised and expanded Ed. New York: Columbia
University Press.
27
Kass, Robert E., and Adrian E. Raftery. 1995. Bayes factors. Journal of the American
Statistical Association 90 (430):773–95.
Kollias, Christos, Petros Messis, Nikolaos Mylonidis, and Suzanna-Maria Paleologou. 2009.
Terrorism and the effectiveness of security spending in Greece: Policy implications of
some empirical findings. Journal of Policy Modeling 31 (5):788–802.
Landes, William M. 1978. An economic study of U.S. aircraft hijackings, 1961–1976.
Journal of Law and Economics 21 (1):1–31.
Lee, Beom S., Walter Enders, and Todd Sandler. 2009. 9/11: What did we know and when
did we know it? Defence and Peace Economics 19 (2):79–93.
Mickolus, Edward F. 1982. International terrorism: Attributes of terrorist events,
1968–1977 (ITERATE 2). Ann Arbor, MI: Inter-University Consortium for Political and
Social Research.
Mickolus, Edward F., Todd Sandler, Jean M. Murdock, and Peter Flemming. 2008.
International terrorism: Attributes of terrorist events, 1968–2007 (ITERATE). Dunn
Loring, VA: Vinyard Software.
Park, Jong Hee. 2008. Modeling structural changes using bayesian inference: Historical
changes in U.S. presidential uses of force abroad. Annual Meeting of Society for Political
Methodology, State College, Pennsylvania.
Rapoport, David C. 2004. Modern terror: The four waves. In Attacking terrorism:
Elements of a grand strategy, Cronin, Audrey Kurth, and James M. Ludes, eds., 46–73.
Washington, DC: Georgetown University Press.
Sageman, Marc. 2004. Understanding terror networks. Philadelphia, PA: University of
Pennsylvania Press.
28

Sandler, Todd, John T. Tschirhart, and Jon Cauley. 1983. A theoretical analysis of
transnational terrorism. American Political Science Review 77 (1):36–54.
29
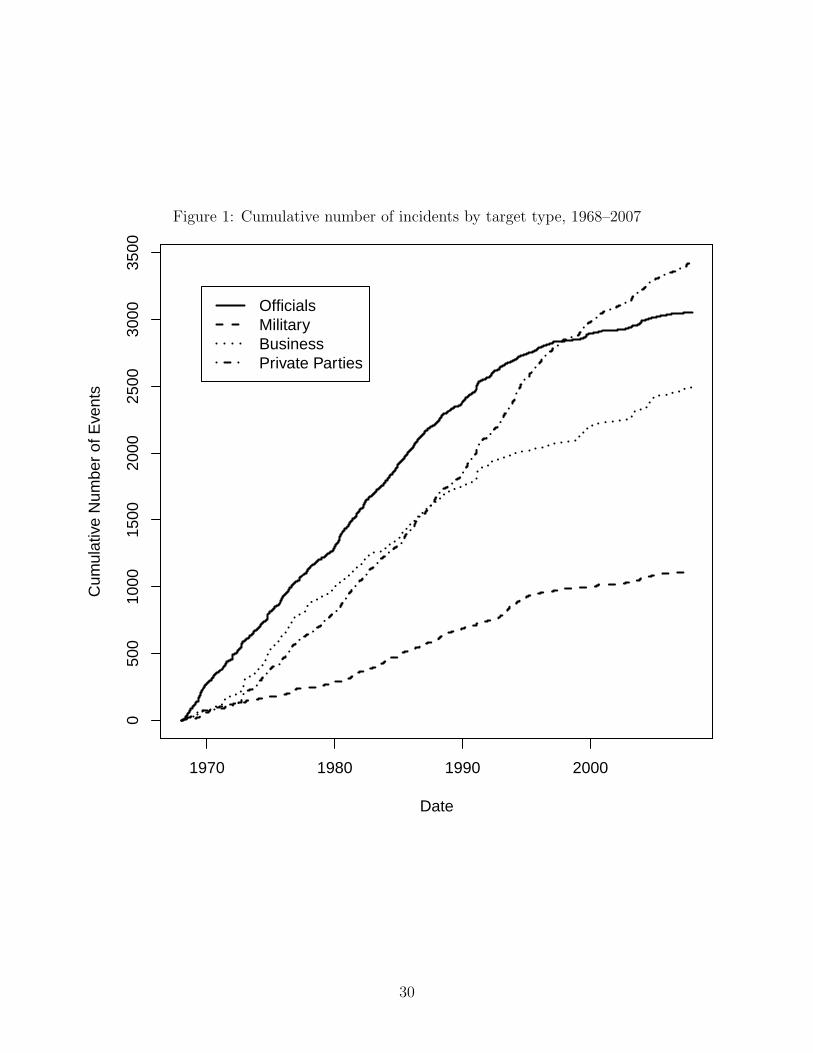
Figure 1: Cumulative number of incidents by target type, 1968–2007
050
010
0015
0020
0025
0030
0035
00
Date
Cum
ulat
ive
Num
ber
of E
vent
s
1970 1980 1990 2000
OfficialsMilitaryBusinessPrivate Parties
30
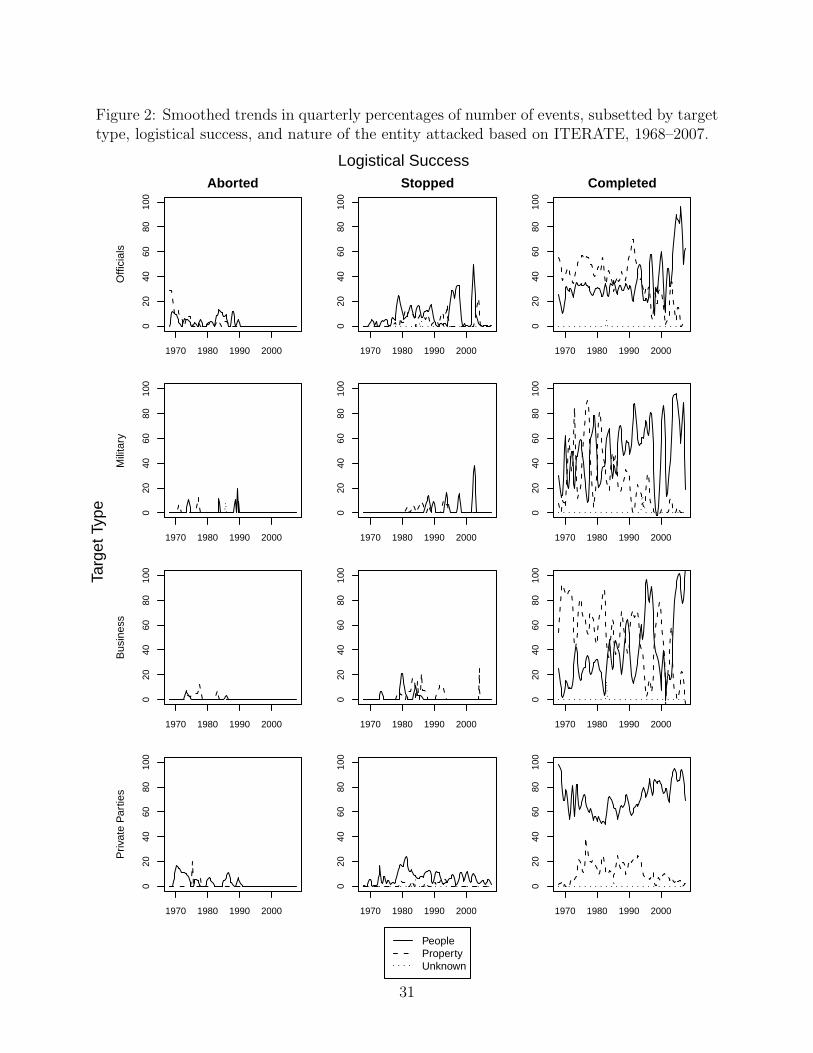
Figure 2: Smoothed trends in quarterly percentages of number of events, subsetted by targettype, logistical success, and nature of the entity attacked based on ITERATE, 1968–2007.
Aborted
Offi
cial
s
1970 1980 1990 2000
020
4060
8010
0
Stopped
1970 1980 1990 20000
2040
6080
100
Completed
1970 1980 1990 2000
020
4060
8010
0
Mili
tary
1970 1980 1990 2000
020
4060
8010
0
1970 1980 1990 2000
020
4060
8010
0
1970 1980 1990 20000
2040
6080
100
Bus
ines
s
1970 1980 1990 2000
020
4060
8010
0
1970 1980 1990 2000
020
4060
8010
0
1970 1980 1990 2000
020
4060
8010
0
Priv
ate
Par
ties
1970 1980 1990 2000
020
4060
8010
0
1970 1980 1990 2000
020
4060
8010
0
PeoplePropertyUnknown
1970 1980 1990 2000
020
4060
8010
0
Targ
et T
ype
Logistical Success
31
Fig
ure
3:M
onth
lyti
me
seri
esan
dch
ange
poi
nts
for
each
ofth
eta
rget
typ
es,
1968
:1–b
2007
:12
1970
1980
1990
2000
0204060
Officials
1970
1980
1990
2000
0.00.40.8
Regime Probabilities
8.2
8.5
2.2
(a)
Offi
cial
s
1970
1980
1990
2000
051015
Military
1970
1980
1990
2000
0.00.40.8
Regime Probabilities
0.4
1.8
3.5
1.2
(b)
Mili
tary
1970
1980
1990
2000
0204060
Business
1970
1980
1990
2000
0.00.40.8
Regime Probabilities
4.8
7.2
3.4
(c)
Bus
ines
s
1970
1980
1990
2000
02040
Private Parties
1970
1980
1990
2000
0.00.40.8
Regime Probabilities
1.4
4.9
9.2
5.2
(d)
Pri
vate
Par
ties
32
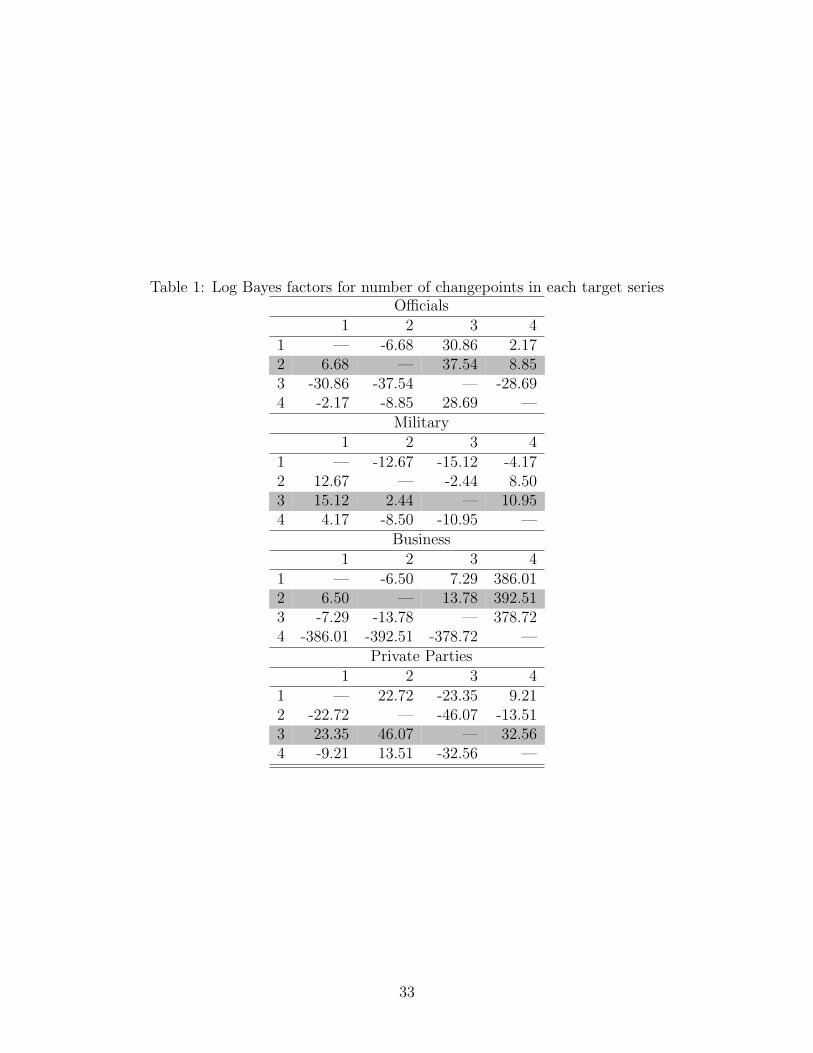
Table 1: Log Bayes factors for number of changepoints in each target seriesOfficials
1 2 3 41 — -6.68 30.86 2.172 6.68 — 37.54 8.853 -30.86 -37.54 — -28.694 -2.17 -8.85 28.69 —
Military1 2 3 4
1 — -12.67 -15.12 -4.172 12.67 — -2.44 8.503 15.12 2.44 — 10.954 4.17 -8.50 -10.95 —
Business1 2 3 4
1 — -6.50 7.29 386.012 6.50 — 13.78 392.513 -7.29 -13.78 — 378.724 -386.01 -392.51 -378.72 —
Private Parties1 2 3 4
1 — 22.72 -23.35 9.212 -22.72 — -46.07 -13.513 23.35 46.07 — 32.564 -9.21 13.51 -32.56 —
33
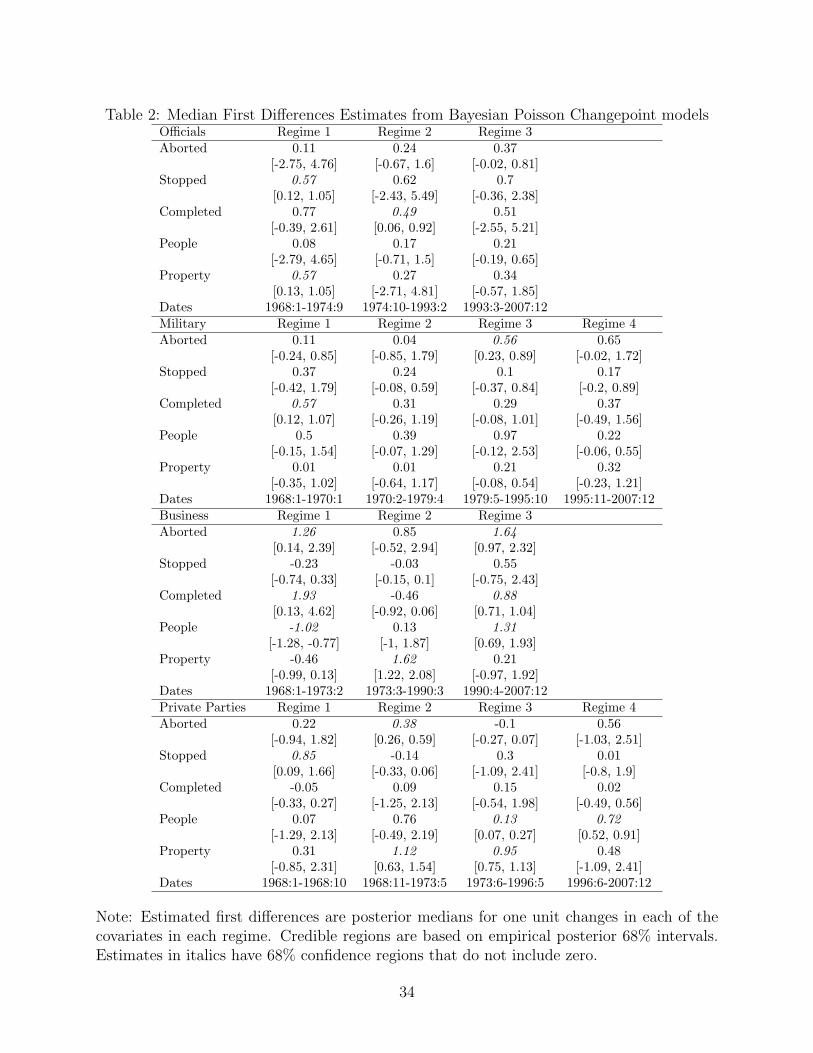
Table 2: Median First Differences Estimates from Bayesian Poisson Changepoint modelsOfficials Regime 1 Regime 2 Regime 3Aborted 0.11 0.24 0.37
[-2.75, 4.76] [-0.67, 1.6] [-0.02, 0.81]Stopped 0.57 0.62 0.7
[0.12, 1.05] [-2.43, 5.49] [-0.36, 2.38]Completed 0.77 0.49 0.51
[-0.39, 2.61] [0.06, 0.92] [-2.55, 5.21]People 0.08 0.17 0.21
[-2.79, 4.65] [-0.71, 1.5] [-0.19, 0.65]Property 0.57 0.27 0.34
[0.13, 1.05] [-2.71, 4.81] [-0.57, 1.85]Dates 1968:1-1974:9 1974:10-1993:2 1993:3-2007:12Military Regime 1 Regime 2 Regime 3 Regime 4Aborted 0.11 0.04 0.56 0.65
[-0.24, 0.85] [-0.85, 1.79] [0.23, 0.89] [-0.02, 1.72]Stopped 0.37 0.24 0.1 0.17
[-0.42, 1.79] [-0.08, 0.59] [-0.37, 0.84] [-0.2, 0.89]Completed 0.57 0.31 0.29 0.37
[0.12, 1.07] [-0.26, 1.19] [-0.08, 1.01] [-0.49, 1.56]People 0.5 0.39 0.97 0.22
[-0.15, 1.54] [-0.07, 1.29] [-0.12, 2.53] [-0.06, 0.55]Property 0.01 0.01 0.21 0.32
[-0.35, 1.02] [-0.64, 1.17] [-0.08, 0.54] [-0.23, 1.21]Dates 1968:1-1970:1 1970:2-1979:4 1979:5-1995:10 1995:11-2007:12Business Regime 1 Regime 2 Regime 3Aborted 1.26 0.85 1.64
[0.14, 2.39] [-0.52, 2.94] [0.97, 2.32]Stopped -0.23 -0.03 0.55
[-0.74, 0.33] [-0.15, 0.1] [-0.75, 2.43]Completed 1.93 -0.46 0.88
[0.13, 4.62] [-0.92, 0.06] [0.71, 1.04]People -1.02 0.13 1.31
[-1.28, -0.77] [-1, 1.87] [0.69, 1.93]Property -0.46 1.62 0.21
[-0.99, 0.13] [1.22, 2.08] [-0.97, 1.92]Dates 1968:1-1973:2 1973:3-1990:3 1990:4-2007:12Private Parties Regime 1 Regime 2 Regime 3 Regime 4Aborted 0.22 0.38 -0.1 0.56
[-0.94, 1.82] [0.26, 0.59] [-0.27, 0.07] [-1.03, 2.51]Stopped 0.85 -0.14 0.3 0.01
[0.09, 1.66] [-0.33, 0.06] [-1.09, 2.41] [-0.8, 1.9]Completed -0.05 0.09 0.15 0.02
[-0.33, 0.27] [-1.25, 2.13] [-0.54, 1.98] [-0.49, 0.56]People 0.07 0.76 0.13 0.72
[-1.29, 2.13] [-0.49, 2.19] [0.07, 0.27] [0.52, 0.91]Property 0.31 1.12 0.95 0.48
[-0.85, 2.31] [0.63, 1.54] [0.75, 1.13] [-1.09, 2.41]Dates 1968:1-1968:10 1968:11-1973:5 1973:6-1996:5 1996:6-2007:12
Note: Estimated first differences are posterior medians for one unit changes in each of thecovariates in each regime. Credible regions are based on empirical posterior 68% intervals.Estimates in italics have 68% confidence regions that do not include zero.
34