Embed Size (px)
Citation preview

What Do Special Education Directors
Say About RTIMargaret Gessler Werts, PhD
Monica Lambert, EdD

Purpose To determine the perceptions of district
special directors about the implementation of Response to Intervention (RtI) for identification of students with LD To examine the correlation of the use of RtI and
the continued use of standardized assessment instruments.
To examine what resources are in place for the implementation of RtI
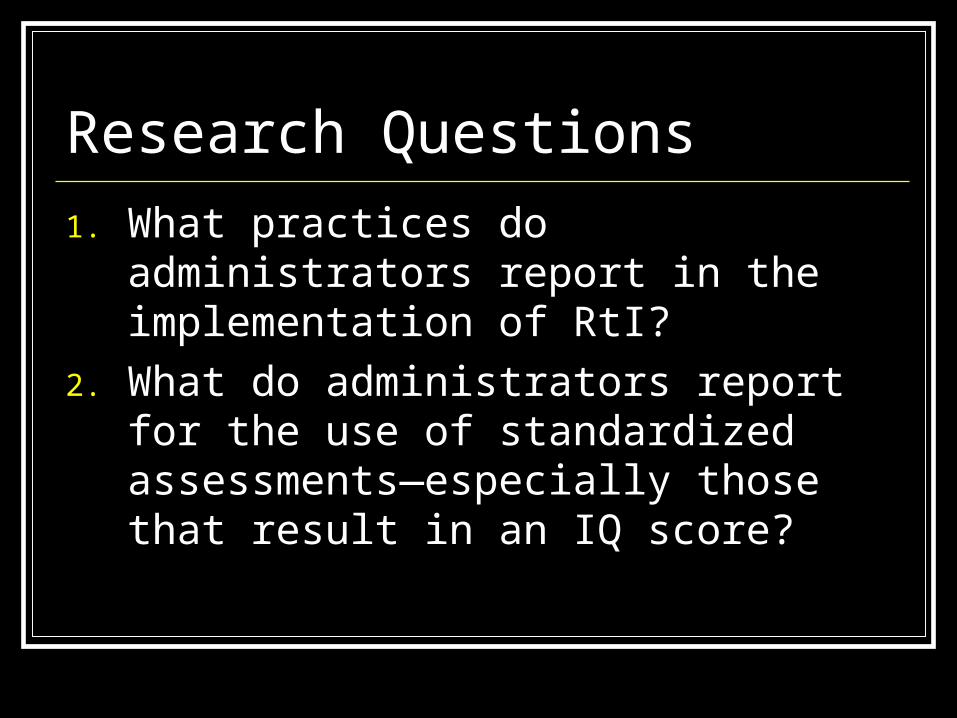
Research Questions
1. What practices do administrators report in the implementation of RtI?
2. What do administrators report for the use of standardized assessments—especially those that result in an IQ score?

Research Questions
3. Do administrators report training in RtI?
4. What resources are provided and what resources are needed for successful implementation of RtI?

Procedures Questionnaire development
Systematic reviews Rewriting poorly worded questions Adding items
Distribution by e-mail through SurveyMonkey Initial mailing Reminders sent every two weeks until the end of
school year

Data was gathered electronically Some questions required hand entry
Entry reliability was above 99% All errors corrected
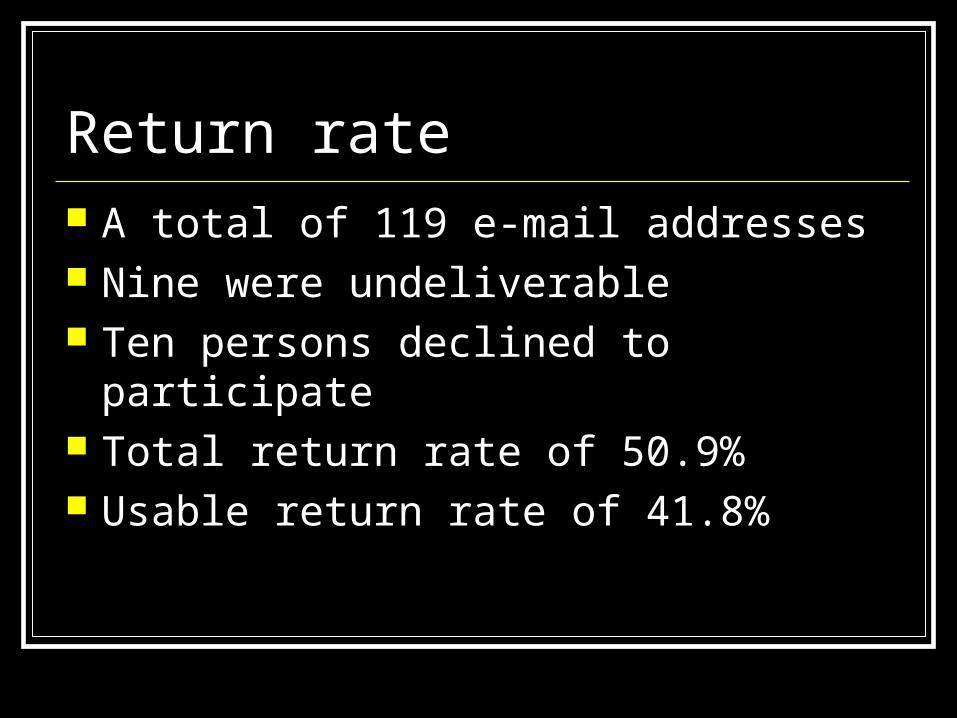
Return rate A total of 119 e-mail addresses Nine were undeliverable Ten persons declined to participate Total return rate of 50.9% Usable return rate of 41.8%

Participants Special education directors from each
district in North Carolina 86.4% were female All were in administrative jobs Experience in this job
mean = 8.8 years median = 7 years range = 1-30 years

Rural = 73.2% Suburban = 12.2% Urban = 14.6%

What percentage of your student body has a special education label?
less than 5 percent 4.9% between 6 and 10 percent 12.2% between 11 and 15 percent 58.5% between 15 and 20 percent 24.4% more than 20 percent 0.0%

What is the size of your student body?
less than 1000 7.5% 1000 but less than 2499 12.5% 2500 but less than 4999 35.0% 5000 but less than 9999 15.0% more than 10000 30.0%

Results District administrators indicated that
standardized assessment instruments are still being used Stanford Binet Intelligence Scale 47.1% Wechsler Intelligence Scale for Children 97.3% Wechsler Adult intelligence Scale 55.9% Kaufman Intelligence Scale 46.9%

…also still use achievement tests Woodcock Johnson 94.6% Brigance Comprehensive 72.2% WIAT 81.8% KTEA 50.0% KeyMath 42.4% Woodcock Reading Mastery 77.8%

Resources: Have and Need Paired t = -5.315 p<.001 Eta = .982
Difference in what is perceived as available and what is perceived as necessary
They need more than they have

Records and information Asked what was available in student folders …and what was needed to conduct RtI

Information in folders
0102030405060708090
100
Comments fromparents
comments fromother teachers
developmentalinfo
current grades previous grades IEP
Have
Need

Information in folders
0102030405060708090
100
Referral info Medical FBA EOG Academic testing IQ testing
Have
Need

Information in folders
0
10
20
30
40
50
60
70
80
90
100
Commentsfrom parents
comments fromother teachers
developmentalinfo
current grades previousgrades
IEP
Have and NeedHave but don't needDon't have but needDon't have, don't need
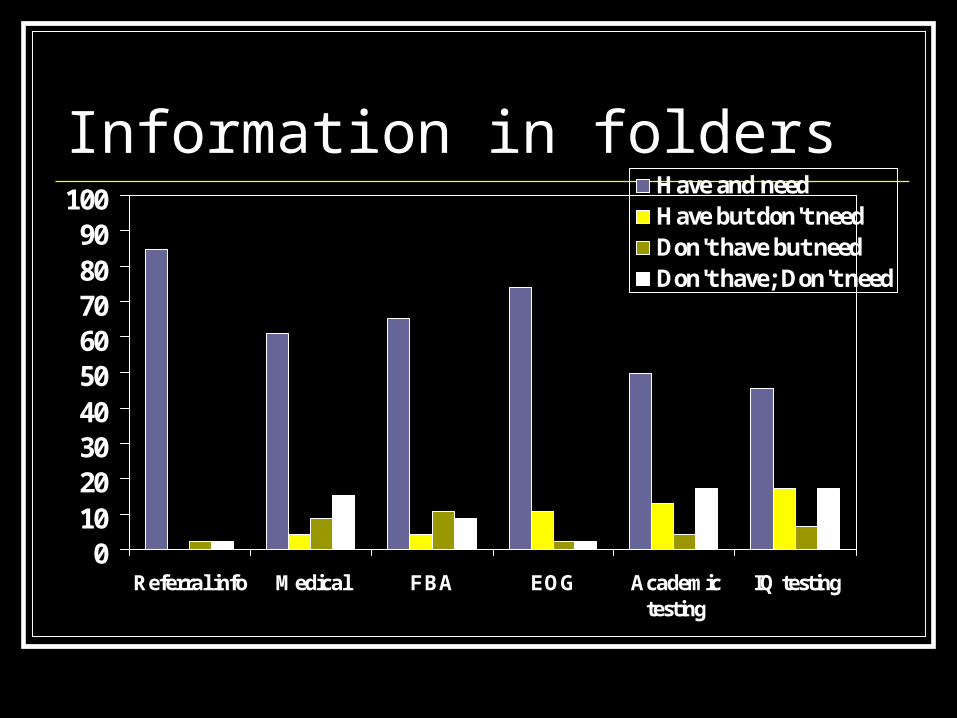
Information in folders
0102030405060708090
100
Referral info Medical FBA EOG Academictesting
IQ testing
Have and needHave but don't needDon't have but needDon't have; Don't need

Resource people We aked they read the item and then pull
down the menu indicating have or do not have the resource.
Then choose whether they would or would not need the resource or support for an effective program of identification of students with disabilities using RTI.

Support from people
0102030405060708090
100
Reading tutor Sp Teacher Gen teacher Administration Principal
HaveNeed

Support from people
0102030405060708090
100
Psychologist Parents:Spec Parents: Gen OT PT TA 1 to 1

Support from people
0
10
20
30
40
50
60
70
80
90
100
Counselor Reading SLP MSW Univ.Consultant Dist Consultant Secretary

1 -
1 a
ssis
tan
t
ad
min
istr
ative
Dis
tric
t C
onsultan
t
Gen e
d t
ea
cher
gu
id c
ounselo
r
OT
Teach
er
assis
tant
Pa
rent
pa
rent
of
Sped
PT
Pri
ncip
al
Rea
din
g T
eacher
Rea
de
r tu
tor
Psycholo
gis
t
Se
cre
tary
SL
P
MS
W
Sp
ecia
l E
ducatio
n t
ch
Univ
. C
onsulta
nt
0
10
20
30
40
50
60
70
80
90
100

Access to information Have and need newsletters Have and need journals
30.4% of respondents do not have access to University libraries and do not need it.
21.7% had access and needed it

0102030405060708090
100
Access toJournals
Access toNewsletters
Access tolibrary
HaveNeed
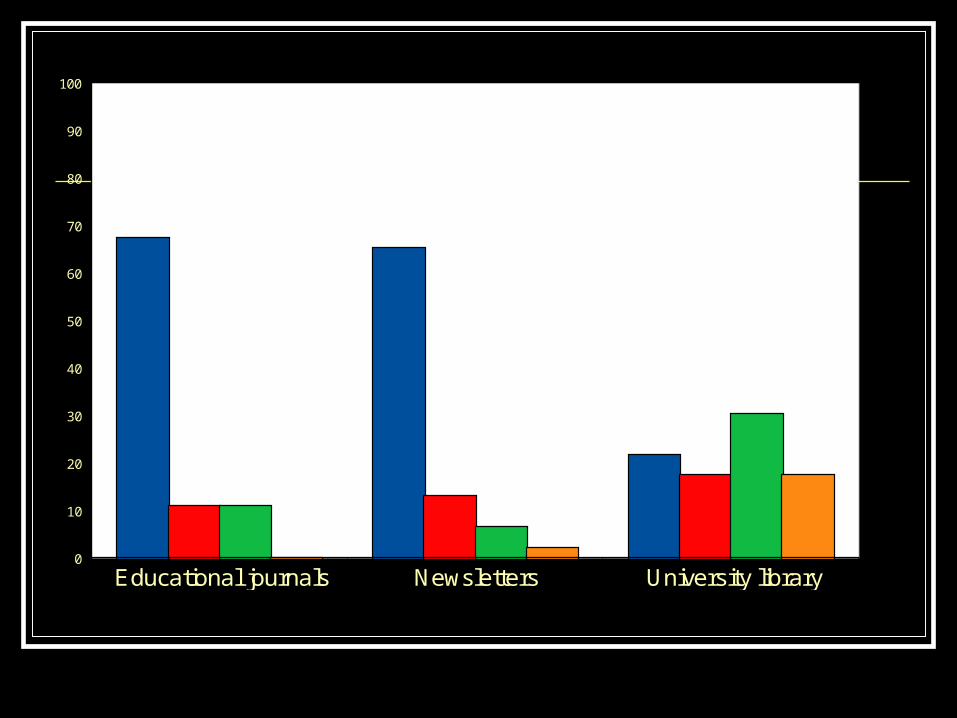
Educational journals Newsletters University library0
10
20
30
40
50
60
70
80
90
100

Training The majority of respondents report having
training. They report having training from the Department
of Public Instruction (DPI). Preferred training are inservices and
observations of other school districts.

0
10
20
30
40
50
60
70
80
90
100
Access to oneday in-service
programs
Access touniversitycourses
Access tomulti-daytrainingsessions
Beginning ofthe year in-
services
Observation ofother schools’
or districts’systems
On going in-services
Opportunity toattend
conferences

1 d
ay in
se
rvic
e
un
ive
rsity c
ou
rse
s
mu
lti d
ay t
rain
ing
be
gin
nin
g o
f ye
ar
ob
se
rva
tio
ns
on
go
ing
in
se
rvic
es
co
nfe
ren
ce
s0
10
20
30
40
50
60
70
80
90
100

Meetings
0102030405060708090
100
Withconsultants
With family With gradelevel team
Release time
Have it
Need it

Meetings (Have and need combined)
0102030405060708090
100
With consultants With family With grade levelteam
Release time
Have and need
Have, don't need
Don't have but need
Don’t have, don't need

Extra materials/ Space
0102030405060708090
100
Math Reading Science SocialStudies
Space
HaveNeed

ma
th m
ate
ria
ls
rea
din
g m
ate
ria
ls
scie
nce
ma
teri
als
so
cia
l stu
die
s
sp
ace
fo
r te
ach
ing
0
10
20
30
40
50
60
70
80
90
100

Questions on details of implementation

Who should determine a student's responsiveness? special education teacher 92.9% general education teacher 92.9% principal 47.6% school psychologist 88.1% parent 71.4% guidance counselor 52.4% reading teacher 92.9% Other 42.9%

How should evidence based programs be determined?
Educational literature 81.0% Teacher evaluation 64.3% Experience 42.9% Evaluated: curriculum committee 76.2% Determined by the state 59.5% Other (please specify) 11.9%

How long should the testing phase (instruction) last?
1 week 12.5% 2 weeks 15.0% 1 month 20.0% 2 months 30.0% Half a school year 0.0% Other 22.5%

How intensive should instruction be in the testing phase?
Twice a week 19.5% Once a day 61.0% Every other day 7.3% Once a week 12.2%

How long should sessions in the testing phase last?
30 minute sessions 47.5% 1 hour sessions 20.0% 2 hour sessions 0.0% Half day sessions 0.0% Whole day sessions 0.0% Other (please specify) 32.5%

Which professionals should take the data?
Special educators: work with student 80.0%
General educators: work with student 85.0% Special educators: NOT work with student
42.5% General educators: NOT work with student
37.5% School psychologists
87.5% Guidance counselors 60.0% Related services personnel 75.0% Administrators 40.0% Other
25.0%

Should the intervention be individualized for the student in the testing phase? Yes 85.4% No 7.3% Other 7.3%

Maybe, maybe not- should be child specific Depends. Not during baseline, but probes
should be individualized. Depends on the student and the plan.

Should the discrepancy model be abandoned?
Yes 45.0% No 32.5% Other 22.5%

Other responses to dropping the discrepancy model IDEA says that each LEA should decide this. Perhaps the discrepancy could be a supplement to RTI data. Used as supplement not primary indicator Phased out slowly Could be a combo Yes for LD, OHI, EMD, BED, possibly DD When the LEA has the necessary materials/staff/training to
implement RTI. I think we should leave it as an option for those who don't feel
comfortable with RTI Not sure

Resources Overall, there is a difference between what
is perceived as available and what is perceived as necessary
Reported more necessary than available

Use of standardized tests Administrators report use of IQ tests Administrators report use of achievement
tests Almost 1/5 said they did not have IQ
assessment and did not need it

Training There has been a high level of training
Primarily through the state department Administrators report they need more
training We did not ask if the training was for them
or for their teachers They reported having access to written
information

Implementation Administrators said teachers should
determine responsiveness Opinion of effectiveness determined by
research literature closely followed by a curriculum committee
Instruction should be once a day, for 30 minutes, and for 2 months

Implementation Instruction should be individualized No clear consensus on whether the
discrepancy model should be dropped