Embed Size (px)
Citation preview

73
erik hurstUniversity of Chicago
benjamin wild pugsleyUniversity of Chicago
What Do Small Businesses Do?
ABSTRACT We show that most small business owners are very different from the entrepreneurs that economic models and policymakers often have in mind. Using new data that sample entrepreneurs just before they start their businesses, we show that few small businesses intend to bring a new idea to market or to enter an unserved market. Instead, most intend to provide an exist-ing service to an existing market. Further, we find that most small businesses have little desire to grow big or to innovate in any observable way. We show that such behavior is consistent with the industry characteristics of the major-ity of small businesses, which are concentrated among skilled craftspeople, lawyers, real estate agents, health care providers, small shopkeepers, and res-taurateurs. Lastly, we show that nonpecuniary benefits (being one’s own boss, having flexibility of hours, and the like) play a first-order role in the business formation decision. Our findings suggest that the importance of entrepreneurial talent, entrepreneurial luck, and financial frictions in explaining the firm size distribution may be overstated. We conclude by discussing the potential policy implications of our findings.
economists and policymakers alike have long been interested in the effects of various economic policies on business ownership. In fact,
the U.S. Small Business Administration is a federal agency whose main purpose, according to its mission statement, is to help Americans “start, build, and grow businesses.” Researchers and policymakers often either explicitly or implicitly equate small business owners with entrepreneurs. Although this association could be tautological, we show in this paper that the typical small business owner is very different from the entrepreneur that economic models and policymakers have in mind. For example, eco-nomic theory usually considers entrepreneurs as individuals who innovate and render aging technologies obsolete (Schumpeter 1942), take economic

74 Brookings Papers on Economic Activity, Fall 2011
risks (Knight 1921, Kihlstrom and Laffont 1979, and Kanbur 1979), or are jacks-of-all-trades in the sense of having a broad skill set (Lazear 2005). Policymakers often consider entrepreneurs to be job creators or the engines of economic growth.
In this paper we shed light on what the vast majority of small businesses actually do and, further, what they report ex ante wanting to do. Section I highlights the industrial breakdown of small businesses within the United States. By “small businesses” we primarily mean firms with between 1 and 19 employees; firms in this size range employ roughly 20 percent of the private sector workforce. However, we also define alternative classifica-tions, such as firms with between 1 and 100 employees. We show that over two-thirds of all small businesses by our primary definition are confined to just 40 narrow industries, most of which provide a relatively standard-ized good or service to an existing customer base. These industries primar-ily include skilled craftspeople (such as plumbers, electricians, contractors, and painters), skilled professionals (such as lawyers, accountants, and archi-tects), insurance and real estate agents, physicians, dentists, mechanics, beauticians, restaurateurs, and small shopkeepers (for example, gas station and grocery store owners). We also show that although firms within these industries are heterogeneous in size, these industries account for a dispro-portionate share of all small businesses. This composition of small busi-nesses foreshadows our empirical results.
In section II we study job creation and innovation at small firms, both established and new. First, using a variety of data sets, we show that most surviving small businesses do not grow by any significant margin. Rather, most start small and stay small throughout their entire life cycle.1 Also, most surviving small firms do not innovate along any observable margin. Very few report spending resources on research and development, getting a patent, or even obtaining copyright or trademark protection for something related to the business, including the company’s name. Furthermore, we show that between one-third and half of all new businesses report provid-ing an existing good or service to an existing market. This is not surpris-ing when one thinks of the most common types of small business. A new plumber or a new lawyer who opens up a practice often does so in an area where plumbers and lawyers already operate.
1. Haltiwanger, Jarmin, and Miranda (2010) show that, when one controls for firm age, there is no systematic relationship between firm size and growth. They conclude that those small firms that tend to grow fast (relative to large firms) are newly established firms. We discuss in later sections how our results add to these findings. In particular, we show that most surviving new firms also do not grow in any meaningful way.

erik hurst and benjamin wild pugsley 75
Most existing research attributes differences across firms with respect to ex post performance to either differences in financing constraints (for example, Evans and Jovanovic 1989, Clementi and Hopenhayn 2006), dif-ferences in ex post productivity draws across firms (for example, Simon and Bonini 1958, Jovanovic 1982, Pakes and Ericson 1989, Hopenhayn 1992), or differences in the owners’ entrepreneurial ability (for example, Lucas 1978). In section III we use new data on the expectations of nascent small business owners to show that these stories are incomplete. When asked at the time of their business formation, most business owners report having no desire to grow big and no desire to innovate along observ-able dimensions. In other words, when starting their business, the typical plumber or lawyer expects the business to remain small well into the fore-seeable future and does not expect to innovate by developing a new product or service or even to enter new markets with an existing product or service.
If most small businesses do not want to grow and do not want to inno-vate, why do they start? We address this question in section IV. The same new data set that we used to explore the expectations of nascent business owners also specifically asks about motives. Over 50 percent of these new business owners cite nonpecuniary benefits—for example, “wanting flex-ibility over schedule” or “to be one’s own boss”—as a primary reason for starting the business. By comparison, only 34 percent report that they are starting the business to generate income, and only 41 percent indicate that they are starting a business because they want to create a new product or because they have a good business idea. (Respondents could give up to two answers.) Exploiting the panel nature of the data, we show that those small businesses that started for other than innovative reasons were less likely to grow in the ensuing years, less likely to report wanting to grow, less likely to innovate, and less likely to report wanting to innovate.
Collectively, these results suggest that the first-order reasons why most small businesses form are not the innovation or growth motives embedded in most theories of entrepreneurship. Rather, the nonpecuniary benefits of small business ownership may be an important driver of why firms start and remain small. Additionally, some industries (such as insurance agen-cies) may have a natural scale of production at the establishment level that is quite low. In section V we discuss how our results challenge much of the existing work on entrepreneurship and small-firm dynamics. We high-light how our findings suggest that the importance of entrepreneurial tal-ent, entrepreneurial luck, and financial frictions in explaining the firm size distribution may be overstated. In section VI we discuss the policy implica-tions of our results. Section VII concludes.
76 Brookings Papers on Economic Activity, Fall 2011
More research into the diversity of motives and expectations among small businesses has been done in developing economies than in devel-oped economies.2 Recent work by Rafael La Porta and Andrei Shleifer (2008) and a review of the literature by Abhijit Banerjee and Esther Duflo (2011) show that most small businesses in developing economies do not grow or innovate in any observable way. We discuss in section V how the qualitatively similar outcomes we observe in the United States are driven by different forces than in developing economies.
Overall, our results reveal substantial skewness among small businesses within the United States, in terms of both actual and expected growth and innovative behavior. Although growth and innovation are the usual corner-stones of entrepreneurial models and the usual justifications for policy interventions to support small business, most small businesses do not want to grow or innovate. Our results suggest that it is often inappropriate for researchers to use the universe of small business (or self-employment) data to test standard theories of entrepreneurship. More specialized data sets, such as those that track small businesses seeking venture capital funding, may be more suitable for this task, because these firms have been shown to be more likely to actually grow or to innovate than other small businesses.3 For their part, policymakers who want to promote growth and innovation may want to consider more targeted policies than those that address the universe of small businesses.
I. Industrial Composition of Small Businesses
This section intends to show that most small businesses are concentrated in a small number of narrowly defined industries (industries at the four-digit level of the North American Industry Classification System, or NAICS) that mostly provide standard services to local customers. This context is important when interpreting our findings that the majority of small busi-nesses do not intend to grow or innovate in any substantive way.
2. Two notable exceptions include Bhidé (2000) and Ardagna and Lusardi (2008). Bhidé (2000) examines the attributes of the founders of many successful firms and concludes that their actions and behaviors are an important determinant of firm growth. Ardagna and Lusardi (2008) use survey data from the Global Entrepreneurship Monitor to show that indi-viduals who report starting a business because they had a good business opportunity differ demographically from other business owners.
3. Some papers in the literature take this approach. See, for example, recent work by Kaplan and Lerner (2010), Puri and Zarutskie (forthcoming), and Hall and Woodward (2010). As shown by Puri and Zarutskie (forthcoming), firms that seek venture capital fund-ing are much more likely to grow than the universe of remaining firms.

erik hurst and benjamin wild pugsley 77
To examine the types of small businesses that exist within the United States, we use data from the Statistics of U.S. Businesses (SUSB) compiled by the U.S. Census Bureau.4 To create these statistics, the Census Bureau compiles data extracted from the Business Register, which contains the bureau’s most current and consistent data for U.S. business establishments.5 The data cover most U.S. firms with at least one paid employee. (We also discuss how our results would differ if we included information from firms that do not hire paid employees.) We focus our attention on the statistics from 2003 to 2007, all of which are coded using the NAICS 2002 indus-try definitions; additional data from the Economic Census are available for 2007. However, our results are nearly identical if we pick any year between 1998 and 2008. Throughout the paper, to avoid contamination by large firms operating many small establishments, we classify business size by total firm employment.6 For most purposes in this section, we refer to “small busi-nesses” as those with between 1 and 19 employees, although we also con-sider alternative definitions based on different employment size cutoffs.
As is already well known, small businesses account for a very large frac-tion of the population of employer firms. Figure 1 uses the SUSB data from 2007 to construct the cumulative distribution function for firm size using several different measures of economic activity. In 2007 roughly 6 million firms had paid employees; the 90 percent of these firms that had fewer than 20 employees accounted for about 20 percent of aggregate paid employ-ment and about 15 percent of sales receipts and payroll. These numbers change only slightly when one looks at firms with fewer than 100 employ-ees: firms with between 20 and 99 employees represent an additional 8 per-cent of all employer firms and 15 percent of aggregate employment.
Next we study the concentration of small businesses with paid employees at very fine levels of industry classification. These results yield two impor-tant messages. First, most small businesses are concentrated in a few detailed
4. For a complete description of the data, see U.S. Census Bureau, “Statistics of U.S. Businesses,” www.census.gov/econ/susb/.
5. The Business Register is updated continuously and incorporates data from the Census Bureau’s economic censuses and current business surveys, quarterly and annual federal tax records, and other departmental and federal statistics. The data include information from all NAICS industries except crop and animal production; rail transportation; the U.S. Postal Service; pension, welfare, and vacation funds; trusts, estates, and agency accounts; private households; and public administration.
6. A firm (termed here an “enterprise”) may consist of many establishments, which are distinct locations of business activity. For example, Starbucks Corporation is a large firm that operates thousands of small establishments. Given our focus on total firm employment, we do not treat the individual Starbucks establishments as small businesses.

78 Brookings Papers on Economic Activity, Fall 2011
industry classifications. Second, within these few detailed industries, the distribution of employment across all firm sizes differs from the overall distribution for all other industries. Most of the industries in which small businesses reside are also industries in which a disproportionate amount of economic activity takes place in small firms.
We start by taking the universe of all employer firms with fewer than 20 employees. Within this group of small firms, we rank the represented four-digit industries by a crude measure of concentration, namely, each industry’s share of all firms in this universe.7 We define this share xj as
xs
sj
j
jj
=∑
,
where sj is the number of small businesses in industry j. This measure gives the importance of a given industry out of the universe of businesses with
Figure 1. Cumulative shares of Firms, employment, receipts, and payroll, by Firm size Category, 2007
10
20
30
40
50
60
70
80
90
Percent of total
01–
45–
9
10–1
4
15–1
9
20–2
4
25–2
9
30–3
4
35–3
9
40–4
4
45–4
9
50–7
4
75–9
9
100–
149
150–
199
200–
299
300–
399
400–
499
500–
749
750–
999
1,000
–1,49
9
1,500
–1,99
9
2,000
–2,49
9
2,500
–4,99
9
5,000
+
Firms
Establishments
Employment
Receipts
Payroll
Source: Authors’ calculations using Statistics of U.S. Businesses data.
Firm size (no. of paid employees)
7. The national SUSB data are available at the six-digit NAICS level of aggregation. Without much loss of generality, we aggregate these data to the four-digit level.

erik hurst and benjamin wild pugsley 79
fewer than 20 employees. There are 294 four-digit NAICS industries in the SUSB data; we rank these industries from 1 to 294, with the industry with the largest xj ranked 1.
Figure 2 shows the cumulative sum of xj across four-digit industries by rank in 2007. The first 20 industries accounted for just about half of all firms with fewer than 20 employees in that year, and the top 40 for about two-thirds. The employment shares for the top 20 and the top 40 industries (not shown) were similar, at nearly 50 percent and 65 percent, respectively.
Table 1 lists those top 40 four-digit industries ranked by xj. The table shows that most small businesses are either restaurants (full service, lim-ited service, or bars), skilled professionals (physicians, dentists, lawyers, accountants, architects, consultants), skilled craftspersons (general contrac-tors, plumbers, electricians, masons, painters, roofers), professional service providers (clergy, insurance agents, real estate agents), general service pro-viders (auto repair, building services such as landscaping, barbers and beau-ticians), or small retailers (grocery stores, gas stations, clothing stores).
These results are robust to alternative cuts of the data. If we extend our classification to the top 60 four-digit industries (which account for over
Figure 2. Cumulative share of all small businesses across ranked Four-digit industries, 2007
0 20 40 60 80 100 120 140 160 180 200 220 240 260 280 300
Percent of all small businesses
Industries ranked by share of all small businessesa
90
80
70
60
50
40
30
20
10
Source: Authors’ calculations using Statistics of U.S. Businesses data.a. The 294 four-digit NAICS industries are ranked by their share of all businesses with fewer than 20
employees, starting with the industry with the largest share.

Tabl
e 1.
Fou
r-d
igit
nai
Cs in
dust
ries
with
the
larg
est s
hare
s of
all
smal
l bus
ines
ses,
200
7a
Ran
k
Indu
stry
(N
AIC
S co
de)
Per
cent
of
all s
mal
l bu
sine
sses
C
umul
ativ
e pe
rcen
t
R
ank
Indu
stry
(N
AIC
S co
de)
Per
cent
of
all s
mal
l bu
sine
sses
C
umul
ativ
e pe
rcen
t
1 2 3 4 5 6 7 8 9 10 11 12 13 14 15 16 17 18 19 20
Res
iden
tial
Bui
ld. C
onst
. (23
61)
Offi
ces
of P
hysi
cian
s (6
211)
Leg
al S
ervi
ces
(541
1)B
uild
. Equ
ip. C
ontr
acto
rs (
2382
)R
elig
ious
Org
aniz
atio
ns (
8131
)S
vcs.
to B
uild
. and
Dw
elli
ngs
(561
7)A
uto
Rep
air
and
Mai
nt. (
8111
)L
imit
ed-S
vc. E
atin
g P
lace
s (7
222)
Ful
l-S
ervi
ce R
esta
uran
ts (
7221
)M
gmt./
Sci
./Tec
h. C
onsu
lt. (
5416
)In
sura
nce
Age
ncie
s (5
242)
Bui
ld. F
inis
hing
Con
trac
tors
(23
83)
Offi
ces
of D
enti
sts
(621
2)O
ther
Hea
lth
Pra
ctit
ione
rs (
6213
)F
ound
./Str
uct./
Bui
ld. C
ontr
. (23
81)
Acc
ount
ing
Ser
vice
s (5
412)
Rea
l Est
ate
Age
nts
and
Bro
kers
(53
12)
Com
pute
r S
yste
ms
Des
ign
(541
5)P
erso
nal C
are
Ser
vice
s (8
121)
Les
sors
of
Rea
l Est
ate
(531
1)
3.5
3.2
3.2
3.1
3.0
3.0
2.7
2.6
2.6
2.5
2.3
2.3
2.2
2.0
1.9
1.9
1.8
1.8
1.7
1.7
3.5
6.7
9.9
13.0
16.0
19.0
21.7
24.3
26.9
29.4
31.8
34.1
36.2
38.2
40.1
42.0
43.9
45.6
47.3
49.0
21 22 23 24 25 26 27 28 29 30 31 32 33 34 35 36 37 38 39 40
Arc
h./E
ngin
eeri
ng S
erv.
(54
13)
Oth
. Spe
c. T
rade
Con
tr. (
2389
)A
ctiv
. Rlt
d. to
Rea
l Est
ate
(531
3)G
asol
ine
Sta
tion
s (4
471)
Oth
. Pro
f., S
ci, T
ech.
Svc
s. (
5419
)G
roce
ry S
tore
s (4
451)
Bus
./Pro
f./L
abor
/Pol
itic
al O
rgs.
(81
39)
Gen
eral
Fre
ight
Tru
ckin
g (4
841)
Who
lesa
le E
lect
roni
c M
kts.
(42
51)
Am
usem
ent a
nd R
ecr.
(71
39)
Chi
ld D
ay C
are
Ser
vice
s (6
244)
Spe
c. F
reig
ht T
ruck
ing
(484
2)D
rink
ing
Pla
ces
(Alc
h.)
(722
4)O
ther
Fin
./Inv
est.
Act
ivit
ies
(523
9)H
ealt
h an
d P
ers.
Car
e S
tore
s (4
461)
Clo
thin
g S
tore
s (4
481)
Bui
ld. M
ater
ial D
lrs.
(44
41)
Non
res.
Bui
ld. C
onst
r. (
2362
)M
ach.
/Equ
ip./S
uppl
. Whs
le. (
4238
)O
ther
Mis
c. R
etai
lers
(45
39)
1.7
1.7
1.3
1.3
1.1
1.1
1.1
1.0
1.0
1.0
0.9
0.9
0.8
0.8
0.8
0.7
0.7
0.7
0.7
0.7
49.0
50.7
52.0
53.3
54.4
55.5
56.6
57.6
58.6
59.6
60.5
61.4
62.2
63.0
63.8
64.5
65.2
65.9
66.6
67.3
Sour
ce: 2
007
Eco
nom
ic C
ensu
s da
ta.
a. B
usin
esse
s w
ith fe
wer
than
20
empl
oyee
s in
the
2007
Eco
nom
ic C
ensu
s ar
e cl
assi
fied
by th
eir f
our-
digi
t NA
ICS
indu
stry
cod
es (i
n pa
rent
hese
s), a
nd th
ose
294
four
-dig
it in
dust
ries
ar
e th
en r
anke
d by
thei
r sh
are
of a
ll sm
all b
usin
esse
s th
us d
efine
d.

erik hurst and benjamin wild pugsley 81
80 percent of all firms with fewer than 20 employees), the broad types of industries in which most small businesses reside are not altered. Rather, the firms ranked 41 to 60 are similar in spirit to those in the top 40: they include dry cleaners, office supply stores, hardware stores, jewelry stores, automobile dealerships, liquor stores, furniture stores, and the like. Addi-tionally, when we extend the definition of small business to include all firms with fewer than 100 employees, our results are very similar to those under the narrower definition: the 40 industries listed in table 1 also repre-sent 66 percent of the firms and 61 percent of the employment in this group.
One concern may be that the important small business industries may reflect the overall size of the industry rather than the role of small busi-nesses within the industry. In fact, the bulk of small businesses are con-centrated in industries where a disproportionate amount of employment is concentrated in small firms. For example, within the skilled crafts indus-tries, 48 percent of all employment (on average) is in firms with fewer than 20 employees. This figure is much larger than the 20 percent of economy-wide employment that is in firms of this size (figure 1).
Figure 3 attempts to better document the relationship between the importance of an industry within the universe of small businesses and the amount of activity that takes place within small firms within that industry.8 The figure groups four-digit industries into deciles based on xj, the share of small firms within a given industry out of all small firms in the econ-omy. As in figure 2 and table 1, we define small firms as those firms with between 1 and 19 employees; however, the patterns are broadly similar if we instead define small firms to have between 1 and 99 employees. The figure then plots for each decile the within-industry share of employment in small firms, averaged across the industries in the decile, again using data for 2007. Formally, we define the within-industry share of employment in small firms as
ye
ej
js
jn
= ,
where esj is the number of employees in small businesses within industry j
and enj is the number of employees in all businesses, regardless of size, within
8. We also performed a different set of robustness results, based on a measure of the importance of small businesses in industry j out of all small businesses that adjusts for the importance of industry j out of all firms regardless of size. The patterns in table 1 and figures 1 through 3 were robust to this adjustment.

82 Brookings Papers on Economic Activity, Fall 2011
industry j. The results show that the industries that make up the bulk of small businesses (that is, that have a high xj) are also industries where more of the employment within the industry is in small firms (have a high yj). The top decile of industries with respect to xj consists of the first 29 industries listed in table 1. These industries account for about 60 percent of small businesses by number and about 60 percent of employment within small businesses. For these industries about 40 percent of employment within the industry, on average, is in small firms. Again, only about 20 percent of employment across all industries is in small firms. Thus, the high-xj industries are skewed toward small firms. Across deciles, as xj falls and the component industries become less important as a fraction of all small businesses, the scale of these industries, for the most part, monotonically increases.
A few other comments can be made about figure 3. First, the top three deciles contain roughly 90 four-digit industries, which together account for roughly 85 percent of all small businesses. Even the industries in the sec-ond and third deciles have within-industry employment (yj) that is skewed
Figure 3. small business share of within-industry employment, by decile of ranked Four-digit industries
Deciles of industries ranked by share of all small businessesa
1 2 3 4 5 6 7 8 9 10
5
10
15
20
25
30
35
40
Source: Authors’ calculations using Statistics of U.S. Businesses data.a. The 294 four-digit NAICS industries in figure 2 are grouped into deciles. Reported percentages are
simple averages for the industries in the indicated decile.
Percent of within-industry employment

erik hurst and benjamin wild pugsley 83
toward small firms. Second, the differences between the average yj for the industries within the first decile and the average yj for the industries within each of the other deciles are all statistically significant. For example, the p value of the difference between the first and the second deciles is 0.017, and that of the difference between the first and the fourth deciles is < 0.001. Likewise, the p values of the differences between the average yj for the sec-ond and third deciles and that of the fourth decile are both about 0.03. This suggests that it may not be surprising that most small firms neither grow nor report wanting to grow, given that most small firms are in industries where the observed scale of production is on average lower.
Our analysis in this section focuses on employer firms, which are defined as firms with at least one paid employee. Most U.S. firms, how-ever, are nonemployer firms. In 2007, for example, there were 21.7 mil-lion zero-employee firms, representing roughly 78 percent of all firms. Often these are second businesses or independent consultants who report self-employment income on their federal income tax returns. As a result, despite their importance in the number of firms, nonemployer firms col-lectively represent less than 4 percent of all sales or receipts during a given year.9 Because many of the existing data sets exclude the nonemployer firms from their analysis, it is hard to systematically analyze their compo-sition. Recently, however, the Census Bureau has released data that sort these firms, in terms of both numbers and receipts, by broad industry clas-sification.10 Appendix table A1 summarizes these data for 2007. The pat-terns documented in table 1 carry through to nonemployer firms. Most are in a handful of industries where a larger share of production takes place in small firms. As a result, we see our broad results as extending to the inclu-sion of nonemployer firms.
To summarize, most small businesses operate in a limited set of nar-rowly defined industries in which a larger share of economic activity takes place in small firms than is true of other industries. As we discuss in later sections, these industries usually do not match the theoretical models of “entrepreneurship” put forth in the literature.
Before proceeding, we wish to acknowledge that even within the indus-tries where most small businesses are located, many firms are still quite
9. Even though they are currently small, the nonemployer firms are an important source of future paid-employee firms. Many eventual employer firms start out as nonemployer firms. See Davis and others (2007) for a more detailed discussion.
10. See U.S. Census Bureau, “Nonemployer Statistics,” www.census.gov/econ/non employer/index.html.

84 Brookings Papers on Economic Activity, Fall 2011
large. John Haltiwanger, in his discussion of our paper that follows, empha-sizes this point. Any theory focusing on the distribution of firm size thus needs to account for several facts: that most small businesses are concen-trated in a small set of industries, that the fraction of total employment in small businesses within these small business–intensive industries is higher than in other industries, but that even these small business–intensive indus-tries contain many large firms. We emphasize the first two points whereas Haltiwanger emphasizes the third.
II. Ex Post Small Business Growth and Innovation
In this section we explore the extent to which small businesses actually grow or innovate by observable measures in surveys of small business activity.
II.A. Small Business Growth
It is well documented that small businesses are heterogeneous in the extent to which they grow, even when one controls for observable factors such as firm size or firm age. Most recently, Haltiwanger and others (2010) find little relationship between firm size and firm growth conditional on firm age. Nearly all of employment growth is driven by young firms, which also happen to be small. In this section we use some new and existing data sets to illustrate some additional facts about the distribution of growth propensities across both small and young firms. We show that even among young firms, and even among only those young firms that survive, growth is still rare overall.
Table 2 shows data from the 2005 Business Dynamics Statistics (BDS). The BDS is produced by the Census Bureau from longitudinal (annual) estab-lishment-level administrative data similar to the source data for the SUSB discussed above. It provides measures of gross job creation and destruc-tion by firm size and age for 1977 through 2009. Sector-level measures are available for the United States as a whole, and overall measures are available by state. Again like the SUSB, the database tracks the employment patterns of employer firms only. The top panel of table 2 shows the share of all busi-nesses within different firm age categories that have fewer than 20 employ-ees, both for the entire economy and within broad BDS sectors. In 2005, of all operating firms within the economy that had survived less than 10 years, 92 percent had fewer than 20 employees. The figures for some individual sectors are quite similar: within the construction sector, for example, 94 per-cent of operating “young” firms had fewer than 20 employees. The bottom

erik hurst and benjamin wild pugsley 85
panel of table 2 shows the share of employment by sector in these same small firms. The patterns are similar to those in the top panel: for example, firms with fewer than 20 employees accounted for 45 percent of the total employ-ment of all firms that had been in existence for less than 10 years.
Table 2 highlights two other important facts. First, among mature firms (firms in existence between 10 and 25 years), most have fewer than 20 employees, and much of total employment is in firms in this size range. Across the economy as whole, small firms represent nearly 90 percent of all firms and nearly 25 percent of all employment by firms that have been in existence between 10 and 25 years. Thus, even well into their life cycle, the overwhelming majority of firms remain small.
Second, and consistent with the results in the previous section, there is substantial variation among sectors with respect to employment. In construc-tion, for example, 38 percent of employment within mature firms is in small
Table 2. shares of small businesses and small business employment in major sectors, by Firm age, 2005a
Firm age (years)
Sector 0–10 10–25 All firms
All industriesFinance, insurance, and real estateAgricultureConstructionWholesale tradeServicesTransportation, communications, and utilitiesRetailManufacturing
All industriesFinance, insurance, and real estateAgricultureConstructionWholesale tradeServicesTransportation, communications, and utilitiesRetailManufacturing
Small businesses as percent of all firms92.095.594.893.793.092.792.388.685.5
85.791.888.186.083.288.482.281.871.5
87.291.991.688.984.189.186.084.672.4
Small business employment as percent of all employment
44.850.857.759.152.840.744.246.934.6
24.731.747.138.430.623.114.724.816.0
19.419.050.139.421.720.811.818.8 8.5
Source: 2005 Business Dynamics Statistics data (www.ces.census.gov/index.php/bds/bds_database_list).a. Small businesses are defined as firms with fewer than 20 employees. Sector classifications are those
provided by the Business Dynamics Statistics (BDS). Like the Statistics of U.S. Businesses data, the BDS data include information only on firms with paid employees.
86 Brookings Papers on Economic Activity, Fall 2011
businesses, but the figure for manufacturing is only 16 percent. Other sectors in which the employment of mature firms is concentrated in small businesses include finance, insurance, and real estate (FIRE), retail trade, and wholesale trade. The heterogeneity in the firm size distribution across sectors implies differences in dynamics by sector.
To shed light on employment dynamics for firms of different ages and industries, we use data from a variety of additional sources, starting with the 2003 Survey of Small Business Finances.11 The SSBF, conducted by the Board of Governors of the Federal Reserve System, surveys a ran-dom sample of businesses with fewer than 500 employees. The survey is designed to measure the financial position of these businesses, but it also contains other background questions. In 2003 firms were asked to state whether in the past year, and over the past 3 years, their total employment grew, remained the same, or contracted.
Table 3 summarizes the responses to these questions by firms with fewer than 20 employees. We break down the responses by firm age to highlight differences between newer and more established businesses. As the table shows, the overwhelming majority of small firms do not grow by adding employees from year to year or even over 3-year periods.12 Only 14 per-cent of these small businesses added an employee between 2002 and 2003, and only 21 percent did so between 2000 and 2003. Thus, by this mea-sure, roughly 80 percent of surviving small firms did not grow at all even over a relatively long period. The percentages are slightly higher among small firms that had been in existence between 1 and 10 years, but only 19 percent of these grew between 2002 and 2003, and only 28 percent grew between 2000 and 2003. These data show that although most aggregate employment growth may come from small (new) firms growing big, the vast majority of small (new) firms do not grow, even over longer horizons.
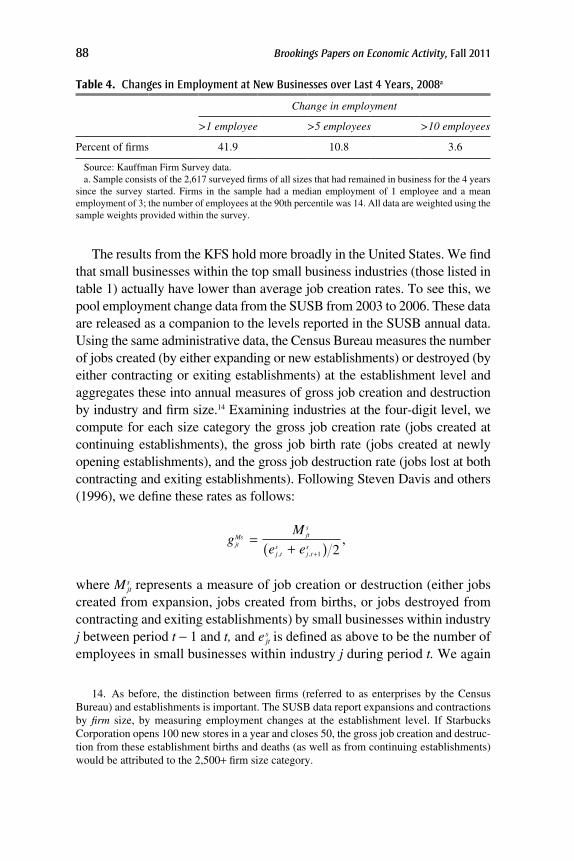
Within the modest share of growing firms, the SSBF data do not tell us by how much the firms grew. To address this question, we turn to the Kauffman Firm Survey (KFS), a panel study administered by the Kauff-man Foundation of 4,928 businesses that were newly founded in 2004.13
11. The SSBF was formerly known as the National Survey of Small Business Finances. It was a quinquennial survey that began in 1983 and was last conducted in 2003.
12. We exclude firms that are unable to answer the employment change question because they did not exist in the base year. Thus, the firms responding to the 1-year change question are at least 1 year old, and the firms responding to the 3-year change question are at least 3 years old.
13. The Kauffman Foundation (www.kauffman.org) is an organization whose goals are to study and understand entrepreneurship.

erik hurst and benjamin wild pugsley 87
As Haltiwanger and others (2010) show, it is new firms that contribute the most, on average, to job growth. Yet as we have just shown, job growth is rare among typical small businesses: it is not true that most new busi-nesses generate employment growth. To create the KFS sample, research-ers began with a sample frame of nearly 250,000 businesses started in 2004, from a database created by Dun & Bradstreet, a firm that collects and manages commercial data. From these data, the KFS oversampled businesses in high-technology industries and businesses that reported high employment in research and development in the business’s primary indus-try. The final sample of 4,928 firms is resurveyed annually in follow-up interviews. As of this writing, public-use data are available on these firms through 2009. For the work below, we consider only the 2,617 firms in the sample that survived through 2008. We use the survey weights provided by KFS, which are designed to make the firms in the sample representative of all new firms in the economy.
Because the KFS is a 4-year panel, we can assess the growth rate of employment for new businesses within the KFS over 4 years. In each wave of the survey, the KFS asks firms to report their number of employees. Table 4 shows that between 2005 and 2008, 42 percent of the surviving firms in the KFS reported an increase in employment. Very few, how-ever, added more than one or two employees: 89 percent added 5 or fewer employees, and 96 percent added 10 or fewer.
Table 3. Change in employment at existing small businesses, by Firm age, 2003a
Percent
Firm age (years)
Direction of change in employment 1–10 11–20 21+ All firms
Over last yearIncreaseNo changeDecrease
Sample size
Over last 3 yearsIncreaseNo changeDecrease
Sample size
18.974.3
6.8
1,163
27.661.011.3
847
10.679.7
9.8
817
19.464.915.7
814
9.184.0
6.9
727
15.372.512.2
725
13.978.4
7.7
2,707
21.365.613.1
2,386
Source: 2003 Survey of Small Business Finances data.a. Firms with fewer than 20 employees only. See text for further description of the sample.
88 Brookings Papers on Economic Activity, Fall 2011
The results from the KFS hold more broadly in the United States. We find that small businesses within the top small business industries (those listed in table 1) actually have lower than average job creation rates. To see this, we pool employment change data from the SUSB from 2003 to 2006. These data are released as a companion to the levels reported in the SUSB annual data. Using the same administrative data, the Census Bureau measures the number of jobs created (by either expanding or new establishments) or destroyed (by either contracting or exiting establishments) at the establishment level and aggregates these into annual measures of gross job creation and destruction by industry and firm size.14 Examining industries at the four-digit level, we compute for each size category the gross job creation rate (jobs created at continuing establishments), the gross job birth rate (jobs created at newly opening establishments), and the gross job destruction rate (jobs lost at both contracting and exiting establishments). Following Steven Davis and others (1996), we define these rates as follows:
gM
e ejtMs jt
s
j ts
j ts
=+( )+, ,
,1 2
where Msjt represents a measure of job creation or destruction (either jobs
created from expansion, jobs created from births, or jobs destroyed from contracting and exiting establishments) by small businesses within industry j between period t - 1 and t, and es
jt is defined as above to be the number of employees in small businesses within industry j during period t. We again
Table 4. Changes in employment at new businesses over last 4 years, 2008a
Change in employment
>1 employee >5 employees >10 employees
Percent of firms 41.9 10.8 3.6
Source: Kauffman Firm Survey data.a. Sample consists of the 2,617 surveyed firms of all sizes that had remained in business for the 4 years
since the survey started. Firms in the sample had a median employment of 1 employee and a mean employment of 3; the number of employees at the 90th percentile was 14. All data are weighted using the sample weights provided within the survey.
14. As before, the distinction between firms (referred to as enterprises by the Census Bureau) and establishments is important. The SUSB data report expansions and contractions by firm size, by measuring employment changes at the establishment level. If Starbucks Corporation opens 100 new stores in a year and closes 50, the gross job creation and destruc-tion from these establishment births and deaths (as well as from continuing establishments) would be attributed to the 2,500+ firm size category.

erik hurst and benjamin wild pugsley 89
define small businesses to be those firms with fewer than 20 employees. Davis and others (1996) show that this specification of the growth rate has a number of desirable properties: it accommodates entry and exit, and it is equivalent to a log difference up to second order.
We use these growth rates to ask whether or not having a large fraction of small businesses in an industry can predict the degree of job creation or destruction in small businesses within that industry, conditional on aggre-gate industry characteristics. To do this, we estimate the following:
g x ZjtMs
j j t jts= + + + +γ γ µ η0 1 Γ ,
where gjtMs is either the gross job creation rate, the gross job birth rate, or
the gross job destruction rate for small firms in industry j, depending on the regression. As above, xj represents the share of small businesses in industry j out of all small businesses across all industries. Zj is a vector of industry-level controls, which include industry-wide measures of the gross job cre-ation rate, the gross job birth rate, and the gross job destruction rate, and µt is a vector of year dummy variables. The sample for this regression is all four-digit industries with nonmissing measures of Ms
jt during 2003–06. This results in 929 observations for the job creation regressions, 666 obser-vations for the job birth rate regressions, and 656 observations for the job destruction regressions. The sample sizes differ because more data at the four-digit industry level are missing for the measures of job birth and job destruction than for the job creation measure.
Table 5 reports the estimation results. We estimate each specification first giving each industry equal weight (top panel), and second weighting each industry in proportion to the share of small businesses in the industry (bottom panel). The weighted estimation is similar to one using a grouped-data estimator and would deliver the same point estimates as firm-level data if the employment shares of small firms within an industry were equal.15 The results support our earlier claim that the “typical” small busi-ness does not create jobs. The small business share of an industry has little to say about small business job creation through new small businesses, or about small business job destruction (fourth and fifth columns of table 5). However, it is a powerful predictor of weaker than average small business job creation for existing firms (first three columns). Small businesses in
15. This is a reasonable approximation since all the small firms have fewer than 20 employees, so there would be very little variation in the employment share within an industry if this regression were estimated with the underlying administrative micro data.

Tabl
e 5.
reg
ress
ions
usi
ng in
dust
ry s
hare
s of
sm
all b
usin
esse
s to
pre
dict
sm
all b
usin
ess
job
Crea
tion
and
des
truc
tiona
Dep
ende
nt v
aria
ble
Inde
pend
ent v
aria
ble
Gro
ss jo
b cr
eati
on r
ate
Gro
ss jo
b cr
eati
on r
ate
Gro
ss jo
b cr
eati
on r
ateb
Gro
ss jo
b bi
rth
rate
Gro
ss jo
b de
stru
ctio
n ra
te
Unw
eigh
ted
Indu
stry
sha
re o
f al
l sm
all b
usin
esse
s-2
.14
-1.9
8-2
.05
0.10
-0.2
3(0
.25)
(0.2
3)(0
.29)
(0.1
7)(0
.17)
No.
of
obse
rvat
ions
929
929
652
666
656
R2
0.07
70.
093
0.20
50.
351
0.35
3
Wei
ghte
d by
num
ber
of s
mal
l firm
s w
ithi
n in
dust
ryc
Indu
stry
sha
re o
f al
l sm
all b
usin
esse
s-0
.73
-0.7
3-0
.73
0.03
0.04
(0.2
7)(0
.26)
(0.3
0)(0
.24)
(0.2
6)N
o. o
f ob
serv
atio
ns92
992
965
266
665
6R
20.
420.
421
0.43
70.
588
0.53
1In
dust
ry jo
b cr
eati
on c
ontr
ols?
Yes
Yes
Yes
No
No
Indu
stry
job
birt
hs c
ontr
ols?
No
Yes
No
Yes
No
Indu
stry
job
dest
ruct
ion
cont
rols
?N
oY
esN
oN
oY
es
Sour
ce: A
utho
rs’
regr
essi
ons
usin
g po
oled
200
3–06
Sta
tistic
s of
U.S
. Bus
ines
ses
data
.a.
Sm
all b
usin
esse
s ar
e de
fined
as
thos
e w
ith fe
wer
than
20
empl
oyee
s. T
he u
nit o
f obs
erva
tion
is fo
ur-d
igit
NA
ICS
indu
stri
es. A
ll re
gres
sion
s in
clud
e fix
ed ti
me
effe
cts.
R
obus
t sta
ndar
d er
rors
are
in p
aren
thes
es.
b. S
ampl
e is
lim
ited
to in
dust
ries
that
hav
e no
nmis
sing
gro
ss jo
b bi
rth
and
dest
ruct
ion
rate
s.c.
Est
imat
es c
an b
e vi
ewed
as
grou
ped-
data
est
imat
es o
f fir
m-l
evel
job
crea
tion
or d
estr
uctio
n if
em
ploy
men
t sha
res
of s
mal
l firm
s w
ithin
an
indu
stry
wer
e eq
ual a
cros
s in
dust
ries
.

erik hurst and benjamin wild pugsley 91
industries with the largest shares of all small businesses (those with a high xj as shown in table 1) grow more slowly than the average. These results hold even when we control for each industry’s overall characteristics (com-pare the first two columns of table 5). One might be concerned that the difference between the strong effects for job creation and the absence of effects found for job births and job destruction could stem from differences in the samples across the regression. The third column of table 5 shows that such concerns are unwarranted. In this job creation regression we restrict the sample to those industries with nonmissing job birth and job destruc-tion data. The results are unaltered from those in the first column.
According to the weighted results, for each percentage-point increase in an industry’s share of small businesses, that industry’s small business job creation rate falls by a little less than three-quarters of a percentage point. To provide greater context, a 1-standard-deviation increase in xj (1.1 percentage points) reduces the job creation rate by roughly 0.8 per-centage point. The average weighted job creation rate for the sample was 14.6 percent. So a 1-standard-deviation increase in an industry’s share of small businesses reduces the industry’s small business job creation rate by about 6 percent (0.8 divided by 14.6). When industries are treated equally, a 1-standard-deviation increase in xj reduces the industry’s small business job creation rate by roughly 8 percent. All these results are robust to alter-native specifications of industry controls.
It may be surprising at first that so little job creation comes from the industries that most small business owners are likely to enter. However, this finding is consistent with an understanding of the important heteroge-neity among small businesses. Most small businesses (those highlighted in table 1) start small and stay small throughout the life of the business.
We draw three conclusions from the results in tables 2 through 5. First, there is substantial skewness across firms in the extent to which they grow over time. Although some firms do increase their employment over time, most do not. Only a small proportion of small firms add more than 10 employees over the life of the business. Reflecting this, the bulk of firms still employ fewer than 20 employees when they are mature. Second, even among new or young firms, most firms do not grow by any meaningful amount, even condi-tional on survival. Finally, some of the heterogeneity in employment growth for small firms is explained by industry. Although many mature businesses in manufacturing are quite large, the vast majority of mature businesses in other sectors, such as construction, remain quite small. The industries in which firms tend to remain small are those that tend to make up the bulk of small businesses.

92 Brookings Papers on Economic Activity, Fall 2011
We again stress that even within these small business–intensive industries there is considerable heterogeneity and skewness. The focus of this paper is on the behavior of small firms, which in our selected small business–intensive industries account for nearly half of employ-ment. John Haltiwanger, in his discussion that follows, looks closely at the other half. It turns out that in many of these industries where employ-ment in small firms is overrepresented, the firms within these industries can also be more dynamic than average. Retail trade, for example, is composed largely of small local shopkeepers and big-box stores. Job creation in this sector was almost 10 percentage points higher over 2003–05 than the average for other sectors excluding retail trade. How-ever, almost all of this job creation was due to a relatively small number of firms. The high degree of skewness, especially in these industries, thus makes analyzing the averages very deceiving. As we have shown, the typical (modal or median) small business is not creating jobs. In sec-tion VI we will return to the potential implications of these findings for public policy.
II.B. Small Business Innovation
In this subsection we document that there is also substantial heterogeneity across firms in the extent to which they successfully innovate along observ-able measures. Again, although some authors have shown that a large share of measured innovation (patent applications, for example) is attributable to small businesses, the converse is not true.16 Most small firms do not seem to innovate along those observable margins. Before proceeding, we stress that it is hard to measure all aspects of potential small business innovation using only the surveys we are analyzing. As a result, we focus on some broad mea-sures of innovation about which the surveys do provide information.
We begin by documenting that very few new firms obtain patents, trade-marks, or copyrights during the first 4 or 5 years of their existence. For this we use two data sources. First, we again use the Kauffman Firm Survey, focusing on the same sample as above. The KFS asks respondents to report separately whether they have already applied or are in the process of applying for any patents, copyrights, or trademarks. In 2008, when the firms in the sample had been in business for 4 years, only 2.7 percent of the businesses in the sample had already applied or were in the process of applying for patents (table 6). Larger shares had applied for copyrights and trademarks, but still most firms were not innovating, at least according to these crude observable measures.
16. See Acs and Audretsch (1990) and the citations therein.

erik hurst and benjamin wild pugsley 93
According to the KFS, nearly 85 percent of small businesses did not acquire a patent, trademark, or copyright during their first 4 years of existence.
We augment our analysis of patents and other measures of innovation using data from the Panel Study of Entrepreneurial Dynamics II (PSED).17 The PSED started with a nationally representative sample of 31,845 individ-uals. An initial screening survey in the fall of 2005 identified 1,214 “nascent entrepreneurs.” To be considered a nascent entrepreneur, individuals had to meet the following four criteria. First, the individual had to currently consider himself or herself as involved in the firm creation process. Second, he or she had to have engaged in some business start-up activity in the past 12 months. Third, the individual had to expect to own all or part of the new firm being created. Finally, the initiative, at the time of the initial screening survey, could not have progressed to the point that it could have been con-sidered an operating business. The goal was to sample individuals who were in the process of establishing a new business.
In the winter of 2006, after the initial screening interview, these 1,214 res-pondents were surveyed about a wide variety of activities associated with their business start-up. They were asked detailed questions about their moti-vations for starting the business, the activities they were currently under-taking as part of the start-up process, the competitive environment in which the business would operate, and their expectations about the desired future size and activities of the business. Follow-up interviews occurred annually for 4 years, so that the data also have a panel dimension.
When analyzing the PSED data, we use three samples. The first consists of all 1,214 respondents. The second includes only the 602 respondents
17. The initial wave of the PSED (PSED I) was a test run for the bigger PSED II. We do not use the initial data in our analysis. All data and documentation for the PSED can be found at the University of Michigan’s PSED website, at www.psed.isr.umich.edu/psed/data.
Table 6. innovation-related behavior of new businesses, 2004–08a
Measure of innovative activity, at year 4 of firm’s existence
Have or are applying for a
patent
Have or are applying for a
copyright
Have or are applying for a
trademark
Have either a patent, a trademark,
or a copyright
Percent of all new firms
2.7 8.9 12.3 17.3
Sample size 2,581 2,550 2,546 2,510
Source: Authors’ calculations from 2008 Kauffman Firm Survey data.a. Sample sizes differ because of different response rates to different questions. All data are
weighted using the provided survey weights.

94 Brookings Papers on Economic Activity, Fall 2011
who actually had positive revenue at the time of their first detailed inter-view in 2006. This sample distinguishes people who only said that they were planning to start a business from those who actually followed through and engaged in some market business activity. The third sample consists of the 162 respondents who had positive revenue from the same business venture in 2010, 4 years after the first interview.
With respect to innovative activity, the PSED asks three different types of questions. The first is similar to the questions in the KFS about patent, trademark, and copyright applications. However, instead of being asked about the three measures separately, in the PSED they are asked one ques-tion covering all three. As table 7 shows, only 5 percent of the new firms (6 percent of those with positive revenue) applied for patents, trademarks, or copyrights during their first few years in existence. By the fifth year of operation, surviving firms appear similar to those in the KFS, with roughly 18 percent having obtained a patent, trademark, or copyright.
Of course, patents, copyrights, and trademarks are imperfect measures of innovation. Many firms can innovate without applying for a patent, and many firms can trademark their company name without doing any real innovation. We have focused first on these measures because they are easily observable in both the KFS and the PSED. The PSED, however, also provides data on broader measures of innovation. In a separate set of
Table 7. innovation-related activities of nascent entrepreneurs, 2006 and 2010a
Percent of firms
First year of business (2006) Fifth year of business
(2010): positive revenue onlybIndicator All
Positive revenue only
Firm had applied for patent, copyright, or trademark
4.9 6.0 17.6
Firm had developed proprietary tech-nology, processes, or procedures
6.5 8.3 20.3
Owner stated that many existing firms already offer same product or service to expected customer base
35.7
43.3
39.6
Owner stated that no existing firms already offer same product or service to expected customer base
19.2
13.3
17.3
Sample size 1,214 602 162
Source: Authors’ calculations from PSED data.a. All data are weighted using the sample weights from the indicated survey year.b. Responses are those given in the 2010 survey.

erik hurst and benjamin wild pugsley 95
questions, businesses are asked directly whether they have “developed any proprietary technology, processes, or procedures.” This question results in a slightly broader measure of innovation than patent, trademark, and copy-right applications in that it conceivably covers a more fluid set of activities related to innovation in production or in the firm’s business model. Yet only 7 or 8 percent of new businesses (depending on the sample) reported that they had developed any proprietary business practices or technology during their first few years in business. Even conditional on survival 5 years later, 80 percent of firms still reported not having developed any proprietary technology, process, or procedure.18
The PSED asks one last broad question about the potential innovation taking place within the firm. This question asks about how the product or service produced by the business compares with the products and ser-vices of other producers in the firm’s market: “Right now, are there many, few, or no other businesses offering the same products or services to your [intended] customers?” The answers to this question are informative in that they indicate whether the firm is providing a new product or service to existing customers or an existing product or service to potentially new customers. Across the three samples, between 36 and 43 percent of new business owners reported providing a service similar to that of many exist-ing firms in the market to an existing customer base; these businesses, more often than not, provide a standardized service (such as plumbing) to exist-ing local customers. Fewer than 20 percent of respondents reported that no other business was providing their expected product or service to their expected customer base.
The responses to this question varied substantially across business own-ers in different industries (results not shown). For example, owners who reported starting a business in the professional, health, construction, and real estate industries were between 7.5 and 9.5 percentage points more likely to report that they were starting their business in an area where many current providers already served their expected customer base. Owners in these same industries were nearly 10 percentage points less likely to report that they were providing a new product or service or were targeting an underserved customer base.
18. One should be wary of putting too much emphasis on self-reports of innovative behavior by small businesses. However, most behavioral stories of how business owners might respond to such questions would likely lead one to believe that the innovation numbers are upper bounds on actual behavior. This would occur if the respondents were more likely to report that they were innovative even if no actual innovation was taking place within the business.

96 Brookings Papers on Economic Activity, Fall 2011
III. Ex Ante Expectations about Growth and Innovation
In this section we document that many business owners have no expecta-tion or desire to grow or innovate when they start their business. One of the strengths of the PSED is that it asks the nascent business owners about their expectations for the business, their desired future business size, and their motivations for starting the business. For example, owners of all new firms are asked which of the following two statements best describes their prefer-ence for the future size of the new business: “I want this new business to be as large as possible,” or “I want a size I can manage myself or with a few key employees.” The top row of table 8 shows the responses to this question across our three PSED samples. For the sample consisting of those whose businesses lasted to 2010, we report their expectations when they were first asked in 2006. Around three-quarters of all respondents, regardless of sam-ple, reported that they wanted to keep their business limited to at most a few key employees.
Of course, the meaning of keeping the business to “a few key employ-ees” could vary across respondents. In a separate part of the survey, the respondents are asked to state their expectation as to the firm’s employ-ment 5 years hence. Again, we report the responses for each sample when they were first asked in 2006. The median number given was either 3 or 4, depending on the sample. Even respondents at the 75th percentile expected to employ only between 6 and 10 employees. These findings indicate that not only do very few small businesses grow, but most small business own-ers do not want or expect their business to grow, when asked at the time of its formation.
The PSED also asks about expected innovative activity: business own-ers are asked, at the inception of their business, whether they expect to innovate in the future. These results, also reported in table 8, show that only roughly 15 percent of all new businesses plan to develop proprie-tary technology, processes, or procedures in the future. The numbers are slightly higher with respect to expectations about future patent, copyright, and trademark behavior. A likely reason is that many firms trademark the name of their business even if they do not apply for patents or copyrights.
Business owners in the PSED are also asked if they expect research and development to be a major priority for the business. As table 8 also shows, nearly 80 percent of all owners of new businesses reported that they had no plans for R&D to be a major priority.
The results in table 8 suggest that the observed lack of innovation and growth may be deliberate: when starting their business, most business own-

erik hurst and benjamin wild pugsley 97
ers have no plans to grow or innovate in the future. Interestingly, despite these expectations, new business owners remain committed to starting and running a firm. In the next section we examine the stated motives of nascent small business owners and explore how these motives correlate with expectations.
IV. Motivations for Starting a Business
To explore heterogeneity in founders’ motives, we again turn to the PSED data. As part of the initial survey of the PSED, the business owners were asked, “Why do [or did] you want to start this new business?” Respondents could report up to two motives. The respondents provided unstructured answers, which the PSED staff coded into 44 specific categories. We took the raw responses to the question and created five broad categories of our own: nonpecuniary reasons, reasons related to the generation of income, reasons related to the desire to develop a new product or implement a good business idea, reasons related to a lack of better job options, and all other reasons. The main responses in the nonpecuniary category include “want
Table 8. ex ante expectations and desires of nascent entrepreneurs about Future growth and innovation, 2006 and 2010a
First year of business (2006) Fifth year of
business (2010): positive revenue
onlybIndicator AllPositive revenue
only
Percent reporting that they want firm to be “as large as possible”
24.3 23.0 28.3
Expected no. of employees when firm is 5 years old
25th-percentile response 1 0 0 Median response 4 3 3 75th-percentile response 10 8 6 90th-percentile response 29 24 25Percent expecting to develop pro-
prietary technology, processes, or procedures in future
14.6
9.2
12.2
Percent expecting to apply for patent, copyright, or trademark in future
26.0 17.9 24.9
Percent expecting R&D spending to be a major priority for the business
25.7 19.5 22.8
Source: Authors’ calculations from PSED data.a. All data are weighted using the sample weights from the indicated survey year. Sample sizes differ
slightly from those in table 7 because not all respondents provided responses to all the questions.b. Responses are those given in the 2006 survey.

98 Brookings Papers on Economic Activity, Fall 2011
to be my own boss,” “flexibility/set own hours,” “work from home,” and “enjoy work, have passion for it/hobby.” The main responses in the gen-erating income category include “to make money” or “need to supplement income.” The main responses in the new product or business idea category include “satisfy need,” “there is high demand for this product/business,” “untapped market,” and “lots of experience at work.” Appendix table A2 lists the 44 specific PSED categories, grouped into our five broad cate-gories. For each specific category, the table reports the number of PSED respondents citing a motive in that category either at first or at second mention.
The columns labeled “First response” in table 9 show the distribution of the first responses given by each respondent by broad category, and the columns labeled “Either response” show the distribution of all responses, for each of the three PSED samples. Three things should be noted before we discuss the results. First, only 60 percent of respondents provided a sec-ond response. Second, given that the respondents could provide any answer they wanted, the first and the second response often fell into the same broad category. (For example, many respondents answered “want to be my own boss” and “flexibility/set own hours,” both of which we record in the non-pecuniary benefits category.) Third, the sum of the numbers in the first column exactly equals 100 percent whereas the sum of the second column exceeds 100 percent, given that respondents could offer a second response.
The main result from table 9 is that although there is substantial heteroge-neity across respondents in their reported primary reason for starting a small business, nonpecuniary benefits play a leading role for most respondents. This result is consistent across all three PSED samples. For example, between 35 and 37 percent of first responses across all samples referred to nonpecuni-ary reasons for the business start-up decision. Combining the first and second responses, we find that over half of all respondents in all samples stated that nonpecuniary benefits were an important component of their decision.
The second most commonly expressed motivation was having a good busi-ness idea or creating a new product. Roughly 30 percent of first responses and roughly 38 percent of combined responses fell in this category. Many respondents also reported that they wanted to generate income: answers in this broad category represented roughly 20 percent of first responses and 34 percent of combined responses. Finally, very few respondents reported start-ing the business because of a lack of other employment options.19
19. Ardagna and Lusardi (2008) show that the lack of employment options is a much more important motivation for starting a small business in developing economies.

Tabl
e 9.
dis
trib
utio
n of
rea
sons
Off
ered
by
nas
cent
ent
repr
eneu
rs fo
r st
artin
g a
bus
ines
sa
Per
cent
All
Pos
itiv
e re
venu
e on
ly,
2006
Pos
itiv
e re
venu
e on
ly,
2010
Rea
son
for
star
ting
bus
ines
sF
irst
re
spon
seE
ithe
r re
spon
seb
Fir
st
resp
onse
Eit
her
resp
onse
Fir
st
resp
onse
Eit
her
resp
onse
Non
pecu
niar
y re
ason
s35
.350
.537
.653
.935
.052
.4T
o ge
nera
te in
com
e19
.534
.121
.436
.617
.632
.4H
ad g
ood
busi
ness
idea
or
to c
reat
e ne
w p
rodu
ct32
.240
.628
.334
.933
.837
.5L
ack
of o
ther
em
ploy
men
t opt
ions
2.2
3.8
2.6
4.0
2.6
4.3
Oth
er10
.815
.710
.215
.511
.014
.7N
o. o
f re
spon
dent
s1,
214
602
162
Sour
ce: A
utho
rs’
calc
ulat
ions
fro
m P
SED
dat
a.a.
The
tabl
e us
es th
e sa
me
data
set
and
sam
ple
cons
truc
tion
as in
tabl
e 7.
All
data
are
wei
ghte
d us
ing
the
sam
ple
wei
ghts
fro
m th
e in
dica
ted
surv
ey y
ear.
Res
pond
ents
wer
e as
ked,
“W
hy d
o [o
r di
d] y
ou w
ant t
o st
art t
his
new
bus
ines
s?”
and
coul
d gi
ve u
p to
two
resp
onse
s in
thei
r ow
n w
ords
. All
data
are
wei
ghte
d us
ing
the
sam
ple
wei
ghts
fro
m
the
indi
cate
d su
rvey
yea
r.b.
Per
cent
ages
sum
to le
ss th
an 2
00 p
erce
nt b
ecau
se a
bout
one
-qua
rter
of
resp
onde
nts
did
not p
rovi
de a
sec
ond
resp
onse
and
, of
thos
e w
ho d
id, s
ome
prov
ided
a r
espo
nse
that
was
cla
ssifi
ed in
the
sam
e br
oad
cate
gory
as
the
first
. See
app
endi
x ta
ble
A1
for
a m
ore
deta
iled
clas
sific
atio
n of
res
pons
es.

100 Brookings Papers on Economic Activity, Fall 2011
In the remainder of this section, we explore to what extent the respon-dents’ reported motives predict their expected and actual values on the growth and innovation measures. We focus on two motives in particular: the desire to implement a good business idea or create a new product, and nonpecuniary motives. The first is the motive most closely associated with the traditional role of an entrepreneur, whereas the second is typi-cally ignored or considered only anecdotally. We define for each motive a dummy variable that is equal to 1 if that motive was identified in either the first or the second response. Then we run a simple regression of the various measures described in tables 7 and 8 on the two dummy variables.20 Since a motive can be identified in either mention, it is possible for both dummies to equal 1.
Table 10 presents the results of these regressions. We show results for the first two PSED samples only, in the top and bottom panels. Given the small size of the third sample (those still earning revenue in 2010), statisti-cal significance is an issue in interpreting the coefficients. However, even in this sample the signs of the coefficients display patterns very similar to those for the other two samples.
In the top panel of table 10, which shows the results for all respondents, the first column reports the constant from each regression. This represents the unconditional mean for those individuals who did not report starting their business for either nonpecuniary motives or motives related to creating a new product or implementing a new business idea. The next two columns show the coefficients on the two dummy variables defined above. These coefficients can be interpreted as the percentage difference in probability of the outcome (or difference in the employment forecast) relative to respon-dents that mentioned neither the new product or business idea motive nor nonpecuniary motives.21 The fourth column shows the difference between the coefficients on the two dummy variables. This can be interpreted as the difference in probability of the outcome (or employment) for those business owners who mentioned exactly one of those motives. For exam-ple, respondents who mentioned creating a new product or implementing a business idea and did not mention nonpecuniary motives were 13 per-cent less likely than those that specified nonpecuniary motives but not a
20. Estimating the saturated version of this regression with an interaction term had almost no effect on the point estimates and p values shown in table 10. We also estimated the same regression with each category that could be named in either response represented. This also did not change the results.
21. Respondents that mentioned neither motive would have specified either income rea-sons (the vast majority), lack of other options, or some other motive.

Tabl
e 10
. r
egre
ssio
ns e
xpla
inin
g n
ew b
usin
esse
s’ e
xpec
tatio
ns a
nd in
nova
tive
beh
avio
r by
dif
fere
nces
in m
otiv
atio
na
Dep
ende
nt v
aria
ble
Con
stan
tb
Coe
ffici
ent o
n “
crea
te n
ew
prod
uct”
dum
myc
Coe
ffici
ent o
n “
nonp
ecun
iary
m
otiv
es”
dum
myd
Dif
fere
nce
betw
een
coef
ficie
nts
p va
lue
of
diff
eren
ce
All
res
pond
ents
, 200
6O
wne
r st
ated
that
man
y ex
isti
ng fi
rms
alre
ady
offe
r sa
me
prod
uct o
r se
rvic
e to
exp
ecte
d cu
stom
er b
ase
0.38
0 -0
.082
(0.0
35)
0.04
9(0
.035
)0.
131
<0.
01
Ow
ner
stat
ed th
at n
o ex
isti
ng fi
rms
alre
ady
offe
r sa
me
prod
uct o
r se
rvic
e to
exp
ecte
d cu
stom
er b
ase
0.19
0 0.
037
(0.0
29)
-0.0
49(0
.028
)-0
.086
0.
01
Fir
m h
as d
evel
oped
pro
prie
tary
tech
nolo
gy, p
roce
sses
, or
pro
cedu
res
0.08
4 0.
010
(0.0
19)
-0.0
41(0
.018
)-0
.051
0.
01
Fir
ms
expe
cts
to a
pply
for
pat
ent,
copy
righ
t, or
trad
e-m
ark
in f
utur
e0.
230
0.10
4(0
.034
)0.
010
(0.0
33)
-0.0
940.
01
Per
cent
of
firm
s re
port
ing
that
they
wan
t to
be “
big”
0.28
80.
036
(0.0
35)
-0.0
47(0
.033
)-0
.083
0.
03
Exp
ecte
d no
. of
empl
oyee
s w
hen
firm
is 5
yea
rs o
ld
(75t
h pe
rcen
tile
)8
4.0
(2.3
)-2
.0(2
.3)
-6.0
0.
03
Exp
ecte
d no
. of
empl
oyee
s w
hen
firm
is 5
yea
rs o
ld
(90t
h pe
rcen
tile
)25
15
.0(5
.3)
-10.
0(5
.1)
-25.
00.
01
(con
tinu
ed)

Res
pond
ents
wit
h po
siti
ve r
even
ue, 2
006
Ow
ner
stat
ed th
at m
any
exis
ting
firm
s al
read
y of
fer
sam
e pr
oduc
t or
serv
ice
to e
xpec
ted
cust
omer
bas
e0.
508
-0.1
12(0
.053
)0.
020
(0.0
51)
0.13
2 0.
02
Ow
ner
stat
ed th
at n
o ex
isti
ng fi
rms
alre
ady
offe
r sa
me
prod
uct o
r se
rvic
e to
exp
ecte
d cu
stom
er b
ase
0.13
0 0.
059
(0.0
41)
-0.0
24(0
.036
)-0
.083
0.
05
Fir
m h
as d
evel
oped
pro
prie
tary
tech
nolo
gy, p
roce
sses
, or
pro
cedu
res
0.09
3 0.
027
(0.0
29)
-0.0
51(0
.028
)-0
.078
0.02
Fir
ms
expe
cts
to a
pply
for
pat
ent,
copy
righ
t, or
trad
e-m
ark
in f
utur
e0.
161
0.06
7(0
.045
)0.
054
(0.0
41)
-0.0
130.
77P
erce
nt o
f fi
rms
repo
rtin
g th
at th
ey w
ant t
o be
“bi
g”
0.26
2 0.
042
(0.0
49)
-0.0
28(0
.046
)-0
.070
0.
17
Exp
ecte
d no
. of
empl
oyee
s w
hen
firm
is 5
yea
rs o
ld
(75t
h pe
rcen
tile
)5
5.0
(1.1
)0.
0(1
.1)
-5.0
0.
01
Exp
ecte
d no
. of
empl
oyee
s w
hen
firm
is 5
yea
rs o
ld
(90t
h pe
rcen
tile
)20
20
.0(8
.0)
-10.
0(7
.7)
-30.
0 0.
01
Sour
ce: A
utho
rs’
regr
essi
ons
usin
g da
ta f
rom
the
PSE
D.
a. R
obus
t sta
ndar
d er
rors
are
in p
aren
thes
es.
b. R
epre
sent
s th
e m
ean
for
resp
onde
nts
who
did
not
rep
ort s
tart
ing
thei
r bu
sine
ss f
or e
ither
non
pecu
niar
y or
new
pro
duct
mot
ives
.c.
Var
iabl
e eq
uals
1 if
the
resp
onde
nt s
tate
d a
new
pro
duct
mot
ive
as a
rea
son
for
star
ting
the
busi
ness
.d.
Var
iabl
e eq
uals
1 if
the
resp
onde
nt s
tate
d a
nonp
ecun
iary
mot
ive
as a
rea
son
for
star
ting
the
busi
ness
.
Tabl
e 10
. r
egre
ssio
ns e
xpla
inin
g n
ew b
usin
esse
s’ e
xpec
tatio
ns a
nd in
nova
tive
beh
avio
r by
dif
fere
nces
in m
otiv
atio
na (C
onti
nued
)
Dep
ende
nt v
aria
ble
Con
stan
tb
Coe
ffici
ent o
n “
crea
te n
ew
prod
uct”
dum
myc
Coe
ffici
ent o
n “
nonp
ecun
iary
m
otiv
es”
dum
myd
Dif
fere
nce
betw
een
coef
ficie
nts
p va
lue
of
diff
eren
ce

erik hurst and benjamin wild pugsley 103
new product or business idea to enter a market already offering the same product or service. The final column shows the p value of a two-sided test for equality of the two coefficients. The bottom panel of table 10 reports results for the same regression using the second PSED sample (respondents with positive revenue in 2006).
The results of these regressions show that individuals who start their busi-ness because they think they have a good business idea or because they want to create a new product are much more likely to want to grow, to want to innovate, and to actually innovate. Conversely, those who start a business for nonpecuniary reasons are less likely to want to grow, to want to innovate, and to actually innovate. As mentioned above, those reporting non pecuniary motives were much more likely to enter an already crowded market than those with a new business idea or product. Likewise, they were 5.1 percentage points less likely to report that they had already developed some proprietary technology or processes as part of their business start-up, and 9.4 percentage points less likely to report expecting to get a patent, trademark, or copyright in the future. The p values on both these differences are 0.01.
As can also be seen in table 10, those who reported starting their business because they had a new business idea or product were much more likely to want the business to have a higher number of employees in 5 years, and to want to grow their business, than those who started for nonpecuniary reasons. For example, those who started because they had a good business idea were 8.3 percentage points less likely to report wanting to keep their business to a few key employees.
We wish to highlight a few additional results not shown in table 10. First, there is little statistical difference in survival rates to 2010 between those business owners who reported nonpecuniary benefits as a primary motivation and those who reported a new business idea or product as the reason they started. If anything, in some samples and specifications, those who reported nonpecuniary benefits as a primary motivation had a higher probability of survival.22 Second, there is no statistical difference in actual firm size in 2010 across the different groups. The reason is that nearly all firms had only 1 or fewer employees even 4 years after the business started. There is not much variation across the firms in this small sample of survivors. This is consistent with the results in table 3 showing that most
22. This would be consistent with a model in which nonpecuniary benefits are a large part of the return to small business formation, as shown in Pugsley (2011b). In that model, individuals will be willing to stay in business even if they get a bad productivity draw, because for them the pecuniary returns are only a small portion of the total returns to business entry.

104 Brookings Papers on Economic Activity, Fall 2011
surviving firms remain very small. Finally, there is some variation across industries in the relative importance of nonpecuniary reasons versus want-ing to implement a new business idea or create a new product: owners of businesses in the finance industry were statistically much more likely, relative to other industries, to report nonpecuniary benefits as an important motive, and a similar pattern appears among those starting businesses in retail trade. Two industries where the dominant reason to start the business involved a new product or business idea are manufacturing and wholesale trade. The results lack enough statistical precision to allow decisive conclu-sions about the other industries.
The results in this section show that there is substantial ex ante hetero-geneity across individuals in their reasons for starting a business. Only a fraction of firms are started because the owner has a good business idea or a new product to bring to market. However, these business owners at the time of inception are more likely to report a desire to grow and inno-vate and to achieve higher actual realizations of innovation. Many owners, in contrast, report nonpecuniary benefits as an important driver of their behavior. Incorporating such ex ante heterogeneity into models of small business dynamics will almost certainly alter conclusions about the impor-tance of ex post measures of heterogeneity such as stochastic productivity draws or binding financial constraints. We turn to this discussion in the next section.
V. Why Heterogeneity in Starting Motives or Expectations Can Matter
There are a number of reasons why ignoring the ex ante heterogeneity in motives and expectations may matter. Here we sketch how this ex ante heterogeneity confounds inferences in a number of relevant contexts. We consider two literatures: the literature on firm dynamics, and the literature on measuring the private equity risk-return trade-off. Finally, we assess how our work relates to recent papers documenting the nature and growth patterns of small businesses in developing economies.
V.A. Firm Dynamics
In theoretical models, differences in employment growth across firms are attributed to either differences in entrepreneurial ability (for example, Lucas 1978), differences in realized productivity draws (for example, Simon and Bonini 1958, Jovanovic 1982, Pakes and Ericson 1989, Hopenhayn 1992), differences in access to capital markets (for example, Evans and Jovanovic

erik hurst and benjamin wild pugsley 105
1989, Vereshchagina and Hopenhayn 2009), or some combination of the above (for example, Clementi and Hopenhayn 2006). Although all of the above are potential drivers of firm dynamics, the results we have docu-mented here suggest that these stories are at best incomplete. Differences in luck, talent, or credit market access are not the only determinants of firm size. As we have shown, there is also substantial ex ante heterogeneity in the desires and expectations of new business owners with respect to the future growth of their business. Some firms do not grow or innovate simply because they do not want to grow or innovate.
What drives these differences in ex ante expectations and desires? Our results point to at least two potential channels. First, many small business owners start their business, in part, because of the nonpecuniary benefits associated with small business ownership. As seen from the PSED data, many small business owners report starting their business because they value the control and flexibility that small business ownership offers. If these benefits diminish with firm size, individuals who start for these rea-sons will prefer to keep their business small. We do find evidence of such correlations in the data: those business owners who reported starting their business in part for nonpecuniary reasons were more likely to want to keep their firm small well into the future.
Second, some businesses may stay persistently small because they are in industries where the naturally efficient scale is small. Many small busi-ness owners are dentists, plumbers, real estate and insurance agents, small shopkeepers, and beauticians. Within these industries, the productivity of the firm is directly linked to the individual’s skill set. Given that the fixed costs of production may be small relative to the variable costs, optimal firm size may be quite small. As a result, firms in these industries may start with no expectations of growth.23 These firms may be particularly attractive to business owners driven by nonpecuniary motives.
Pugsley (2011a, 2011b) formalizes the insights put forth in this paper by writing down models of small business formation and small business dynamics where individuals are allowed to differ in the utility they derive
23. This idea is consistent with recent research by Holmes and Stevens (2010) which attributes the variation in firm size within narrowly defined manufacturing industries to dif-ferences between large plants that produce standardized goods and small plants that make custom or specialty goods. Similar differentiated-product stories can also potentially explain within-industry size variation in other narrow industries such as retail trade (big-box stores versus mom-and-pop stores), health care (small physician practices versus hospitals), or law-yers (small law offices versus big corporate law firms). Explaining the variation in within-industry firm size is an interesting avenue for future research.

106 Brookings Papers on Economic Activity, Fall 2011
from small business ownership and where industries differ in their natural returns to scale. In these models, many of the predictions of the standard models of firm dynamics can be replicated in a model with no differences across firms in entrepreneurial ability and no difference across firms in their financing constraints. Two important results emerge from these papers. First, Pugsley (2011a) shows that the existence of nonpecuniary benefits can generate a positive relationship between wealth and starting a business, by making business ownership a normal good that wealthier individuals “purchase” as their marginal utility of consumption diminishes. Second, Pugsley (2011b) shows that there is not a one-for-one mapping between the distribution of firm size and productivity draws (like the ones emphasized in much of the literature outlined above) when industries differ in their fixed costs and owners have a preference for keeping their business small. This finding cautions against using unconditional firm-level dynam-ics to estimate a process for entrepreneurial productivity.
Finally, much of the empirical work on firm dynamics proceeds either by studying the universe of firms or by focusing on a sector thought to be representative of that universe (typically manufacturing). It is in this empirical context that the applicability of Gibrat’s law (for example, Sutton 1997), which states that firm growth rates are on average independent of size, or of Zipf’s law, which states that the distribution of firm sizes appears to follow a particular power law (for example, Gabaix 2009), is frequently demonstrated. Why these empirical regularities appear at the aggregate level is an interesting question. However, consistent with Pugsley (2011b), that is not to suggest that imposing this structure on a particular industry, or assuming a representative industry typified by manufacturing, is appro-priate. The concentration of small businesses varies considerably across industries, and the heterogeneity we consider is especially important for the industries we highlight in this paper. There is considerable cross-industry variation in the distribution of firm sizes, even conditional on average firm size, as figure 3 illustrated for broad industry groupings.
V.B. Understanding the Risk-Return Trade-off
A separate literature assesses the risk-return trade-off of small business owners. For example, Tobias Moskowitz and Annette Vissing-Jorgensen (2002) document that the returns to investing in private equity (business ownership) are no higher than the returns to investing in public equity, despite the poor diversification and higher risk. Their focus is only on the pecuniary returns of private business investment, and their corresponding analysis spans a large class of businesses, many of which are the small

erik hurst and benjamin wild pugsley 107
businesses we study here. However, even among venture-backed start-ups, which are a tiny fraction of small businesses, the risk-return trade-off looks poor. Robert Hall and Susan Woodward (2010) show that even among the highly skilled population of venture capital–backed entrepreneurs, potential entrepreneurs would be roughly indifferent between salaried employment and launching a venture-backed start-up, considering the high idiosyncratic risk of the payoffs to entrepreneurship, at modest levels of risk aversion and wealth.
Not surprisingly, a model with nonpecuniary benefits can help to explain these findings. If there are private benefits to small business ownership (relative to allocating effort to the labor market), the measured pecuniary return could be lower than the total return. Our results above suggest that for many individuals, nonpecuniary benefits are an important motive for starting their small business. Although the results above are based on sur-vey reports, they are consistent with the work of Barton Hamilton (2000) showing that the median small business owner receives less in accumulated earnings over time than he or she would in paid employment.24
Overall, our results suggest that for many individuals, nonpecuniary benefits could be an important factor driving their small business forma-tion. Incorporating such preferences into models of small business forma-tion can alter the assessment of the risk-return trade-off of small business ownership.
V.C. Small Businesses in Developing Economies
Recent work has emphasized the fact that most small businesses in devel-oping economies do not grow, do not innovate, and are started because of a lack of jobs in the larger firms within the economy. For example, La Porta and Shleifer (2008) examine the importance of the informal sector in developing economies. They conclude that, on average, the small firms that populate the informal sector in developing economies are much less productive than similar small firms in the formal sector. Given the low quality of the inputs (including human capital) into their production, it is not surprising that these small informal firms do not grow or innovate in any observable way. Banerjee and Duflo (2011) document the existence
24. Hamilton’s (2000) analysis does not take into account the possibility of under-reporting of income by the self-employed. Hurst, Li, and Pugsley (2010) show that such underreporting is important. Although Hamilton’s results are weaker when underreporting is accounted for, it still appears that the median self-employed individual takes a pecuniary earnings loss when becoming self-employed.

108 Brookings Papers on Economic Activity, Fall 2011
of “reluctant entrepreneurs” in developing economies. They find that most individuals who own a small business in the developing countries they analyze do not grow, are not profitable, and often enter because of the lack of jobs in larger, established firms.
The results in the present paper both complement this literature and show that different mechanisms are at play in a developed country like the United States. As in developing economies, it is true that most small businesses in the United States do not grow. However, the reasons for start-ing small businesses and the nature of small business owners seem quite different in the United States than in developing countries. Many U.S. small business owners are highly skilled (lawyers, doctors, dentists, and others). There is little relationship between formal years of schooling and either the propensity for small business entry or small business survival. Additionally, as shown above, very few U.S. small business owners (fewer than 4 percent) report starting a business because of a lack of employment options. In other words, it does not appear that U.S. small business owners are “reluctant entrepreneurs.”
Overall, our results showing that most small businesses in the United States do not want to grow or innovate is consistent with others’ findings for small businesses in developing economies, but the underlying reasons may be very different. A more formal analysis of the similarities and differ-ences between small businesses within developed and developing econo-mies would be a worthy area for future research.
VI. Policy Implications
Economic arguments for subsidizing small businesses hinge on the claim that small businesses are important contributors to aggregate innovation and growth but that market forces alone fail to allocate sufficient resources to the sector. These market failures may stem from technological spillovers ignored by entrepreneurs, or from financial constraints that inhibit an optimal quan-tity of capital from reaching the small business sector. The subject of entre-preneurship and technological spillovers is well studied in the endogenous growth literature (for example, Audretsch, Keilbach, and Lehmann 2006, Acs and others 2009). If a substantial portion of economy-wide R&D occurs in small firms, the social returns to their entrepreneurship could far exceed the private returns. Charles Jones and John Williams (1998), for example, find the optimal level of investment in R&D to be two to four times the observed level. Additionally, subsidizing small businesses may be appropri-ate if liquidity constraints or other financial market imperfections prevent
erik hurst and benjamin wild pugsley 109
small businesses from securing the financing they need to bring their innova-tions to market (Evans and Jovanovic 1989, Evans and Leighton 1989).
In the belief that there are social spillovers from small business innova-tion or that small businesses face liquidity constraints, many developed economies have enacted policies that favor small businesses relative to established firms. The subsidies to small businesses come in two potential forms. The first are direct subsidies, where the explicit intent is to promote small business activity. Within the United States, for example, small busi-ness subsidies include subsidized or guaranteed loans, access to special lending programs, exemption from various regulations, preferential treat-ment when awarding government contracts, and preferential treatment through the tax code.25 Adam Looney, in his comment on our paper that follows, discusses a number of these public small business subsidies in the United States. These subsidies are often linked explicitly to firm size: only firms with fewer than a certain number of employees are eligible. As a result, many of these subsidies promote small business entry but do not promote small business growth, because if the firms grow beyond a certain size, the subsidy no longer applies.
Subsidies of the second type are indirect. For example, because non-pecuniary benefits are not taxed, sectors where such benefits are a larger fraction of total compensation are effectively tax preferred relative to other sectors. To the extent that small business ownership offers larger nonpecu-niary benefits relative to owning a larger business or being a wage worker, the small business sector would be tax preferred even if there were no other direct subsidies. Additionally, a large literature shows that small business owners are much more likely than wage and salary workers to underreport their income to tax authorities.26 If it is easier to underreport income if one owns a small business, the small business sector again would be tax pre-ferred relative to other sectors even if there were no additional direct sub-sidies. The important point is that although policymakers and researchers often invoke the potential benefits of direct small business subsidies, there is very little quantitative research documenting the actual benefits and costs of these subsidies. The results in this paper suggest that the potential costs may be nontrivial.
These potential costs come from two sources. First, as we show above, the bulk of small businesses report ex ante that they do not want either to
25. See De Rugy (2005) for a detailed discussion of the various ways the U.S. govern-ment provides subsidies to U.S. small businesses.
26. See Hurst, Li, and Pugsley (2010) for a recent discussion of this literature.

110 Brookings Papers on Economic Activity, Fall 2011
grow or to innovate. And, as anticipated, most small firms do not grow or innovate. Linking small business subsidies to firm size may support the handful of firms that eventually turn into Googles or Microsofts, but it also encourages the entry of real estate agents, small law firms, and small construction firms, among others, for which the social spillovers and growth potential may be much smaller. To the extent that these subsidies alter the behavior of firms that start for reasons unrelated to growth and innovation, the policies can be distortionary by allocating more resources to the small business sector than is optimal. Second, if the benefits associated with sub-sidizing small business activity come from the small businesses actually growing, yet the subsidies are linked to firm size, they may actually prove counterproductive by inhibiting firm growth. If a firm grows beyond a cer-tain size, the small business subsidy no longer applies, and therefore the firm has an incentive to remain small.
A companion paper (Pugsley 2011a) illustrates the potential costs of small business subsidies in a simple static general equilibrium model of small business formation and occupational choice. Within the model, indus-tries differ in their natural return to scale. Households differ in the size of the nonpecuniary benefit they receive (in flow utility) from starting a busi-ness. To highlight the potential costs of subsidizing small business activity in the model, it is assumed that there are no differences across individuals in terms of talent, no social spillovers from small business formation, and no liquidity constraints preventing firm formation. These extreme assumptions allow one to focus on the potential costs of subsidizing small businesses in a world where individuals get non pecuniary benefits from small firm own-ership. Individuals in the model can allocate their labor either to running a business or to working for some other business. Household-run businesses cannot grow to their efficient scale without forfeiting the utility flow.
The model makes many predictions that can inform researchers and policymakers about the potential costs of small business subsidies. First, subsidizing small business (and funding those subsidies with taxes on labor income) will distort the allocation of production within the economy toward small businesses. Individuals choosing to start a small business trade off the size of their nonpecuniary benefits from owning a small business with the loss in wages they incur from forgoing the benefits of increased returns to scale in production. When small business activity is directly subsidized, the economy as a whole becomes less productive, given that individuals respond by choosing to work in small (subsidized) self-owned firms rather than establishing larger firms that can produce at lower average cost by

erik hurst and benjamin wild pugsley 111
exploiting the returns to scale. Notice that such distortions could occur even in a world where there are no direct subsidies to small businesses, only the indirect subsidies discussed above.
Moreover, in such a model where the nonpecuniary benefits of small business ownership are a normal good, the subsidies to small businesses are regressive. The reason is that, in a world without small business sub-sidies, high-wealth individuals are much more likely than others to start a business, because they are more able to afford (in utility terms) forgoing the benefits of increased returns to scale when they start their business. For the wealthy, a small business subsidy is simply a transfer tied to activity that they were more likely than others to do anyway. Not only does the existence of nonpecuniary benefits to small business ownership result in subsidies being welfare reducing, but lower-wealth households suffer more from the subsidy than do higher-wealth households.
To our knowledge, no empirical work evaluates whether subsidizing small businesses results in positive net present value. Addressing this question would seem to be a very important area for future research. Our work suggests that subsidies may be less distortionary if they are targeted at growth and innovation rather than mostly linked to firm size. Such poli-cies could address the concerns raised by our results in at least two ways. First, we have shown that most small businesses operate in industries with potentially smaller natural scales of production. Business owners with little intention to grow or innovate may select into these industries for that very reason. If the subsidy is focused on the intensive margin, it is more likely to be taken up by a business owner focused on growth or innova-tive activity. Subsidies could lower the cost of credit for existing firms, and by increasing their value entice productive entrepreneurs with high wage employment opportunity costs. Second, if nonpecuniary compen-sation is independent of the scale of the firm, the incidence of an expan-sion subsidy would be undistorted by nonpecuniary benefits. If anything, nonpecuniary benefits may help separate businesses that want to grow from businesses that would prefer to remain small. Of course, there may be other social virtues to noninnovative small businesses, such as support-ing communities and neighborhoods, which are aided by subsidizing the entry and exit margins. However, when targeting job creation or innova-tive risk taking, our findings suggest caution when supporting businesses purely on the basis of size. At a minimum, more research is necessary to better understand both the costs and the benefits of subsidizing small business activity.

112 Brookings Papers on Economic Activity, Fall 2011
VII. Conclusion
In this paper we have shown that there is substantial skewness in the desires and expectations of individuals who start small businesses. The vast majority of small business owners do not expect to grow, report not wanting to grow, expect never to innovate along observable dimensions, and report not wanting to innovate along observable dimensions. We show that there is also substantial heterogeneity in individuals’ reported reasons for starting their business. In particular, only slightly more than one-third of new business owners (on the eve of their start-up) reported that they were starting their business because they had a new product or service that they wanted to bring to market. Instead, the most common reason given for starting a business was the existence of nonpecuniary benefits. Individu-als reported that they like being their own boss and like the flexibility that small business ownership provides.
Our results suggest that much of the current literature has overlooked an important component of many small businesses. Essentially all of the cur-rent literature on firm dynamics explains the ex post distribution of firm size with models emphasizing differences in entrepreneurial talent, differences in entrepreneurial luck, and differences in access to credit markets. The results in this paper, however, suggest that another factor may be at play: many small business owners simply do not wish to grow big or to innovate along observable dimensions in any meaningful way. The paper shows two potential reasons for the ex ante differences in desires and expectations with respect to future growth. First, the natural scale of some industries may be quite small. For example, the fixed costs to become a plumber, bar-ber, lawyer, or insurance agent may be small relative to the variable costs, making the returns to scale quite small. Second, the existence of nonpecu-niary benefits of owning a small business, such as increased flexibility and control, may induce individuals to forgo some natural benefits of increased scale in exchange for higher utility. Regardless of the exact reason, most individuals who start a small business have little desire or expectation to grow their business beyond a few employees.
Recognizing these characteristics common to many small businesses has immediate policy implications. Often subsidies targeted at increasing innovative risk taking and overcoming financing constraints are extended to small businesses generally. Our analysis cautions that this treatment may be misguided. We believe that these targets are better reached through lowering the costs of expansion, so that they are taken up by the much smaller share of small businesses that do aspire to grow and inno-
erik hurst and benjamin wild pugsley 113
vate. In fact, the U.S. Small Business Administration already partners with venture capitalists whose high-powered incentives are aligned with finding these small businesses with a desire to be in the tail of the firm size distribution. We also think that a missing component of the academic and policy discussion is a formal cost-benefit analysis of small business subsidies. To do this, more work is needed on the potential frictions limit-ing small business growth and on the externalities associated with small business growth.
Lastly, our results suggest that it is often inappropriate for research-ers to use the universe of small business (or self-employment) data to test standard theories of entrepreneurship. Most small businesses do not match the standard conceptual measures of entrepreneurship, which focus on the desire to innovate or grow. Researchers interested in testing such specific theories of entrepreneurship may need to use more special-ized data sets such as those that track small businesses seeking venture capital funding.
Table A1. nonemployer Firms by industry, 2007
IndustryPercent of all
nonemployer firmsa
Professional, Scientific, and Technical Services 14Other Services (Except Public Administration) 14Construction 12Real Estate and Rental and Leasing 11Retail Trade 9Administrative and Support and Waste Management 8Health Care and Social Assistance 8Arts, Entertainment, and Recreation 5Transportation and Warehousing 5Finance and Insurance 4Education Services 2Wholesale Trade 2Manufacturing 2Information 1Accommodation and Food Services 1Agriculture, Forestry, Fishing and Hunting 1Mining, Quarrying, and Oil and Gas Extraction 0Utilities 0
Source: Authors’ calculations from Census data at www.census.gov/econ/nonemployer/index.html.a. Percents do not sum to 100 because of rounding.
a p p e n d i x

114 Brookings Papers on Economic Activity, Fall 2011
Table A2. reasons reported by nascent entrepreneurs for starting a businessa
No. of respondents giving indicated reason
Reason First response Second responseb
Nonpecuniary reasonsBe own boss; tired of working for others 80 75Flexibility; more free time; set own hours 26 22Stay home with children; work from home 33 12Enjoy the work, have passion for it; hobby 122 96Job security/financial independence 34 14Try new career; charge career; do something new 24 10Creative; do creative work; creative outlet 9 5Better life 3 0Lifelong ambition 24 10Challenge 3 3Personal growth 2 8To do more fulfilling work 2 3Other lifestyle references 20 7Other work desirability references 20 7
To generate incomeIncome; to make money 117 93Extra income 50 20Need supplemental income 8 6Retired—need to supplement income 8 3Income for educational expenses 1 3Income for retirement 11 8To leave business/money to children 5 4Unlimited income potential; good money 22 19Potential to make more money working for self 7 12Other income references 23 22
Had a good business idea or to create new productTake advantage of opportunity 23 17High demand for products/business; satisfy need 75 30Market opportunity; untapped market; shift in market 42 17New technology/product/service 110 3Good product/faith in product 13 5Expansion of old/current business 23 2Good business opportunity 1 2Lots of experience at this type of work; background
in field; knowledge129 25
Have formal training/education in field 21 13Have talent in field, area of expertise; ability to do it 23 23Other business opportunity references 33 21
Lack of employment optionsCannot find employment elsewhere; lost job 18 8Disabled/injured/sick and cannot work elsewhere 18 12
(continued)

erik hurst and benjamin wild pugsley 115
ACKNOWLEDGMENTS We would like to thank Mark Aguiar, Fernando Alvarez, Jaroslav Borovicka, Augustin Landier, Josh Lerner, E. J. Reedy, Jim Poterba, Sarada, Andrei Shleifer, Mihkel Tombak, and the editors, as well as seminar participants at Boston College, the 2011 Duke/Kauffman Entrepre-neurship Conference, the Federal Reserve Bank of Minneapolis, Harvard Busi-ness School, the Institute for Fiscal Studies, the 2011 International Industrial Organization Conference, the London School of Economics, the Massachu-setts Institute of Technology, the 2010 NBER Summer Institute Entrepreneur-ship Workshop, Pennsylvania State University, Stanford University, and the University of Chicago for comments. We gratefully acknowledge the financial support provided by the George J. Stigler Center for the Study of Economy and the State as well as the financial support provided by the Brookings Institu-tion. Additionally, Erik Hurst is grateful for the financial support provided by the University of Chicago’s Booth School of Business, and Benjamin Pugsley expresses thanks for the financial support from the Ewing Marion Kauffman Foundation. Certain data used in this paper are derived from the Kauffman Firm Survey release 3.1 public-use data file. Any opinions, findings, and con-clusions or recommendations expressed in this material are those of the authors and do not necessarily reflect the views of the Ewing Marion Kauffman Foun-dation. The authors report no conflicts of interest.
Retired 14 8Friend/family member had an idea and started a
business25 9
Inheritance 5 1Believe in value of work; think business is important 4 1Help others; help community 32 31Aid in economy; economic development 9 1Other reasons 51 20
Source: PSED data.a. Respondents in the initial wave only of the PSED were asked, “Why do [or did] you want to start
this new business?” and could give up to two responses in their own words. PSED staff then coded the responses and classified them into the 44 specific categories above and 6 broader categories. For purposes of this study the responses were reclassified into the above 5 categories; the reclassification is similar to the original PSED classification, which can be found in the PSED codebook. The table reports the number of respondents, out of all 1,214 PSED respondents, who gave the indicated reason as either their first or their second response.
b. Responses sum to fewer than the full sample because some respondents did not provide a second response, and some gave two responses within the same category.
Table A2. reasons reported by nascent entrepreneurs for starting a businessa
(Continued)
No. of respondents giving indicated reason
Reason First response Second responseb

116 Brookings Papers on Economic Activity, Fall 2011
References
Acs, Zoltan J., and David B. Audretsch. 1990. Innovation and Small Firms. MIT Press.
Acs, Zoltan J., Pontus Braunerhjelm, David B. Audretsch, and Bo Carlsson. 2009. “The Knowledge Spillover Theory of Entrepreneurship.” Small Business Eco-nomics 32, no. 1: 15–30.
Ardagna, Silvia, and Annamaria Lusardi. 2008. “Explaining International Differ-ences in Entrepreneurship: The Role of Individual Characteristics and Regu-latory Constraints.” Working Paper no. 14012. Cambridge, Mass.: National Bureau of Economic Research.
Asoni, Andrea. 2010. “What Drives Entrepreneurship?” University of Chicago.Audretsch, David B., Max C. Keilbach, and Erik E. Lehmann. 2006. Entrepreneur-
ship and Economic Growth. Oxford University Press.Banerjee, Abhijit, and Esther Duflo. 2011. Poor Economics: A Radical Rethinking
of the Way to Fight Global Poverty. New York: PublicAffairs.Bhidé, Amar V. 2000. The Origin and Evolution of New Businesses. Oxford Uni-
versity Press.Clementi, Gian Luca, and Hugo A. Hopenhayn. 2006. “A Theory of Financing
Constraints and Firm Dynamics.” Quarterly Journal of Economics 121, no. 1: 229–65.
Davis, Steven J., John C. Haltiwanger, and Scott Schuh. 1996. Job Creation and Destruction. MIT Press.
Davis, Steven J., John C. Haltiwanger, Ron S. Jarmin, C. J. Krizan, Javier Miranda, Alfred Nucci, and Kristin Sandusky. 2007. “Measuring the Dynamics of Young and Small Businesses: Integrating the Employer and Nonemployer Universes.” Working Paper no. 13266. Cambridge, Mass.: National Bureau of Economic Research.
De Rugy, Veronique. 2005. “Are Small Businesses the Engine of Growth?” Work-ing Paper no. 123. Washington: American Enterprise Institute.
Evans, David, and Boyan Jovanovic. 1989. “An Estimated Model of Entrepreneur-ial Choice under Liquidity Constraints.” Journal of Political Economy 97, no. 4: 808–27.
Evans, David S., and Linda S. Leighton. 1989. “Some Empirical Aspects of Entre-preneurship.” American Economic Review 79, no. 3: 519–35.
Gabaix, Xavier. 2009. “Power Laws in Economics and Finance.” Annual Review of Economics 1: 255–93.
Hall, Robert E., and Susan E. Woodward. 2004. “Benchmarking the Returns to Venture.” Working Paper no. 10202. Cambridge, Mass.: National Bureau of Economic Research.
———. 2010. “The Burden of the Nondiversifiable Risk of Entrepreneurship.” American Economic Review 100, no. 3: 1163–94.
Haltiwanger, John C., Ron S. Jarmin, and Javier Miranda. 2010. “Who Creates Jobs? Small vs. Large vs. Young.” Working Paper no. 16300. Cambridge, Mass.: National Bureau of Economic Research.

erik hurst and benjamin wild pugsley 117
Hamilton, Barton H. 2000. “Does Entrepreneurship Pay? An Empirical Analysis of the Returns to Self Employment.” Journal of Political Economy 108, no. 3: 604–31.
Holmes, Thomas J., and John J. Stevens. 2010. “An Alternative Theory of the Plant Size Distribution with an Application to Trade.” Working Paper no. 15957. Cambridge, Mass.: National Bureau of Economic Research.
Hopenhayn, Hugo A. 1992. “Entry, Exit, and Firm Dynamics in Long Run Equi-librium.” Econometrica 60, no. 5: 1127–50.
Hurst, Erik, Geng Li, and Benjamin Pugsley. 2010. “Are Household Surveys Like Tax Forms: Evidence from Income Underreporting of the Self Employed.” Working Paper no. 16527. Cambridge, Mass.: National Bureau of Economic Research.
Jones, Charles I., and John C. Williams. 1998. “Measuring the Social Return to R&D.” Quarterly Journal of Economics 113, no. 4: 1119–35.
Jovanovic, Boyan. 1979. “Job Matching and the Theory of Turnover.” Journal of Political Economy 87, no. 5: 972–90.
———. 1982. “Selection and the Evolution of Industry.” Econometrica 50, no. 3: 649–70.
Kanbur, S. M. 1979. “Of Risk Taking and the Personal Distribution of Income.” Journal of Political Economy 87, no. 4: 769–97.
Kaplan, Stephen N., and Josh Lerner. 2010. “It Ain’t Broke: The Past, Present, and Future of Venture Capital.” Journal of Applied Corporate Finance 22, no. 2: 36–47.
Kihlstrom, Richard E., and Jean-Jacques Laffont. 1979. “A General Equilibrium Entrepreneurial Theory of Firm Formation Based on Risk Aversion.” Journal of Political Economy 8, no. 4: 719–48.
Knight, Frank. 1921. Risk, Uncertainty, and Profit. Boston: Houghton Mifflin.La Porta, Rafael, and Andrei Shleifer. 2008. “The Unofficial Economy and Eco-
nomic Development.” BPEA (Fall): 275–363.Lazear, Edward P. 2005. “Entrepreneurship.” Journal of Labor Economics 23,
no. 4: 649–80.Lucas, Robert E. 1978. “On the Size Distribution of Business Firms.” Bell Journal
of Economics 9, no. 2: 508–23.Moskowitz, Tobias J., and Annette Vissing-Jorgensen. 2002. “The Returns to
Entrepreneurial Investment: A Private Equity Premium Puzzle?” American Economic Review 92, no. 4: 745–78.
Pakes, Ariel, and Richard Ericson. 1989. “Empirical Implications of Alternative Models of Firm Dynamics.” Working Paper no. 2893. Cambridge, Mass.: National Bureau of Economic Research.
Pástor, Lubos, Lucian A. Taylor, and Pietro Veronesi. 2009. “Entrepreneurial Learning, the IPO Decision, and the Post-IPO Drop in Firm Profitability.” Review of Financial Studies 22: 3005–46.
Pugsley, Benjamin. 2011a. “Wealth, Tastes, and Entrepreneurship.” University of Chicago.

118 Brookings Papers on Economic Activity, Fall 2011
———. 2011b. “Selection and the Role of Small Business Owners in Firm Dynam-ics.” University of Chicago.
Puri, Manju, and Rebecca Zarutskie. Forthcoming. “On the Lifecycle Dynamics of Venture Capital and Non-Venture Capital Financed Firms.” Journal of Finance.
Schumpeter, Joseph. 1942. Capitalism, Socialism, and Democracy. New York: Harper and Row.
Simon, Herbert A., and Charles P. Bonini. 1958. “The Size Distribution of Busi-ness Firms.” American Economic Review 48, no. 4: 607–17.
Sutton, John. 1997. “Gibrat’s Legacy.” Journal of Economic Literature 35, no. 1: 40–59.
Vereshchagina, Galina, and Hugo A. Hopenhayn. 2009. “Risk Taking by Entrepre-neurs.” American Economic Review 99, no. 5: 1808–30.

119
Comments and Discussion
COMMENT BYJOHN HALTIWANGER This paper by Erik Hurst and Benjamin Pugsley is an interesting and informative study of small businesses in the U.S. economy. If one wanted a short summary answer to the question asked in the title—“What do small businesses do?”—the paper suggests that the authors might answer, “Not much.” They base this conclusion on an array of interesting qualitative and quantitative evidence. They document evi-dence suggesting that many small businesses are clustered in industries dominated by small businesses, which they argue are associated with inherently small-scale business operations. They show that the “typical” (that is, median) small business does not exhibit much dynamism in terms of growth or innovation: the median growth rate is low, and in response to qualitative surveys about their ambitions, many small business owners indicate that they have little intention of growing. Related qualitative evi-dence shows that small business owners often suggest that their motive for being a sole proprietor is to “be one’s own boss” rather than a profit motive per se.
The authors use these findings to argue that the standard models that economists have developed to characterize and analyze the dynamics of firms in general, and small businesses in particular, are missing impor-tant elements. Moreover, they argue that policymakers’ excessive focus on promoting entrepreneurship and small business creation and support is misguided. Simply put, targeting small businesses that are neither growing nor innovating much nor planning on doing so in the future is unlikely to contribute much to aggregate productivity and job growth.
There is much that I agree with in the paper in terms of interesting quali-tative and quantitative facts. Moreover, in giving a detailed characteriza-tion of small businesses, the authors acknowledge that there is enormous

120 Brookings Papers on Economic Activity, Fall 2011
heterogeneity and skewness in the growth rates of businesses, including small businesses. They recognize that, because of this, it is critical to dis-tinguish between averages and medians. On this I agree completely, but I have a different perspective on the implications. For example, the authors state that “the high degree of skewness, especially in these [small business-intensive] industries . . . makes analyzing the averages very deceiving.” A more accurate statement would be that it is of critical importance to keep in mind the differences between averages and medians. More generally, I think that it is precisely by exploring and understanding the hetero geneity and skewness of businesses that one can obtain much richer insights into the nature of job creation and productivity growth. Put differently, the authors seem to suggest that one should mostly think about what small businesses do by focusing on the typical (median) business, whereas I think that the evidence suggests that focusing only on the median business misses much of the interesting and important dynamics that contribute to job and productivity growth.
To give a more solid foundation to these points, I have generated some descriptive statistics about the distributions of size and growth of U.S. firms drawn from my collaborative work with Ron Jarmin and Javier Miranda (see Haltiwanger, Jarmin, and Miranda 2010) as well as earlier work with Steven Davis and Scott Schuh (Davis, Haltiwanger, and Schuh 1996). Using the same comprehensive firm-level data used in Haltiwanger and others (2010),1 figure 1 presents information about the skewness of the size distri-bution in the small business-intensive industries identified by the authors.
Two measures of the size distribution are included in figure 1. The first is the simple average firm size as measured by the number of employees. Consistent with the results in the present paper, I find that the average firm size in these designated small business-intensive industries is small. However, examining this statistic by itself is misleading. It turns out that even in these industries, the average worker is employed in a relatively large firm. The second statistic reported in figure 1 is the co-worker mean (a measure developed by Davis and others 1996). This measure is the employment-weighted average firm size and is interpretable as the average firm size for the average worker. The figure shows that the co-worker mean is above 1,000 in more than half of the top 20 small business–intensive
1. Details about the data can be found in that paper. For purposes of the tabulations reported here, I focus on 2003–05, which are the overlap years between those that Hurst and Pugsley focus on and those in the Haltiwanger and others (2010) sample, 1990–2005. Note that the underlying firm level data I use for these tabulations contain about 6 million observations per year.

2811
2910
57
67
4
124
67
614
137
817
16
12,5
38
1,34
7
12,7
88
267
9853
185
286
597
5,72
5
103
104
6,21
7
648
2,39
0
15,5
60
4,08
22,
277
4,38
12,
324
10100
1,00
0
10,0
00
Full-S
ervice
Res
tauran
ts (7
221)
Office
s of P
hysic
ians (
6211
)
Limite
d Serv
ice R
estau
rants
(722
2)
Religio
us O
rgan
izatio
ns (8
131)
Build.
Equip.
Con
tracto
rs (2
382)
Dentis
ts (6
212)
Auto R
epair
(811
1)
Legal
Service
s (54
11)
Res. B
ldg. C
onstr
uctio
n (23
61)
Service
to B
uild.
(561
7)
Build.
Finish
ing C
ontra
ctors
(238
3)
Build.
Exterio
r Con
tracto
rs (2
381)
Insu
rance
Age
nts (5
242)
Other H
ealth
Prac
tition
ers (6
213)
Arch./E
ngine
ering
Serv
ices (
5413
)
Accou
nting
Serv
ices (
5412
)
Person
al Care
Serv
ices (
8121
)
Consu
lting
Serv
ices (
5416
)
Gas S
tation
s (44
71)
Child D
ay C
are S
ervice
s (62
44)
No.
of
empl
oyee
s (l
og s
cale
)
Ave
rage
firm
siz
eC
o-w
orke
r m
eana
Sour
ce: A
utho
r’s
tabu
latio
ns u
sing
Bus
ines
s D
ynam
ic S
tatis
tics
data
.a.
Em
ploy
men
t-w
eigh
ted
aver
age
firm
siz
e. T
he s
et o
f ind
ustr
ies
is th
at in
the
conf
eren
ce d
raft
of t
he H
urst
and
Pug
sley
pap
er a
nd d
iffe
rs s
light
ly fr
om th
at in
the
vers
ion
in th
is v
olum
e.
Figu
re 1
. Av
erag
e Fi
rm S
ize
and
Co-W
orke
r Mea
n fo
r Top
20
Smal
l Bus
ines
s–In
tens
ive
Indu
stri
es, 2
003–
05

122 Brookings Papers on Economic Activity, Fall 2011
industries. For example, the average accountant works for a firm that has more than 15,000 workers. This evidence alone raises questions about the authors’ argument that these industries are such that the scale of activity is inherently small. Big businesses exist in each of these industries and indeed account for much of the activity in these industries.
A related point is that a firm’s industry is not a particularly good predic-tor of either its size or its growth. The following table reports the R2s from simple regressions relating indicators of size and growth to detailed (six-digit) industry effects:
R2
Probability that the firm has fewer than 20 employees 0.12
Net firm growth rate2 (all firms) 0.06
Net firm growth rate (small firms) 0.06
Probability that the firm is a high-growth firm (net firm growth rate > 20 percent)
0.04
Probability that the firm is a high-growth firm (net firm growth rate > 20 percent and net change > 10 employees)
0.03
The detailed industry of a firm accounts for only 12 percent of the varia-tion in the probability that the firm has fewer than 20 employees. Detailed industry accounts for even less variation in the dispersion in firm growth rates and in the probability that the firm is a high-growth firm. In this respect, I think the authors overemphasize the role of industry in account-ing for the nature of the size distribution of activity as well as the dis-tribution of growth. The thrust of the paper is that firms in these small business–intensive industries have little growth potential, and that it should not be surprising that little growth occurs in these firms because firms in these industries are inherently small. Figure 1 and the above table show that this is a misleading characterization of these industries.
In my work with Jarmin and Miranda cited above, we have shown that the job creating prowess of small businesses is better attributed to the con-tribution of business start-ups and young businesses. Start-ups and young businesses are also usually small, but the evidence shows that mature small businesses have negative average net growth rates. We also show that
2. The net firm growth rate is the measure developed by Davis, Haltiwanger, and Schuh (1996) and now used as a standard summary measure of firm growth, for example in the Business Dynamic Statistics. The same measure is also used in the paper.

young businesses exhibit an “up or out” dynamic: they have a high prob-ability of exit, but those that survive exhibit rapid growth on average.
How can one reconcile these findings with the present authors’ evi-dence that small (and in some related findings in the paper, young) firms exhibit little growth? This is one of many cases where the median and the mean patterns differ substantially. Figure 2 shows the employment-weighted mean and median net firm level growth rates (similar patterns hold for the unweighted mean and median growth rates). It is apparent that young surviving businesses have high average net growth rates but not high median growth rates. Underlying this pattern is a very skewed distribution of growth rates. Figure 3 shows the employment-weighted 90th and 10th percentiles of the firm-level growth rate distribution. The 90th percentile is very high and monotonically declining in age, whereas the 10th percentile is negative but monotonically increasing in age. High-growth young firms grow very fast, but there is also enormous heterogeneity among young firms: the 90-10 differential is very large. The skewness is also apparent from the fact that the absolute value at the 90th percentile for the young firms is much larger than that at the 10th percentile. It is this skewness that drives the difference between the means and medians in figure 2.
The high-growth firms in figure 3 contribute disproportionately to job creation. Figure 4 shows the patterns of job creation for both the average industry and the average small business–intensive industry (from among the top 40 small business–intensive industries listed in table 1 of the
CoMMenTS and dISCuSSIon 123
Figure 2. employment-Weighted Mean and Median net employment Growth Rates for Surviving Firms, by Firm Age, 2003-05
2
4
6
8
10
12
1
Percent per year
2 3 4 5 6–10 11–15 >15Firm age (years)
Mean Median
Source: Author’s tabulations using Business Dynamic Statistics data.

124 Brookings Papers on Economic Activity, Fall 2011
paper). Several observations are worth noting. First, the average (gross) job creation rate for the small business–intensive industries is higher than the average for all industries.3 Second, start-ups plus high-growth firms (defined here as firms with growth rates exceeding 20 percent in a year) account for over 80 percent of job creation in the small business–intensive
Figure 3. net employment Growth Rates at the 90th and 10th Percentiles for Surviving Firms, by Firm Age, 2003–05
–4
–2
0
2
4
6
8
1 2 3 4 5 6–10 11–15 >15Firm age (years)
Percent per year
10th percentile
90th percentile
Source: Author’s tabulations using Business Dynamic Statistics data.
3. This finding is related to another somewhat misleading finding in the paper. The authors show that their x measure is inversely correlated with job creation by small busi-nesses in their top 40 industries as measured by x (their table 1). One could interpret this as saying that among these industries, those with a larger share of small businesses have lower rates of job creation by small businesses. I am not convinced that this is an interesting or robust characterization of the data. In unreported tabulations using the firm-level data underlying figures 1 through 4, I show, first, that I can verify their finding; second, that even among their top 40 x industries, those where small businesses account for a higher share of employment have higher job creation rates; and that across all industries, those where small businesses account for a larger share of employment have higher job creation rates. The last two findings are consistent with the well-established finding (see Davis and others 1996 and Haltiwanger and others 2010) that small businesses have higher job creation rates and higher job destruction rates than large businesses within the same industry. I think the pres-ent authors’ finding raises some questions about whether the x measure is the most appropri-ate and meaningful way to characterize small business–intensive industries. It is correlated with the share of employment in the industry accounted for by small businesses, but that correlation is far from 1. Part of the explanation is that counts of the number of firms in an industry are inherently noisy, for both measurement and conceptual reasons. For example, many very small employer businesses (those with 1 or 2 employees) are often crossing the line between being an employer business and being a nonemployer business (see Davis and others 2009). I think a more robust measure of the small business intensity of an industry is the share of employment accounted for by small businesses in the industry.

CoMMenTS and dISCuSSIon 125
Figure 4. Job Creation and Share of High-Growth Firms in Small Business–Intensive Industries, 2003–05a
102030405060708090
Annual rate ofjob creation
Share of jobcreation from
high-growth firms
Share of jobcreation fromhigh-growth
firms(excluding births)
Share ofhigh-growth
firms
Share ofhigh-growth
firms(excluding births)
Top 40 “x” industries All industries
Percent
Source: Author’s tabulations using Business Dynamic Statistics data.a. Small business–intensive industries are the 40 four-digit NAICS industries listed in table 1 of Hurst
and Pugsley (this volume).
industries and just under 80 percent in all industries. Start-ups are impor-tant contributors to job creation here, but it is also apparent that other high-growth firms contribute substantially (over 40 percent of the total) to job creation.
In sum, start-ups and high-growth firms are the biggest contributors to job creation. Start-ups tend to be small (Haltiwanger and others 2010), and high-growth firms tend to be young and small (Haltiwanger and others 2010 and figure 3). It is true that the median small firm and even the median young firm is not a high-growth firm. But does this imply that one should ignore the contribution of start-ups and high-growth young firms? Obvi-ously this would be a mistake, since they account for such a large fraction of job creation.
The authors suggest that the standard models of firm heterogeneity yielding insights about the size distribution of the level and growth of employment are “at best incomplete.” Although this is undoubtedly true, I do not think the standard models do as badly as their discussion suggests. The canonical model of the size distribution of activity within industries describes firms that face idiosyncratic shocks to their profitability (from productivity, demand, and cost factors). The evidence suggests that these shocks follow a Pareto distribution and that they exhibit considerable

126 Brookings Papers on Economic Activity, Fall 2011
persistence. To justify an equilibrium distribution of size, it is standard to assume that the existence of curvature in the profit function derives either from economies of scope and control (see, for example, Lucas 1978) or from product differentiation (see, for example, Melitz 2003). In these models the most productive and profitable firms will be the largest, but the curvature of the profit function implies that these firms will not take over the industry. In addition, some fixed operating costs are typi-cally assumed, so that firms with very low profitability and productivity will choose to exit. Dynamics are introduced into this class of models by recognizing, first, that firms are continually subject to new idiosyncratic shocks, and second, that there are a host of frictions that slow adjust-ment (such as capital-labor adjustment frictions, but also information and learning frictions).
This class of models is fully consistent with the paper’s evidence as well as with the evidence discussed above. Given the Pareto distribution of profit shocks, one should expect a very skewed distribution of both firm size and growth. The median firm will be small and not growing. But some firms will be large, and some (the high-growth firms) will become large. Even in the small business–intensive sectors that the paper focuses on, both large and high-growth firms exist, which is again consistent with this class of models. Also, the differentiated-product versions of these models pro-vide a potentially rich way of capturing the many small firms that fit into specific niches, even within industries.
One piece of evidence in the paper that might seem at odds with this interpretation is the qualitative survey evidence suggesting that it is not the profit motive but rather nonpecuniary factors (such as “owning one’s own business”) that drive most small businesses. I agree that nonpecuniary factors are potentially of interest, but I also have some skepticism about the evidence presented. For one thing, the evidence comes from the Panel Survey of Entrepreneurial Dynamics (PSED), which is a small survey of “nascent” entrepreneurs (the sample consists of 1,214 potential entrepre-neurs). I think the objective of the PSED is of first-order importance, but it is inherently a challenge to find a sample of potential entrepreneurs and to obtain high response rates from them (Curtin and Reynolds 2008). I have related questions about the representativeness of the Kauffman Firm Survey (KFS), the paper’s other source of qualitative (and quantitative) evidence on small businesses. I think the KFS has a better sample frame than the PSED, but it still faces limitations. Among other things, it has been shown that the KFS has much higher survival rates than nationally representative databases (Robb 2009). The underlying sample frame for the KFS is the

Dun and Bradstreet data set, which is well known to miss most start-ups initially and to underrepresent young firms (Acs, Parsons, and Tracy 2008).
An alternative way to state this skepticism about the data sets used is that all of the evidence from nationally representative firm-level studies (for at least employer-based businesses) shows, first, that exit rates are very high for young and small businesses, and second, that the probability of exit is much higher for businesses with low profitability or productivity (Foster, Haltiwanger, and Krizan 2001, 2006). It may be that business own-ers, in response to a survey, will express the nonpecuniary benefits of being a business owner, but at the end of the day, unproductive and unprofitable businesses exit. I do think the importance of nonpecuniary benefits is likely greater for nonemployer businesses (the self-employed who do not hire any employees). There are many more nonemployer businesses in the United States (between 15 and 20 million) than employer businesses (about 6 mil-lion). But the present paper focuses on employer businesses, which is a considerably more important group to consider when it comes to job and productivity growth.
To emphasize my main comment on this paper: I think it is critical to understand the role of start-ups and high-growth young firms (and high-growth firms more generally), not only to deepen our knowledge of the job creation process, but also so that the most appropriate policies will be implemented. Many distortions can impede the dynamics discussed above. Of particular relevance in recent years are distortions in financial markets that may be impeding business start-ups (which have fallen dramatically since 2007; see Haltiwanger forthcoming) and high-growth young firms. Consistent with the paper’s findings, it may be that financial market distor-tions have relatively little impact on the median young and small firm, but they may still be very relevant for high-growth young firms, and in particu-lar those likely to contribute significantly to job creation.
The challenge, of course, is that any policies that apply broadly to small or even young businesses will fail to take into account the enormous hetero-geneity and skewness in the distribution of firm-level growth rates, espe-cially for young (and small) businesses. Most young businesses will either fail or not grow—that is the basic message of this paper. But again, focus-ing only on the median young and small business misses much of what contributes to job creation in the United States. It is the impact of financial market and other distortions on the margins of particular relevance for job creation (that is, distortions affecting start-ups and high-growth firms) that we need to understand, recognizing that the typical young and small firm may be much less affected by such distortions.
CoMMenTS and dISCuSSIon 127

128 Brookings Papers on Economic Activity, Fall 2011
ReFeRenCeS FoR THe HALTIWAnGeR CoMMenT
Acs, Zoltan, William Parsons, and Spencer Tracy. 2008. “High-Impact Firms: Gazelles Revisited.” SBA Report SBAHQ-06-Q-0014. Washington: Office of Advocacy, Small Business Administration.
Curtin, Richard, and Paul Reynolds. 2008. “Business Creation in the United States: Panel Study of Entrepreneurial Dynamics II Initial Assessment.” Foundations and Trends in Entrepreneurship 155–307.
Davis, Steven, John Haltiwanger, and Scott Schuh. 1996. Job Creation and Destruction. MIT Press.
Davis, Steven, John Haltiwanger, C. J. Krizan, Ron Jarmin, Javier Miranda, Al Nucci, and Kristin Sandusky. 2009. “Measuring the Dynamics of Young and Small Businesses: Integrating the Employer and Non-Employer Universes.” In Producer Dynamics: New Evidence from Micro Data, edited by Timothy Dunne, J. Bradford Jensen, and Mark J. Roberts. NBER Book Series Studies in Income and Wealth. University of Chicago Press.
Foster, Lucia, John Haltiwanger, and C. J. Krizan. 2001. “Aggregate Productiv-ity Growth: Lessons from Microeconomic Evidence.” In New Developments in Productivity Analysis, edited by Charles R. Hulten, Edwin R. Dean, and Michael J. Harper. NBER Book Series Studies in Income and Wealth. Univer-sity of Chicago Press.
_________. 2006. “Market Selection, Reallocation and Restructuring in the U.S. Retail Trade Sector in the 1990s.” Review of Economics and Statistics 88, no. 4: 748–58.
Haltiwanger, John. Forthcoming. “Job Creation and Firm Dynamics in the U.S.” In Innovation Policy and the Economy, vol. 12, edited by Josh Lerner and Scott Stern. Cambridge, Mass.: National Bureau of Economic Research.
Haltiwanger, John, Ron Jarmin, and Javier Miranda. 2010. “Who Creates Jobs? Small vs. Large vs. Young.” Working Paper no. 16300. Cambridge, Mass.: National Bureau of Economic Research.
Lucas, Robert E. 1978. “On the Size Distribution of Business Firms.” Bell Journal of Economics 9, no. 2: 508–23.
Melitz, Marc. 2003. “The Impact of Trade on Intra-Industry Reallocations and Aggregate Industry Productivity.” Econometrica 71, no. 6: 1695–1726.
Robb, Alicia. 2009. “Kauffman Firm Survey Overview Follow-Up Report.” Kan-sas City, Mo.: Kauffman Foundation.
COMMENT BYADAM LOONEY Innovation and entrepreneurial activity are crucial for raising the productivity of the workforce, expanding job opportunities, and developing and introducing new and better consumer products, and therefore for increasing living standards over time. The potential spillover benefits of such activities for aggregate living standards make it natural
CoMMenTS and dISCuSSIon 129
for policymakers to search for opportunities to promote innovation and entrepreneurship. Relying in part on the premise that small businesses are responsible for a large share of entrepreneurial activity, innovation, and job creation, policymakers have directed considerable attention to small businesses and have enacted a broad array of tax breaks, direct spending programs, and regulatory relief specifically to promote such businesses.
In this paper Erik Hurst and Benjamin Pugsley reassess the role of small businesses in the economy and find, in contrast to the conventional wisdom, that most are neither particularly innovative nor entrepreneurial. Their data suggest that few small businesses engage in measurable activi-ties that correspond to research and development, such as obtaining patents and copyrights. Most of the small business owners in their survey data do not report bringing a new idea to market and do not report a desire to expand beyond a few employees. Perhaps most surprisingly, a majority of nascent entrepreneurs surveyed for the Panel Study of Entrepreneurial Dynamics do not cite income generation as one of their top two reasons for starting a business, and over 50 percent instead mention nonpecuniary benefits, such as flexible hours or being one’s own boss.
Hurst and Pugsley also find that most small businesses stay small; on net, small businesses are not disproportionate job creators. Indeed, their evidence suggests that most small businesses are small not because they are new and growing, but because they operate in industries or occupations where small is the appropriate and efficient scale of business and production. Examples include restaurants, doctors’ and law offices, and electricians. Such evi-dence corroborates previous findings, for example by John Haltiwanger, Ron Jarmin, and Javier Miranda (2010), showing that, conditional on firm age, there is little relationship between firm size and firm growth.
Together these results suggest that most small businesses are not involved in activities that generate innovation spillovers or other positive externalities, nor are they disproportionate generators of economic activity or jobs, and thus they call into question whether small businesses, broadly defined, are the appropriate target of policies to promote innovation. But are there other reasons why it may be efficient or desirable to tailor policies specifically to small businesses?
One alternative motivation for such policies is to further equity, fairness, or redistributive goals, out of a desire to raise the well-being of either small business owners or their employees. However, evidence from tax data suggests that small business owners, on average, are likely to be financially better off than the typical employee at either a small or a large firm. Indi-viduals who earn money from small businesses tend to have other sources of

130 Brookings Papers on Economic Activity, Fall 2011
income as well, and the average total annual income for individuals with a significant portion of income coming from small businesses is over $76,000.1 As a result, small business subsidies are likely to be regressive. Moreover, Hurst and Pugsley point out that small business owners tend to enjoy a larger share of nonpecuniary benefits from their work than other workers do. Because these benefits are not taxed, the existing tax structure already implicitly subsidizes small business, since a smaller fraction of total com-pensation is taxed. These considerations indicate that equity or distribu-tional considerations focused on owners are unlikely to justify the transfer of public resources to small businesses.
A similar hypothesis is that small businesses create employment oppor-tunities that provide unusually favorable pay, benefits, or stability and thus reduce the fiscal burden on all taxpayers while raising the living standards of their workers. However, statistics do not appear to support this idea. For example, employees of small businesses are less likely to receive health benefits. In 2011, 99 percent of firms with 200 or more employees, but only 59 percent of firms with between 3 and 199 employees, offered health benefits to their workers, according to the Kaiser Family Foundation and the Health Research & Educational Trust (2011). Similarly, employees of small firms are also less likely to receive retirement benefits: Irena Dushi, Howard Iams, and Jules Lichtenstein (2011) estimate that in 2006, 84 per-cent of employees of firms with 100 or more workers were offered some kind of retirement plan, compared with only 50 percent of employees of smaller firms. Small firms also have higher job turnover rates than larger firms. Experimental data from the Bureau of Labor Statistics’ Job Openings and Labor Turnover Survey show that between May 2010 and April 2011, employees of businesses with between 10 and 49 employees separated from their jobs at an average monthly rate of 3.5 percent, compared with only 2.1 percent at businesses with between 1,000 and 4,999 employees.2 Thus, jobs at small businesses appear to be less stable or enduring jobs, on average.
A final important consideration is the cost of complying with complex tax and regulatory requirements. Learning the relevant features of the tax and regulatory system, undertaking the necessary record-keeping, and filing tax returns and complying with the tax system all include
1. This figure is based on data from table 16 of Knittel and others (2011): under their “narrow” definition of small business owners, there were 9.4 million small business owners who earned a collective $716 billion in 2007.
2. Because they are experimental, data on turnover by firm size from the Job Openings and Labor Turnover Survey are not yet published, but they are available by request from the Bureau of Labor Statistics.

CoMMenTS and dISCuSSIon 131
some fixed-cost component and are thus disproportionately burdensome to smaller businesses. This is undoubtedly a concern to small businesses and is an important argument for differential and favorable treatment of such businesses.
In sum, the data on small business activity that Hurst and Pugsley ana-lyze suggest that the scope for advancing innovation and entrepreneurial activity or for supporting job growth or the creation of “good” jobs by focusing on small businesses is limited. Although an analysis of equity considerations is beyond the scope of their analysis, a brief review of the evidence suggests that support for small business neither disproportion-ately improves the welfare of disadvantaged business owners nor promotes unusually high quality employment at those businesses. Moreover, Hurst and Pugsley identify several reasons why policies encouraging or subsi-dizing small businesses may introduce additional costly distortions into the economy beyond their direct budgetary impacts. Small business subsi-dies may, at the margin, encourage businesses to operate at a smaller than optimal scale. They may also subsidize economic activity in industries in which small businesses are naturally concentrated—such as legal services, real estate, and carpentry—at the expense of industries in which businesses are naturally larger.
Under current policies based, in part, on the conventional wisdom, small businesses benefit from a number of legal, administrative, and tax provisions that provide them both implicit and explicit support. The Small Business Administration (SBA), whose main mission is to help “Ameri-cans start, build, and grow small businesses,” has an annual budget of almost $1 billion. With about a third of this budget, it guarantees over $20 billion worth of bank loans taken out by small businesses, to make it easier for these firms to borrow (Small Business Administration 2010, 2011a). The agency also works to enforce a government-wide goal, estab-lished by the Small Business Act, of awarding at least 23 percent of the value of prime procurement contracts to small businesses (Small Business Administration 2011b).
Small businesses receive exemptions from many workplace regula-tions. For example, certain provisions of the Family and Medical Leave Act of 1993, which requires employers to provide job-protected unpaid leave for qualified family and medical reasons, do not apply to businesses with fewer than 50 employees. Some provisions of the Age Discrimination in Employment Act of 1967 do not apply to businesses with fewer than 20 employees. Neither the provisions of the Americans with Disabilities Act of 1990 prohibiting employment discrimination based on disability
132 Brookings Papers on Economic Activity, Fall 2011
3. Guenther also highlights a small business tax preference concerning net operating losses that cost around $4.7 billion in fiscal 2009, but it is not included in the list because it was a temporary provision of the American Reinvestment and Recovery Act.
4. Firms in certain sectors, including health care, law, and engineering, are ineligible for these lower rates and always pay a fixed rate of 35 percent.
nor the employment provisions of the landmark Civil Rights Act of 1964 apply to firms with fewer than 15 employees. The Occupational Safety and Health Administration (2011) prescribes lower penalties for violations of health and safety regulations that occur within small firms and subjects such firms to reduced filing requirements.
In addition to regulatory relief and subsidies and loans from the SBA, small business owners receive favorable tax treatment relative to other businesses. Gary Guenther (2009) identifies six major tax preferences for which the congressional Joint Committee on Taxation (JCT) estimated rev-enue costs in fiscal 2009:3
—Small corporations face lower tax rates than larger businesses. On most income under $10 million, corporations are subject to marginal tax rates lower than the usual corporate rate of 35 percent.4 The lowest mar-ginal rates apply to firms with the least income, so that a firm making $100,000 pays an average rate of roughly 22 percent. The JCT estimates that the revenue loss associated with this provision was $3.3 billion in fiscal 2009.
—In tax years 2008 and 2009, businesses were permitted to treat many purchases (up to $250,000) of depreciable assets as expenses rather than as capital expenditures. This allowed the purchases to be deducted from taxable income immediately rather than over several years, enabling busi-nesses to defer taxes into the future. The JCT estimates that this provi-sion cost the Treasury about $6.0 billion in 2009. (A temporary provision enacted for 2011 allows all businesses to expense capital purchases.)
—Business owners may deduct up to $5,000 of start-up and organiza-tional costs in the year they start their business. (The maximum deduction is reduced by the amount by which start-up costs exceed $50,000.) Eligi-ble expenses that cannot be deducted may be amortized over 15 years. The cost of this deduction and amortization was about $0.8 billion in 2009, the JCT estimates.
—For tax purposes, many small firms are permitted to use cash-based accounting instead of the more complex and rigorous accrual-based accounting, at a revenue cost of about $0.9 billion in 2009, according to the JCT.

CoMMenTS and dISCuSSIon 133
—Many taxpayers may exclude 50 percent of capital gains from the sale of qualified small business stock, subject to certain limits. The JCT estimates the cost of this provision at $0.5 billion in 2009.
—Taxpayers may deduct losses from the sale of qualified small busi-ness stock as ordinary losses rather than capital losses, at an estimated cost of $50 million in 2009.
The estimated revenue cost of these provisions alone was thus about $11.5 billion in 2009, and this total does not reflect a number of other small business tax preferences for which the JCT did not estimate costs, including a tax credit for expenses necessary to comply with the Ameri-cans with Disabilities Act, and special treatment of losses on stock in small business investment companies. This number was likely much higher in 2010 and 2011, as the Small Business Jobs Act of 2010 tempo-rarily expanded many of these tax preferences (Internal Revenue Service 2011). For example, it doubled the limit on expensable capital expen-diture for 2010 and 2011, and it raised the capital gains exclusion to 100 percent on small business stock acquired within a certain time frame. In addition, the Affordable Care Act, also enacted in 2010, created a new permanent tax credit for small businesses that provide health insurance to their employees, which the Office of Management and Budget (2011a) estimates will reduce the tax liabilities of small businesses by $21 billion between 2012 and 2016.
As significant as these explicit tax incentives are, they are dwarfed by a variety of other tax breaks that, while not applied according to firm size, in practice end up benefiting small firms disproportionately. For example, firms legally organized as S corporations, sole proprietorships, partner-ships, and limited liability corporations (LLCs) generally receive more favorable tax treatment than businesses organized as C corporations (which disproportionately are large, publicly traded companies), and in certain cases their owners face lower tax rates than shareholders in C corporations or ordinary employees.
For instance, owners of S corporations and LLCs can reduce Social Security and Medicare payroll taxes on much of their income by classi-fying that income as business distributions rather than wages—a choice that is not available to regular employees, the self-employed, or owners of partnerships. Although the tax system includes anti-abuse provisions to ensure that these businesses owners pay themselves “reasonable compen-sation” in wages, in practice they often do not. As a result they often pay lower effective tax rates than do employees, the self-employed, or owners in partnerships: a report by the JCT (2005) estimated that applying the

134 Brookings Papers on Economic Activity, Fall 2011
same rules used for partnerships to owners of S corporations and LLCs would raise roughly $60 billion over 10 years, and about $7 billion per year from 2011 to 2014.
Similarly, self-employed workers face lower payroll tax obligations than non-self-employed workers with comparable incomes because of the formula for calculating payroll taxes under the Self-Employment Contri-butions Act. One result is that self-employed people who earn more than Social Security’s taxable maximum have lower Medicare tax obligations than comparable workers who are not self-employed. The JCT (2005) esti-mates the cost of these rules at about $500 million per year.
Other favorable rules fall at the intersection of tax and labor laws. For example, the rules that determine who is counted as an employee rather than as an independent contractor allow many employers and sole pro-prietors (and the larger businesses they do business with) to avoid many labor regulations, employment taxes, and tax withholding requirements by claiming that they operate in a business-contractor relationship rather than an employer-employee relationship. The Office of Management and Budget (2011b) has estimated that clarifying the rules for classifying workers as independent contractors would generate more than $7 billion over 10 years.
Although legal tax preferences for small businesses provide them with billions of dollars in support each year, small businesses derive a much larger implicit tax subsidy from a tax compliance system that allows for significant underreporting of small business income on tax returns. Small businesses underreport income on tax returns at a much higher rate than larger businesses or ordinary employees, largely because they are subject to less third-party reporting on their revenue and expenses. The Internal Revenue Service conducted a detailed analysis of the “tax gap” in 2001—taxes that should have been paid but went unpaid because individuals or entities did not file required returns, did not report their full tax liability on a return, or did not pay the full amount required on a return. According to updated estimates from that analysis, small businesses and self-employed individuals were responsible for $257 billion, or about 75 percent, of the $345 billion tax gap in 2001 (Internal Revenue Service and U.S. Depart-ment of the Treasury 2007).
Despite the size of this small business tax gap, policymakers have fre-quently shied away from efforts to close it. For example, a provision of the Affordable Care Act requiring business and real estate owners to report payments to other businesses in excess of $600 per year was repealed soon after the law was passed, because it was seen as overly burdensome to

CoMMenTS and dISCuSSIon 135
small businesses (White House Office of the Press Secretary 2011). The provision had been projected to raise $17 billion between 2012 and 2019 by deterring tax cheats (JCT 2010). A similar provision requiring withhold-ing of taxes for federal contractors was also recently repealed, reducing tax revenue by an estimated $11 billion over 10 years.
Of course, many of the tax, regulatory, and compliance measures that exempt or provide favorable treatment to small businesses arise from a desire to reduce the burden of understanding and complying with many complex and frequently changing rules and regulations. Tax provisions such as cash accounting and immediate expensing of investments sim-plify record-keeping and filing and reduce other fixed costs of dealing with the government. An important challenge is to identify the appropri-ate balance across several objectives: mitigating the burdens of compli-ance, maintaining tax revenue, promoting an equal playing field for all businesses and their employees, and upholding and enforcing important workplace rules.
To conclude, Hurst and Pugsley have established that, for businesses, “small” is not synonymous with “innovative” or “growing,” and thus that policies to promote innovation spillovers or otherwise encourage economic activity based on business size alone may not be particularly efficient or effective. Of course, a few new firms that start off small do attempt the kind of innovation that creates large spillover benefits—and some succeed. If policymakers could identify this subset of firms that innovate the most, it might be far more efficient to target just those firms. Although that is obviously a challenging task, one approach might be to focus on specific industries or sectors that invest heavily in research and development. Alter-natively, government could continue or expand support to the basic inputs to innovation, such as basic R&D and financing of education and research at universities, which could be useful to innovative businesses regardless of size. Such changes could improve the efficiency of support for innovation and, ultimately, job creation and would not necessarily preclude policies that treat small businesses differently to address the greater compliance and administrative burdens they may face.
ReFeRenCeS FoR THe LooneY CoMMenT
Congressional Budget Office. 2005. “Budget Options.” Washington. www.cbo.gov/ftpdocs/60xx/doc6075/02-15-BudgetOptions.pdf.
Dushi, Irena, Howard M. Iams, and Jules Lichtenstein. 2011. “Assessment of Retirement Plan Coverage by Firm Size, Using W-2 Tax Records.” Social Secu-rity Bulletin 71, no. 2: 53–65.

136 Brookings Papers on Economic Activity, Fall 2011
Guenther, Gary. 2009. “Small Business Tax Benefits: Overview and Economic Rationale.” CRS Report for Congress no. RL-32254. Washington: Congres-sional Research Service.
Haltiwanger, John C., Ron S. Jarmin, and Javier Miranda. 2010. “Who Creates Jobs? Small vs. Large vs. Young.” Working Paper no. 16300. Cambridge, Mass.: National Bureau of Economic Research.
Internal Revenue Service. 2011. “Small Business Act of 2010 Tax Provisions.” Washington. www.irs.gov/businesses/small/article/0,,id=230307,00.html.
Internal Revenue Service and U.S. Department of the Treasury. 2007. “Reducing the Federal Tax Gap: A Report on Improving Voluntary Compliance.” Wash-ington. www.irs.gov/pub/irs-news/tax_gap_report_final_080207_linked.pdf.
Joint Committee on Taxation. 2005. “Options to Improve Tax Compliance and Reform Tax Expenditures.” Washington. www.jct.gov/publications.html?func=startdown &id=1524.
_________. 2010. “Estimated Revenue Effects of the Amendment in the Nature of a Substitute to H.R. 4872, the ‘Reconciliation Act of 2010,’ as Amended, in Combination with the Revenue Effects of H.R. 3590, the ‘Patient Protection and Affordable Care Act (“PPACA”),’ as Passed by the Senate, and Scheduled for Consideration by the House Committee on Rules on March 20, 2010.” Wash-ington. www.jct.gov/publications.html?func=download&id=3672&chk=3672&no_html=1.
Kaiser Family Foundation and Health Research & Educational Trust. 2011. “Employer Health Benefits 2011 Annual Survey.” Menlo Park, Calif., and Chi-cago, Ill. ehbs.kff.org /pdf/2011/8225.pdf.
Knittel, Matthew, Susan Nelson, Jason DeBacker, John Kitchen, James Pearce, and Richard Prisinzano. 2011. “Methodology to Identify Small Businesses and Their Owners.” Department of the Treasury Office of Tax Analysis Technical Paper no. 4. Washington.
Occupational Safety and Health Administration. 2011. “Occupational Safety and Health Administration’s Field Operations Manual.” Washington. www.osha.gov/OshDoc/Directive_pdf/CPL_02-00-150.pdf.
Office of Management and Budget. 2011a. “Analytical Perspectives, Budget of the United States Government, Fiscal Year 2012.” Washington. www.gpo.gov/fdsys/pkg/BUDGET-2012-PER/pdf/BUDGET-2012-PER.pdf.
_________. 2011b. “Budget of the United States Government, Fiscal Year 2011.” Washington. www.gpoaccess.gov/usbudget/fy11/index.html.
President’s Economic Recovery Advisory Board. 2010. “The Report on Tax Reform Options: Simplification, Compliance, and Corporate Taxation.” Washing-ton. www.whitehouse.gov/sites/default/files/microsites/PERAB_Tax_Reform_ Report.pdf.
Small Business Administration. 2010. “Recovery Loan Incentives Spurred Con-tinued Rebound in SBA Lending in FY2010.” Washington. indus.sba.gov/idc/groups/public/documents/sba_homepage/news_release_10-54.pdf.
_________. 2011a. “Fiscal Year 2012 Budget Summary.” Washington. www.sba.gov/content/fiscal-year-2012-budget-summary.

CoMMenTS and dISCuSSIon 137
_________. 2011b. “Goaling Guidelines: Statutory Requirements.” Washington. archive.sba.gov/aboutsba/sbaprograms/goals/gg/index.html.
White House Office of the Press Secretary. 2011. “Statement by President Obama on H.R. 4.” Washington. www.whitehouse.gov/the-press-office/2011/04/14/statement-president-obama-hr-4.
GENERAL DISCUSSION Erik Hurst began the discussion by summa-rizing some comments he had received from Antoinette Schoar. A profes-sor of entrepreneurial finance at the MIT Sloan School of Management, Schoar had been scheduled as a formal discussant but at the last minute was unable to attend the Panel meetings.
Schoar reported that the misconception that all small businesses want to become big businesses was also widespread in the development economics literature. This idea has been used to support many questionable invest-ments, by developing countries, aid organizations, and the like, in entrepre-neurship training and other small business support programs. In her own work she had stressed the importance of better targeting these interven-tions to those small firms that are actually likely to grow. Several papers—including one by Suresh de Mel and coauthors—have found evidence that these firms do look different from other small businesses: for example, their owners tend to be better educated and to have greater tolerance of risk. They are also less likely to be female, because women in these societies are often expected to put family ahead of any entrepreneurial ambitions. Related work—for example, by Camilo Mondragon-Velez and Ximena Peña Parga—has found that few self-employed individuals in developing countries ever make the transition to taking on employees and expanding their business.
All that said, Schoar observed that there were also real bottlenecks to small business growth in much of the developing world. Esther Duflo and others had found that capital constraints are important, and work by Nicholas Bloom pointed to a shortfall of managerial know-how among small business owners in these countries.
An intriguing finding, from work that Schoar had done with Dean Karlan and others, was that management training and consulting aimed at small business owners in developing countries had the potential not only to increase their output, but also to change the owners’ expectations and desires. This suggested that for some small businesses at least, the expressed disinterest in growing was endogenous to the constraints they perceived rather than a permanent feature.

138 Brookings Papers on Economic Activity, Fall 2011
Finally, Schoar cited work by Augustin Landier and David Thesmar indicating that those entrepreneurs who do want to grow their businesses tend to be overoptimistic about their prospects, which suggested that some of Hurst and Pugley’s findings might be biased upward.
Diego Comin suggested that a worthwhile next step for the authors’ research agenda would be to focus on those small companies that do grow, to try to understand why they grow. Even more interesting would be to examine whether the factors that drive their growth vary at a business cycle frequency. Laurence Ball agreed that closer study was needed of the firms that achieve the transition from small to large. Are they concentrated in some industries than others? Do they innovate more? And is it possible to better target to these growing and innovating companies the policies that now benefit small businesses across the board?
Edward Lazear remarked that he routinely asks his MBA students whether they are seeking a business degree because of the money they expect to earn, and typically only a handful say yes. The implausibility of this response—if business students are not in it for the money, who is?—suggested to him that questions of that nature, including the authors’ ques-tion about nonpecuniary benefits, are not well framed. Perhaps one should ask instead how much income respondents would be willing to forgo in order to be their own boss. Or one could compare the actual incomes of self-employed and salaried workers, but those data are not unequivocal—indeed, it is unclear that the implied trade-off even exists. Although data from the Current Population Survey indicate that self-employed workers earn less on average than salaried workers, those data do not control for individual characteristics. Lazear’s own data, which do control for such differences, yield the opposite result. Jesse Rothstein added that workers in some occupations, such as hairdressers, have little choice but to oper-ate as a small business. These workers’ answers to the question of why they chose to start a small business might show up in the “nonpecuniary” category even if they entered primarily to make money.
Robert Gordon noted that whereas the paper focused on innovation by small businesses, it was also worth thinking about the impact of innovation on small businesses. Much innovation is by large rather than small busi-nesses, and work by David Autor and Lawrence Katz finds that much of that innovation, together with globalization, is rendering many U.S. jobs obsolete. How many of those jobs, Gordon wondered, are in small busi-nesses? He cited an article in that morning’s Wall Street Journal reporting that small business start-ups today are being launched with only about two-thirds as many employees, on average, as those launched in the 1990s.

CoMMenTS and dISCuSSIon 139
It could well be that information technology is what is allowing these new businesses to start out with fewer employees.
A concrete example of this phenomenon, Gordon suggested, was the auto repair industry. The introduction of online parts catalogs has reduced the labor cost of running an auto repair shop; on the other hand, the greater technical complexity of today’s automobiles has shifted competitive advan-tage to the larger dealerships, which can more easily acquire the necessary capital equipment and hire and train the more specialized workers needed. A contrasting example, Gordon observed, could be found in the health care industry: while the large health care organizations are making the change to electronic record-keeping, many small medical practices still have the traditional roomful of file cabinets and seem resistant to change.
Robert Shiller wondered whether the real value of many small busi-nesses lay not so much in their innovative potential as in their ability to provide more individualized personal service. The success of so many big restaurant franchises notwithstanding, few people, he imagined, would want to see the chains entirely supplant the familiar, owner-operated neigh-borhood restaurant. The same could be said of many personal service pro-viders, such as clinical psychologists and accountants. Shiller noted that the Small Business Administration offers little support to this type of busi-ness, instead catering mainly to other types for which it can play a more venture capital–like role. Although small businesses of the first type do receive quasi-subsidies in the form of lighter regulation and lower taxes, these seemed to him justified if they allow such businesses to continue pro-viding the attentive, one-on-one service that customers value. Ricardo Reis added that although such businesses might not be innovative in the sense of introducing wholly new products and services, they do often innovate in a broader sense of providing greater local variety—adding a Thai restau-rant where formerly there were only pizza and Chinese, for example. They also provide local competition—actual competition, as opposed to just the threat of competition as would suffice in a frictionless economy—and thus help keep prices close to marginal cost.
Reis also pointed out that if the authors were right that the bulk of the benefits of small businesses are largely nonpecuniary, one should ask whether this also determines the marginal benefits when one chooses to start a business. If so, subsidizing small businesses is not so costly because they are supporting something of value without distorting incentives. Small business owners are doing what they would have done anyway, because it is the nonpecuniary benefits that are driving their behavior. The ques-tion for Reis was whether this proposition could be tested: the effective

140 Brookings Papers on Economic Activity, Fall 2011
subsidies to small businesses have varied greatly over time and space—could one exploit this variation to measure their effects?
The argument over small business subsidies reminded Refet Gürkaynak of the debate in Europe over the Common Agricultural Policy: the French have long resisted the elimination of subsidies to small family farms, argu-ing that these farms are essential to maintaining the traditional French way of life. Gürkaynak felt that although such subsidies are indefensible on efficiency grounds, if they promote something that the public wishes to preserve, whether it be national identity or variety or something else, poli-cymakers should respect that wish, even at the cost of some efficiency loss. In other words, whereas Reis had argued that small business subsidies are justifiable because they create no economic distortions, Gürkaynak was arguing that they may be justifiable even if they do create distortions. The question then becomes how to subsidize them in the least inefficient manner.
Justin Wolfers objected to the previous speakers’ beatification of non-entrepreneurial small businesses. After all, he noted, these businesses create few jobs and often mistreat those they do employ; they are exempt from or can circumvent workplace safety, family leave, minimum wage, and antidiscrimination laws and regulations, among others. Many of them cheat on their taxes as well.
Alan Blinder said he had been about to comment that the Panel was surely in agreement on not subsidizing small businesses, but clearly that assumption was no longer tenable. In his view, the effective absence of taxation on small businesses in the United States created an enormous dis-tortion that could only be justified by some overwhelming rationale in its favor—something far beyond having a different ethnic restaurant on every corner. Blinder accepted the paper’s finding that only a small fraction of small businesses innovate and grow, but one thing economists still agreed on, he thought, was that government is incapable of picking those winners ex ante, which meant that not even those few small businesses should be subsidized.
Robert Hall saw the paper as undermining the whole notion that “small business sector” is an interesting or useful concept; such a classification, the paper had shown, lumps together businesses that are in fact quite differ-ent from one another. He agreed that only a few small businesses are really entrepreneurial. Indeed, work that he had done with Susan Woodward suggested that entrepreneurial effort is dramatically undersupplied in the U.S. economy—a phenomenon that they believed was associated with the extreme burden of idiosyncratic risk that entrepreneurs bear. It would be better to redirect attention—and the activity now conducted by the Small

CoMMenTS and dISCuSSIon 141
Business Administration—away from the bulk of small businesses and toward those that engage in real entrepreneurship.
Frederic Mishkin urged a distinction between types of small business subsidies: while agreeing with Hall that formal subsidies like those offered by the SBA should be shifted to those businesses that could make better use of them, he argued that subsidies that take the form of exemption from regulation are different, and indeed are not “subsidies” at all in the usual sense. If, as seems likely, there are high fixed costs to complying with regulations, then a strong argument can be made for exempting small busi-nesses from them.
Following up on Mishkin’s observation, Randall Kroszner conjectured that for many small businesses, the deterrent to growth was precisely the prospect of higher regulatory costs if they grew beyond a certain threshold size. It would be interesting to see, given Adam Looney’s documentation that many regulations have a size threshold for exemption at x employees, whether there is a clustering of firms at x – 1.
Benjamin Friedman reminded the Panel that small firms are not the only recipients of government subsidies. General Electric, as is well known, paid no federal income tax in 2010. Many other large firms, including many that invest in intensive lobbying, likewise pay no income tax. The oil industry, which is heavily subsidized, is hardly dominated by small firms, nor is the defense industry, although small firms do exist in both. The U.S. Export-Import Bank is an important source of federally subsidized lending, and although it now has a dedicated small business program, the bank still mostly caters to large companies. More than a hundred Boeing aircraft a year—nearly a third of the company’s output—receive Ex-Im Bank sub-sidized loans, and the financing it provides to this one company’s sales dwarfs its entire small business loan program in value.
Christopher Carroll responded to Hall that it does make sense to con-sider small business as a class, precisely on the grounds that all are exempt from certain regulations to which other businesses are subject and from certain taxes that other businesses pay. If one wants to analyze the effects of those regulations and tax provisions, one cannot avoid making the dis-tinction between small and large. On the other hand, Friedman was correct to point to the favors that the largest businesses receive. It may be that it is the firms in the middle that are at a disadvantage relative to the extremes. Carroll also suggested that anyone who sees few economic consequences from the implicit subsidy inherent in weak tax enforcement should look at Italy. The Italian marketplace is full of small shops that almost surely would not survive were they not effectively exempt from taxation. Some

142 Brookings Papers on Economic Activity, Fall 2011
Italian economists believe that the country’s recent economic stagnation owes much to the political system’s refusal to rationalize the tax burden across the different size categories.
Susan Woodward noted that if the owners of small businesses start them for mainly nonpecuniary reasons, one might expect those businesses to be relatively immune from business cycle fluctuations. The experience of the last recession, however, suggested otherwise. Whereas payroll employ-ment had fallen 5 percent from its 2007 peak, self-employment, taken as the sum of incorporated and unincorporated self-employed persons, had fallen 13 percent. Likewise the number of firms with 100 or fewer employ-ees was down 10 percent, compared with 5 percent for all firms. Those who would like to see fewer small businesses thus seemed to be getting their wish.
Annette Vissing-Jorgensen asked whether the authors could sort their data by industry or in some other way that would reveal which small busi-ness owners are more likely to choose that form of organization for non-pecuniary reasons.
Responding to the discussion, Erik Hurst agreed with Blinder that the way to frame the subsidy issue was to say that there are costs as well as benefits from subsidization, and one of the aims of the paper was to point out that the net costs could be substantial, especially if the targeted firms do not respond in the way the subsidizer had hoped. In reply to Reis, Hurst suggested that the presence of private benefits from having more ethnic res-taurants and the like was not sufficient grounds for subsidization—one also derives private benefits from having flat-screen TVs, for example—and he thought that subsidizing them might well lead to distortions.
Hurst agreed with Lazear that some available evidence indicated a dif-ference in average pay between self-employed and payroll workers that compensated the latter for the disamenities of not being one’s own boss. He also agreed that surveys were not the best instrument for measuring that differential. What interested Hurst in the survey data was that there seemed to be some correlation between respondents who reported nonpecuniary benefits and the actual growth of their businesses.
Finally, Hurst also agreed with the panelists who had called for zeroing in on the small firms that do grow, to see how they differ from other small firms, and in fact he and Pugsley were presently seeking to obtain Census data to do exactly that.