Embed Size (px)
Citation preview

© Kantar 2019
What difference does the provision of paper questionnaires make to the Community Life Survey sample and results?
May 2019
Joel Williams

© Kantar 2019
Contents
Non-statistical summary of the findings 3
1. Background to this study 4
2. Objectives of this study 6
3. Q1: Who is most likely to respond on paper - rather than online - if paper questionnaires are
included in the 2nd reminder? 7
4. Q2: Does the targeted design improve the sample profile? What would be the optimal design in
this respect? 10
5. Q3: How important is it to have a sample that is proportionate with respect to internet usage?
13
6. Q4: What difference does the inclusion of paper questionnaires in the 2nd reminder make to
the key results? 17
7. Summary and recommendations for the future 21
8. Technical appendix 23

3 © Kantar 2019
Non-statistical summary of the findings
The Community Life Survey has an ABOS design (address-based online surveying). ABOS is a type of
‘web-push’ method in which online data collection is preferred but a secondary mode is also available for
those who want it (in this case, a paper questionnaire). Usually, two reminders are sent to each sampled
address to encourage participation.
The paper questionnaire option is offered for two reasons: first, to encourage survey participation among
those who rarely or never use the internet (13% of the population in England aged 16+); second, as a tool for
making the responding sample as representative of the population as possible.
To achieve this second objective, two paper questionnaires are included in a targeted subset of 2nd
reminders but not in all. In the most deprived 40% of the country, all 2nd reminders include two paper
questionnaires; in the least deprived 40% of the country, no 2nd reminders include two paper questionnaires.
A mixed design is used in the remaining 20% of the country. In addition, any sampled person can request a
paper questionnaire at any time from the survey contractors. The present study demonstrates that this
targeted use of paper questionnaires is effective at achieving its objectives but could be refined further.
Plans are in place to do that.
A mixed-mode (online/paper) approach brings into the sample plenty of people who rarely or never use the
internet and this is important for the Community Life Survey. The present study found that the frequency of
using the internet is strongly associated with the level of reported volunteering, civic participation, and
charity-giving, even when controlling for other demographic characteristics. Therefore, it is vital that the
Community Life Survey sample reflects the variety of internet usage levels within the population. Offering a
paper questionnaire option goes a long way toward meeting this requirement.
A great deal of design effort has gone into making the online and paper questionnaires as similar as possible
but some ‘mode effects’ cannot be wholly eradicated. A mode effect is present if the same person would
respond differently online than on paper. The present study found that if this person responded on paper
rather than online, he/she would be more likely to report giving to charity and engaging in general
neighbourliness. In contrast, if this person responded online rather than on paper, he/she would be more
likely to report volunteering activity and civic action. Having said that, the limitations of the study mean that
these effects may also be due to unidentified differences between the types of people who respond on paper
and the types of people who respond online.
In general, the present study reinforces the importance of including a paper questionnaire option in the
Community Life Survey. However, this is a judgment for now; as internet usage rates approach 100% over
the next decade, that judgment may change.

4 © Kantar 2019
1. Background to this study
The Community Life Survey has an ABOS design (address-based online surveying). ABOS is a type of
‘web-push’ method in which online data collection is preferred but a secondary mode is also available for
those who want it (in this case, a paper questionnaire). The Survey has been running in this format since
2013 but its design has evolved significantly over that period. The current ABOS design is summarised
below1:
1. A stratified random sample of English addresses is drawn from the Postcode Address File;
2. The sample is (usually) divided into eight replicates, one issued every six or seven weeks;
3. All individuals aged 16+ and resident at the sampled addresses are invited to take part in the survey;
4. Four sets of web survey login details are supplied with each invitation letter and these are also
included in all reminder letters;
5. Each set of web survey login details can be used only once;
6. Two reminder letters are issued as standard, each two weeks apart;
7. A paper version of the questionnaire is available on request; this covers the majority of the online
questionnaire but not all of it;
8. In addition, two paper questionnaires are included in a targeted share of the 2nd reminder packs (see
below for details);
9. 3rd reminders are used tactically if the response rate in a particular quarter is lower than the
contracted minimum; these reminders do not include any paper questionnaires;
10. The estimated (weighted) response rate was 23.9% in 2015-16 and 22.4% in 2016-17;
11. The data is weighted to an extensive set of ONS population totals: gender crossed by age, region,
housing tenure, degree-education crossed by age, ethnic group, and household size;
12. The online subset of the data is also weighted to the same set of population totals to facilitate online-
only analyses.
The paper questionnaire option is included for two reasons: first, to encourage survey participation among
those who rarely or never use the internet; second, as a tool for reducing the variation in response rates
between different sample strata.
For survey designs where the maximum achievable response rate is fairly low (as here), reducing the
variation in response rate between groups is usually the best way of minimising non-response bias. To
achieve this second objective, in both 2015-16 and 2016-17 two paper questionnaires were included in a
targeted subset of 2nd reminders but not in all.
It had previously been observed that the online response rate was substantially lower than average in the
most deprived areas of England, and substantially higher than average in the least deprived areas.
Consequently, the local (LSOA level) Index of Multiple Deprivation (IMD) score was used as an (inverse)
indicator of the likely local online response rate.
1 The 2016-17 survey technical report can be found at https://assets.publishing.service.gov.uk/government/uploads/system/uploads/attachment_data/file/651589/Community_Life__Online_and_Paper_Survey_Technical_Report_-_2016-17_v4_FINAL.pdf. The 2015-16 equivalent can be found at https://assets.publishing.service.gov.uk/government/uploads/system/uploads/attachment_data/file/567066/Community_Life_2015-16_face_to_face_technical_report_FINAL__1_.pdf

5 © Kantar 2019
In both years, the local IMD score was used to allocate sampled addresses to a particular 2nd reminder
strategy. The full database of English LSOAs was divided into five equal sized segments on the basis of the
IMD score and a different 2nd reminder strategy was used for sampled addresses in each segment:
• In the most deprived two segments, all 2nd reminders included two paper questionnaires;
• In the middle segment, approximately half of 2nd reminders included two paper questionnaires;
• In the least deprived two segments, no 2nd reminders included two paper questionnaires.
The results in terms of response rate are shown in table 1.1. Because there was an implementation error in
2015-16, it is best to look at 2016-17 to get a true representation of the effects of the targeted reminder
strategy. The (weighted) online response rate in 2016-17 was 16.7% but this varied from 10.9% in the most
deprived segment to 22.4% in the least deprived segment. The total response rate, combining both online
and paper responses was 22.4%, ranging from 20.5% in the most deprived segment to 24.4% in the middle
segment.
On its own terms, the targeted reminder strategy worked to reduce the variation in response rates between
the sample frame segments. However, this does not mean that the strategy necessarily improved
representation of the population in each segment. Although the response rate is widely considered an
indicator of sample quality, multiple studies have found the statistical connection between the two to be fairly
weak2. As part of this paper, we investigate whether this apparently positive result for the reminder strategy
holds up based on other available evidence.
Table 1.1 Weighted (estimated) response rates for the Community Life Survey
Local IMD 2015-16 2016-17
Online RR Total RR Online RR Total RR
Most deprived segment
11.5% 20.2% 10.9% 20.5%
2nd most deprived segment
14.2% 25.6% 12.8% 22.8%
Middle segment 16.1% 22.9% 17.5% 24.4%
2nd least deprived segment
18.0%* 23.4%* 19.6% 20.7%
Least deprived segment
21.2%* 27.4%* 22.4% 23.4%
SD between segments (as % of total RR)
23% 11% 28% 8%
TOTAL 16.2% 23.9% 16.7% 22.4%
*(In error) one third of the addresses in these cells in 2015-16 were allocated to receive two paper questionnaires in the 2nd reminder
2 See for example Sturgis, Williams, Brunton-Smith & Moore, “Fieldwork effort, response rate, and the distribution of survey outcomes”, Public Opinion Quarterly (Summer 2017) 81 (2): p523-542.

6 © Kantar 2019
2. Objectives of this study
This paper seeks to answer four questions about the use of paper questionnaires in the Community Life
survey over the course of 2015-17:
Q1: Who is most likely to respond on paper - rather than online - if paper questionnaires are included in the
2nd reminder?
Q2: Does the targeted design adopted in 2015-16 and 2016-17 improve the sample profile? What would be
the optimal design in this respect?
Q3: How important is it to have a sample that is proportionate with respect to internet usage?
Q4: What difference does the inclusion of paper questionnaires in the 2nd reminder make to the key results?
The answers to these questions are used to inform a set of recommendations about the use of paper
questionnaires in the Community Life Survey.

7 © Kantar 2019
3. Q1: Who is most likely to respond on paper - rather than online - if paper questionnaires are included in the 2nd reminder?
Based on data from both 2015-16 and 2016-17, it is possible to estimate the proportion of responses that
would be on paper given a uniform contact and recruitment process rather than the variable one that was
actually implemented for the Community Life Survey in 2015-17. That makes it easier to see which groups
are most likely to respond on paper and which are least likely. To that end, we have simulated a design in
which (i) two questionnaires are included in all 2nd reminders, and (ii) a nationally representative sample of
addresses is drawn.3
Overall, this design would be expected to yield responses that are 54% online and 46% on paper. However,
this ratio varies a great deal between groups. The expected paper share for each marginal group in the
weighting matrix – plus the sample frame segments - is shown in table 3.1.
The most notable variation is by age group, where the expected paper share ranges from 23% among 16-24
year olds to 79% among those aged 75+. It also varies significantly by ethnic group, with Asian respondents
relatively unlikely to use paper compared to other ethnic groups (c10% share compared to over 40% for
others). Table 3.1 also shows that respondents educated to degree-level are relatively less likely to use
paper compared to others.
3 For this analysis, each sampled address in 2015-16 and 2016-17 was weighted by one divided by the combined probability of being sampled and then allocated to get two paper questionnaires in the 2nd reminder. Note that, for segments 4 and 5 (the least deprived 40% of LSOAs in England), there are no contributing cases from 2016-17, only from 2015-16.

8 © Kantar 2019
Table 3.1: Estimated paper share of Community Life Survey responses if two paper questionnaires are
included in all 2nd reminders (based on data from 2015-17)
Variable Category Estimated paper share among respondents from this
category
Total population 46%
Age group 16-24 23%
25-34 36%
35-44 36%
45-54 37%
55-64 42%
65-74 58%
75 plus 79%
Gender Male 44%
Female 47%
Housing tenure Owned outright 54%
Owned with mortgage 37%
Other tenure (mostly renting) 43%
Highest education Aged 25-64 with degree 31%
Others 50%
Region North East 55%
North West 44%
Yorkshire & Humberside 53%
East Midlands 45%
West Midlands 44%
East 46%
London 37%
South East 41%
South West 53%
Household size One person household 58%
Multi-person household 42%
Ethnic group White 47%
Indian 9%
Pakistani/Bangladeshi 12%
Black 40%
Other 40%
Local IMD (= sample frame segment)
Most deprived fifth 46%
2nd most deprived fifth 44%
Middle fifth 41%
2nd least deprived fifth 46%
Least deprived fifth 49%

9 © Kantar 2019
A regression model using the same data confirms that age group is by far the strongest discriminator in
mode ‘choice’, followed by highest education level, ethnic group, gender and housing tenure:
• Even controlling for the other demographic characteristics in the weighting matrix, the expected
paper share of responses from the oldest age group (75+) is 45 percentage points greater than it is
for the youngest age group (16-24);
• Holding a degree reduces the expected paper share by 5 percentage points;
• Being male rather than female reduces this share by 3 percentage points;
• Being Indian or Pakistani/Bangladeshi reduces the expected paper share by 14 and 19 percentage
points respectively, compared to a White baseline;
• Owning property outright or with a mortgage reduces this share by 9 and 4 percentage points
respectively, compared to an ‘other tenure’ (mainly renting) baseline4.
The primary implication of this analysis is that, even if a uniform mixed-mode design was adopted, the share
of responses that are on paper would vary a great deal between groups. This would not matter if the online
and paper versions of the questionnaire had the same measurement properties (see Q4 for a discussion of
this) but would otherwise present problems for between-groups analyses.
However, fixing the paper share so it is uniform across demographic groups would be hard to do. It would
require a design in which either (i) no paper questionnaires are sent in the 2nd reminder (or to a very low
percentage of addresses), or (ii) the mode ‘offer’ varies between age groups at the very least.
The first design is straightforward to implement but would reduce the overall response rate as well as
reducing to a tokenistic level coverage of those who rarely or never use the internet.
The second solution is more subtle but would be difficult to implement with address-based sampling. While it
is true that the electoral roll provides age data for a substantial minority of residential addresses – and
database vendors try to fill in the gaps for the rest – this data is often in conflict with contemporary survey
data. Consequently, the opportunity to manipulate the paper share per demographic group is limited.
In any case, minimising the variation in the paper share of responses would be just one research objective.
Another general objective is to minimise the variation between groups in response rate (through either
mode). These two objectives might well be in opposition.
4 Although the model confirms the separate predictive power of age, educational level and ethnic group that was suggested by table 3.1, the effect of housing tenure does not follow the observed pattern. Overall, respondents who own property outright are more likely than average to use paper (a share of 54% compared to the average of 46%, see table 3.1) but the regression model suggests that - controlling for other demographic factors - outright ownership is associated with a lower paper share than other tenures. This apparent contradiction is explained by the different age profiles of each tenure type. Controlling for age, those who own property outright are less likely than their peers in mortgaged or rented accommodation to select the paper mode over the online mode.
10 © Kantar 2019
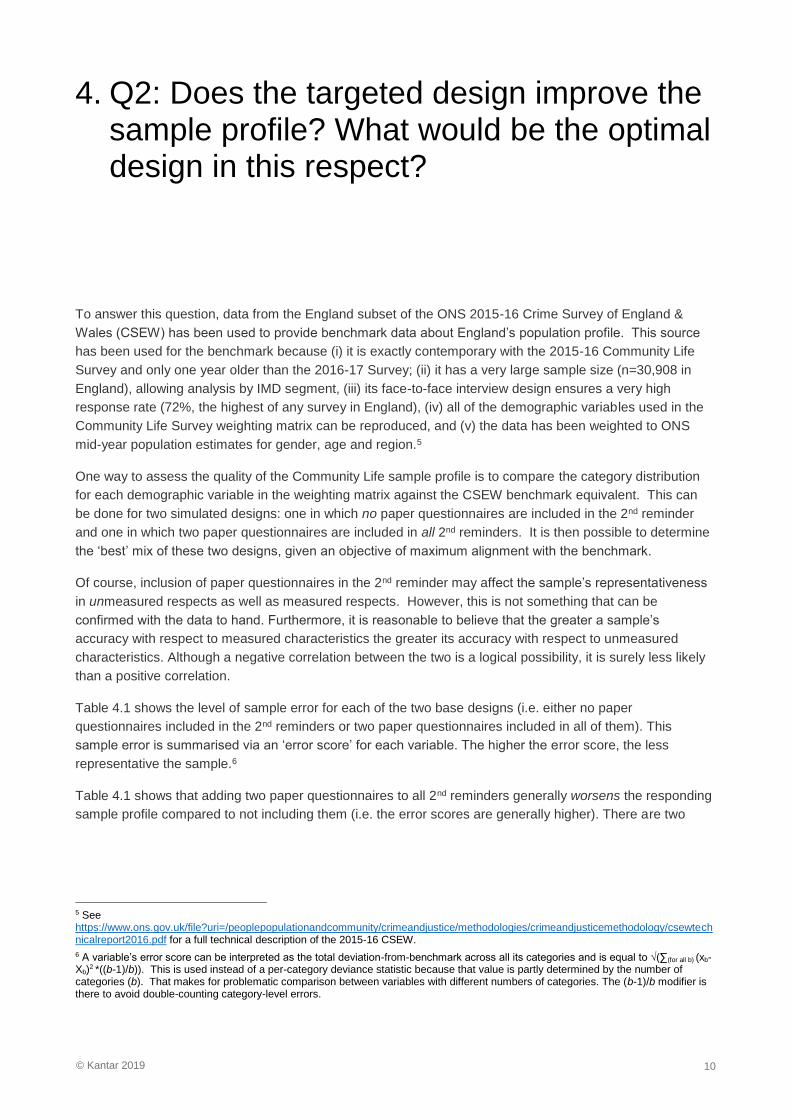
4. Q2: Does the targeted design improve the sample profile? What would be the optimal design in this respect?
To answer this question, data from the England subset of the ONS 2015-16 Crime Survey of England &
Wales (CSEW) has been used to provide benchmark data about England’s population profile. This source
has been used for the benchmark because (i) it is exactly contemporary with the 2015-16 Community Life
Survey and only one year older than the 2016-17 Survey; (ii) it has a very large sample size (n=30,908 in
England), allowing analysis by IMD segment, (iii) its face-to-face interview design ensures a very high
response rate (72%, the highest of any survey in England), (iv) all of the demographic variables used in the
Community Life Survey weighting matrix can be reproduced, and (v) the data has been weighted to ONS
mid-year population estimates for gender, age and region.5
One way to assess the quality of the Community Life sample profile is to compare the category distribution
for each demographic variable in the weighting matrix against the CSEW benchmark equivalent. This can
be done for two simulated designs: one in which no paper questionnaires are included in the 2nd reminder
and one in which two paper questionnaires are included in all 2nd reminders. It is then possible to determine
the ‘best’ mix of these two designs, given an objective of maximum alignment with the benchmark.
Of course, inclusion of paper questionnaires in the 2nd reminder may affect the sample’s representativeness
in unmeasured respects as well as measured respects. However, this is not something that can be
confirmed with the data to hand. Furthermore, it is reasonable to believe that the greater a sample’s
accuracy with respect to measured characteristics the greater its accuracy with respect to unmeasured
characteristics. Although a negative correlation between the two is a logical possibility, it is surely less likely
than a positive correlation.
Table 4.1 shows the level of sample error for each of the two base designs (i.e. either no paper
questionnaires included in the 2nd reminders or two paper questionnaires included in all of them). This
sample error is summarised via an ‘error score’ for each variable. The higher the error score, the less
representative the sample.6
Table 4.1 shows that adding two paper questionnaires to all 2nd reminders generally worsens the responding
sample profile compared to not including them (i.e. the error scores are generally higher). There are two
5 See https://www.ons.gov.uk/file?uri=/peoplepopulationandcommunity/crimeandjustice/methodologies/crimeandjusticemethodology/csewtechnicalreport2016.pdf for a full technical description of the 2015-16 CSEW.
6 A variable’s error score can be interpreted as the total deviation-from-benchmark across all its categories and is equal to √(∑(for all b) (xb-Xb)
2 *((b-1)/b)). This is used instead of a per-category deviance statistic because that value is partly determined by the number of categories (b). That makes for problematic comparison between variables with different numbers of categories. The (b-1)/b modifier is there to avoid double-counting category-level errors.

11 © Kantar 2019
exceptions to this. The first is an improvement in the sample’s profile with respect to age crossed by highest
educational level; the second is a vast – and expected - improvement in the sample’s internet usage profile7.
Table 4.1 Errors in the CLS responding sample’s demographic distribution (two simulated designs)
Variable in weighting matrix (b=number of categories)
Expected error score – no paper questionnaires in 2nd reminders
Expected error score – two paper questionnaires in all 2nd reminders
Difference in expected error score if two paper questionnaires included in all 2nd reminders instead of none
Gender crossed by age (b=14)
5.7%pts 8.7% pts +3.0%pts
Region (b=9) 3.3% pts 4.5% pts +1.2%pts
Housing tenure (b=3)
3.5% pts 7.1% pts +3.6%pts
Degree education crossed by age (b=5)
4.2% pts 1.6% pts -2.6%pts
Household size (b=2)
1.0% pts 4.2% pts +3.2%pts
Ethnic group (b=5) 2.3% pts 4.1% pts +1.8%pts
Frequency of internet use (b=6)
15.3% pts 2.9% pts -12.4%pts
Table 4.2 shows the average error score per variable - with and without internet usage frequency in the base
– for each of the IMD segments under both simulated designs. It demonstrates that, if we include frequency
of internet use as a target profile variable, then sending two paper questionnaires in all 2nd reminders is a
better strategy than sending none for the most deprived three fifths of the country, but it is a worse strategy
for the least deprived two fifths. On this basis, the current design – in which paper questionnaires are
targeted at the more deprived parts of England - is quite suitable. However, if we ignore the frequency of
internet use, then sending two paper questionnaires in every 2nd reminder is the less good strategy for all
IMD segments. Consequently, the ‘best’ strategy depends on the value we place on getting the right internet
usage distribution. We attempt to work this out in our answer to Q3.
In the meantime, table 4.2 includes error scores for two ‘optimised’ designs, one for minimising the error
score in each IMD segment with internet usage included in the variable set, and one for minimising the error
score in each IMD segment with internet usage excluded from the variable set8. These optimised designs
are quite different:
• If internet usage is included in the variable set, then the optimal mix requires that c.46% of
responses come from an approximately online-only design (no paper questionnaires in the 2nd
reminder), while c.54% should come from the full mixed-mode design. These shares differ between
IMD segments. In the most deprived segment, 15% of the respondents should come from the
approximately online-only design; in the least deprived segment, this share should be 90%.
• If internet usage is not included in the variable set, then the optimal mix requires that c.82% of
responses come from an approximately online-only design (no paper questionnaires in the 2nd
reminder), while c.18% should come from the full mixed-mode design. As before, these shares differ
7 Internet usage was not in the weighting matrix for the 2015-17 Community Life Survey but is included here to show that sending paper questionnaires in the 2nd reminder is effective at covering the part of the population that rarely or never uses the internet.
8 The ‘online only’ percentages for each area type are for the ideal proportion of responses from each design, not the proportion of addresses to sample. To compensate for its lower response rate, proportionately more addresses would be needed for the online-only design than for the mixed-mode design.

12 © Kantar 2019
between IMD segments with the approximately online-only design best suited to the least deprived
segments.
Table 4.2 Average error scores per IMD segment under three different designs ((i) online only, (ii) mixed
mode online + paper, and (iii) an optimised mix of the two)
IMD segment (1 = 20% most deprived; 5 = 20% least deprived)
1 2 3 4 5 All
Including internet usage
No paper questionnaires in 2nd reminders
Average expected error score across 7 variables
6.1% pts
6.2% pts
5.9% pts
5.2% pts
4.6% pts
5.0% pts
Two paper questionnaires in all 2nd reminders
Average expected error score across 7 variables
4.3% pts
5.3% pts
5.0% pts
5.6% pts
6.7% pts
4.7% pts
Optimal mix (c.46% from approximately online-only design, with share varying between segments)
Average expected error score across 7 variables
4.1% pts
4.9% pts
4.4% pts
5.0% pts
4.4% pts
4.1% pts
Excluding internet usage
No paper questionnaires in 2nd reminders
Average expected error score across 6 variables
4.0% pts
4.3% pts
4.8% pts
3.1% pts
3.4% pts
3.3% pts
Two paper questionnaires in all 2nd reminders
Average expected error score across 6 variables
4.5% pts
5.5% pts
5.3% pts
5.7% pts
6.7% pts
5.0% pts
Optimal mix (c.82% from approximately online-only design, with share varying between segments)
Average expected error score across 6 variables
3.6% pts
4.2% pts
4.4% pts
3.1% pts
3.4% pts
3.2% pts
It is clear from the answer to Q2 that the optimal use of paper questionnaires in the Community Life Survey
depends substantially on the importance of obtaining a good internet usage profile. In our answer to Q3, we
assess how important that is, allowing us to recommend which of the two optimal designs in table 4.2 is best.

13 © Kantar 2019
5. Q3: How important is it to have a sample that is proportionate with respect to internet usage?
As noted in our answer to Q2, we cannot determine the optimal use of paper questionnaires in the
Community Life Survey unless we understand what is gained by a good internet usage profile. In this
section, we try to answer that question.
Within the Community Life Survey, there are ten internet usage classes although codes 5-9 are usually
aggregated together as ‘less often than once a week’ for analysis purposes. Table 5.1 shows the expected
distribution of internet usage under two simulated designs: one in which no paper questionnaires are
included in the 2nd reminder (i.e. the design is approximately online-only with paper only offered on request)
and one in which two paper questionnaires are included in all 2nd reminders (i.e. the design is mixed-mode in
which nearly half the responses are on paper).
It should be obvious that the mixed-mode design is more representative with respect to internet usage than
the approximately online-only design. Although each internet usage class has some coverage in the
approximately online-only design, non-internet users make up only 2.4% of the responding sample,
compared to 12.0% for a fully mixed-mode design and 13.4% for the population (estimated via the 2015-16
CSEW used as a ‘benchmark’ for this study).
Table 5.1 Internet usage distributions under two different designs against a benchmark
Code Internet usage class 100% Approx. online-only design
100% Mixed mode online + paper
Benchmark = weighted ONS CSEW 2015-16
Coding in models
1 More than once a day 80.2% 65.7% 67.6% 1.Every day usage 2 Once a day 9.9% 11.0% 10.6%
3 2-3 times per week 4.8% 6.2% 5.1% 2.Other usage at least once a month
4 About once a week 1.6% 3.0% 1.2%
5 About once a fortnight 1.1% 2.2% 2.1%
6 About once a month
7 About once every 2-3 months
3.Rarely or never use
8 About once every six months
9 Less often
10 Not at all 2.4% 12.0% 13.4%

14
As shown in our answer to Q2, including paper questionnaires in the 2nd reminder does not materially
improve the sample profile in any other measured respect bar educational level so the value of a good
internet usage profile needs to be demonstrated empirically to justify this element of the design.
To do this, a series of logistic regression models have been produced, covering 21 of the 28 key variables
DCMS used in its own report on the 2015-17 data 9. Each of these models is of the form P(Yi=y) = f(Xi),
where Yi is the response for individual i, and Xi is a set of demographic covariates (age group, gender,
housing tenure, ethnic group, region, household size, degree-education status, and neighbourhood index of
multiple deprivation) plus response mode (online or paper) plus the focus of the model, internet usage
level.10
Because the list of demographic covariates includes everything in the weighting matrix plus the sample
frame (IMD) segments, each regression model indicates the additional predictive power of the internet usage
variable after weighting the data. Note that response mode is included in the models to help control for any
measurement effects and/or residual selection effects associated with mode ‘choice’ (see the answer to Q4
for a discussion of these effects).
Table 5.2 summarises the results. For 15 of the 21 variables, the internet usage variable has statistically
significant additional predictive power. Because the internet usage variable is correlated with other variables
in the model (e.g. with age and educational level) the coefficients themselves have fairly wide confidence
intervals. However, several of the coefficients are very large and most of them are in the same direction.
Therefore we can conclude that the greater the level of internet usage the greater the probability of reporting
civic participation, volunteering, or giving to charity. In partial contrast, heavy internet users are slightly less
likely than their peers to agree that they can influence what happens in their local area or to think such
influence is important.
9 The remaining seven variables are based on online-only data. The small number of cases reporting light/no internet usage means that the relationship between internet usage and each of these seven substantive variables would likely be estimated with error.
10 Internet usage level has been coarsened as recorded in table 5.1 to ensure a sufficient number of cases in each class. However, the conclusions are robust to the classification method.

15
Table 5.2 Odds ratios associated with internet usage levels (21 key variables)
Variable Odds ratio: ‘Every day
usage’ v ‘Rarely or
never use’ (1 = equal odds)
Odds ratio: ‘Other usage at
least once a month’ v
‘Rarely or never use’ (1 =
equal odds)
Civic participation in last 12 months 3.68*** 1.99***
Any civic activism in the past 12 months 3.03*** 1.99***
Formal volunteering at least once a month 2.81*** 1.89***
Formal volunteering in last 12 months 2.78*** 1.99***
Any Civic consultation in past 12 months 2.64*** 1.79***
Whether been personally involved in helping out with local issue/activity
2.52*** 1.88***
Formal or informal volunteering in the last month 2.36*** 1.73***
Formal or informal volunteering in the last 12 months 2.19*** 1.56***
Informal help in last 12 months 2.06*** 1.58***
Given money to charity in past 4 weeks 2.03*** 1.58***
Gave £10+ last time gave to charity 1.81*** 1.09
Very/fairly satisfied with local area as a place to live 1.30* 1.16
Chat to neighbours at least once a month (more than just hello)
1.16 1.44**
Agree that 'I borrow things and exchange favours with my neighbours'
1.13 1.04
Agree that this local area is a place where people from different backgrounds get on well together
1.12 1.06
Over the past two years this area has got better 1.11 1.22
Agree that people in this neighbourhood pull together 0.98 1.17
Very/fairly strongly believe belong to immediate neighbourhood
0.83* 0.80*
Occasionally or more often feel lonely 0.76** 0.99
Agree that can influence decisions affecting area 0.73** 0.77*
Personal importance of being able to influence decisions in local area
0.51*** 0.52***
***Significant at 0.1% level ** Significant at 1% level
*Significant at 5% level ~Significant at 10% level
On this basis, it seems that coverage of the range of internet usage levels is important for the Community
Life Survey and that an approximately online-only design (i.e. in which a paper questionnaire is offered only
on request) would be problematic given the small numbers of people who rarely or never use the internet
that respond online. Although an approximately online-only sample could be weighted to reflect population
internet usage levels, its statistical efficiency would be compromised by the need for weights of 6-7 times the
average for non-internet users. Furthermore, the weighting design would probably need to ensure the right
age profile in each internet usage class, not just the right usage distribution overall. This would likely reduce
statistical efficiency still further. Finally, weighting is unlikely to fully compensate for the non-response bias
because non-internet users who nevertheless complete an online survey are unlikely to be typical non-
internet users!

16
In summary, this evidence suggests that obtaining robust samples from each internet usage class is
important for the Community Life Survey and that an approximately online-only design is not suitable due to
its under-representation of people who rarely or never use the internet. Consequently, when considering the
‘optimal’ use of paper questionnaires, the prospective internet usage profile should be taken into account (so
the first ‘optimal mix’ in table 4.2 is preferable to the second). This will probably remain the case even if
internet usage rates approach 100% in the future. As table 5.2 shows, everyday users of the internet are
different from less frequent users as well as being different from rare/never users. Achieving the right
distribution with respect to internet usage frequency is as important as achieving a good balance between
those who use the internet and those who rarely or never use it.

17
6. Q4: What difference does the inclusion of paper questionnaires in the 2nd reminder make to the key results?
To answer Q4, we identify for each key variable the residual effect of including paper questionnaire data
alongside online data, once the observed demographic differences have been accounted for. If a residual
effect is zero, then a population estimate drawn from mixed mode (online and paper) data will not be
systematically different from the equivalent population estimate drawn from online-only data11. However, if
the residual mode effect is nonzero, then the addition of paper data will systematically affect the population
estimate.
To estimate the residual mode effects, we have used the same series of logistic regression models used to
answer Q3. As noted above, these models cover 21 of the 28 key variables DCMS used in its own reports on
the 2015-17 Community Life Survey data. Each of these models is of the form P(Yi=y) = f(Xi), where Yi is the
response for individual i, and Xi is a set of demographic covariates (age group, gender, housing tenure,
ethnic group, region, household size, degree-education status, internet usage level, and neighbourhood
index of multiple deprivation) plus the focus of the model, response mode (online or paper).
Table 6.1 summarises the results. For 10 of the 21 variables, the response mode variable has statistically
significant additional predictive power. Although most of these residual mode effects are fairly small, some
are substantial. The most obvious effects are that paper respondents are much less likely than their online
responding peers to report formal volunteering activity - and to a lesser extent civic participation - but much
more likely to report giving to charity and being generally ‘neighbourly’.
11 The online-only estimates might have more error variance due to worse coverage of light/never users of the internet than can be achieved with a mixed-mode survey.

18
Table 6.1 Odds ratios associated with responding on paper rather than online (21 key variables)
Variable Odds ratio: Paper v online, controlling for
demographic variables
Gave £10+ last time gave to charity 1.84***
Given money to charity in past 4 weeks 1.45***
Chat to neighbours at least once a month (more than just hello) 1.44***
Agree that people in this neighbourhood pull together 1.30***
Whether been personally involved in helping out with local issue/activity
1.23**
Very/fairly satisfied with local area as a place to live 1.13~
Agree that this local area is a place where people from different backgrounds get on well together
1.11
Any Civic consultation in past 12 months 1.08
Informal help in last 12 months 1.07
Very/fairly strongly believe belong to immediate neighbourhood 1.06
Over the past two years this area has got better 1.03
Can you influence decisions affecting area 0.99
Formal or informal volunteering in the last 12 months 0.97
How important is it personally for you to be able to influence decisions in your local area
0.93
Occasionally or more often feel lonely 0.87*
Agree that 'I borrow things and exchange favours with my neighbours'
0.85~
Any civic activism in the past 12 months 0.84~
Civic participation in last 12 months 0.81***
Formal volunteering at least once a month 0.78***
Formal volunteering in last 12 months 0.72***
Formal or informal volunteering in the last month 0.47***
***Significant at 0.1% level ** Significant at 1% level
*Significant at 5% level ~Significant at 10% level
There are two possible reasons why the paper data might be making a difference: measurement effects or
residual selection effects. A measurement effect is present if some of those answering a question would
respond differently on paper than they would online. A residual selection effect is present if those responding
on paper are systematically different from those responding online, even after controlling for obvious
demographic contrasts12.
The problem is that it is difficult to separate out measurement effects from residual selection effects. All we
observe are the effects of responding by paper versus responding online. We cannot know whether these
12 The paper questionnaire has always been employed as a secondary mode for the Community Life Survey and has never been sent alongside the invitation letter or the 1st reminder. Consequently, the sample responding on paper is exclusively made up of people who chose not to - or could not – complete the online questionnaire. This feature makes it quite likely that there are different selection effects on the paper data as compared to the online data, even when controlling for observed demographic differences between the two sets of respondents.

19
effects are solely measurement effects, post-demographic selection effects or (perhaps more likely) a
combination of both effects, each of which may point in a different direction13.
In general, we would prefer there to be no differential measurement effects between the online and paper
questionnaires since these can cloud inference. The methodological literature generally suggests that online
and paper data can be combined fairly safely because measurement effects between the two are usually
small. However, a general finding like this may not hold in specific instances.
In contrast, differential selection effects may or may not be a good thing. In our answer to Q2, we showed
that a fully mixed-mode design only really improves the sample’s internet usage distribution - relative to an
approximately online-only design - and makes other sample distributions worse, despite the response rate
nearly doubling. However, in our answer to Q3 we demonstrated that the internet usage distribution is an
important thing to get right. Furthermore, even if other aspects of the sample’s demographic profile are not
improved through the addition of paper data, that does not rule out the potential for the mixed-mode sample
to be more representative than the online-only sample with respect to the substantive survey variables.
We might be able to provide a partial answer to this question by comparing the (weighted) survey estimates
from the last (2015-16) face-to-face interview survey with the weighted ABOS online-only and combined
online/paper survey estimates from 2015-17. Given the much higher response rate of the face-to-face
interview survey (61%) compared to the ABOS survey, it is reasonable to assume that selection effects on
the interview data should be the same size or smaller than selection effects on the ABOS data. If so, then
we might be most confident of the ABOS estimate – online or mixed-mode – that is closest to the interview
estimate. If the mixed-mode estimate is ‘better’ in this respect, then we may conclude that the addition of
paper responses improves the estimate; if the online-only estimate is ‘better’, then we may conclude that the
addition of paper responses does not help.
In fact, as table 6.2 shows, there is no consistent pattern to support one approach over the other. In four of
the nine cases where significant residual mode effects were identified (see table 6.1) the mixed-mode
(official) ABOS estimate is closest to the interview estimate; in the other five cases, the online-only ABOS
estimate is closest. On this basis, it would seem that the addition of paper responses helps improve the
accuracy of estimates about giving to charity and neighbourliness but reduces the accuracy of estimates of
volunteering. However, answers about volunteering, giving to charity or neighbourliness may be subject to
more social desirability bias in an interview situation than when self-completing a questionnaire. If so, then
the interview estimate is an imperfect benchmark and we are back to simply noting the mode effects without
value judgment.
13 Logically, a zero residual effect might hide two opposite but large selection and measurement effects.

20
Table 6.2 Comparison of weighted face-to-face interview estimates (2015-16) with same-weighted ABOS
estimates (2015-17) and ABOS online-only estimates (2015-17): 9 variables with strongest residual online v
paper mode effects
Variable F2F 2015-16
ABOS mixed mode 2015-17
ABOS online only 2015-17
Gave £10+ last time gave to charity 63.4% 63.4%* 61.8%
Given money to charity in past 4 weeks 73.5% 75.6% 74.5%*
Chat to neighbours at least once a month (more than just hello)
77.1% 73.2%* 72.0%
Agree that people in this neighbourhood pull together
66.3% 64.1%* 63.1%
Whether been personally involved in helping out with local issue/activity
17.5% 15.8% 15.9%*
Civic participation in last 12 months 34.0% 39.2%* 41.7%
Formal volunteering at least once a month 26.9% 22.1% 24.1%*
Formal volunteering in last 12 months 41.4% 37.2% 40.0%*
Formal or informal volunteering in the last month
46.9% 35.6% 40.7%*
*Closest to face-to-face interview estimate

21
7. Summary and recommendations for the future
This study has demonstrated that the inclusion of two paper questionnaires in the Community Life Survey’s
2nd reminder has an impact both on the sample profile and on the results.
A fully mixed-mode approach – in which paper questionnaires are included in all 2nd reminders – would not
improve the sample profile in most observable respects compared to an approximately online-only approach
in which paper questionnaires are available only on request.
However, this mixed-mode approach would bring in to the sample plenty of people who rarely or never use
the internet and this is important for the Community Life Survey. Internet usage level is a strong predictor of
reported volunteering, civic participation, and charity-giving even when controlling for other demographic
characteristics. Therefore, it is vital that the sample reflects the variety of internet usage levels and that this
is taken into account when assessing the ‘optimal’ use of paper questionnaires in the Community Life
Survey.
In the 2015-17 design, the use of paper questionnaires is varied between five segments defined by the
neighbourhood index of multiple deprivation (IMD). Two paper questionnaires are included in all 2nd
reminders in the most deprived two segments; no paper questionnaires are included in the least deprived
two segments; and a mixed-design is used in the middle segment. This design is fairly similar to an ‘optimal’
design which seeks to maximise the accuracy of the sample profile in each segment. However, the ‘optimal’
design is better than the 2015-17 design because it gives every sampled address a nonzero probability of
being allocated paper questionnaires in the 2nd reminder. This approach would offer better coverage of non-
internet users in the least deprived segments.
We recommend the allocation shown in table 7.1 which ought to yield the most representative responding
sample profile that can be obtained, given an ABOS design.14
14 The response percentages in the third column would be optimal for sample representation; the address allocation percentages in the second column are designed to obtain the response percentages in the third column. For the ‘total’ row, it is assumed that an equal probability sample of addresses is drawn and that exactly one fifth of all English addresses are in each segment. In practice, because addresses are segmented based on the LSOA-based index of multiple deprivation – and LSOAs have some unevenness with respect to address totals - the total number of addresses in each segment is not exactly one fifth.

22
Table 7.1 Recommended allocation of paper questionnaires in 2nd reminder packs
Sample frame IMD segment % of addresses allocated to get two paper
questionnaires in the 2nd reminder
% of responses from addresses allocated two paper
questionnaires in the 2nd reminder
Most deprived segment 79% 85%
2nd most deprived segment 68% 75%
Middle segment 64% 70%
2nd least deprived segment 21% 25%
Least deprived segment 8% 10%
Total
48%
53%
This study also sought to estimate the mode effects of paper data compared to online data, with the caveat
that the source of the mode effects – residual selection effects or measurement effects – could not be known
with any certainty.
Mode effects certainly seem to be present in the data. Paper respondents appear more likely than online
respondents to give to charity and engage in general neighbourliness. In contrast, online respondents
appear to be more engaged than paper respondents in volunteering activity and civic action.
Comparison with interview data collected in 2015-16 was unable to establish which of online-only or mixed-
mode data was ‘better’ so we suggest that the design of the Community Life Survey should focus on
obtaining the best sample profile (through a mixed mode design) even if the presence of mode effects
between the online and paper data adds a non-negligible risk to inference.

23
8. Technical appendix
In this section, we describe the analysis methods used to answer each question.
Q1 Who is most likely to respond on paper - rather than online - if paper questionnaires are included
in the 2nd reminder?
For table 3.1, the paper share of data for each demographic group was calculated based on design cell A
only (i.e. two paper questionnaires included with the 2nd reminder). Each respondent case in a dataset that
combined the 2015-16 Community Life Survey data with the 2016-17 Community Life Survey data was
weighted by one divided by the probability of its address being sampled and being allocated to cell A.
A simple weighted frequency table was produced that disaggregated each demographic group by response
mode, allowing paper shares to be identified.
The regression model cited in the text was a no-intercept linear regression model of the form
Pi = B1X1i + B2X2i + … + ei
Pi = probability that case i responds on paper, rather than online
X1i, X2i + … = vector of case i values for demographic variables X1, X2 etc.
B1, B2, … = vector of regression coefficients, one for each variable X1, X2 etc.
ei = model residual
A linear regression model was used in place of a more standard binary logistic regression model to facilitate
reporting but the findings are not sensitive to the choice of model specification.
The predictor variables X1 to X8 were (i) age group (b=7: ’16-24’,’25-34’, ’35-44’, ’45-54’, ’55-64’, ’65-74’,
‘75+’), (ii) gender (b=2; ‘male’, ‘female’), (iii) housing tenure (b=3: ‘owned outright’, ‘owned with mortgage’,
‘others’), (iv) degree-holding status (b=2: ‘aged 25-64 w/degree’, ‘others’), (v) region (b=9: ‘NE’, ‘NW’,
‘Yorkshire and Humber’, ‘E Midlands’, ‘W Midlands’, ‘E’, ‘London’, ‘SE’, ‘SW’), (vi) household structure (b=2:
‘one adult household’, ‘others’), (vii) ethnic group (b=5: ‘White’, ‘Indian’, ‘Pakistani/Bangladeshi’, ‘Black’,
‘others’), (viii) number of paper questionnaires included in the 2nd reminder if needed (b=2: ‘two’, ‘none’).
Note that variable (viii) was included in place of Index of Multiple Deprivation segment because it carried the
predictive power of the latter.
Q2: Does the targeted design improve the sample profile? What would be the optimal design in this
respect?
For this analysis, both the 2015-16 and 2016-17 Community Life Survey respondent datasets were used with
each case weighted by one divided by its address sampling probability.
The demographic profile for online respondents was estimated based on both of the two key design cells
(cell A: two paper questionnaires included with the 2nd reminder; cell B: no paper questionnaires included

24
with the 2nd reminder). This was done to increase the available sample size based on the assumption that
the inclusion of paper questionnaires in the 2nd reminder should not have a strong impact on the
demographic profile of online responders.
The demographic profile for the combined online/paper respondents was estimated based on design cell A
only (i.e. two paper questionnaires included with the 2nd reminder). To obtain this profile, the case weight
was multiplied by one divided by the probability of its address having been allocated to cell A. However, this
last step was not strictly necessary because the analysis was carried out separately for each IMD segment in
each year, and there was no variation in cell A allocation probability within each of these sample subsets.
It is worth noting that the reminder strategy was implemented imperfectly in 2015-16. Consequently, two
paper questionnaires were included in a random third of addresses in the two least deprived segments
(instead of the intended none). This natural experiment allows us to estimate the impact of paper
questionnaires in the least deprived segments, as well as in the most deprived segments.
For the purpose of this analysis, the demographic profiles from 2015-16 and 2016-17 in each IMD segment
were combined to form a 2015-17 profile. This was done by using a mixing weight proportionate to the
relative single year sample sizes for each segment and for each respondent subset (i.e. for (i) online
respondents and (ii) respondents from either mode, given a design in which two paper questionnaires are
included in the 2nd reminder).
To provide the benchmark profile, each case in the 2015-16 CSEW dataset was weighted using the
‘individual level’ weight used to produce its official statistics. Respondents in Wales were filtered out before
running the tables.
Error scores were calculated for each respondent set. The error scores may be interpreted broadly as the
total amount of deviation-from-benchmark across all categories b in the variable; it is not the average per
category. The error score for each variable is equal to
√(∑(for all b) (xb-Xb)2*((b-1)/b))
xb = sample percentage in category b
Xb = benchmark percentage in category b
b = number of categories in variable
This is used instead of a per-category deviance statistic because such a value would be partly determined by
the number of categories. That makes for problematic comparison between variables with different numbers
of categories.
Error scores have been averaged for some analyses, including one that includes internet usage profile in the
list of target variables and one that excludes it.
‘Optimal’ designs were identified by iteratively testing different mixing weights between the approximately
online-only sample profile and the mixed-mode sample profile, and evaluating the designs with respect to the
two averaged error scores (i.e. with or without internet usage profile as a target variable). The optimal design
- with frequency of internet use included in the base - is shown in the ‘Summary and recommendations for
the future’ section (table 7.1).
Q3: How important is it to have a sample that is proportionate with respect to internet usage?
The internet usage distributions in table 5.1 were drawn from the same set of tables used to calculate the
error scores in tables 4.1 and 4.2.

25
For the second analysis (table 5.2), the 2015-17 combined Community Life Survey dataset was used. Each
case was weighted by one divided by its address sampling probability and a series of binary logistic
regression models were run of the form
ln(pb/(1-pb) = B0 + B1X1i + B2X2i + …
pb = probability that case is in category b, rather than not-b
X1i, X2i + … = vector of case i values for demographic variables X1, X2 etc.
B0 = intercept regression coefficient
B1, B2, … = vector of regression coefficients, one for each variable X1, X2 etc.
ln = natural logarithm of ()
The predictor variables X1 to X10 were (i) age group (b=7: ’16-24’,’25-34’, ’35-44’, ’45-54’, ’55-64’, ’65-74’,
‘75+’), (ii) gender (b=2; ‘male’, ‘female’), (iii) housing tenure (b=3: ‘owned outright’, ‘owned with mortgage’,
‘others’), (iv) degree-holding status (b=2: ‘aged 25-64 w/degree’, ‘others’), (v) region (b=9: ‘NE’, ‘NW’,
‘Yorkshire and Humber’, ‘E Midlands’, ‘W Midlands’, ‘E’, ‘London’, ‘SE’, ‘SW’), (vi) household structure (b=2:
‘one adult household’, ‘others’), (vii) ethnic group (b=5: ‘White’, ‘Indian’, ‘Pakistani/Bangladeshi’, ‘Black’,
‘others’), (viii) Index of Multiple Deprivation segment (b=5, from most deprived fifth of country to least), (ix)
response mode (b=2: ‘online’, ‘paper’), (x) internet usage level (b=3: ‘every day usage’, ‘other usage at least
once a month’, ‘rarely/never use the internet’).
The regression coefficients were transformed into conditional odds ratios versus a reference category for
reporting purposes. Only the internet usage odds ratios have been reported in this section. The product of
each case’s conditional odds ratios and the intercept odds is equal to an overall estimate of (pb/(1-pb) for
each case i.
The 28 key DCMS variables were (i) reduced to 21, excluding the online-only variables, and (ii) converted
into binary variables where necessary. A separate regression model was run for each of the 21 variables.
Q4: What difference does the inclusion of paper questionnaires in the 2nd reminder make to the key
results?
The results in table 6.1 were drawn from the same regression models used to produce table 5.2. Only the
mode odds ratios have been reported in this section.
For table 6.2, the official calibration weights were used for all three datasets (2015-16 interview dataset,
2015-17 ABOS dataset, and the online-only subset of the 2015-17 ABOS dataset). The 2015-17 ABOS
dataset is a simple combination of the single year 2015-16 and 2016-17 datasets with no changes made to
the distribution or scaling of the calibration weights (i.e. each year has an equal sum of weights within the
two-year dataset).
The same 21 key variables used to answer Q3 were used to answer Q4.