Embed Size (px)
Citation preview
Staff Working Paper ERSD-2010-07 Date: February 2010
World Trade Organization Economic Research and Statistics Division
What Constrains Africa's exports?
Caroline Freund Development Economic Research Group, The World Bank
Nadia Rocha Economic Research and Statistics Division, WTO
Manuscript date: January 2010 Disclaimer: This is a working paper, and hence it represents research in progress. This paper represents the opinions of the authors, and is the product of professional research. It is not meant to represent the position or opinions of the WTO or its Members, nor the official position of any staff members. Any errors are the fault of the authors. Copies of working papers can be requested from the divisional secretariat by writing to: Economic Research and Statistics Division, World Trade Organization, Rue de Lausanne 154, CH 1211 Geneva 21, Switzerland. Please request papers by number and title.
What Constrains Africa's exports?
Caroline Freund* Nadia Rochaς
Abstract. We examine the effects of transit, documentation, and ports and customs delays on Africa’s exports. We find that transit delays have the most economically and statically significant effect on exports. A one day reduction in inland travel times leads to a 7 percent increase in exports. Put another way, a one day reduction in inland travel times translates into 1.5 percentage point decrease in all importing-country tariffs. In contrast, longer delays in the other areas have a far smaller impact on trade. We control for the possibility that greater trade leads to shorter delays in three ways. First, we examine the effect of trade times on exports of new products. Second, we evaluate the effect of delays in a transit country on the exports of landlocked countries. Third, we examine whether delays affect time-sensitive goods relatively more. We show that large transit delays are relatively more harmful because of high within-country variation. Keywords: trade facilitation, export times, transit delays, gravity models. JEL Classifications: F13, F14 and O55.
* Development Economic Research Group, The World Bank. ς Economic Research and Statistics Division, World Trade Organization. We would like to thank Allen Dennis for providing us with disaggregated data from the Doing Business report. We are also grateful to GPS team for providing us with detailed GPS data on Sub-Saharan Africa travel distances and times. In addition, we would like to thank seminar participants at the World Bank seminar, the Geneva Trade and Development Workshop and the European Trade Study Group (ETSG) conference. This paper received financial support from the governments of Finland, Norway, Sweden and the United Kingdom through the Multidonor Trust Fund for Trade and Development. The views presented in the paper are those of the authors and do not reflect the views of World Bank or the World Trade Organization.
3
I. Introduction
Earlier work has shown that delays in getting goods from the factory gate onto the ship hinder
exports more than foreign tariffs do (Hummels (2001), Djankov, Freund and Pham (2010), and
Portugal and Wilson (2009)). This is especially debilitating for Africa’s exports because of extreme
delays. This suggests that improving trade facilitation in Africa would significantly boost exports.
But there are different ways to accomplish this, as the time delay has three distinct components:
documentation, transit time, and port handling and customs clearance. In this paper, we explore
whether these delays are equally burdensome or whether one of these binds relatively more, using
detailed data on average trade times from the World Bank’s Doing Business report.
Bureaucratic delays are the longest, taking 19 days on average. There is a lot of variation
across countries. For example, it takes 36 days to process export documents in countries such as
Angola, Zambia and Niger. In contrast, in Swaziland, it takes only 5 days to produce all necessary
export documents. Bureaucratic delays may be especially burdensome if they change often, making
them difficult to predict, or if officials use them as a means to extract rents. In contrast, documentation
procedures may be less problematic if they are predictable and can be done in advance or if there is
learning by doing.
Customs and ports delays are the second longest, taking on average 9 days. They are less
variable than documents. Customs and ports could be especially restrictive if there is a hold-up
problem. Once the goods arrive, customs and port authorities could extract high rents by delaying
goods. In contrast, if customs and ports are reliable (but slow) or if exporters can pay for faster
service they may cause fewer problems.
Transit costs are on average the shortest, taking 7 days. But, again, there is a lot of variation.
For example, it takes 37 days for the goods to be shipped from Bujumbura (Burundi) to Dar Es
Salaam port (Tanzania) and only one day within Gabon. Transit costs may be less burdensome if
economic activity has developed endogenously, close to ports and borders when transit costs are large.
However, they may be more constraining if there is a lot of uncertainty that cannot be avoided.
The main contribution of our paper is to understand whether different types of export costs affect
trade differently. We use a modified gravity equation that controls for importer fixed effects and
exporter remoteness. An important concern with this approach is that the volume of trade may
directly affect trade costs. The marginal value of investment in trade facilitation is higher when trade
volumes are large since cost savings are passed on to a larger quantity of goods. In addition, many
time-saving techniques, such as computerized container scanning, are only available in high-volume
ports. Alternatively, increased trade volumes could increase congestion and lessen the efficiency of
trade infrastructure. Thus, while more efficient trade facilitation may stimulate trade, trade is also
likely to directly influence trade facilitation.
4
We use three distinct strategies to deal with the potential effect of export volumes on export times.
First, we examine the effect of trade facilitation on trade in new products. These are goods that have
not been exported in the past. The intuition is that trade in new products cannot affect the quality of
trade facilitation infrastructure or the bureaucracy that is in place for exporting. Second, we examine
the effect of requirements in the transit country on exports from landlocked countries. This controls
for endogeneity because trade facilitation in transit countries is likely to be exogenous from the
perspective of a landlocked country. Finally, we test whether lengthy delays have a greater effect on
exports of time-sensitive goods. The intuition is that these products make up a small share of total
trade so are unlikely to affect trade facilitation.1
All three different techniques used to analyze the effect of export times key components on trade
values lead to the same conclusion: inland transit delays have a robust negative effect on export
values. Our estimates imply that a one day increase of inland transit times reduces export values by
about 7 percent. This effect is higher for time-sensitive goods with respect to time-insensitive goods.
In contrast, we do not find a robust effect of documents or customs and ports on exports.
Why would delays in one area affect trade relatively more than in other areas? One potential
answer is uncertainty. To the extent that delays are anticipated there should be only a small effect
because documents can be prepared in advance and goods can be shipped early, with ample time for
meeting deadlines. To evaluate this explanation, we examine the effect of within country export-time
uncertainty for each type of delay on export values. Again, we find that an increase in inland transit
time uncertainty has a negative and significant effect on trade values. The other time components
show no such effect. This suggests that long and unexpected delays in transit make it especially
difficult for producers to meet import deadlines.
Our results have important implications for policy. While reducing bureaucratic delays and
improving ports and customs may have small positive effects on trade, the binding constraint in most
African countries to expanding exports is inland transit. Improving inland transit is unlikely to be easy
or cheap, but it is likely to boost exports and have broad positive economic effects.
Beyond these direct implications for policy, our results also contribute to the broader debate about
the influence of geography versus institutions on income. This literature has focused on the effects of
climate versus governance on income, and potential interactions between the two.2 We focus on a
single component of income, exports, and our variables of interest reflect geography and institutions to
different extents. The dominance of transit time in hindering exports seems to suggest that geography
is the main culprit. To test this, we gather data from a GPS system on geographical distance from the
port to the economic center and the estimated time of travel and include them in the regression
equation. The difference between travel time in the GPS data and the Doing Business data is that the
1 The second and third strategies follow from Djankov, Freund, and Pham (2010).
5
former are based solely on travel distance and estimated speed of travel by type of road (paved or
unpaved). These data do not incorporate delays due to average vehicles, borders, security, traffic, or
other road conditions. We find that GPS distance negatively affects exports, but GPS travel time does
not. Moreover, neither the economic effect nor the statistical significance of the Doing Business
inland transit time variable changes when these variables are included. This suggests that the problem
for inland transit lies in the quality and security of the roads, border delays and the efficiency of
security checkpoints, the age of the truck fleet and competition in trucking. These are factors which
are more closely linked with institutions than geography.
The paper proceeds as follows. The next section discusses the data. Section III presents the
estimation strategy. Section IV describes the main results and robustness checks. Section V examines
the effect of uncertainty on exports and the importance of geography. Section VI concludes.
II. Data
We use data on trade times based on answers to a comprehensive World Bank questionnaire
completed by trade facilitators at freight-forwarding companies in 146 countries in 2007 and collected
as part of Doing Business, a World Bank project that investigates the scope and manner of business
regulations3.
The data provide detailed information on the different kinds of costs an exporter faces when
moving his goods from the principal city to the port of exit. More precisely, the survey asks
respondents the average and the maximum times in calendar days it takes for completing a series of
export procedures. Each procedure can be classified into one of four main categories: documentation,
inland transportation, customs, and ports.
The first category represents the time it takes for an exporter to complete all documentation
activities such as securing a letter of credit, assembling and processing export and international
shipping certificates and realizing all pre-shipment inspections and clearance.
Inland transportation includes the time it takes for the merchandise to be moved from the principal
city to the port of exit, as well as the time spent arranging transport and waiting times for the
merchandise's pick up and loading into a carriage. For landlocked countries, total transport times also
include waiting times at the crossing border.
The customs category includes the time necessary to realize the technical controls of the
merchandise. In addition, for landlocked countries this category comprises the total time it takes from
the submission of request of clearance until the completion of the inspection and clearance procedure
in the transit country. Finally, the ports category represents terminal handling times, including storage
2 See, for example, Hall and Jones (1999), Acemoglu, Johnson, and Robinson (2000), and McArthur and Sachs (2001). 3 For a detailed description of the data see Djankov, Freund and Pham (2010).
6
if a certain storage period is required, the waiting times for loading the containers into the vessel and
customs inspection and clearance times.
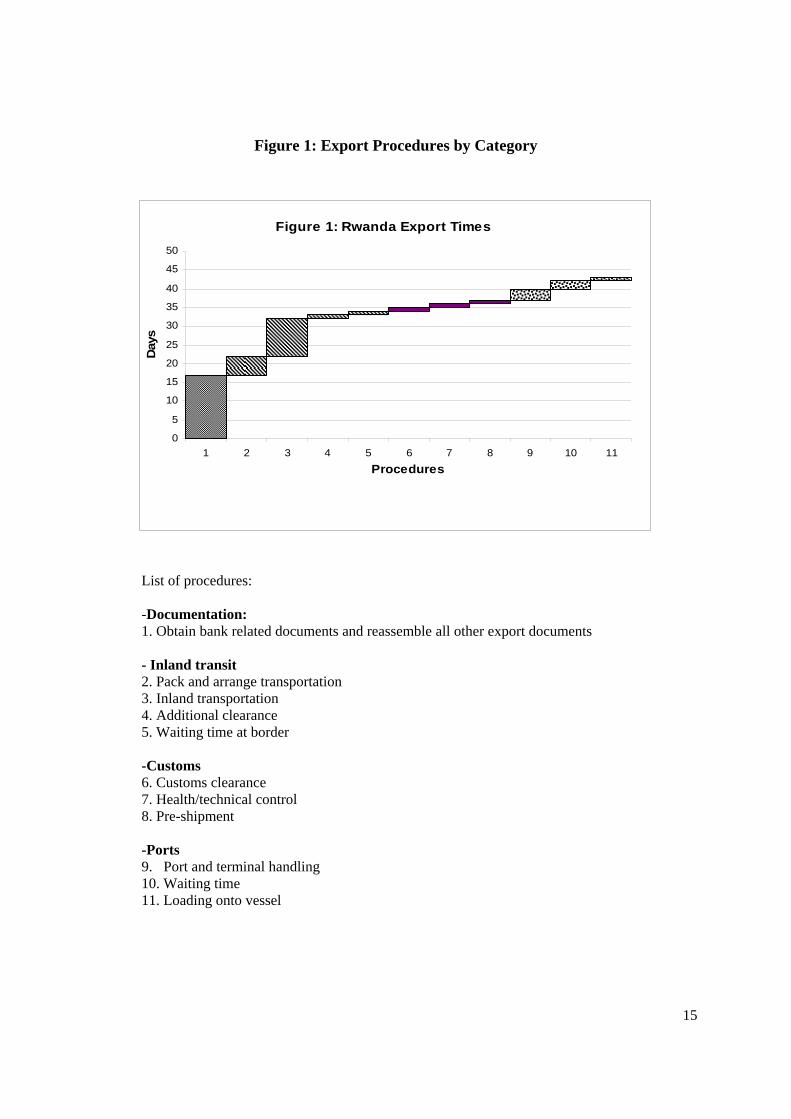
An example illustrates the data. An exporter in Rwanda spends 43 days on average to complete all
requirements for shipping its merchandise abroad: 17 days each on delays resulting from
documentation and inland transit, while port and custom procedures take respectively 6 and 3 days on
average (see Figure1).
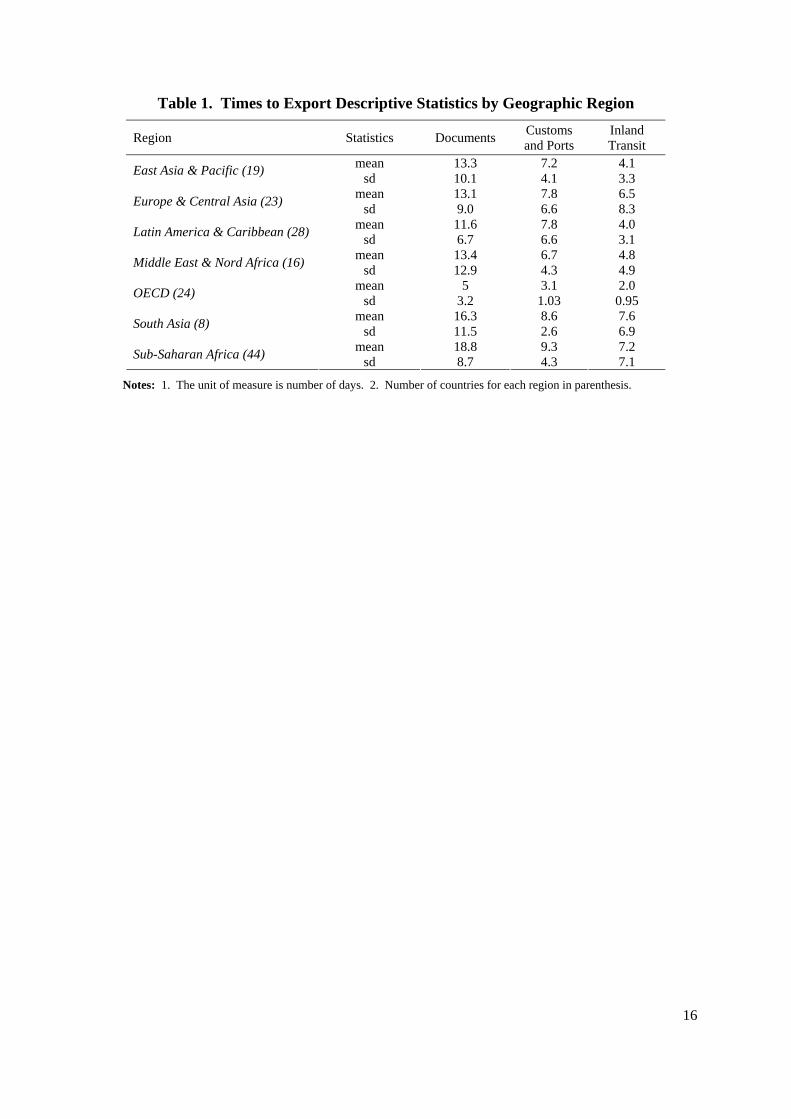
Table 1 presents the summary statistics for each of the components representing the total time4
necessary to fulfil all the requirements for exporting by region and regional arrangement. The data
show that across regions, documentation procedures times are the longest. Furthermore, while getting
a product from the factory to the ship is relatively quick in developed countries, this is not the case for
Sub-Saharan Africa, where all time costs categories are on average higher compared to all the other
regions. Customs and ports procedures and inland transportation take on average three times more in
Sub-Saharan African countries than in OECD countries. In addition, documentation procedures take
four times more in Sub-Saharan countries compared with developed countries.
The rest of the data are from standard sources. The trade data are both from the UN Comtrade
database and the IMF Direction of Trade database. GDP and Population are from the World Bank’s
World Development Indicators. Gravity variables such as country pair distances, language and colony
are taken from the Mayer and Zignago dataset. Country's Capital abundance information is available
for 2005 and comes from GTAP 7 database. Simple average Tariffs at 6 digit level are taken from the
TRAINS dataset.
III. Methodology
We investigate how three diverse trade costs---completing documentation, inland transit delays,
and customs and ports times—affect Sub-Saharan Africa trade volumes. Longer time delays act as a
tax on exports, especially on high-value goods, since they are effectively depreciating during the
delay. In addition, the exporter must spend capital on the exporting process and storage/transport of
the goods during the delay.
We begin by estimating the augmented gravity equation:
ijjXlandlockRemoteLnLnDistiPopLn
iGDPLnDocumentsPortsCustomsitransitInlandijLnExports
ijiiij
ii
εμββββ
ββββ
++++++
++++=
8765
3&21 4
,(1)
4 The time delays reported in the survey are probably at the lower end of the time it takes to move the average product from factory to ship. This is because the products are chosen so that they do not require cooling or any technical inspections based on use of hazardous materials.
7
where the i and j subscripts correspond to the exporter and the importer, respectively. 5 The
dependent variable represents bilateral exports from country i to country j . The variables of interest
are the export times for transit, customs and ports, and documents. The coefficient on each represents
the effect in percent of trade of a one day increase in that component. We focus on variables in levels,
so that the coefficients are comparable—the effect of a one day change. However, for robustness, we
also estimate the regression with the three variables in logs. We also include the standard
determinants of trade in the regression equation: jμ are importer fixed effects which control for the
extent to which the importer is isolated from the rest of the world; iGDP and iPOP are respectively
the Gross Domestic Product and the total population of country i ; ijDist is the distance between
country i and country j . ijX is a vector of dummy variables associated with the exporter and the
importer such as sharing the same official language or border or past colony/colonizer relationship.
iLandlock is a dummy variable equal to one if the exporter country is landlocked and zero otherwise.
imoteRe is a measure for the exporter’s remoteness and is calculated following Head (2003),
∑=
jijj
i DistGDPmoteRe 1
. 6
There is a potential reverse causality problem in our regressions because time to export variables
are likely to be correlated with country exports. An improvement of infrastructure and administrative
time costs has positive effects on exports. However, countries that export more may have higher
returns to enhance local trade facilitation and invest more in time efficient means. In addition, some
types of exports processing might only be available in high volume ports. Hummels and Skiba (2004),
for example, provide evidence that trade volumes affect the timing of adopting containerized shipping
and reduce shipping costs. Finally, it might be the case that in countries with higher volumes of trade,
export procedures will be affected by congestion effects. In this case the presence of reverse causality
will lead to an underestimation of the coefficient on time costs.
To control for the possibility that more trade leads to improved trade facilitation, we investigate the
effects that documentation, inland transport, and customs and ports times have on the exports of new
products.7 The intuition is that exports of new products cannot have had an impact on the historical
5 The times representing terminal port handling and customs and technical control were aggregated due to their very high correlation. (See Table 2) 6 It is important to control for remoteness in our regressions for two reasons. First, there is evidence that a country’s trade with any given partner is dependent on its average remoteness to the rest of the world (Anderson and Van Wincoop (2003)). Furthermore, remoteness is correlated with factory-to-port time delays hence not including it into the regression would produce biased estimates of the impact of trade facilitation on export volumes. 7 We define new products as those that were not exported in the years 2002 2003 and 2004 and that entered into the export market in the time interval 2005-2007.
8
development of infrastructure or the type of bureaucratic procedures in place. In addition, because
they are a very small share of total trade they are unlikely to be associated with congestion effects. We
also follow Djankov, Freund, and Pham (2010) and use trade times of transit countries as instruments
for trade costs in landlocked countries and examine whether trade times affect time-sensitive goods
relatively more.
IV. Results
We now estimate the augmented gravity equation from expression (1). The linear regression
results for a sample of 44 Sub-Saharan Africa countries are reported in Table 3. The first column
shows the results from estimation on all trade. All three variables are significant and their coefficients
are similar, though it is somewhat higher for inland transit. However, this column does not deal with
the problem of endogeneity of the right hand side variables. In column (2), we report results for trade
in new goods only. The time variables are less likely to be endogenous to trade in new goods, since
this trade was not around in the past when procedures and infrastructure for trade were developed.
The results are somewhat different. While the coefficient on inland transit is little changed from
column (1), the other coefficients fall considerably, suggesting that the previous column was also
picking up the effect of trade on documentation procedures and customs and ports. In particular the
results imply that a one day increase in transit time leads to a nearly 7 percent decline in exports.
In the next five columns, we report robustness tests. Columns (3)-(5) report the results of each
variable independently and total time. This helps to deal with potential multicollinearity between the
variables and also informs us whether each variable is significantly different from total time in its
effect on exports. Only inland transit has an independent effect on exports. Moreover the total effect
of inland transit, equivalent to 0.067 (0.049 + 0.018), is nearly four times as large as the effect of the
other components of time. This outcome holds after the inclusion of foreign import tariffs in the
regression (see column (6)). Including foreign tariffs also allows us to interpret a day in terms of
tariffs. A one day delay is roughly equivalent to a 1.5 percent point reduction in all importer country
tariffs. Finally in column (7) we report results using logs of the time variables. While a one percent
reduction in total time leads to .5 percent more trade, a one percent reduction in transit time leads to
about a .7 percent decline in exports. Again only transit time is independently significant (results for
other variables are not reported).8
8 Equation (1) has been estimated excluding trade in oils and minerals from the dependent variable to control for the surge in commodities exports that took place in some African countries during the 2007. In addition, to account for the presence of zero trade values across country pairs, Tobit and Poisson specifications were used. Results, available under request, confirm the fact that inland transit has a negative and significant impact on export values.
9
Our second strategy to deal with the potential endogeneity of the export time variables is to use a
sample of landlocked countries and use the variables for the transit country(ies) as the instrument. This
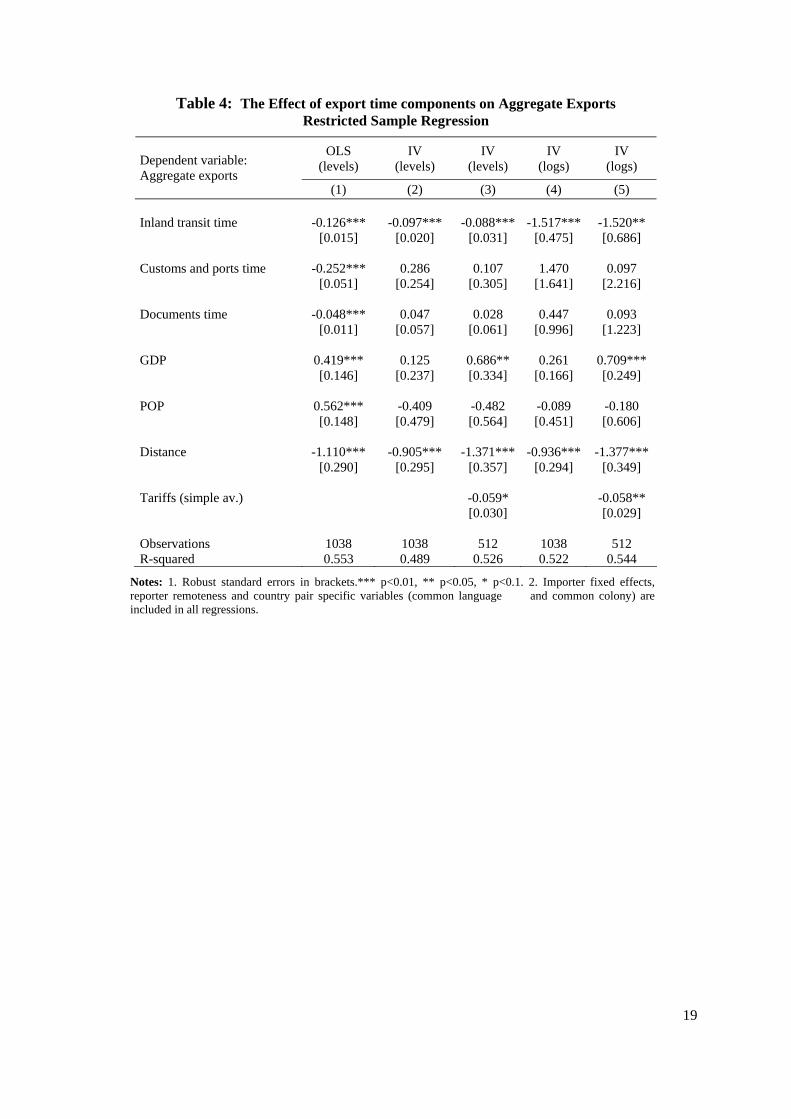
follows from Djankov, Freund and Pham (2010).9 Results are reported in Table 4. The first column
reports OLS regression results for this sample. With the exception of documents, the coefficients are
much larger for this sample than for the full sample (column (1) of Table 3). One explanation is that
the endogeneity problem is greater here. For example, when landlocked country trade is small,
customs and ports authorities (which must be located in neighboring countries) give them the lowest
priority. To control for endogeneity, we next instrument each time variable with the corresponding
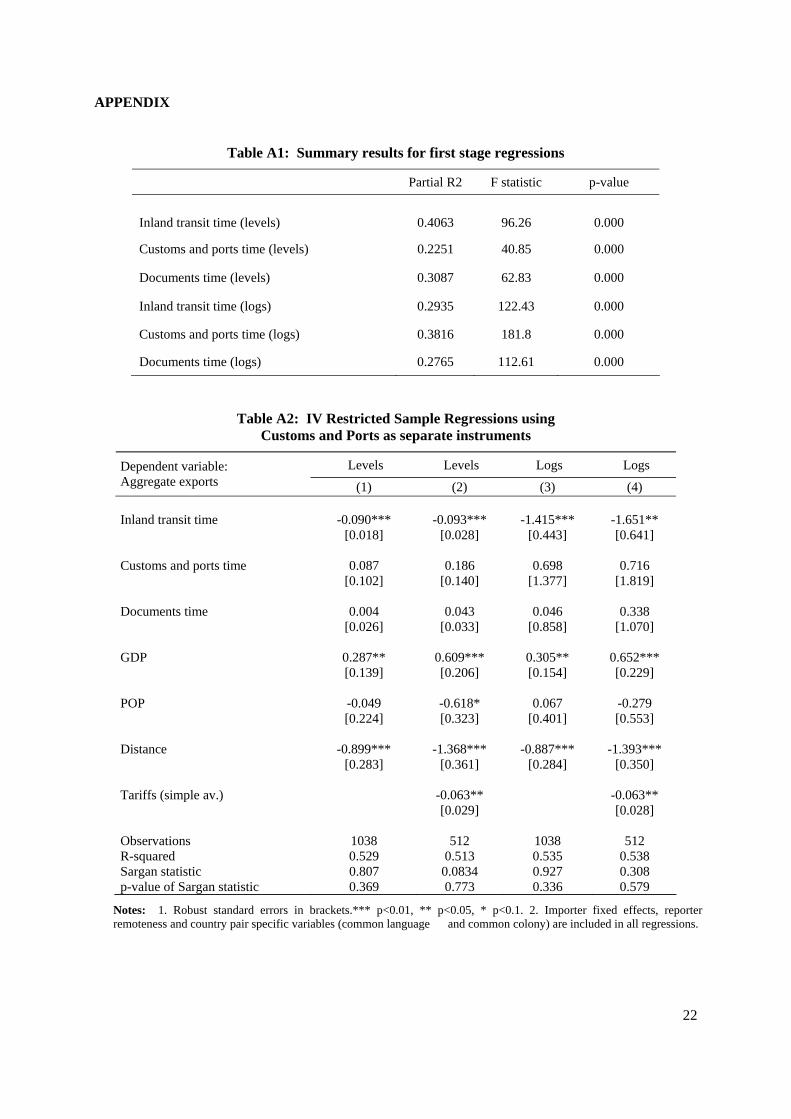
variable in the transit country. The F-statistics of the first stage regressions (see Table 1A of the
Appendix) indicate that none of the instruments is a weak instrument.10 Second stage regression
results, with and without foreign tariffs, are reported in levels in columns (2) and (3) and in logs in
columns (4) and (5). For landlocked countries, only inland transit has a robust negative and significant
effect on trade. 11 Moreover, the magnitude from column (2) is similar to the result using all countries
and new trade (column (2), Table 3): a one day reduction in transit delays leads to about 9 percent
more exports and a one percent reduction in transit delays leads to about 1.5 percent more trade.12
In Table 5 the effects of documentation, inland transit and customs and ports times on the exports
of time-sensitive products are presented. Time delays should have a greater effect on exports of time-
sensitive goods.13 To examine the extent to which they are hampered, we follow the methodology in
Djankov, Freund and Pham (2010) and estimate a difference-in-difference gravity equation using trade
data of agricultural (processed and unprocessed) products for which time matters the most and the
least. This methodology reduces the endogeneity problem coming from reverse causality because we
control for country and industry fixed effects. In addition, the products we consider account for only a
small fraction of trade in agricultural goods on average (less than 10 percent) so it is unlikely that they
have a large impact on establishing trade facilitation processes.
9 There are two differences with this study. First, authors use a difference gravity equation on similar exporters. In our case this strategy is not necessary since in our regressions we are considering only sub-Saharan Africa countries. Second, while they use the actual times in the transit country as instrument we use the time for the transit county’s trade in the transit country 10 Since our regression is perfectly identified we cannot test if the excluded instruments are not correlated with the error terms. In Table A2 of the Appendix we replicate the regressions of Table 4 but this time including separate instruments for customs and ports. In this case the Sargan overidentification test supports the validity of the instruments. 11 This result does not only reflect the fact these countries are more isolated. Even though delays in inland transport are higher with respect to coastal countries (15 days versus 4 days on average), delays in documentation (24 days on average) and customs and ports (9 days on average) procedures are even higher for exporters in landlocked countries. 12 When we include the log of total time as the only trade cost variable in the regression, we get a coefficient of about -1, the same as the results for developing countries in Djankov, Freund and Pham (2010), although they use a slightly different approach. 13 Evans and Harrigan (2005) show that time-sensitive apparel products are more sensitive to distance than time-insensitive products.
10
We base our definition of time-sensitive agricultural products on the information of their storage
life (Gast 1991), which includes a range of products going from a minimum storage life of 2 weeks or
less, such as apricots, beans, currants, and mushrooms to 4 weeks or longer, for example apples,
cranberries and potatoes and canned products. We also include goods with a very long storage life
such as dry fruits with a maximum storage life of between 6 months and one year and canned
products with a storage life ranging from 1 to 5 years, depending on the good’s acidity. To measure
time sensitivity we use the inverse of the median storage life of each product.
To study the joint effect of industry time-sensitivity and country time delays on exports we
estimate the following difference-in-difference gravity regression
ikki productcannedabundanceKitimeDocskSensitTimeitimePortsCustomskSensitTimeitimetransitInlandkSensitTimekiikLnExports
εββ
ββαα
+××+
×+×++=
)()()()(
)&()()()(
43
21
(2)
where iα and kα represent country- and industry-fixed effects. The coefficients 1β , 2β and 3β
capture the joint effect of time sensitive products and respectively time delays in inland transit,
customs and ports and documentation on export values. We introduce the term
)()( ki productcannedabundanceK × to control for the fact that more capital abundant countries are
more likely to have the necessary resources and technologies to process fresh food into canned
products.
With this specification we test whether exports of time-sensitive goods are more responsive to time
delays in each of the key components of time to export than exports of time-insensitive products.
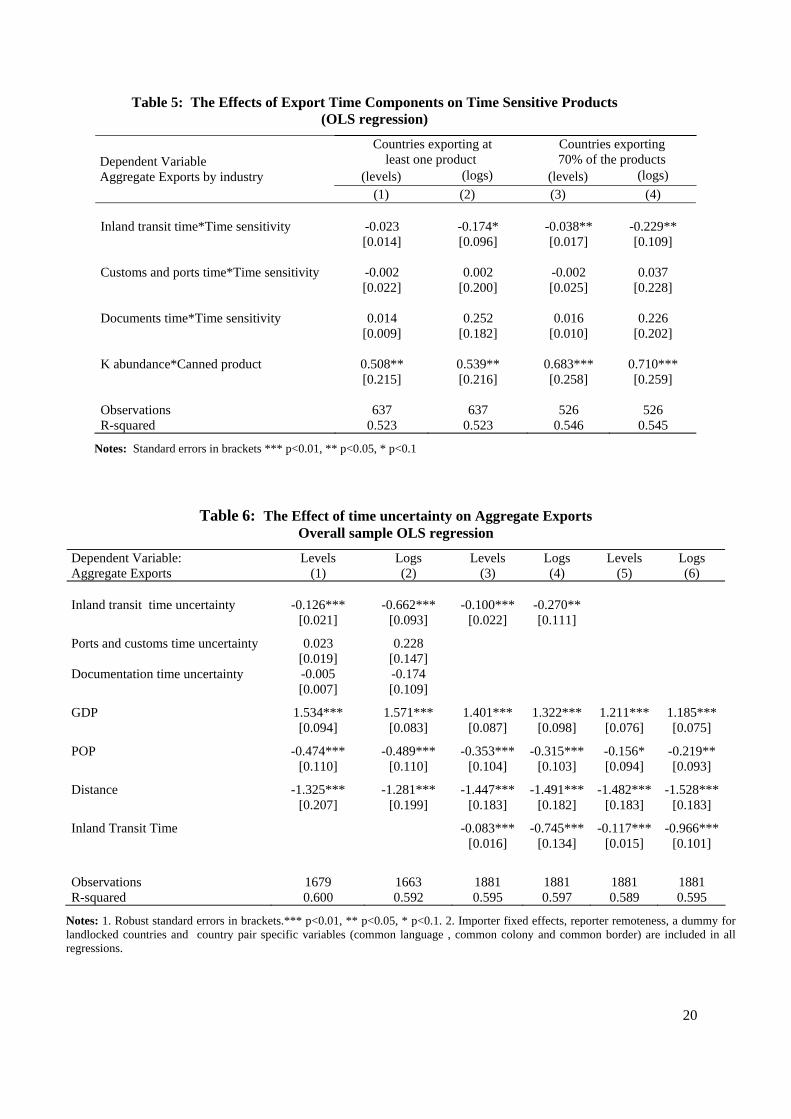
Tables 5 presents the results for time-sensitive agricultural products controlling for countries’
capital abundance. We report results for countries exporting at least one product and countries
exporting at least 70 percent of the products, and also with the variables in logs and levels. In most of
the cases, the coefficient on the interaction term of inland transit times with time sensitivity is negative
and significant. This implies that an increase in inland transit times reduces exports of time-sensitive
goods relatively more than time insensitive goods. In contrast, interactions with documents and
customs and ports times are never significant.
More transit delays affect the composition of trade, preventing countries from exporting time-
sensitive agricultural goods. Time-sensitive goods also tend to have higher value, implying that some
of the effects of inland transit delays on aggregate exports results from countries with poor and not
well targeted trade facilitation programs concentrating on low-value time insensitive goods.
In sum, we try three different ways to examine the effects of various trade delays on trade flows,
each of which should reduce the endogeneity problem inherent in the analysis. All three point to the
same conclusion: delays during inland transit affect trade flows to a much greater extent than delays
11
because of documentation or at the port. Our results imply that reducing time spent on inland transit
will significantly stimulate trade in Africa.
V. Why does inland transit matter more?
All else equal, a one day delay should affect exports the same way no matter when it occurs. However,
one reason it may not is if there is more uncertainty associated with high delays in some procedures
than in others. Uncertainty will reduce exports because it makes delivery deadlines harder to meet. In
this section, we investigate if greater uncertainty related to inland transport times makes costs related
with documents, customs and ports become a secondary priority relative to travel costs for existing
exporters.
We estimate the effects of time uncertainty in each component of export times for a sub-sample of
24 Sub-Saharan countries for which there is information on the maximum and the average number of
days it takes for an exporter to complete each of the exporting procedures14:
ijjXLandlockRemoteLnLnDistiPopLniGDPLn
iuncerttimeDocsiuncerttimePortsCustomsiuncerttimetransitInlandijLnExports
ijiiij εμβββββ
βββ
++++++++
+++=
87654
3&21
(3)
We define time uncertainty as the difference between the maximum time and the average time it
takes to conclude each of the different phases representing the total time to export.
Results form Table 6 show a negative and significant impact of inland transit time uncertainty on
trade values, with a one day increase in this variable leading to a reduction of exports of 13 percent
(column (1)). Or in logs (Column (2)), a one percent increase in uncertainty leading to about a .7
percent reduction in exports. In contrast, uncertainty in the other variables is not significant in
reducing exports. These results imply that high uncertainty in road transport times jeopardizes
delivery targets. In addition, even if documentation requirements take more time than inland transit,
they can either be done in advance or there may be learning by doing, such that exporters become
more familiar with the procedures and uncertainty is limited. Finally, while exporters may be able to
pay in the port to get things out more quickly, nothing can be done on the road.
In columns (3) and (4) we include both inland travel times and inland travel uncertainty. The
coefficients reflecting both variables are significant. When we include only inland transit (see columns
(5) and (6)) in the same sample the coefficient is larger, implying that part of the effect of transit time
on exports stems from uncertainty.
14 Benin, Botswana, Burkina Faso , Burundi, Cameroon, Congo, Rep., Côte d'Ivoire, Ghana, Kenya Madagascar, Malawi, Mali, Mauritania, Mozambique, Namibia, Nigeria, Rwanda, Sierra Leone, South Africa, Sudan, Tanzania, Uganda, Zambia and Zimbabwe.
12
Given the dominance of transit time over the other time cost variables, in determining trade, we
next investigate whether this is a pure geography effect. Specifically, we control for domestic
geography by using the GPS estimated distance and time based solely on geography and type of road.
In our regressions we include road distance in km from the principal city to the port of export (which
is the relevant distance for which transport is calculated in the data). In addition, we include GPS-
estimated total travel time. This variable is calculated as the total time it takes to get from the principal
city to the port of exit by assuming a speed of 40 km per hour for unpaved roads and 80 km per hour
for paved surfaces.15 Both variables enter the equation in logs. If transit is primarily a geography effect
then the GPS variables should pick up the effect.
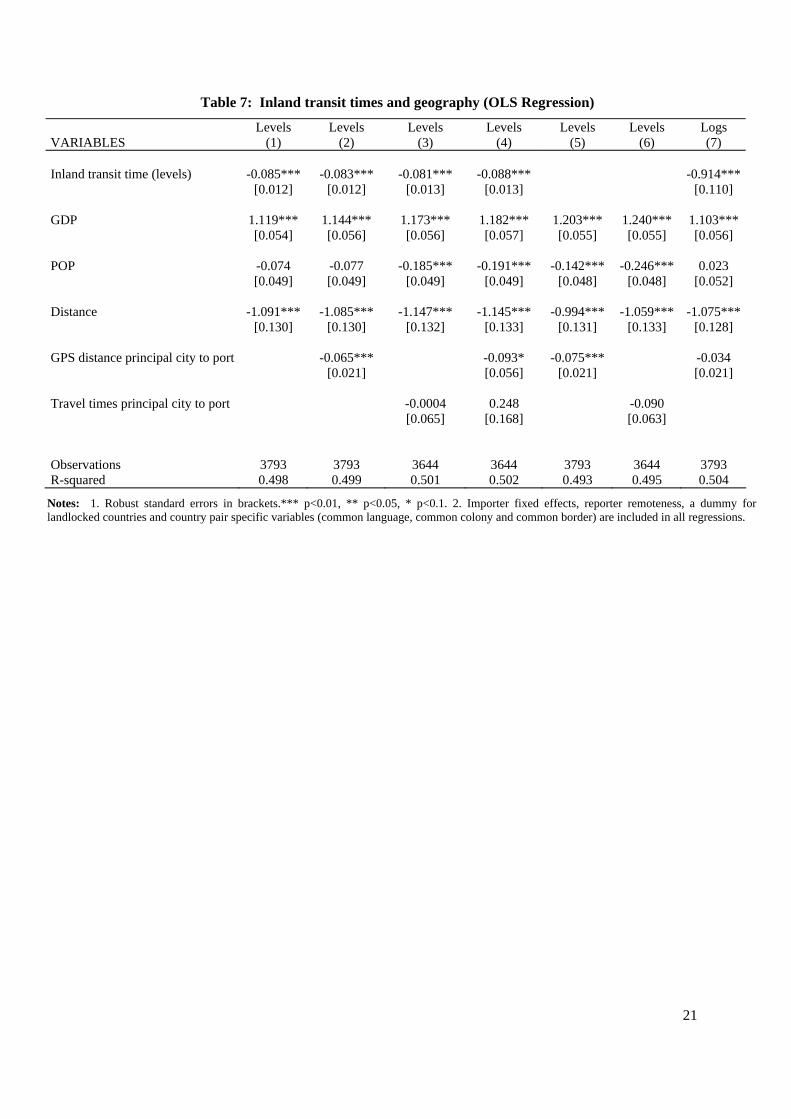
Table 7 reports the results using the full sample. GPS distance is negative and significant, but does
not alter the effect of inland transit time (columns (1) and (2)). GPS travel time is negative, but is not
significant and the coefficient is very small. Column (4) shows results with all three variables, only
transit time and GPS distance are significant. Columns (5) and (6) show results excluding the transit
time variable and the coefficients of the other two variables remain roughly the same. Column (7)
shows the results in logs, and only transit time is significant.
The results suggest that the distance from city to port and whether roads are paved are not the main
reason for long delays in transit times. There might be other factors such as the quality of the roads
and vehicles, accidents, competition in trucking, road blocks or border waiting times which affect the
total time for an exporter to get his goods form the factory to the port of exit.
VI. Conclusion
We use detailed data on key components on the time it takes to move containerized products from
the factory gate to the ship to estimate whether and how diverse trade costs affect export volumes in
Sub-Saharan Africa. An augmented gravity equation is estimated by regressing aggregate bilateral
exports on different time delay components such as inland transit, documentation, ports and customs,
and other standard gravity variables.
To control for the possibility that more trade leads to improved trade facilitation we investigate the
effects that documentation, inland transport, customs and ports times respectively have on the exports
of new products. Exports in these products are unlikely to have an impact on the historical
development of infrastructure. As a robustness check we also use an instrumental variables approach
to examine the effect of time trade costs in transit countries on the exports of landlocked countries.
Finally, we estimate a “difference-in-difference” regression on a sub-sample of agricultural products
to determine whether trade costs affect exports of time-sensitive and time-insensitive goods, ranging
15 No information on road condition was used in the calculation of travel time. Furthermore, delays at the border (or otherwise) were not included.
13
from perishable products where time is most critical relative to preserved goods such as tinned food,
differently.
Our results imply that while inland transit delays have a robust negative impact on export values,
higher times in other areas have much smaller effects in reducing Africa’s exports. A one day increase
in inland transit time reduces exports by 7 per cent on average. Put another way, a one day reduction
in inland travel times translates into nearly a 1.5 percentage point decrease in all importing-country
tariffs. In addition, this effect is higher for time-sensitive goods compared to time-insensitive goods.
We show that long times are associated with high uncertainty in road transport, which jeopardizes
exporters' delivery targets.
Our results have important policy implications. Export tariffs in Sub-Saharan African countries are
already at a very low level. Furthermore these countries have preferential access to markets such as the
United States and the European Union. Hence, while the benefits from a further decrease in tariffs
among trading partners might be very small – or even negative in terms of preference erosion if tariff
reductions are MFN – reducing transport times will significantly increase their exports. Trade
facilitation programs should therefore prioritize those programs directly affecting truck fleets and the
infrastructure and security of Sub-Saharan Africa road systems.
14
References
Acemoglu, Daron; Johnson Simon and Robinson James A., (2001). "Reversal of Fortune:
Geography and Institutions in the Making of the Modern World Income Distribution," NBER
Working Papers 8460.
Anderson, James E. and Van Wincoop, Eric. (2003). “Gravity with Gravitas”. American
Economic Review, 93:1, 170-192..
Djankov, Simeon; Freund, Caroline and Pham, Cong S., (2010). "Trading on time," Review of
Economics and Statistics, forthcoming.
Evans, Carolyn and Harrigan, James. (2005). “Distance, Time, and Specialization: Lean Retailing
in General Equilibrium”. American Economic Review 95:1, 292-313..
Gast, Karen (1991) “Postharvest Management of Commercial Horticultural Crops” Kansas State
University Agricultural Experiment Station and Cooperative Extension Service.
Hall, Robert and Charles Jones (1999) “Why Do Some Countries Product so Much More Output
per Worker than Others?” Quarterly Journal of Economics, CXIV, 83-116.
Head, Keith (2003) “Gravity for Beginners” Mimeo University of British Columbia.
Hummels, David (2001). “Time as a Trade Barrier”. Mimeo, Purdue University.
Hummels, David and Skiba, Alexander (2004) “A Virtuous Circle: Regional Trade Liberalization
and Scale Economies in Transport” (in FTAA and Beyond: Prospects for Integration in the
America. (eds. Estevadeordal, Rodrik, Taylor, Velasco), Harvard University Press.
McArthur , John W. and Sachs Jeffrey D. (2001) " Institutions and Geography: Comment on
Acemoglu, Johnson and Robinson (2000). NBER Working Papers N. 8114.
Portugal, Alberto and John Wilson (2009) “Why Trade Facilitation Matters to Africa” World
Bank, Policy Research Working Paper, 4719.
World Bank (2007), Doing Business. World Bank, Washington DC, www.doingbusiness.org.
15
Figure 1: Export Procedures by Category
Figure 1: Rwanda Export Times
0
5
10
15
20
25
30
35
40
45
50
1 2 3 4 5 6 7 8 9 10 11Procedures
Day
s
List of procedures: -Documentation: 1. Obtain bank related documents and reassemble all other export documents - Inland transit 2. Pack and arrange transportation 3. Inland transportation 4. Additional clearance 5. Waiting time at border -Customs 6. Customs clearance 7. Health/technical control 8. Pre-shipment -Ports 9. Port and terminal handling 10. Waiting time 11. Loading onto vessel
16
Table 1. Times to Export Descriptive Statistics by Geographic Region
Region Statistics Documents Customs and Ports
Inland Transit
mean 13.3 7.2 4.1 East Asia & Pacific (19) sd 10.1 4.1 3.3 mean 13.1 7.8 6.5 Europe & Central Asia (23) sd 9.0 6.6 8.3 mean 11.6 7.8 4.0 Latin America & Caribbean (28) sd 6.7 6.6 3.1 mean 13.4 6.7 4.8 Middle East & Nord Africa (16) sd 12.9 4.3 4.9 mean 5 3.1 2.0 OECD (24) sd 3.2 1.03 0.95 mean 16.3 8.6 7.6 South Asia (8) sd 11.5 2.6 6.9 mean 18.8 9.3 7.2 Sub-Saharan Africa (44) sd 8.7 4.3 7.1
Notes: 1. The unit of measure is number of days. 2. Number of countries for each region in parenthesis.
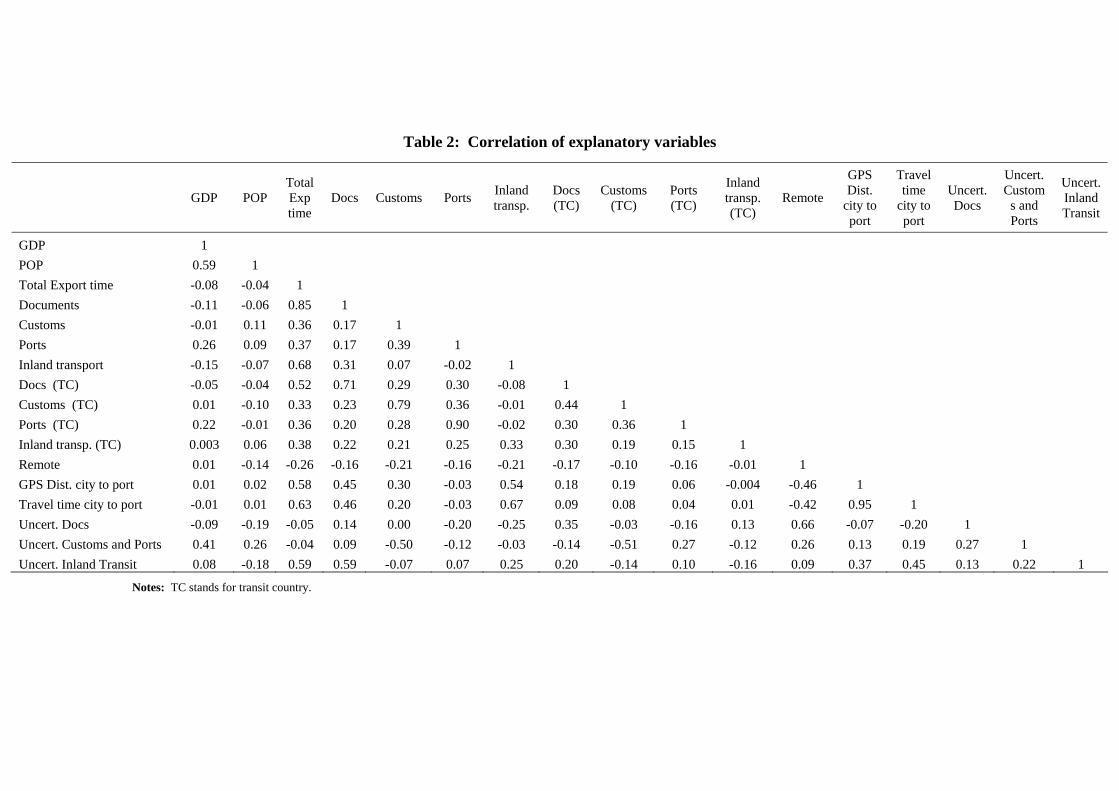
Table 2: Correlation of explanatory variables
Notes: TC stands for transit country.
GDP POP Total Exp time
Docs Customs Ports Inland transp.
Docs (TC)
Customs (TC)
Ports (TC)
Inland transp. (TC)
Remote
GPS Dist.
city to port
Travel time
city to port
Uncert. Docs
Uncert. Custom
s and Ports
Uncert. Inland Transit
GDP 1 POP 0.59 1 Total Export time -0.08 -0.04 1 Documents -0.11 -0.06 0.85 1 Customs -0.01 0.11 0.36 0.17 1 Ports 0.26 0.09 0.37 0.17 0.39 1 Inland transport -0.15 -0.07 0.68 0.31 0.07 -0.02 1 Docs (TC) -0.05 -0.04 0.52 0.71 0.29 0.30 -0.08 1 Customs (TC) 0.01 -0.10 0.33 0.23 0.79 0.36 -0.01 0.44 1 Ports (TC) 0.22 -0.01 0.36 0.20 0.28 0.90 -0.02 0.30 0.36 1 Inland transp. (TC) 0.003 0.06 0.38 0.22 0.21 0.25 0.33 0.30 0.19 0.15 1 Remote 0.01 -0.14 -0.26 -0.16 -0.21 -0.16 -0.21 -0.17 -0.10 -0.16 -0.01 1 GPS Dist. city to port 0.01 0.02 0.58 0.45 0.30 -0.03 0.54 0.18 0.19 0.06 -0.004 -0.46 1 Travel time city to port -0.01 0.01 0.63 0.46 0.20 -0.03 0.67 0.09 0.08 0.04 0.01 -0.42 0.95 1 Uncert. Docs -0.09 -0.19 -0.05 0.14 0.00 -0.20 -0.25 0.35 -0.03 -0.16 0.13 0.66 -0.07 -0.20 1 Uncert. Customs and Ports 0.41 0.26 -0.04 0.09 -0.50 -0.12 -0.03 -0.14 -0.51 0.27 -0.12 0.26 0.13 0.19 0.27 1 Uncert. Inland Transit 0.08 -0.18 0.59 0.59 -0.07 0.07 0.25 0.20 -0.14 0.10 -0.16 0.09 0.37 0.45 0.13 0.22 1
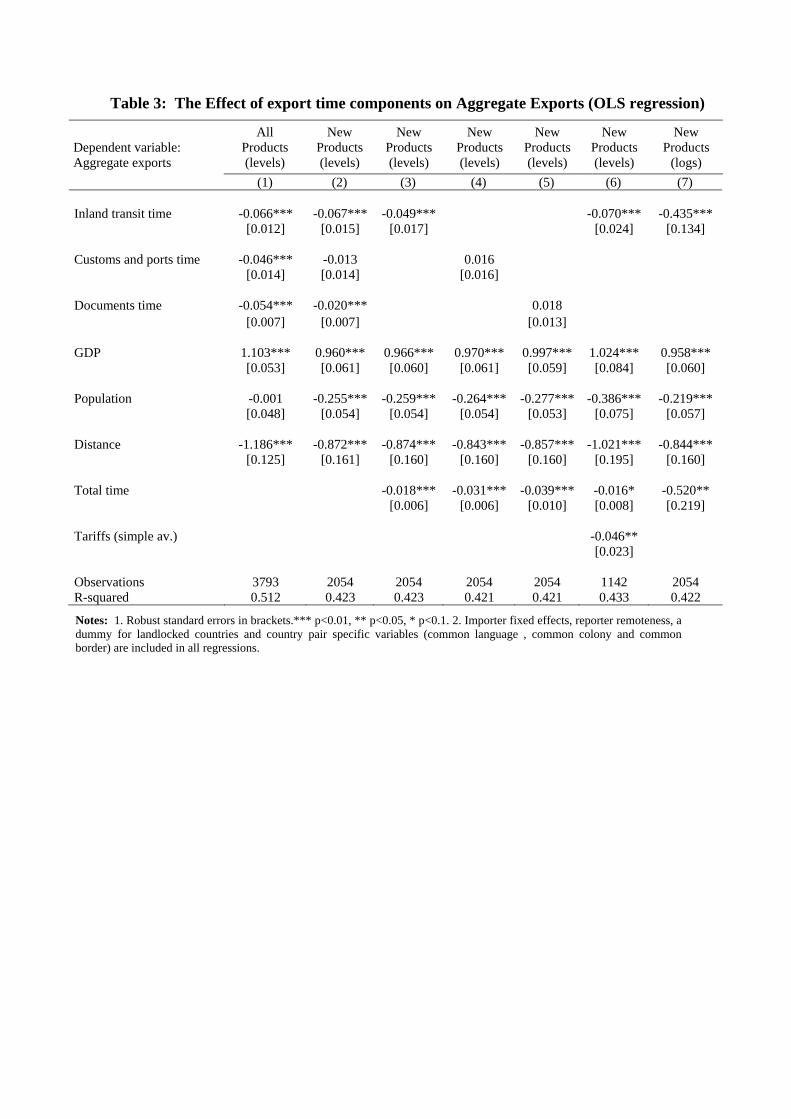
Table 3: The Effect of export time components on Aggregate Exports (OLS regression)
All Products (levels)
New Products (levels)
New Products (levels)
New Products (levels)
New Products (levels)
New Products (levels)
New Products
(logs) Dependent variable: Aggregate exports
(1) (2) (3) (4) (5) (6) (7) Inland transit time -0.066*** -0.067*** -0.049*** -0.070*** -0.435***
[0.012] [0.015] [0.017] [0.024] [0.134]
Customs and ports time -0.046*** -0.013 0.016
[0.014] [0.014] [0.016]
Documents time -0.054*** -0.020*** 0.018
[0.007] [0.007] [0.013]
GDP 1.103*** 0.960*** 0.966*** 0.970*** 0.997*** 1.024*** 0.958***
[0.053] [0.061] [0.060] [0.061] [0.059] [0.084] [0.060]
Population -0.001 -0.255*** -0.259*** -0.264*** -0.277*** -0.386*** -0.219***
[0.048] [0.054] [0.054] [0.054] [0.053] [0.075] [0.057]
Distance -1.186*** -0.872*** -0.874*** -0.843*** -0.857*** -1.021*** -0.844***
[0.125] [0.161] [0.160] [0.160] [0.160] [0.195] [0.160]
Total time -0.018*** -0.031*** -0.039*** -0.016* -0.520**
[0.006] [0.006] [0.010] [0.008] [0.219]
Tariffs (simple av.) -0.046** [0.023] Observations 3793 2054 2054 2054 2054 1142 2054 R-squared 0.512 0.423 0.423 0.421 0.421 0.433 0.422
Notes: 1. Robust standard errors in brackets.*** p<0.01, ** p<0.05, * p<0.1. 2. Importer fixed effects, reporter remoteness, a dummy for landlocked countries and country pair specific variables (common language , common colony and common border) are included in all regressions.
19
Table 4: The Effect of export time components on Aggregate Exports Restricted Sample Regression
OLS (levels)
IV (levels)
IV (levels)
IV (logs)
IV (logs) Dependent variable:
Aggregate exports (1) (2) (3) (4) (5)
Inland transit time -0.126*** -0.097*** -0.088*** -1.517*** -1.520**
[0.015] [0.020] [0.031] [0.475] [0.686]
Customs and ports time -0.252*** 0.286 0.107 1.470 0.097
[0.051] [0.254] [0.305] [1.641] [2.216]
Documents time -0.048*** 0.047 0.028 0.447 0.093
[0.011] [0.057] [0.061] [0.996] [1.223]
GDP 0.419*** 0.125 0.686** 0.261 0.709***
[0.146] [0.237] [0.334] [0.166] [0.249]
POP 0.562*** -0.409 -0.482 -0.089 -0.180
[0.148] [0.479] [0.564] [0.451] [0.606]
Distance -1.110*** -0.905*** -1.371*** -0.936*** -1.377***
[0.290] [0.295] [0.357] [0.294] [0.349]
Tariffs (simple av.) -0.059* -0.058** [0.030] [0.029] Observations 1038 1038 512 1038 512 R-squared 0.553 0.489 0.526 0.522 0.544
Notes: 1. Robust standard errors in brackets.*** p<0.01, ** p<0.05, * p<0.1. 2. Importer fixed effects, reporter remoteness and country pair specific variables (common language and common colony) are included in all regressions.
20
Table 5: The Effects of Export Time Components on Time Sensitive Products (OLS regression)
Countries exporting at least one product
Countries exporting 70% of the products
(levels) (logs) (levels) (logs) Dependent Variable Aggregate Exports by industry
(1) (2) (3) (4) Inland transit time*Time sensitivity -0.023 -0.174* -0.038** -0.229**
[0.014] [0.096] [0.017] [0.109]
Customs and ports time*Time sensitivity -0.002 0.002 -0.002 0.037
[0.022] [0.200] [0.025] [0.228]
Documents time*Time sensitivity 0.014 0.252 0.016 0.226
[0.009] [0.182] [0.010] [0.202]
K abundance*Canned product 0.508** 0.539** 0.683*** 0.710*** [0.215] [0.216] [0.258] [0.259] Observations 637 637 526 526 R-squared 0.523 0.523 0.546 0.545
Notes: Standard errors in brackets *** p<0.01, ** p<0.05, * p<0.1
Table 6: The Effect of time uncertainty on Aggregate Exports Overall sample OLS regression
Levels Logs Levels Logs Levels Logs Dependent Variable: Aggregate Exports (1) (2) (3) (4) (5) (6) Inland transit time uncertainty -0.126*** -0.662*** -0.100*** -0.270**
[0.021] [0.093] [0.022] [0.111]
Ports and customs time uncertainty 0.023 0.228 [0.019] [0.147] Documentation time uncertainty -0.005 -0.174
[0.007] [0.109]
GDP 1.534*** 1.571*** 1.401*** 1.322*** 1.211*** 1.185*** [0.094] [0.083] [0.087] [0.098] [0.076] [0.075]
POP -0.474*** -0.489*** -0.353*** -0.315*** -0.156* -0.219** [0.110] [0.110] [0.104] [0.103] [0.094] [0.093]
Distance -1.325*** -1.281*** -1.447*** -1.491*** -1.482*** -1.528*** [0.207] [0.199] [0.183] [0.182] [0.183] [0.183]
Inland Transit Time -0.083*** -0.745*** -0.117*** -0.966*** [0.016] [0.134] [0.015] [0.101]
Observations 1679 1663 1881 1881 1881 1881 R-squared 0.600 0.592 0.595 0.597 0.589 0.595
Notes: 1. Robust standard errors in brackets.*** p<0.01, ** p<0.05, * p<0.1. 2. Importer fixed effects, reporter remoteness, a dummy for landlocked countries and country pair specific variables (common language , common colony and common border) are included in all regressions.
21
Table 7: Inland transit times and geography (OLS Regression)
Levels Levels Levels Levels Levels Levels Logs VARIABLES (1) (2) (3) (4) (5) (6) (7) Inland transit time (levels) -0.085*** -0.083*** -0.081*** -0.088*** -0.914***
[0.012] [0.012] [0.013] [0.013] [0.110]
GDP 1.119*** 1.144*** 1.173*** 1.182*** 1.203*** 1.240*** 1.103***
[0.054] [0.056] [0.056] [0.057] [0.055] [0.055] [0.056]
POP -0.074 -0.077 -0.185*** -0.191*** -0.142*** -0.246*** 0.023
[0.049] [0.049] [0.049] [0.049] [0.048] [0.048] [0.052]
Distance -1.091*** -1.085*** -1.147*** -1.145*** -0.994*** -1.059*** -1.075***
[0.130] [0.130] [0.132] [0.133] [0.131] [0.133] [0.128]
GPS distance principal city to port -0.065*** -0.093* -0.075*** -0.034
[0.021] [0.056] [0.021] [0.021]
Travel times principal city to port -0.0004 0.248 -0.090
[0.065] [0.168] [0.063]
Observations 3793 3793 3644 3644 3793 3644 3793 R-squared 0.498 0.499 0.501 0.502 0.493 0.495 0.504
Notes: 1. Robust standard errors in brackets.*** p<0.01, ** p<0.05, * p<0.1. 2. Importer fixed effects, reporter remoteness, a dummy for landlocked countries and country pair specific variables (common language, common colony and common border) are included in all regressions.
22
APPENDIX
Table A1: Summary results for first stage regressions
Partial R2 F statistic p-value Inland transit time (levels) 0.4063 96.26 0.000
Customs and ports time (levels) 0.2251 40.85 0.000
Documents time (levels) 0.3087 62.83 0.000
Inland transit time (logs) 0.2935 122.43 0.000
Customs and ports time (logs) 0.3816 181.8 0.000
Documents time (logs) 0.2765 112.61 0.000
Table A2: IV Restricted Sample Regressions using Customs and Ports as separate instruments
Levels Levels Logs Logs Dependent variable: Aggregate exports (1) (2) (3) (4) Inland transit time -0.090*** -0.093*** -1.415*** -1.651**
[0.018] [0.028] [0.443] [0.641]
Customs and ports time 0.087 0.186 0.698 0.716
[0.102] [0.140] [1.377] [1.819]
Documents time 0.004 0.043 0.046 0.338
[0.026] [0.033] [0.858] [1.070]
GDP 0.287** 0.609*** 0.305** 0.652***
[0.139] [0.206] [0.154] [0.229]
POP -0.049 -0.618* 0.067 -0.279
[0.224] [0.323] [0.401] [0.553]
Distance -0.899*** -1.368*** -0.887*** -1.393***
[0.283] [0.361] [0.284] [0.350]
Tariffs (simple av.) -0.063** -0.063** [0.029] [0.028] Observations 1038 512 1038 512 R-squared 0.529 0.513 0.535 0.538 Sargan statistic 0.807 0.0834 0.927 0.308 p-value of Sargan statistic 0.369 0.773 0.336 0.579
Notes: 1. Robust standard errors in brackets.*** p<0.01, ** p<0.05, * p<0.1. 2. Importer fixed effects, reporter remoteness and country pair specific variables (common language and common colony) are included in all regressions.