Embed Size (px)
Citation preview

What Climate Change May Mean for the AlbuquerqueRegion
Projections about how climatechange may affectAlbuquerque’s water resources
Scoping communityvulnerability & hazards
Questions and discussion

Climate Change in the US, US Global Climate ChangeResearch Program, 2014
2
On the web http://nca2014.globalchnage.gov/report/regions/southwest

Big Picture Findings
Snowpacks and streamflows projected to decline -decreasing surface water reliability.
3
Mid-centurysnow waterequivalent isprojected drop42% in NM and13% in COcompared tothe 1971-2000period.
,
-1%
-42%
-66%
-4%-13%
-26%
-70%
-60%
-50%
-40%
-30%
-20%
-10%
0%
2006-2035 2041-2070 2070-2099
Pro
ject
ed
Pe
rce
nt
Re
du
ctio
nProjected Snow Equivalent for New Mexico and Colorado
(Future Compared to 1971-2000)
New Mexico
Colorado

Big Picture Findings
Regional temperatures projected to increase posingincreased threats and costs to
public health
urban electricity
water supplies
ecosystems
4
Source:USEPA
Source: NASASource:CDC
Lake Heron

Big Picture Findings
Severe and sustained drought will increase competitionamong farmers, energy producers, and cities.
5

Climate Impacts, Southwest Region – New Mexico,cont.
Regional annual average temperatures projected torise by 2.5o to 5.5o F by 2041-2070.
Summertime heat waves projected to becomelonger and hotter.
Decreased wintertime cold outbreaks.
Reduced winter and spring precipitation.
6
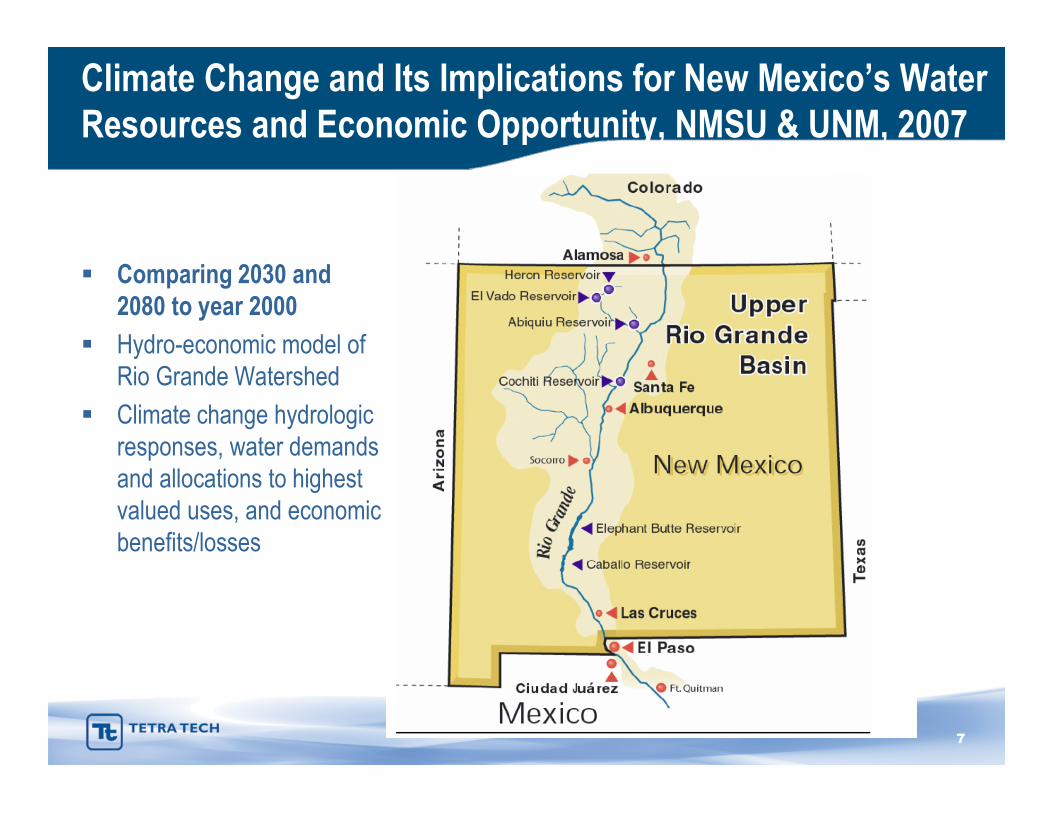
Climate Change and Its Implications for New Mexico’s WaterResources and Economic Opportunity, NMSU & UNM, 2007
Comparing 2030 and2080 to year 2000
Hydro-economic model ofRio Grande Watershed
Climate change hydrologicresponses, water demandsand allocations to highestvalued uses, and economicbenefits/losses
7

Some limits of the “hydro-economic” study…
Does not address/reflect institutional constraints towater use and transfers in the state.
Uses economic theory to project “highest use” of water.
Does not project ACTUAL allocations.
Somewhat dated.
Can be used as an illustration of growingcompetition for water during climate change.
8

Projected Streamflow and Water Use Changes bySector and Scenario
9
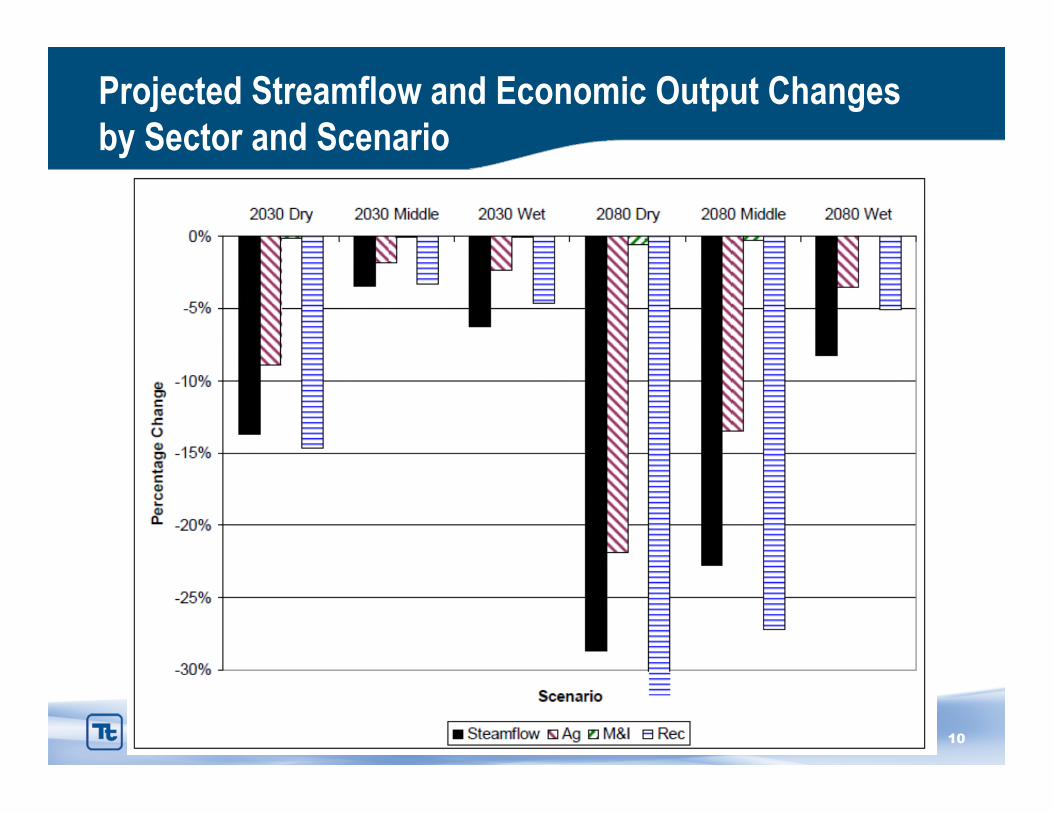
Projected Streamflow and Economic Output Changesby Sector and Scenario
10

Projected Annual Economic Impacts by Sector(yr 2000 dollars)
11
Year/ Direct Economic Impacts Direct &
Scenario (in year 2000 dollars) Secondary
Impacts
Agriculture Municipal/ Reservoir/ Total Total
Industrial Recreation Direct
Impacts2030 Mid- -7M -0.6M -0.7M -8.3M -13 toRange
Scenario25 M
2080 Mid- -51M -6M -5M -62M -93 to -Range
Scenario185M

Big Picture Findings
Supply of water declines while demand increases.
15% mid-range increase in water prices by 2030
103% mid-range increase in water prices by 2080
Significant direct and secondary economic impacts.
Agricultural sector could face largest economicimpact.
Reduced streamflows = reduced assimilativecapacity.
Maintaining water quality will be more difficult and morecostly for dischargers
12
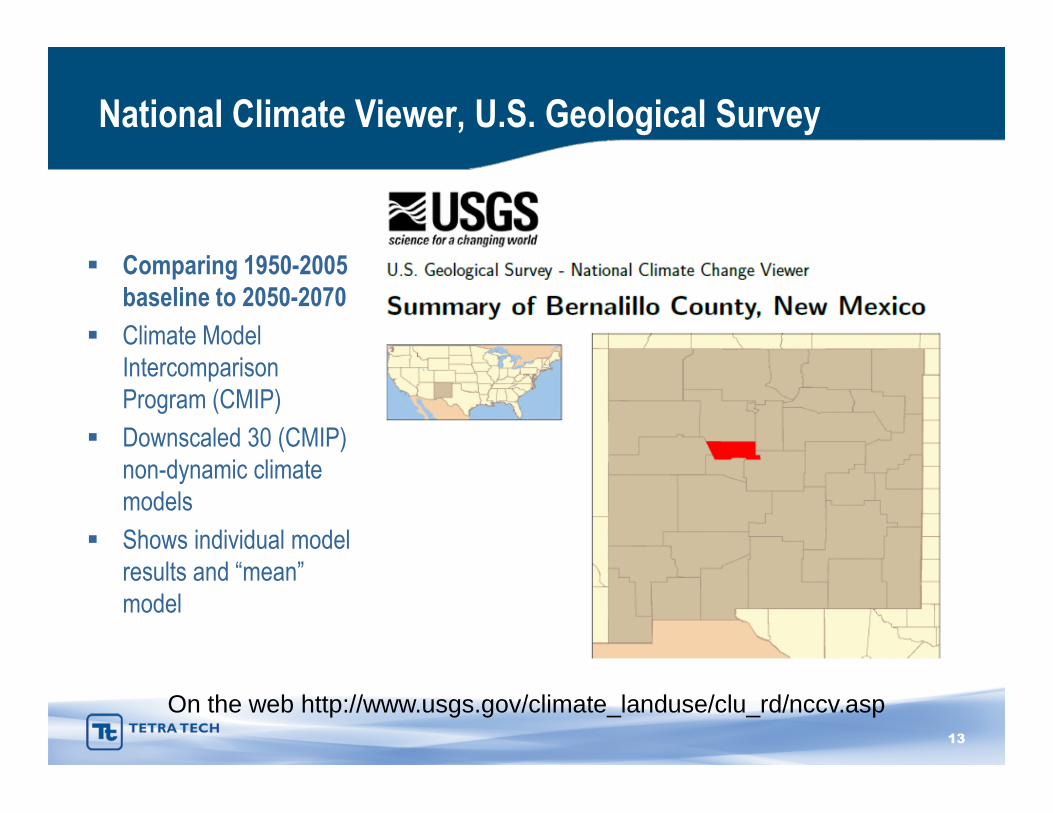
National Climate Viewer, U.S. Geological Survey
Comparing 1950-2005baseline to 2050-2070
Climate ModelIntercomparisonProgram (CMIP)
Downscaled 30 (CMIP)non-dynamic climatemodels
Shows individual modelresults and “mean”model
13
On the web http://www.usgs.gov/climate_landuse/clu_rd/nccv.asp

National Climate Change Viewer, Bernalillo County, NMUSGS – Mean Model Results
Temperature
Projected 7.2o F increase in average annual maximumtemperature.
Projected 6.2o F increase in average annual minimumtemperature.
No change in annual mean precipitation
0 – 0.2 in/month mean decrease in snow (Nov. –Apr)
0.1 in/month mean decrease in runoff (Feb-June)
14

No change in mean annual precipitation? So what’sthe problem?
15
Models don’t predictmuch change inannual precipitation,but large increases inevapotranspiration.
Change in runoff isthe differencebetween precipitationandevapotranspiration.

Watershed Modeling to Assess…Climate Change andUrban Development, USEPA, 2013
16
Comparing 1971-2000 baseline to2070
Watershed simulations SWAT
Downscaled 6 dynamic climate models
Includes projected mid-century urban-residential development
Shows individual model and ensemblemodel results
Shows 20 watersheds andsubwatersheds to 8-digit HUC
On web http://cfpub.epa.gov/ncea/global/recordisplay.cfm

Rio Grande at Albuquerque – Mid Century Comparedto 1971-2000
Given climate andurban developmentprojections, themodel ensemblefor the Rio Grandeat Albuquerqueprojects significantreductions involume, flow, andloading at mid-century.
17
-17%-23%
-29%
-40%
-48%-51%
-60%
-50%
-40%
-30%
-20%
-10%
0%
100y Peak Flow 7d Low Flow Total Volume TSS Load TP Load TN Load
Pro
ject
ed
Pe
rce
nt
Re
du
ctio
n
Albuquerque HUC8: Rio Grande Valley Basin

What about intensity of precipitation projected at JemezDam? Looking at the six climate change models…
Up to the 25-yearstorm event, rainfallintensity is similar.
50-year and maxyear events areprojected toincrease 10 mm orapprox. 0.4 inches(mean of models).
18
0
10
20
30
40
50
60
70
80
1 2 5 10 25 50 max
Dai
lyP
reci
p(m
m)
Recurrence (yr)
Historic
Scen 1
Scen 2
Scen 3
Scen 4
Scen 5
Scen 6

Mid Region Council of Governments Study
19
Comparing 2040 tobaseline (1950-1999)
Used different climatemodels to develop 5“climate futures” Warm wet
Hot wet
Warm dry
Hot dry
Central
Evaluated different gridsin the MRCOG region,including Albuquerque

Mid Region Council of Governments Study – City ofAlbuquerque Grid
20
Projections show
4X the annual daysover 100o F by 2040for Albuquerque.
Statisticallysignificant increasein length ofdroughts.

Mid Region Council of Governments Study – City ofAlbuquerque Grid
21
High variability inprojections ofmonthly averageprecipitation forAlbuquerque.
Modest increasesand decreasesprojected formaximum 24 hourevents.

Related Study: Flood Risk Analysis Potential Impactsof Climate Change, Southern Sandoval Co AFCA
22
Projections show
no change in rainfallintensity/floodingrisk through mid-century.
A 10 percentincrease in the 100year storm eventprojected by end ofcentury, resulting in25% increase inpeak flow.
Percent change in 100-year 24-hour precipitation for Upper Calabacillas Arroyo

Upper Rio Grande Impact Assessment, SandiaNational Lab and U.S. Bureau of Reclamation, 2013
23
On the web:http://www.usbr.gov/WaterSMART/wcra/reports/urgia.htmlhttp://www.slideshare.net/fullscreen/atlanticcouncil/water-in-the-west-session-3-jesse-roach/2

24

Big Picture Findings (compared to 1950-1999 baseline)Note: Study does not consider projected growth of region
Colorado and Rio Grande flows projected to decrease33% during 2050-2099
San Juan-Chama Project Flows
San Juan flows projected to decrease 25% by 2050-2099
San Juan Chama Project allocations projected to decrease15% (due to engineered storage)
San Juan Chama project allocation shortfalls
72% of allocation projected by 2050s
62% of allocation projected by 2099
25

Big Picture FindingsNote: Study does not consider projected growth of region
Already problems using allocation due to drought
Water shortages
Wildfires and ash ladened water
Hydropower- Projected decrease of 50% by 2099
Water quality – concentrations of sediment,nutrients, and salt may increase
26
Community vulnerability & hazards in Albuquerqueassociated with these climate change projections
Projections about how climatechange may affectAlbuquerque’s water resources
Scoping communityvulnerability & hazards
Questions and discussion

Regional and Localized Vulnarability & Hazards forAlbuquerque Region
Regional – Community Wide
Insufficient water supplies for drinking, industry, farming
Heat-related illnesses and deaths
Disruptions to energy supplies (and chain of effects on waterand wastewater utilities)
Water quality and habitat impacts
Localized
Increased wildfires (and related property and health impacts)
Continued flooding (with no or slight increase in 50 year andgreater storm events) through mid century
28

Four Vulnerability/Opportunity Areas
Glenrio
South Broadway
Mid-Valley
Ventana Dam Area
29
We will focus onportions of thesedistricts in ourcharrette.

Example On-Line Tools to Conduct LocalVulnerability & Hazards Assessments
Climate Change Resilience Evaluation andAwareness Tool CREAT, USEPA
New on-line tool to assist drinking water andwastewater utility owners in understanding climatechange threats and risks to their utilities
http://water.epa.gov/infrastructure/watersecurity/climate/creat.cfm
30

Example On-Line Tools to Conduct LocalVulnerability & Hazards Assessments
Climate Registry for the Assessment ofVulnerability, CRAVe, USGS
Access to information about climate changevulnerability assessments, leveraging work frommultiple agencies.
https://nccwsc.usgs.gov/crave/
31
Example On-Line Tools to Conduct LocalVulnerability & Hazards Assessments
Virtual Framework and Vulnerability AssessmentScoring Tool (VAST)
Spreadsheet based guide to walk agencies throughthe vulnerability assessment process for roads andhighways.
http://www.fhwa.dot.gov/environment/climate_change/adaptation/ongoing_and_current_research/gulf_coast_study/phase2_task6/page04.cfm
32

Questions and Discussion