Embed Size (px)
DESCRIPTION
What Are Weather Forecasts Worth? Stated Preference Approaches to Valuing Information. Jeff Lazo Societal Impacts Program National Center for Atmospheric Research Boulder, CO www.sip.ucar.edu CANSEE, Toronto, CA - October 28, 2005. Outline. Motivation of the Study Prior Studies - PowerPoint PPT Presentation
Citation preview

What Are Weather Forecasts What Are Weather Forecasts Worth?Worth?
Stated Preference Approaches Stated Preference Approaches to Valuing Informationto Valuing Information
Jeff LazoJeff LazoSocietal Impacts ProgramSocietal Impacts Program
National Center for Atmospheric ResearchNational Center for Atmospheric ResearchBoulder, COBoulder, CO
www.sip.ucar.eduwww.sip.ucar.edu
CANSEE, Toronto, CA - October 28, 2005CANSEE, Toronto, CA - October 28, 2005

OutlineOutline
Motivation of the Study Motivation of the Study Prior StudiesPrior Studies Stated Preference ValuationStated Preference Valuation Survey DevelopmentSurvey Development ResultsResults Next StepsNext Steps

MotivationMotivation
• Evaluate benefits to households of Evaluate benefits to households of improvements in weather forecasting improvements in weather forecasting servicesservices
• 104,705,000 households104,705,000 households
• Day-to-day weatherDay-to-day weather
• National Oceanic & Atmospheric National Oceanic & Atmospheric AdministrationAdministration

Value of Weather InformationValue of Weather Information
Haas and Rinkle (1979)Haas and Rinkle (1979) MSI Services Incorporated (1981)MSI Services Incorporated (1981) Chapman (1992) Chapman (1992) Anaman and Lellyett (1996)Anaman and Lellyett (1996) Rollins and Shaykewich (2003)Rollins and Shaykewich (2003)
Weather forecasts - quasi-public goodWeather forecasts - quasi-public good Non-market valuation methodsNon-market valuation methods
• stated preferencestated preference contingent valuationcontingent valuation choice based methodschoice based methods

Survey DevelopmentSurvey Development Atmospheric Science Advisors (ASA)Atmospheric Science Advisors (ASA)
• attributes of weather forecastsattributes of weather forecasts• current and potential level of attributescurrent and potential level of attributes
Focus groups Focus groups (15 subjects)(15 subjects) One-on-one interviews One-on-one interviews (11 subjects)(11 subjects) Denver Pretest Denver Pretest (84 Subjects)(84 Subjects)
Survey Expert Review PanelSurvey Expert Review Panel North Carolina Focus Groups North Carolina Focus Groups (23 subjects)(23 subjects) Multi-site implementation Multi-site implementation (381 Subjects)(381 Subjects) National random sample National random sample (~1,400 Subjects)(~1,400 Subjects)

Survey LayoutSurvey Layout
IntroductionIntroduction Sources, perceptions and usesSources, perceptions and uses Forecast attributesForecast attributes Value for improved weather forecastsValue for improved weather forecasts
• Stated choice - attributes of forecastsStated choice - attributes of forecasts• Contingent valuation – demand characteristicsContingent valuation – demand characteristics
Household characteristicsHousehold characteristics Value for Current ForecastsValue for Current Forecasts Severe WeatherSevere Weather

Survey ImplementationSurvey Implementation 9 cities – in-person self-administered9 cities – in-person self-administered written survey - ~25-30 minuteswritten survey - ~25-30 minutes 381 Respondents381 Respondents

Socio-demographicsSocio-demographics
Characteristic Mean
Kruskal-Wallis Test
2 Income (2001$) $49,934 18.84 ** Age 43.7 yrs 13.78 * Education 14.9 yrs 15.12 * Gender 43% males 10.27 How long lived in the area 19.8 yrs 18.29 ** Household size 2.7 6.25 ***, **, * Significant at the 1%, 5%, and 10% respectively

ResultsResults
Perceptions (sources & uses)Perceptions (sources & uses) Attributes and LevelsAttributes and Levels ValuationValuation
• modelingmodeling• value estimatesvalue estimates

PerceptionsPerceptionsImportance of Weather Forecast CharacteristicImportance of Weather Forecast Characteristic

PerceptionsPerceptionsImportance of Weather Forecast CharacteristicImportance of Weather Forecast Characteristic
Characteristic Mean
Chance of rain, snow, or hail 4.30
Amount of rain, snow, or hail 4.02
High temperature 3.85
Low temperature 3.74
How windy it will be 3.28
How cloudy it will be 2.74
Air pressure 2.21

Adequacy of Current Levels of Adequacy of Current Levels of Forecast AttributesForecast Attributes
Attribute Mean SD
Adequacy of updates 4 times a day 3.30 0.68
Adequacy of weather forecasts 5 days in advance
2.89 0.84
Adequacy of 80% correctness of one-day forecasts
2.88 0.81
Adequacy of geography detail to 30 miles by 30 miles
2.74 0.88

Stated Choice:Stated Choice:Attributes and Attribute LevelsAttributes and Attribute Levels
•Dollars per year per household of $3, $8, $15, $24
•Budget constraint reminder
•20 versions of survey
•9 Stated Choice and 1 Stated Value question
Frequency One-Day Multiday Accuracy
Attribute Improvement
Level
Frequency of Updates (times
per day)
Accuracy of One-Day
Forecasts
Accuracy of Multiday
Forecasts Geographic
Detail
Baseline 4 80% 5 days 30 miles
Minimal 6 85% 7 days 15 miles
Medium 9 90% 10 days 7 miles
Maximum 12 95% 14 days 3 miles

Stated Stated ChoiceChoiceQuest-Quest-
ionion

A-B Probit ModelA-B Probit Model
A B
Y-C Fr , One , Multi , Geog
Y-C Fr , One , Multi , Geog
Random Utility Model: x
Choose A if utility from U U
x x
1 1 1 2 2
2 1 2 1
,
,
A A A A A A
B B B B B B
k k k
A A B B
ij ij ij ij ij
ij ij ij ij
U
U
U
P P x x
P x x
univariate standard normal dist.function
x x
2 1
1 2
1 1
2
, 1, . . . , , , ij
ij ij
n Jk
ij ij ij iji j
x x
L k i J , P

Stated Choice QuestionStated Choice Question
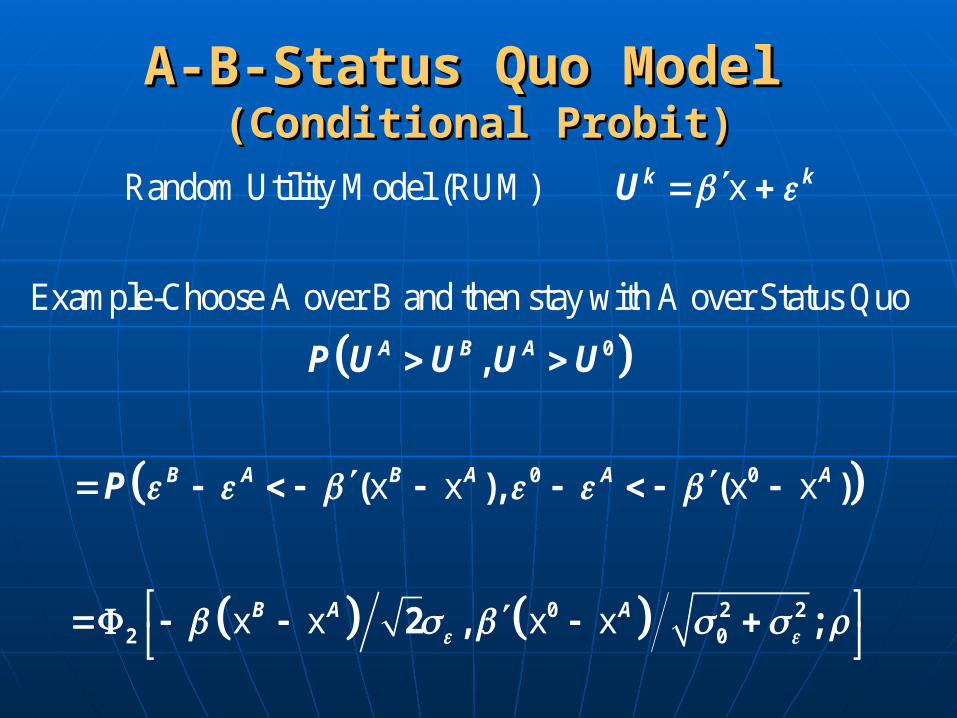
A-B-Status Quo Model A-B-Status Quo Model (Conditional Probit)(Conditional Probit)
Random Utility Model (RUM) x
Example-Choose A over B and then stay with A over Status Quo
x x x x
x x x x
0
0 0
0 2 22 0
,
( ), ( )
2 , ;
k k
A B A
B A B A A A
B A A
U
P U U U U
P

Stated Value: Valuation QuestionStated Value: Valuation Question

Stated Value (WTP) ModelStated Value (WTP) Model
Fr , One , Multi , Geog
x
Y-WTP Fr , One , Multi , Geog Y Fr , One , Multi , Geog
let
* * * *
* * *
0 * * * * * 0 0 0 0
* * 0 * 0
2 2* * 0 0
2
22 0
, ,
1( ) . . . ( )
~ . . . ,
fry
fr
y y
WTP f
U
U
WTP Fr Fr
WTP N Fr Fr
2
2y

Model EstimatesModel Estimates(t-ratios in parentheses)(t-ratios in parentheses)
ABO Biv.
Probit WTP Tobit Combined Frequency -0.049
(-10.0) 0.199 (0.8)
-0.067 (-16.4)
One Day 0.062 (16.4)
0.572 (4.0)
0.041 (13.3)
Multi-day 0.031 (6.5)
0.284 (1.2)
0.004 (1.1)
Geographic -0.007 (-4.8)
-0.272 (-4.0)
-0.031 (-25.6)
Cost -0.092 (-17.7)
-0.083 (-22.5)
Est. WTP (Est. std. err.)
$15.27 ($1.05)
$18.49 ($2.08)
$17.88 ($0.96)
N 3429 381 381

National Valuation EstimateNational Valuation Estimate
Estimated household WTP $17.88
Number of Households 104,705,000
National WTP $1.87 Billion
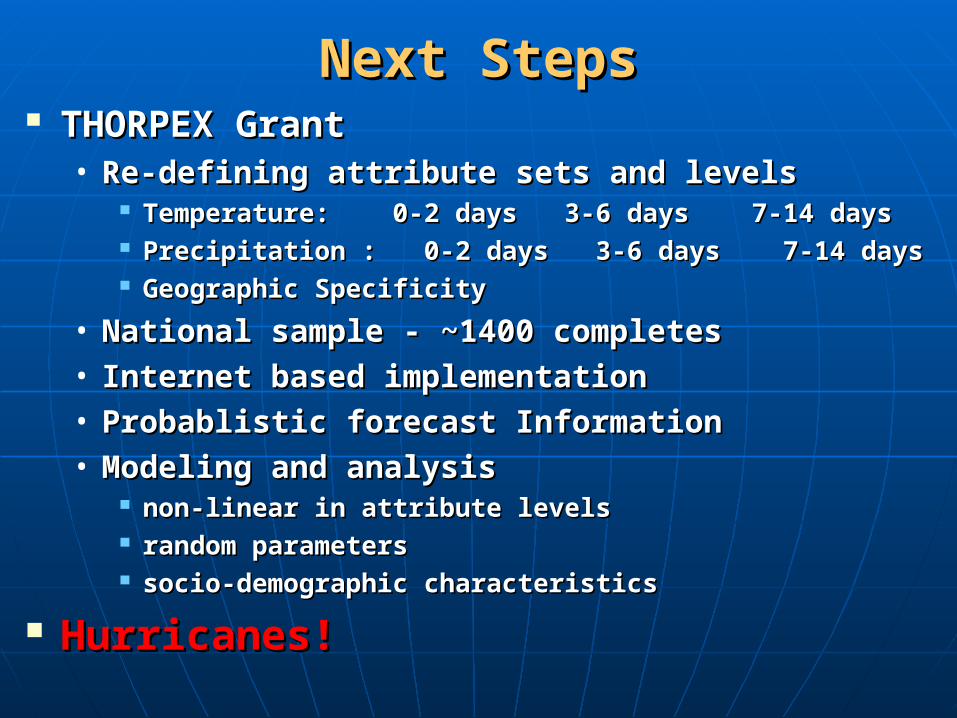
Next StepsNext Steps THORPEX GrantTHORPEX Grant• Re-defining attribute sets and levelsRe-defining attribute sets and levels
Temperature: 0-2 days 3-6 days 7-14 daysTemperature: 0-2 days 3-6 days 7-14 days Precipitation : 0-2 days 3-6 days 7-14 daysPrecipitation : 0-2 days 3-6 days 7-14 days Geographic SpecificityGeographic Specificity
• National sample - ~1400 completesNational sample - ~1400 completes• Internet based implementationInternet based implementation• Probablistic forecast InformationProbablistic forecast Information• Modeling and analysisModeling and analysis
non-linear in attribute levelsnon-linear in attribute levels random parameters random parameters socio-demographic characteristicssocio-demographic characteristics
Hurricanes!Hurricanes!

Questions?Questions?