Embed Size (px)
Citation preview

Dr. Bernd Fischer
Five years after Lehman
What are we doing different from a risk perspective?
10. June 2014

© IDS GmbH – Analysis and Reporting Services
2
2
Agenda
2 Consequences of the crisis and impact of regulatory changes 2
3 Impact on the treatment of risks and performance analysis
1 Looking back – what happened?
4 Conclusions
© IDS GmbH – Analysis and Reporting Services
3
3
2 Consequences of the crisis and impact of regulatory changes 2
3 Impact on the treatment of risks and performance analysis
1 Looking back – what happened?
4 Conclusions
© IDS GmbH – Analysis and Reporting Services
4
4
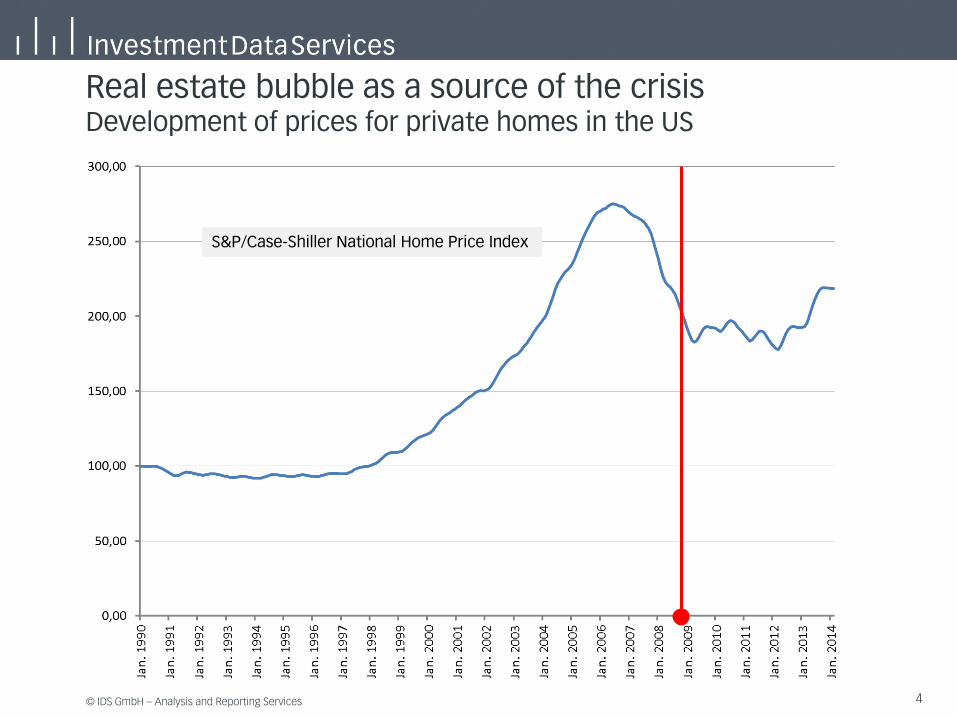
Real estate bubble as a source of the crisis Development of prices for private homes in the US
S&P/Case-Shiller National Home Price Index
© IDS GmbH – Analysis and Reporting Services
5
5
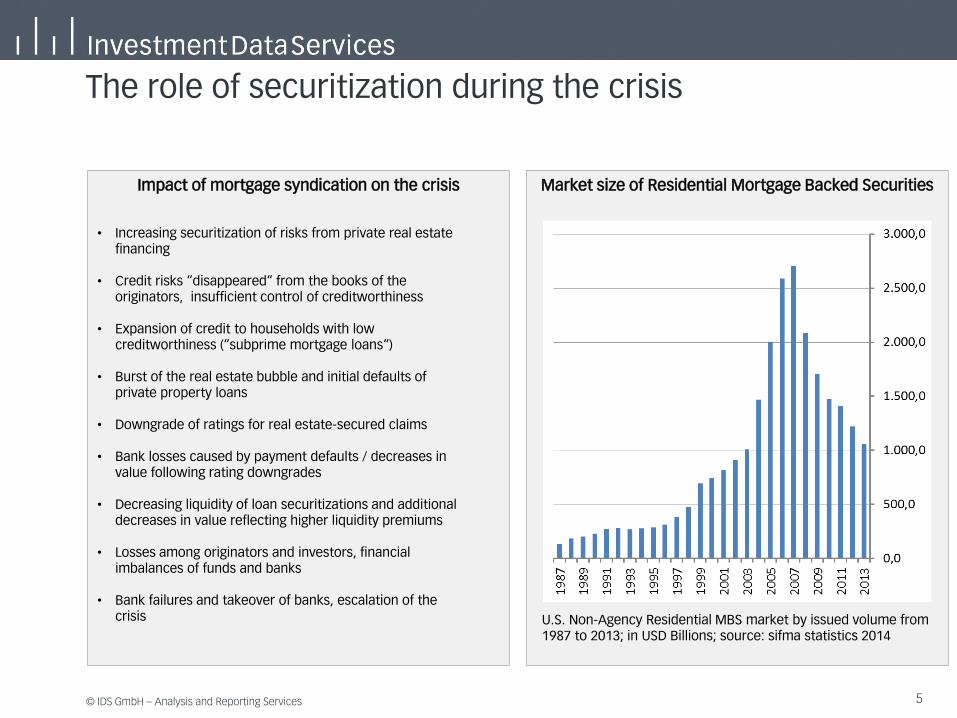
The role of securitization during the crisis
Market size of Residential Mortgage Backed Securities Impact of mortgage syndication on the crisis
U.S. Non-Agency Residential MBS market by issued volume from 1987 to 2013; in USD Billions; source: sifma statistics 2014
• Increasing securitization of risks from private real estate financing
• Credit risks “disappeared“ from the books of the originators, insufficient control of creditworthiness
• Expansion of credit to households with low creditworthiness (“subprime mortgage loans“)
• Burst of the real estate bubble and initial defaults of private property loans
• Downgrade of ratings for real estate-secured claims
• Bank losses caused by payment defaults / decreases in value following rating downgrades
• Decreasing liquidity of loan securitizations and additional decreases in value reflecting higher liquidity premiums
• Losses among originators and investors, financial imbalances of funds and banks
• Bank failures and takeover of banks, escalation of the crisis
© IDS GmbH – Analysis and Reporting Services
6
6
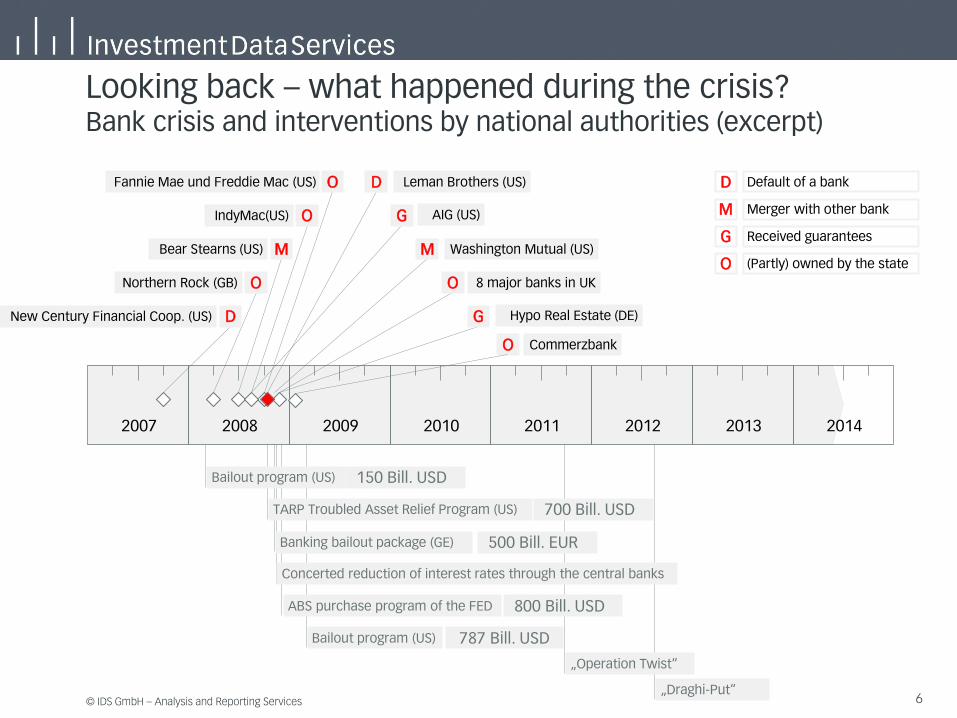
Looking back – what happened during the crisis? Bank crisis and interventions by national authorities (excerpt)
2007 2008 2009 2010 2011 2012 2013 2014
Default of a bank D
Merger with other bank M
Received guarantees G
(Partly) owned by the state O
New Century Financial Coop. (US) D
Northern Rock (GB) O
Bear Stearns (US) M
IndyMac(US) O
Fannie Mae und Freddie Mac (US) O Leman Brothers (US) D
AIG (US) G
Washington Mutual (US) M
8 major banks in UK O
Hypo Real Estate (DE) G
Bailout program (US) 150 Bill. USD
TARP Troubled Asset Relief Program (US) 700 Bill. USD
Banking bailout package (GE) 500 Bill. EUR
Concerted reduction of interest rates through the central banks
ABS purchase program of the FED 800 Bill. USD
Bailout program (US) 787 Bill. USD
Commerzbank O
„Operation Twist“
„Draghi-Put“
© IDS GmbH – Analysis and Reporting Services
7
7
2007 2008 2009 2010 2011 2012 2013 2014
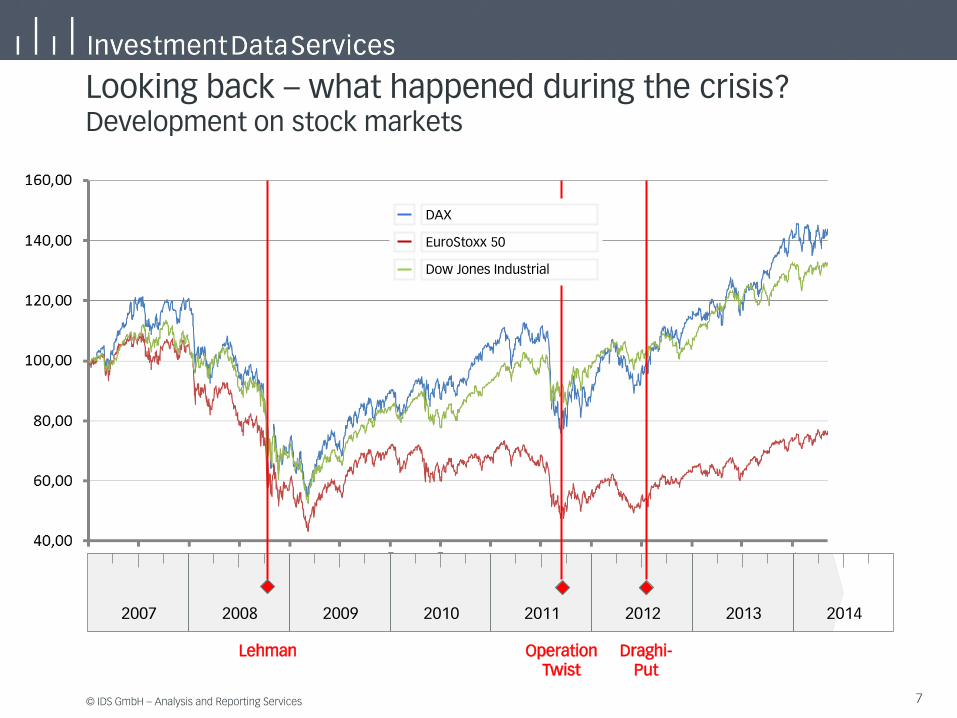
Looking back – what happened during the crisis? Development on stock markets
Lehman Draghi- Put
Operation Twist
EuroStoxx 50
Dow Jones Industrial
DAX
© IDS GmbH – Analysis and Reporting Services
8
8
2007 2008 2009 2010 2011 2012 2013 2014
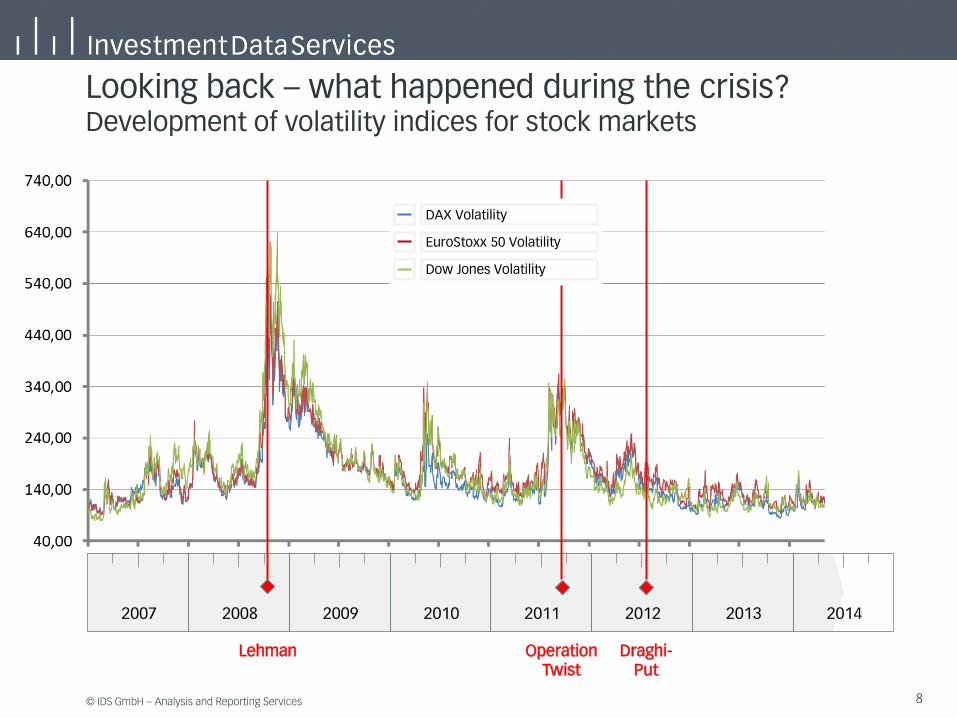
Looking back – what happened during the crisis? Development of volatility indices for stock markets
Lehman Draghi- Put
Operation Twist
DAX Volatility
EuroStoxx 50 Volatility
Dow Jones Volatility
© IDS GmbH – Analysis and Reporting Services
9
9
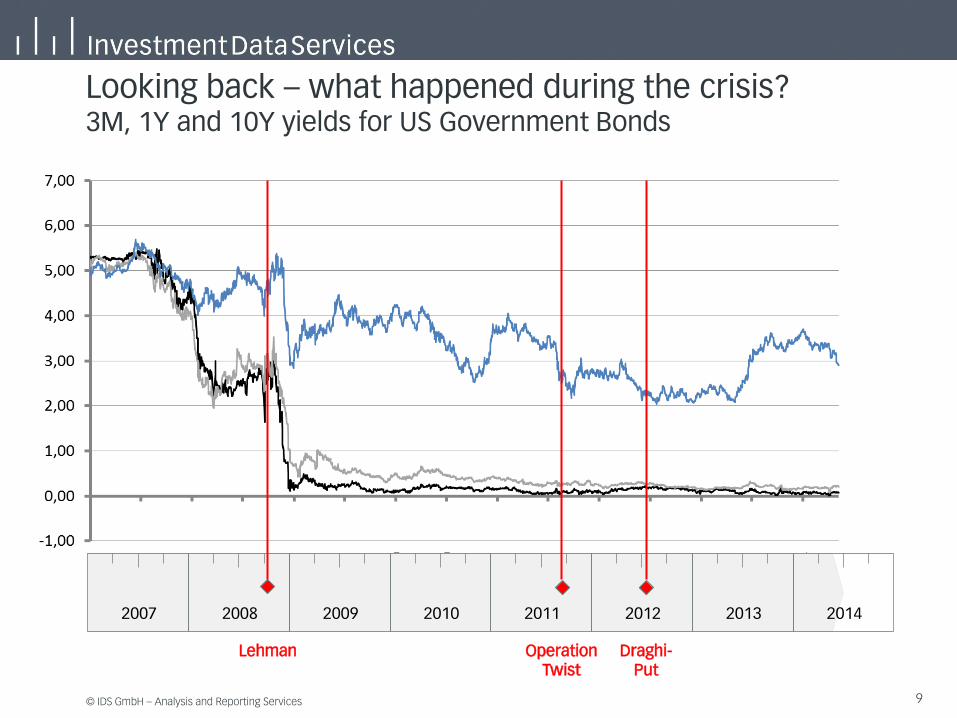
Looking back – what happened during the crisis? 3M, 1Y and 10Y yields for US Government Bonds
2007 2008 2009 2010 2011 2012 2013 2014
Lehman Draghi- Put
Operation Twist
© IDS GmbH – Analysis and Reporting Services
10
10
2007 2008 2009 2010 2011 2012 2013 2014
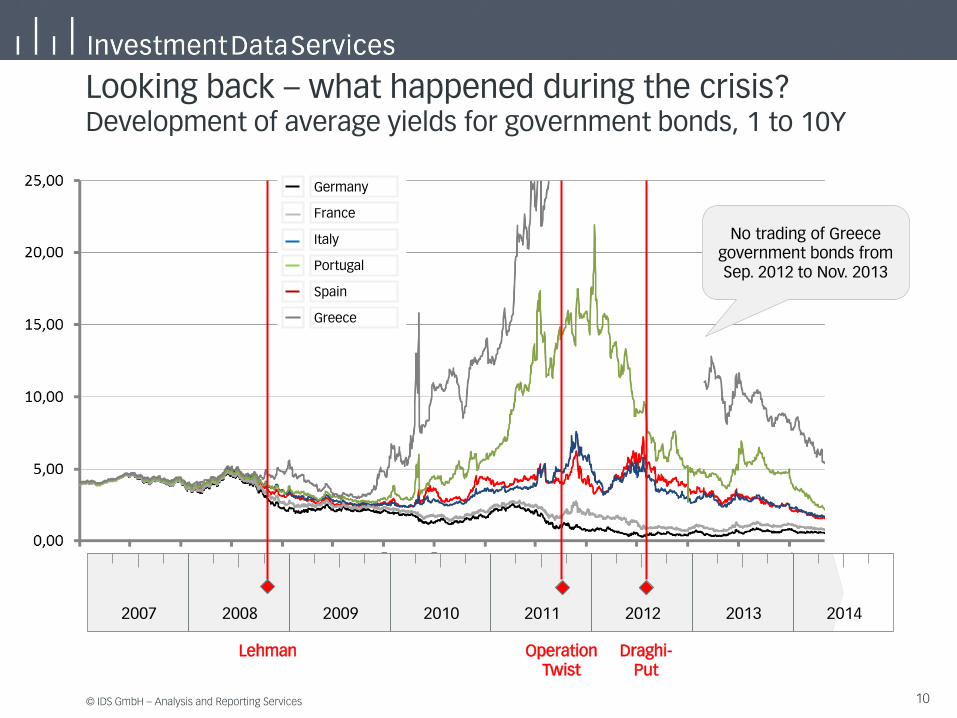
Looking back – what happened during the crisis? Development of average yields for government bonds, 1 to 10Y
No trading of Greece government bonds from Sep. 2012 to Nov. 2013
Lehman Draghi- Put
Operation Twist
Germany
France
Italy
Portugal
Spain
Greece
© IDS GmbH – Analysis and Reporting Services
11
11
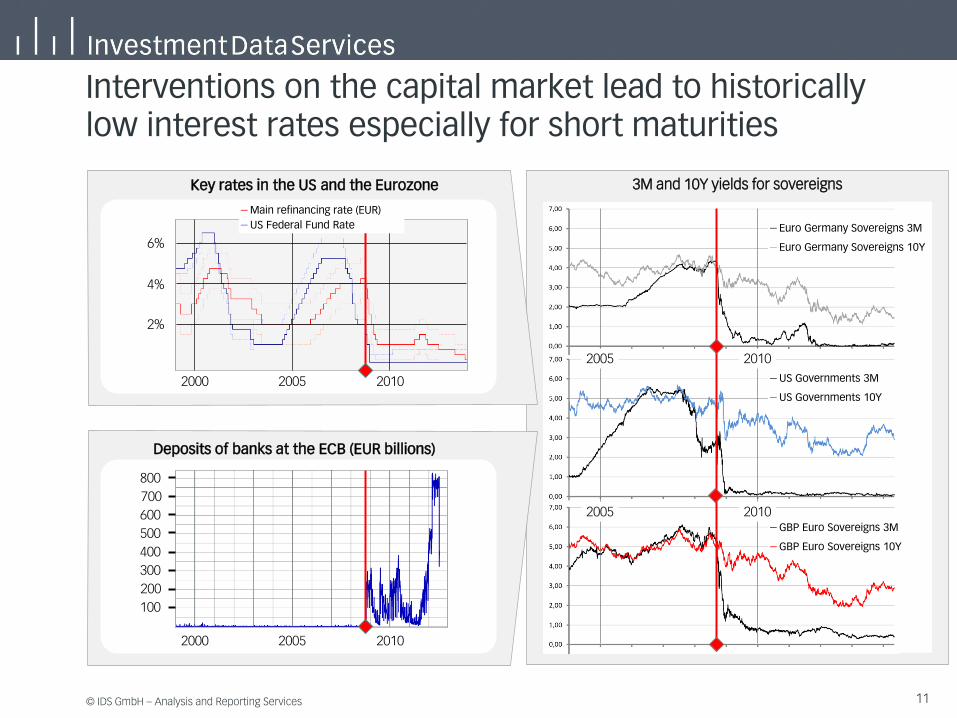
3M and 10Y yields for sovereigns
2005 2010
Euro Germany Sovereigns 3M
Euro Germany Sovereigns 10Y
US Governments 3M
US Governments 10Y
GBP Euro Sovereigns 3M
GBP Euro Sovereigns 10Y
2005 2010
500
Interventions on the capital market lead to historically low interest rates especially for short maturities
2000 2005 2010
2%
4%
2000 2005 2010
6%
US Federal Fund Rate
Main refinancing rate (EUR)
Key rates in the US and the Eurozone
Deposits of banks at the ECB (EUR billions)
100
200
300
400
600
700
800
© IDS GmbH – Analysis and Reporting Services
12
12
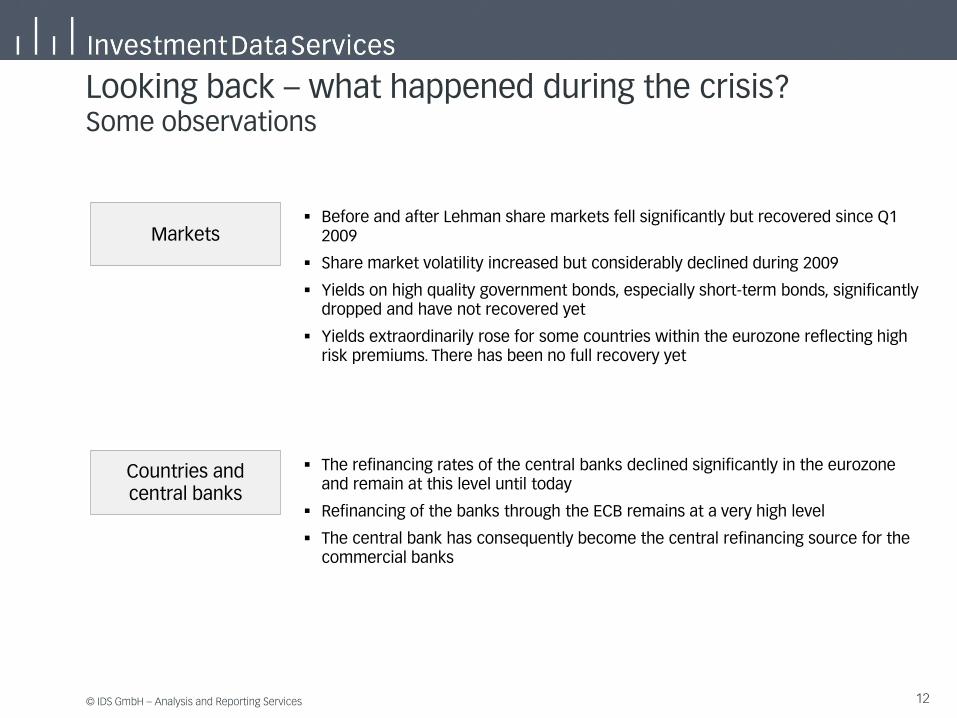
Looking back – what happened during the crisis? Some observations
Markets Before and after Lehman share markets fell significantly but recovered since Q1
2009
Share market volatility increased but considerably declined during 2009
Yields on high quality government bonds, especially short-term bonds, significantly dropped and have not recovered yet
Yields extraordinarily rose for some countries within the eurozone reflecting high risk premiums. There has been no full recovery yet
Countries and central banks
The refinancing rates of the central banks declined significantly in the eurozone and remain at this level until today
Refinancing of the banks through the ECB remains at a very high level
The central bank has consequently become the central refinancing source for the commercial banks
© IDS GmbH – Analysis and Reporting Services
13
13
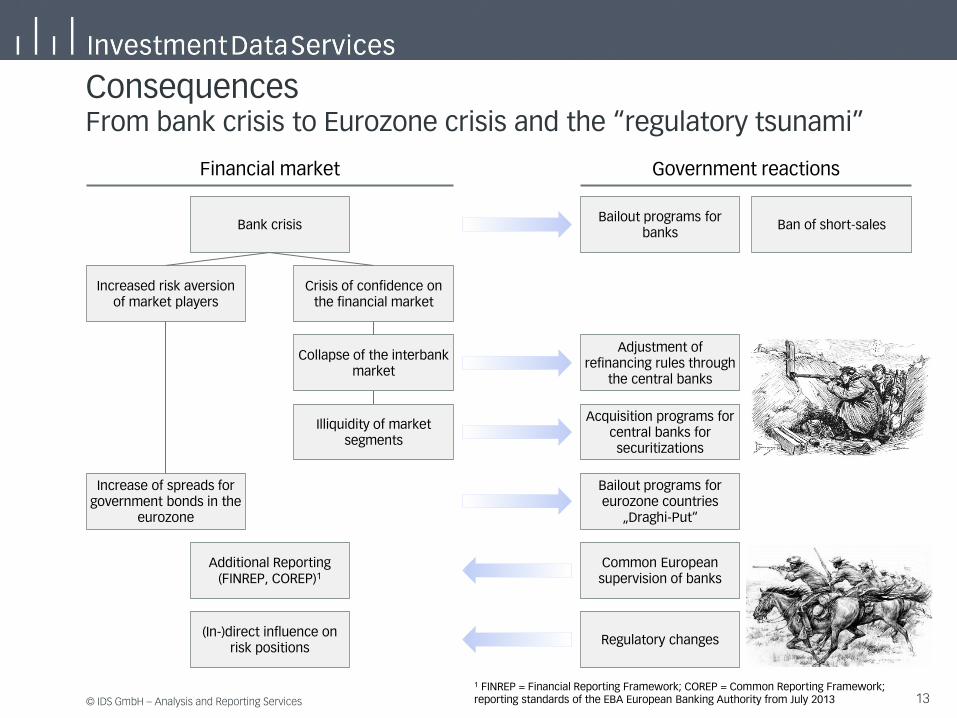
Consequences From bank crisis to Eurozone crisis and the “regulatory tsunami”
Bank crisis
Collapse of the interbank market
Illiquidity of market segments
Increase of spreads for government bonds in the
eurozone
Additional Reporting (FINREP, COREP)1
(In-)direct influence on risk positions
Adjustment of refinancing rules through
the central banks
Acquisition programs for central banks for securitizations
Bailout programs for banks
Ban of short-sales
Bailout programs for eurozone countries
„Draghi-Put“
Common European supervision of banks
Regulatory changes
Crisis of confidence on the financial market
Increased risk aversion of market players
Financial market Government reactions
1 FINREP = Financial Reporting Framework; COREP = Common Reporting Framework; reporting standards of the EBA European Banking Authority from July 2013
© IDS GmbH – Analysis and Reporting Services
14
14
2 Consequences of the crisis and impact of regulatory changes 2
3 Impact on the treatment of risks and performance analysis
1 Looking back – what happened?
4 Conclusions
© IDS GmbH – Analysis and Reporting Services
15
15
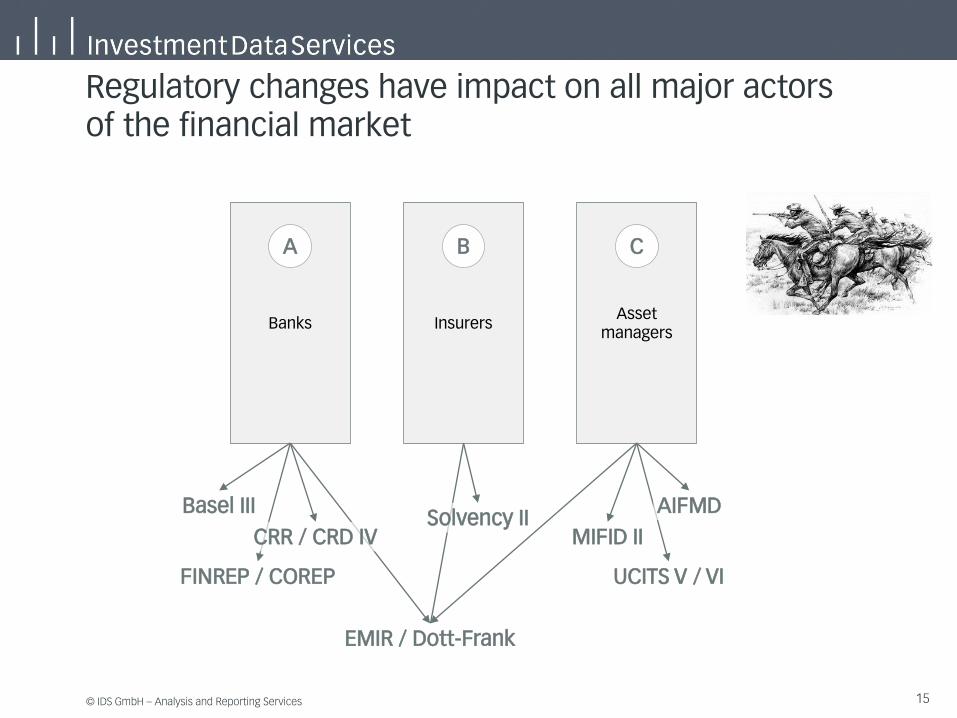
Regulatory changes have impact on all major actors of the financial market
Banks Insurers Asset
managers
A B C
Basel III
CRR / CRD IV Solvency II
FINREP / COREP
AIFMD
MIFID II
UCITS V / VI
EMIR / Dott-Frank

© IDS GmbH – Analysis and Reporting Services
16
16
Requirements for capital resources of banks will considerably rise following Basel III
From 2019 banks of the EU need to have available 62.5% of additional funds
In addition, quality requirements for the capital will rise:
The future core capital ratio will increase by 125% compared to today
Requirements for core capital instruments will be higher
The risks institutions will be able to take on with the same amount of capital will be lower1
Current ROC ratios will not be attainable
The competition of business areas for risk capital will tighten
Institutions will concentrate even more on “profitable” risks
1 ”Lower” in the sense of the regulatory risk assessment tools
62,5%
125%
Capital
A
Banks
© IDS GmbH – Analysis and Reporting Services
17
17
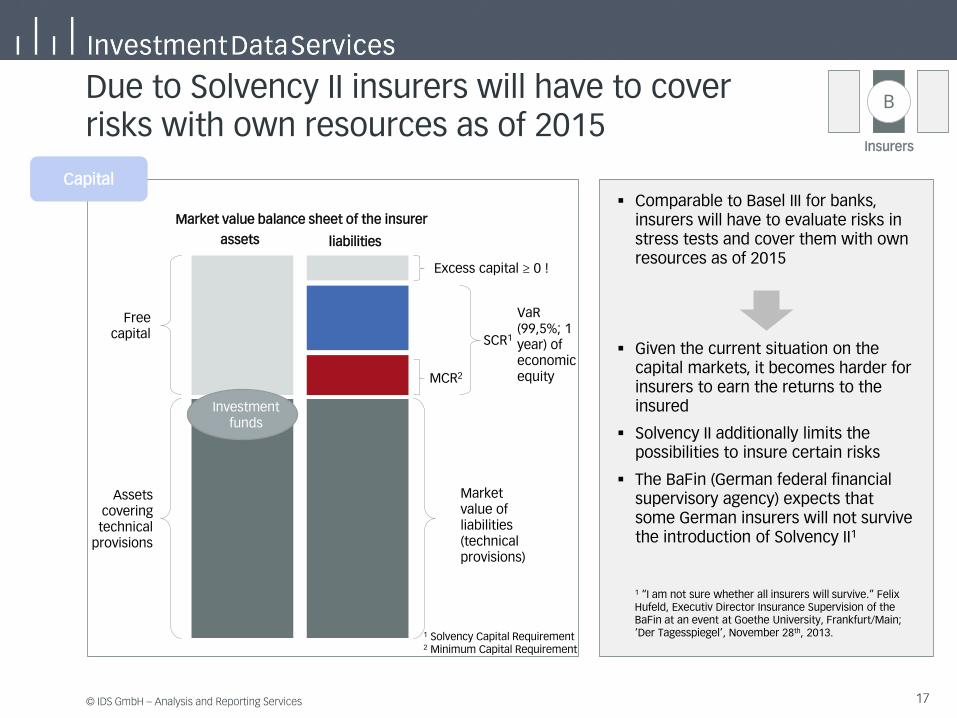
Due to Solvency II insurers will have to cover risks with own resources as of 2015
Comparable to Basel III for banks, insurers will have to evaluate risks in stress tests and cover them with own resources as of 2015
Given the current situation on the capital markets, it becomes harder for insurers to earn the returns to the insured
Solvency II additionally limits the possibilities to insure certain risks
The BaFin (German federal financial supervisory agency) expects that some German insurers will not survive the introduction of Solvency II1
1 “I am not sure whether all insurers will survive.” Felix Hufeld, Executiv Director Insurance Supervision of the BaFin at an event at Goethe University, Frankfurt/Main; ‘Der Tagesspiegel’, November 28th, 2013.
Capital
Market value of liabilities (technical provisions)
MCR2
SCR1
Excess capital ≥ 0 !
Free capital
Assets covering technical
provisions
assets liabilities
VaR (99,5%; 1 year) of economic equity
Market value balance sheet of the insurer
Investment funds
1 Solvency Capital Requirement 2 Minimum Capital Requirement
Insurers
B
© IDS GmbH – Analysis and Reporting Services
18
18
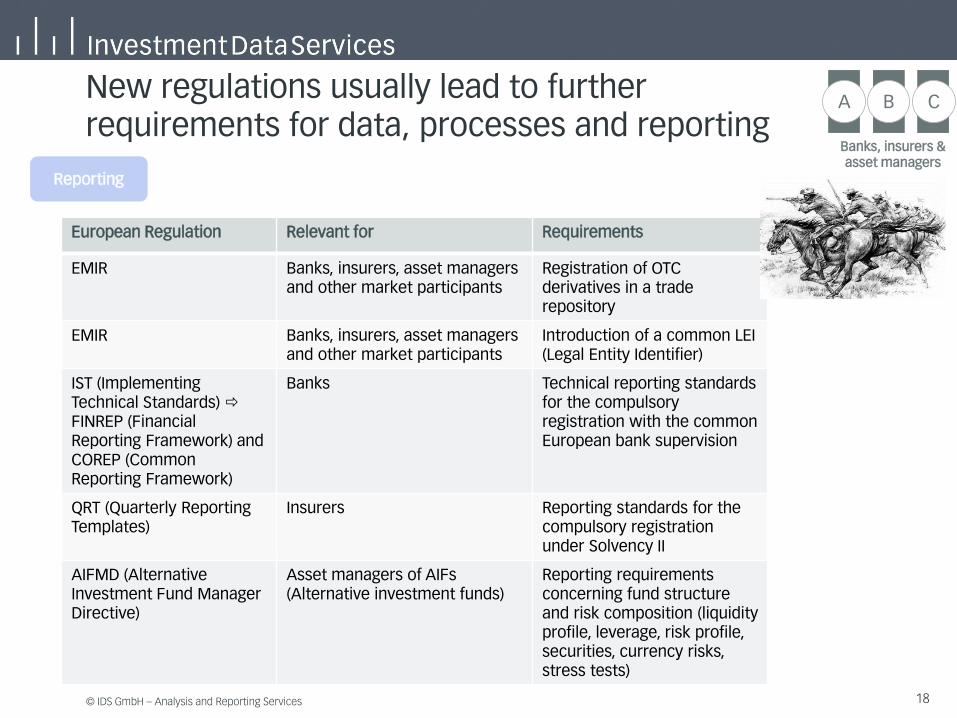
B New regulations usually lead to further requirements for data, processes and reporting
European Regulation Relevant for Requirements
EMIR Banks, insurers, asset managers and other market participants
Registration of OTC derivatives in a trade repository
EMIR Banks, insurers, asset managers and other market participants
Introduction of a common LEI (Legal Entity Identifier)
IST (Implementing Technical Standards) FINREP (Financial Reporting Framework) and COREP (Common Reporting Framework)
Banks Technical reporting standards for the compulsory registration with the common European bank supervision
QRT (Quarterly Reporting Templates)
Insurers Reporting standards for the compulsory registration under Solvency II
AIFMD (Alternative Investment Fund Manager Directive)
Asset managers of AIFs (Alternative investment funds)
Reporting requirements concerning fund structure and risk composition (liquidity profile, leverage, risk profile, securities, currency risks, stress tests)
Reporting
A C
Banks, insurers & asset managers
© IDS GmbH – Analysis and Reporting Services
19
19
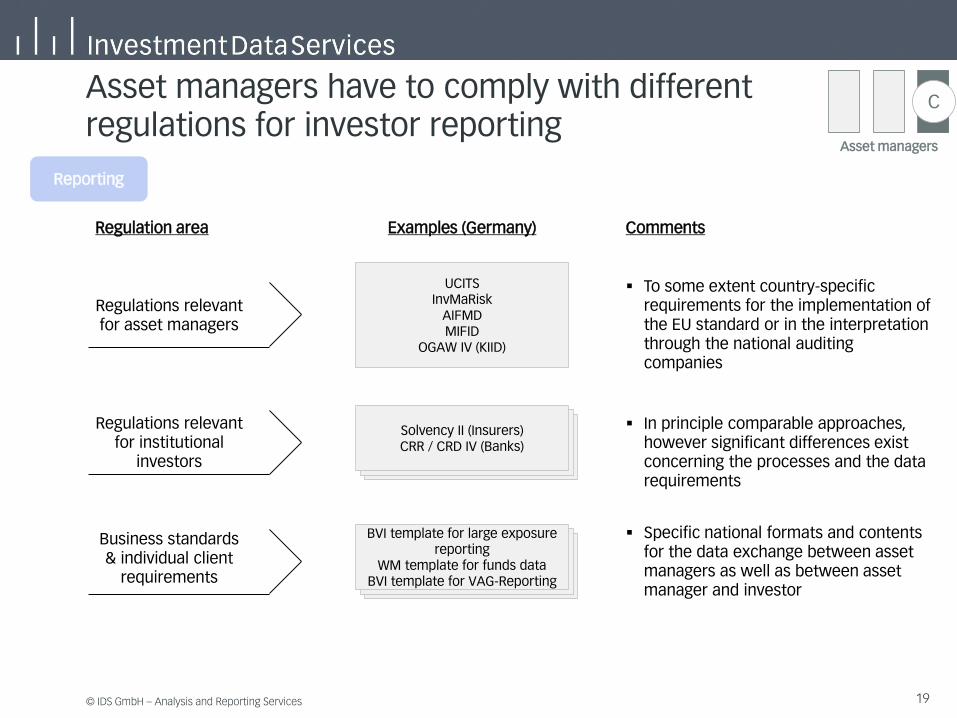
Asset managers have to comply with different regulations for investor reporting
Regulation area Examples (Germany) Comments
To some extent country-specific requirements for the implementation of the EU standard or in the interpretation through the national auditing companies
UCITS
InvMaRisk AIFMD MIFID
OGAW IV (KIID)
Regulations relevant for asset managers
Solvency II (Insurers) CRR / CRD IV (Banks)
Regulations relevant for institutional
investors
In principle comparable approaches, however significant differences exist concerning the processes and the data requirements
BVI template for large exposure reporting
WM template for funds data BVI template for VAG-Reporting
Business standards & individual client
requirements
Specific national formats and contents for the data exchange between asset managers as well as between asset manager and investor
Reporting
C
Asset managers

© IDS GmbH – Analysis and Reporting Services
20
20
Challenge 1: Classification of investments in different regulatory regimes
Exposure classes (CRR/CRD IV)
1 National governments
2 Regional governments and local authorities
3 Other authorities
4 Multilateral development banks
5 International organizations
6 Institutions
7 Covered bonds issued by banks
8 Companies
9 Retail business
10 Positions secured by real estate
11 Fund shares
12 Holdings
13 Securitizations
14 Other positions
15 Overdue positions
CIC (Solvency II)
1 Government bonds
2 Corporate bonds
3 Equity instrument
4 Investment funds
5 Structured debt instruments
6 Asset-backed securities
7 Cash and deposits
8 Mortgages and loans
9 Real estate
A Futures
B Purchase options
C Selling options
D Swaps
E Forwards
F Credit derivatives
Asset managers need to adhere to
both classifications and comply with the
necessary regulations and
processes
Reporting
C
Asset managers
© IDS GmbH – Analysis and Reporting Services
21
21
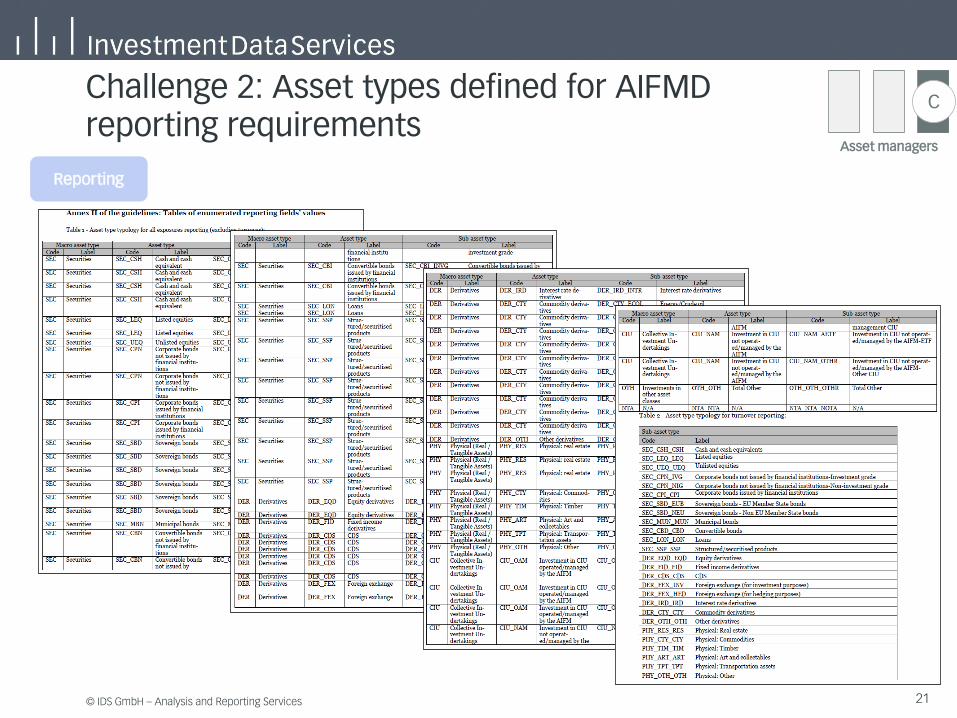
Challenge 2: Asset types defined for AIFMD reporting requirements
Reporting
C
Asset managers
© IDS GmbH – Analysis and Reporting Services
22
22
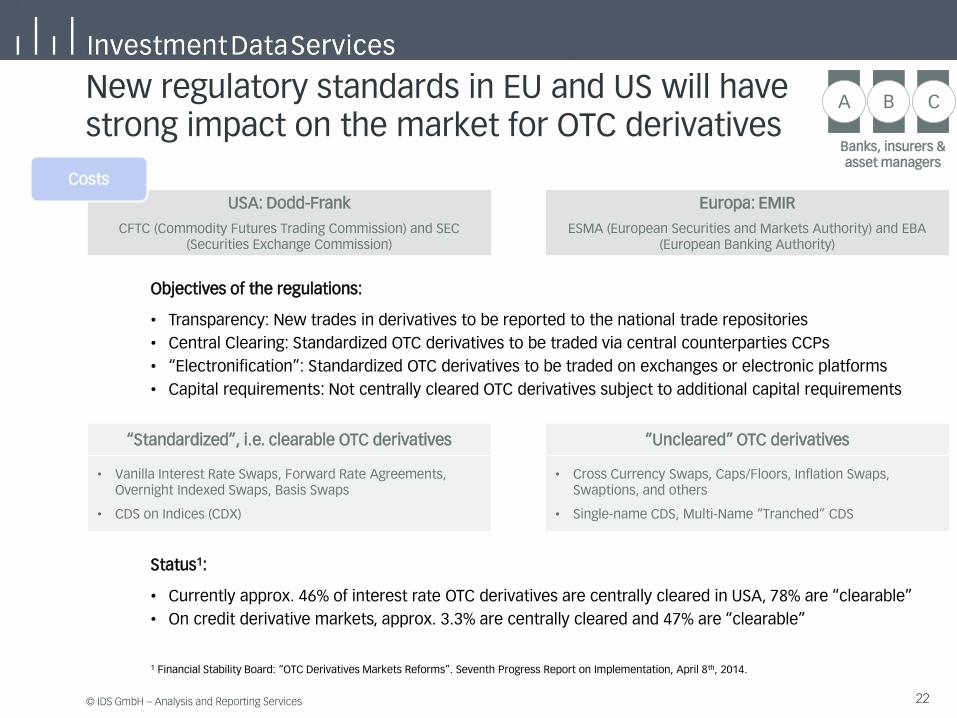
USA: Dodd-Frank
CFTC (Commodity Futures Trading Commission) and SEC (Securities Exchange Commission)
Europa: EMIR
ESMA (European Securities and Markets Authority) and EBA (European Banking Authority)
Objectives of the regulations:
• Transparency: New trades in derivatives to be reported to the national trade repositories
• Central Clearing: Standardized OTC derivatives to be traded via central counterparties CCPs
• “Electronification”: Standardized OTC derivatives to be traded on exchanges or electronic platforms
• Capital requirements: Not centrally cleared OTC derivatives subject to additional capital requirements
“Standardized”, i.e. clearable OTC derivatives
• Vanilla Interest Rate Swaps, Forward Rate Agreements, Overnight Indexed Swaps, Basis Swaps
• CDS on Indices (CDX)
“Uncleared” OTC derivatives
• Cross Currency Swaps, Caps/Floors, Inflation Swaps, Swaptions, and others
• Single-name CDS, Multi-Name “Tranched” CDS
New regulatory standards in EU and US will have strong impact on the market for OTC derivatives
Costs
Status1:
• Currently approx. 46% of interest rate OTC derivatives are centrally cleared in USA, 78% are “clearable”
• On credit derivative markets, approx. 3.3% are centrally cleared and 47% are “clearable”
1 Financial Stability Board: “OTC Derivatives Markets Reforms”. Seventh Progress Report on Implementation, April 8th, 2014.
B A C
Banks, insurers & asset managers

© IDS GmbH – Analysis and Reporting Services
23
23
Solvency capital costs for uncleared OTC derivatives Margins for centrally cleared OTC derivatives
As a result, economic costs will arise for both cleared and uncleared OTC derivatives
Costs
Initial margin
• based on value-at-risk portfolio models, with add-ons for liquidity, concentration, and counterparty risks
• Models differ between different CCPs
Variation margin +
While for initial margins sovereign bonds, MBS, corporate securities, and gold are usually accepted by the CCPs, variation margins can only be settled in cash
Additional costs for funding of collateral Additional costs for regulatory capital
A
Banks
Solvency capital requirement for credit risks in the derivative 1
• Market value + Add-on2
2 According to the mark-to-market method, Art. 274 CRR
Solvency capital requirement for possible down-grades of the counterparty according to the CVA credit valuation adjustment approach3
+
3 According to Art. 110 (4) CRR and the Regulatory Technical Standards of EBA European Banking Authority
1 Capital requirements for all derivatives
© IDS GmbH – Analysis and Reporting Services
24
24
2 Consequences of the crisis and impact of regulatory changes 2
3 Impact on the treatment of risks and performance analysis
1 Looking back – what happened?
4 Conclusions
© IDS GmbH – Analysis and Reporting Services
25
25
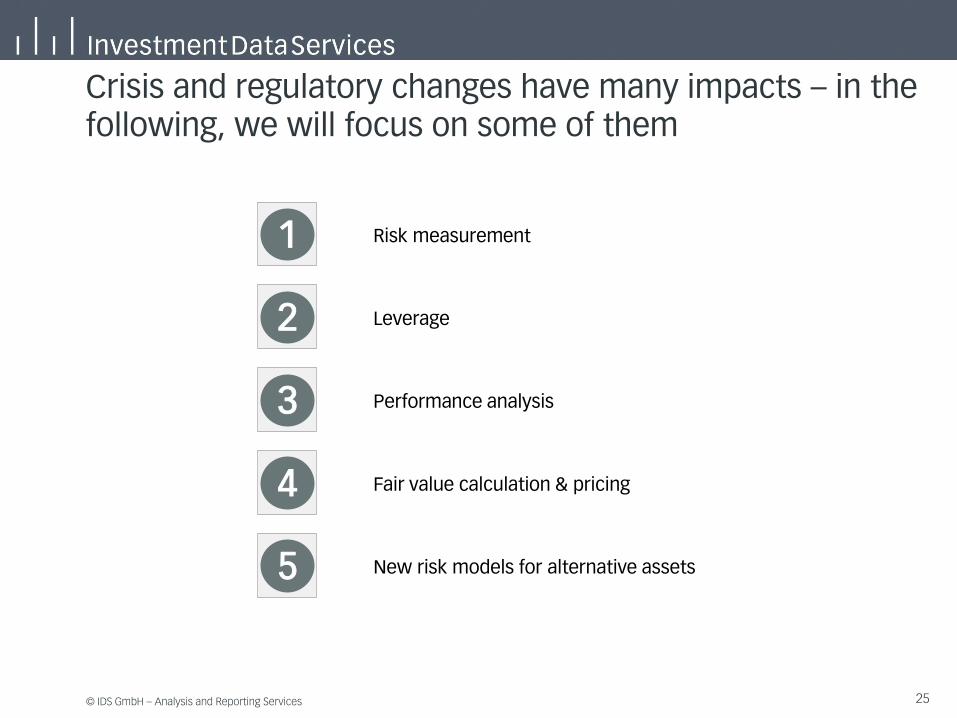
Crisis and regulatory changes have many impacts – in the following, we will focus on some of them
Risk measurement
Performance analysis
Fair value calculation & pricing
Leverage
New risk models for alternative assets
1
2
3
4
5
© IDS GmbH – Analysis and Reporting Services
26
26
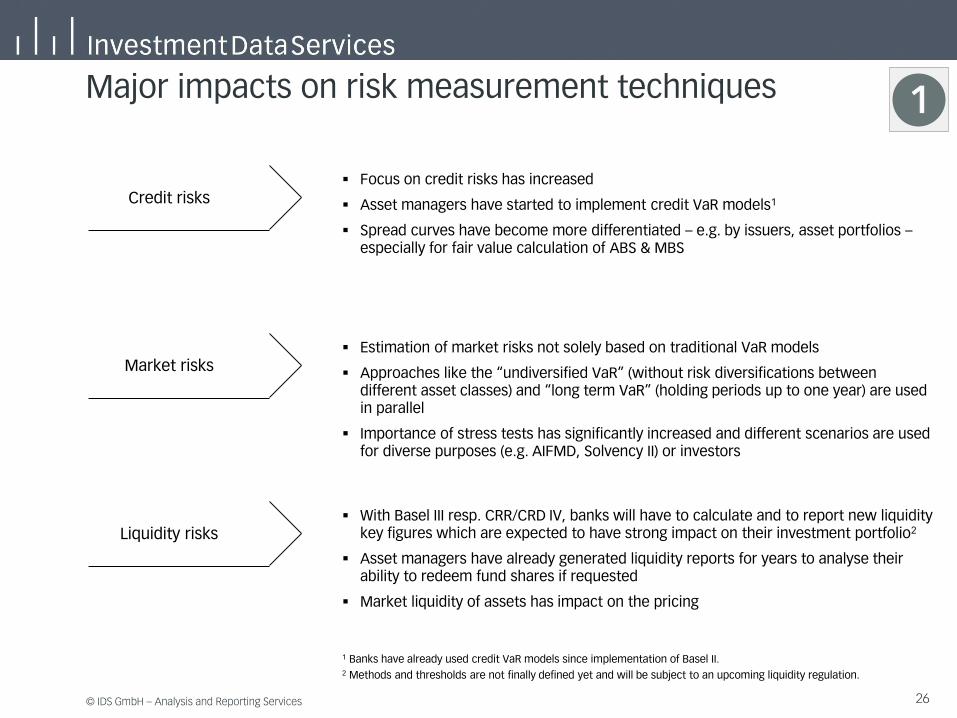
Major impacts on risk measurement techniques 1
Focus on credit risks has increased
Asset managers have started to implement credit VaR models1
Spread curves have become more differentiated – e.g. by issuers, asset portfolios – especially for fair value calculation of ABS & MBS
Credit risks
Market risks
1 Banks have already used credit VaR models since implementation of Basel II.
Estimation of market risks not solely based on traditional VaR models
Approaches like the “undiversified VaR” (without risk diversifications between different asset classes) and “long term VaR” (holding periods up to one year) are used in parallel
Importance of stress tests has significantly increased and different scenarios are used for diverse purposes (e.g. AIFMD, Solvency II) or investors
Liquidity risks With Basel III resp. CRR/CRD IV, banks will have to calculate and to report new liquidity
key figures which are expected to have strong impact on their investment portfolio2
Asset managers have already generated liquidity reports for years to analyse their ability to redeem fund shares if requested
Market liquidity of assets has impact on the pricing
2 Methods and thresholds are not finally defined yet and will be subject to an upcoming liquidity regulation.

© IDS GmbH – Analysis and Reporting Services
27
27
Regulation Relevant for Requirement
UCITS IV (DerivateV) Asset managers Daily VaR; monthly stress tests according to the requirements defined by the asset manager
CRR / CRD IV Banks Monthly stress tests according to the requirements made by specific investors or associations
CRR / CRD IV Banks Long-term VaR Undiversified VaR
Solvency II Insurers Quarterly stress tests according to the requirements defined by the regulatory authorities
AIFMD Asset managers Quarterly stress tests according to the requirements defined by the regulatory authorities
Internal risk management
Asset managers Partly internal methods for guarantee funds or the market risk analysis of the portfolio management
Example: Calculation of market risks for funds in different regulatory regimes
Funds are often sold to investors via share classes. Thus, it becomes necessary to calculate portfolios using different calculation methods !
1

© IDS GmbH – Analysis and Reporting Services
28
28
Different leverage calculation methods according to CESR and AIFMD requirements
CESR (for UCITS funds)
AIFMD (gross approach)
AIFMD (commitment approach)
Cash Not included Not included Market value
Derivatives Add-on2 Market value + Add-on Market value + Add-on
Securities with embedded derivatives
Market value + Add-on Market value + Add-on Market value + Add-on
Netting and hedging Optional Prohibited Obligatory
2 Add-on according to mark-to-market method of CRR = Base value of derivative (nominal amount for nominal underlying position) multiplied with a factor which depends on asset type and maturity of derivative.
not optional, both methods have to be used within AIFMD
Has to be compliant with complex rules of the AIFM directive – e.g. regular checks of sufficient correlations between stocks and indices or recognition of defined
time buckets for hedging
2
With CRR/CRD IV, banks will have to compare the nominal value of positions that carry risks with their capital1
Asset managers already calculate leverage ratios for funds and report them to national supervisory authorities
Different methods are used for different types of funds:
1 Methods and thresholds are not finally defined yet and will be subject to an upcoming liquidity regulation.

© IDS GmbH – Analysis and Reporting Services
29
29
Performance analysis 3
Development of new models in the FI space
Traditional yield curve models („shift-twist-butterfly“) less relevant for current market environment
Instead: focus on spread developments / factors
Credit-Beta relative to swap curves
New asset classes

© IDS GmbH – Analysis and Reporting Services
30
30
Valuation and pricing of financial products has become significantly more complex
4
The set of spread curve factors is more
refined
Market liquidity of assets is reflected by specific liquidity
spread premiums
Yield curves for fair value calculation of risk-free
transactions are questioned
Costs for funding of economic capital and /or collateral have
impact on the pricing

© IDS GmbH – Analysis and Reporting Services
31
31
Example 1: Libor & Euribor have lost their importance for the valuation of almost risk-free transactions
4
Calculation of market values based on SWAP curves, e.g. Euro SWAP curve
SWAP curves have been used for discounting cash flows and the calculation of forward rates
SWAP curves based on LIBOR/EURIBOR rates were considered as almost risk-free
Due to the crisis and the LIBOR/EURIBOR scandals, both rates are no longer seen as risk-free rates
Market participants use overnight rates to valuate risk-free transactions
Different yield curves are used to discount cash flows and to calculate forward rates
Euro Money Market Rates Pre-Crisis Euro Money Market Rates Post-Crisis
Comparison of Euribor rates vs. EONIA swap rates as of 24. March 2006 Comparison of Euribor rates vs. EONIA swap rates as of 24. March 2014
Euribor EONIA Swap Euribor EONIA Swap
Before “Lehman” After “Lehman”
© IDS GmbH – Analysis and Reporting Services
32
32
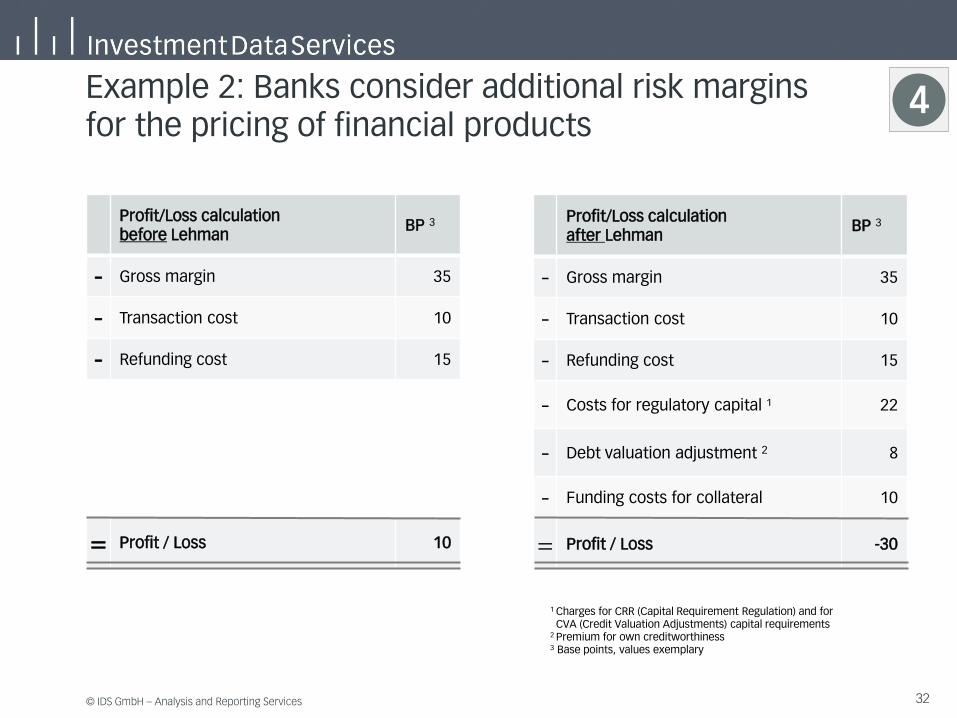
Example 2: Banks consider additional risk margins for the pricing of financial products
Profit/Loss calculation before Lehman
BP 3
- Gross margin 35
- Transaction cost 10
- Refunding cost 15
= Profit / Loss 10
Profit/Loss calculation after Lehman
BP 3
- Gross margin 35
- Transaction cost 10
- Refunding cost 15
- Costs for regulatory capital ¹ 22
- Debt valuation adjustment 2 8
- Funding costs for collateral 10
= Profit / Loss -30
1 Charges for CRR (Capital Requirement Regulation) and for CVA (Credit Valuation Adjustments) capital requirements 2 Premium for own creditworthiness 3 Base points, values exemplary
4
© IDS GmbH – Analysis and Reporting Services
33
33
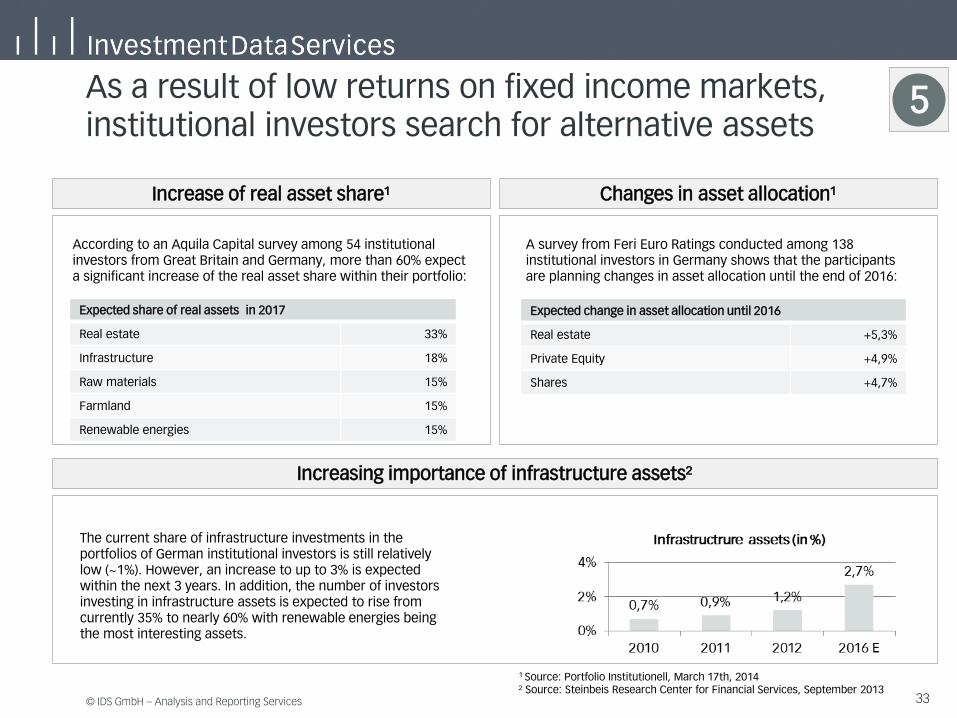
As a result of low returns on fixed income markets, institutional investors search for alternative assets
Expected share of real assets in 2017
Real estate 33%
Infrastructure 18%
Raw materials 15%
Farmland 15%
Renewable energies 15%
Expected change in asset allocation until 2016
Real estate +5,3%
Private Equity +4,9%
Shares +4,7%
Increase of real asset share¹ Changes in asset allocation¹
According to an Aquila Capital survey among 54 institutional investors from Great Britain and Germany, more than 60% expect a significant increase of the real asset share within their portfolio:
A survey from Feri Euro Ratings conducted among 138 institutional investors in Germany shows that the participants are planning changes in asset allocation until the end of 2016:
The current share of infrastructure investments in the portfolios of German institutional investors is still relatively low (~1%). However, an increase to up to 3% is expected within the next 3 years. In addition, the number of investors investing in infrastructure assets is expected to rise from currently 35% to nearly 60% with renewable energies being the most interesting assets.
Increasing importance of infrastructure assets²
1 Source: Portfolio Institutionell, March 17th, 2014 ² Source: Steinbeis Research Center for Financial Services, September 2013
5

© IDS GmbH – Analysis and Reporting Services
34
34
Redefined focus of central banks and sovereign wealth funds
5
Changes in their investment strategy
Look for innovative investments as returns of traditional assets are insufficient
Core / satellite approach
Overlay strategies
Fully transparent

© IDS GmbH – Analysis and Reporting Services
35
35
2 Consequences of the crisis and impact of regulatory changes 2
3 Impact on the treatment of risks and performance analysis
1 Looking back – what happened?
4 Conclusions
© IDS GmbH – Analysis and Reporting Services
36
36
“Basel III costs Germany’s big banking houses 50 bn Euro”
(FAZ.NET, May 24th, 2014)
Regulatory requirements will increase costs and lower the possibility to gain sufficient returns on capital
“I am not sure whether all insurers will survive.”
(Felix Hufeld, BaFin (German federal financial supervisory agency), in ‘Der Tagespiegel’, November 28th, 2013)
Direct costs German banks are spending for the regulation increase from about 3.8 bn EUR (2010-2012) to about 4.8 bn EUR (2013-2015)
(Source: German Bundesbank, 2013)
“EU regulation costs billions - Solvency II costs for UK insurance companies alone augment to 2 bn GBP” (Source: The Economist, May 3rd, 2012)
“An analysis of Accenture shows that the majority of the European insurance companies faces higher costs due to Solvency II”
(Source: Accenture, December 7th, 2010)
© IDS GmbH – Analysis and Reporting Services
37
37
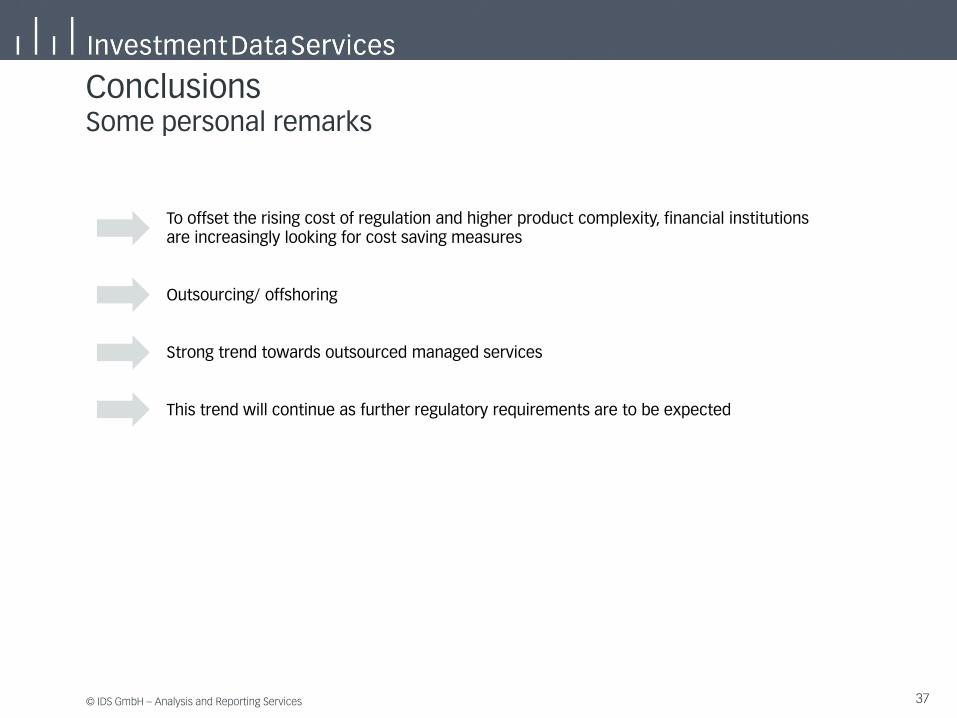
Conclusions Some personal remarks
To offset the rising cost of regulation and higher product complexity, financial institutions are increasingly looking for cost saving measures
Outsourcing/ offshoring
Strong trend towards outsourced managed services
This trend will continue as further regulatory requirements are to be expected
© IDS GmbH – Analysis and Reporting Services
38
38
Contact
Dr. Bernd Fischer
Managing Director
+49 69 2443 1 3118
IDS GmbH – Analysis and Reporting Services Koeniginstrasse 28 Bockenheimer Landstrasse 42–44
80802 Munich 60323 Frankfurt/Main
www.InvestmentDataServices.com