Embed Size (px)
Citation preview
What are the health, social and economic benefits of providing public housing and support to formerly homeless people?
authored by
Lisa Wood, Paul Flatau, Kaylene Zaretzky, Sarah Foster, Shannen Vallesi and Darja Miscenko
for the
Australian Housing and Urban Research Institute
at The University of Western Australia
July 2016
AHURI Final Report No. 265
ISSN: 1834-7223
ISBN: 978-1-925334-27-2
i
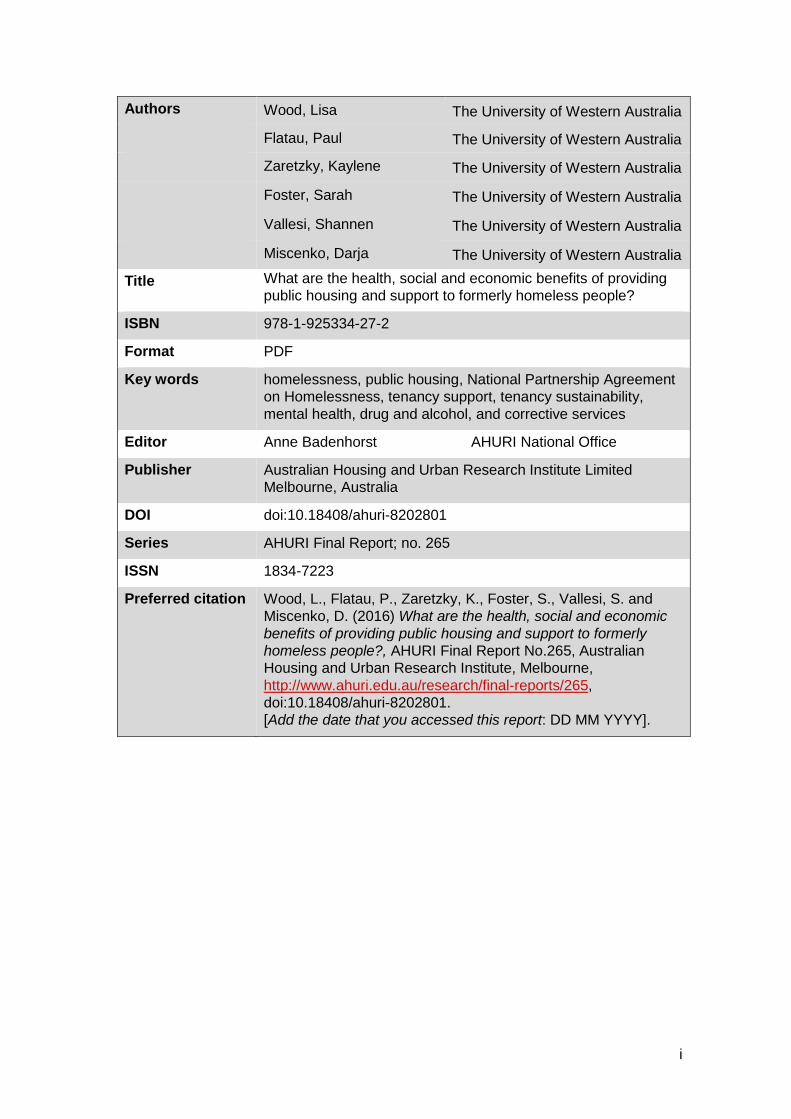
Authors Wood, Lisa The University of Western Australia
Flatau, Paul The University of Western Australia
Zaretzky, Kaylene The University of Western Australia
Foster, Sarah The University of Western Australia
Vallesi, Shannen The University of Western Australia
Miscenko, Darja The University of Western Australia
Title What are the health, social and economic benefits of providing
public housing and support to formerly homeless people?
ISBN 978-1-925334-27-2
Format PDF
Key words homelessness, public housing, National Partnership Agreement
on Homelessness, tenancy support, tenancy sustainability,
mental health, drug and alcohol, and corrective services
Editor Anne Badenhorst AHURI National Office
Publisher Australian Housing and Urban Research Institute Limited
Melbourne, Australia
DOI doi:10.18408/ahuri-8202801
Series AHURI Final Report; no. 265
ISSN 1834-7223
Preferred citation Wood, L., Flatau, P., Zaretzky, K., Foster, S., Vallesi, S. and
Miscenko, D. (2016) What are the health, social and economic
benefits of providing public housing and support to formerly
homeless people?, AHURI Final Report No.265, Australian
Housing and Urban Research Institute, Melbourne,
http://www.ahuri.edu.au/research/final-reports/265,
doi:10.18408/ahuri-8202801.
[Add the date that you accessed this report: DD MM YYYY].
ii
AHURI
AHURI is a national independent research network with an expert not-for-profit
research management company, AHURI Limited, at its centre.
AHURI has a public good mission to deliver high quality research that influences
policy development to improve the housing and urban environments of all Australians.
Through active engagement, AHURI’s work informs the policies and practices of
governments and the housing and urban development industries, and stimulates
debate in the broader Australian community.
AHURI undertakes evidence-based policy development on a range of issues,
including: housing and labour markets, urban growth and renewal, planning and
infrastructure development, housing supply and affordability, homelessness,
economic productivity, and social cohesion and wellbeing.
ACKNOWLEDGEMENTS
This material was produced with funding from the Australian Government and state
and territory governments. AHURI Limited gratefully acknowledges the financial and
other support it has received from these governments, without which this work would
not have been possible.
AHURI Limited also gratefully acknowledges the contributions, both financial and in-
kind, of its university research partners who have helped make the completion of this
material possible.
We would like to extend special thanks to the Data Linkage Branch of the Western
Australian Department of Health and the Western Australian Housing Authority for
their support and assistance with respect to the linkage of health and housing data
and the implementation of the public housing Tenant Survey. We also wish to thank
Jessica Smith, Georgina Carson and Daniel Sutton for their excellent research
assistance on the study.
DISCLAIMER
The opinions in this report reflect the views of the authors and do not necessarily
reflect those of AHURI Limited, its Board or its funding organisations. No responsibility
is accepted by AHURI Limited, its Board or funders for the accuracy or omission of
any statement, opinion, advice or information in this publication.
AHURI JOURNAL
AHURI Final Report journal series is a refereed series presenting the results of
original research to a diverse readership of policy-makers, researchers and
practitioners.
PEER REVIEW STATEMENT
An objective assessment of reports published in the AHURI journal series by carefully
selected experts in the field ensures that material published is of the highest quality.
The AHURI journal series employs a double-blind peer review of the full report, where
anonymity is strictly observed between authors and referees.

iii
COPYRIGHT
© Australian Housing and Urban Research Institute Limited 2016
This work is licensed under a Creative Commons Attribution-NonCommercial 4.0
International License, see http://creativecommons.org/licenses/by-nc/4.0/.
iv
CONTENTS
LIST OF TABLES .......................................................................................................VII
LIST OF FIGURES ....................................................................................................VIII
LIST OF BOXES ......................................................................................................... IX
ACRONYMS ................................................................................................................ X
EXECUTIVE SUMMARY .............................................................................................. 1
1 INTRODUCTION ................................................................................................. 9
2 BACKGROUND ................................................................................................. 12
2.1 Relationship between homelessness and health ................................................ 12
2.2 Can the provision of housing and/or support improve health and housing outcomes? ......................................................................................................... 13
2.3 Can reducing homelessness contribute to cost savings to government via reduced health service use? .............................................................................. 14
2.4 Evidence gaps addressed by this study ............................................................. 15
2.5 NPAH as an Australian Government initiative to reduce homelessness ............. 16
2.5.1 NPAH and homelessness in Western Australia ......................................... 17
2.5.2 Priority housing access in Western Australia ............................................. 17
2.6 Challenges in assessing the impact of NPAH programs ..................................... 19
2.7 Summary ........................................................................................................... 19
3 METHODS ......................................................................................................... 21
3.1 Study design ...................................................................................................... 21
3.2 Measures ........................................................................................................... 22
3.3 Sources of data .................................................................................................. 22
3.3.1 Department of Housing data ..................................................................... 22
3.3.2 Department of Health data ........................................................................ 22
3.4 Survey administration ......................................................................................... 24
3.5 Data linkage ....................................................................................................... 25
3.5.1 Linkage of Department of Health and Department of Housing data ........... 25
3.5.2 Linkage of Tenant Survey data to linked administrative data ..................... 25
3.6 Data analysis ..................................................................................................... 26
3.6.1 Data analysis (housing and health data) ................................................... 26
3.6.2 Economic impact; health costs and the cost of providing NPAH support ... 27
3.7 Ethics ................................................................................................................. 28
4 RESULTS: LINKED ADMINISTRATIVE DATA ................................................. 30
4.1 The linked administrative sample ....................................................................... 30
4.2 NPAH program participation ............................................................................... 31
4.3 Priority housing (homelessness) participation .................................................... 32
4.4 Proportion of people using health services before and after entering public housing tenancy ................................................................................................. 32
4.4.1 Proportion of people presenting to emergency .......................................... 33
4.4.2 Proportion of people admitted to hospital .................................................. 33
4.4.3 Proportion of people using hospital in the home ........................................ 34
v
4.4.4 Proportion of people accessing the ICU .................................................... 34
4.4.5 Proportion of people accessing psychiatric care ....................................... 34
4.4.6 Proportion of people accessing mental health services ............................. 34
4.4.7 Proportion of people with prescriptions for drug treatment ........................ 34
4.4.8 Changes in the proportion of people using health services in three years prior to public tenancy compared with the year after entry ........................ 34
4.5 Frequency and duration of health service use .................................................... 35
4.5.1 Number of emergency presentations annually .......................................... 36
4.5.2 Length of stay in hospital .......................................................................... 38
4.5.3 Hospital in the home ................................................................................. 39
4.5.4 ICU days ................................................................................................... 40
4.5.5 Psychiatric care ........................................................................................ 40
4.5.6 Mental Health Services ............................................................................. 41
4.5.7 Prescriptions for opioid dependency treatment ......................................... 42
4.6 Frequency and duration of health service use by gender and Aboriginality ........ 42
4.6.1 Differences in health service use by gender .............................................. 42
4.6.2 Differences in health service use by Aboriginality...................................... 43
4.7 Economic impact of change in health service use .............................................. 43
4.8 Tenancy duration and its relationship to health service use ............................... 47
4.8.1 Tenancy sustainment rates ....................................................................... 47
4.8.2 Patterns of tenancy duration by program type ........................................... 49
4.8.3 Tenancy duration and proportion of people accessing services ................ 50
4.8.4 Tenancy duration and frequency/duration of health service use ................ 51
4.9 Summary ........................................................................................................... 53
5 RESULTS—TENANT SURVEY ......................................................................... 55
5.1 Profile of respondents ........................................................................................ 55
5.2 Prior experiences of homelessness .................................................................... 57
5.3 Support received by tenants ............................................................................... 61
5.3.1 Tenant support prior to entering their current public housing tenancy ....... 61
5.3.2 Tenant issues and support received since entering their current public housing tenancy ........................................................................................ 63
5.3.3 Social support received ............................................................................. 64
5.4 Confidence in keeping tenancy .......................................................................... 64
5.5 Tobacco, alcohol and drug use .......................................................................... 66
5.5.1 Tobacco use ............................................................................................. 66
5.5.2 Alcohol use ............................................................................................... 67
5.5.3 Drug use ................................................................................................... 68
5.6 Mental health ..................................................................................................... 70
5.7 General Health ................................................................................................... 72
5.8 Summary ........................................................................................................... 74
6 DISCUSSION..................................................................................................... 76
6.1 Key findings and policy implications ................................................................... 76
vi
6.2 Limitations and future research .......................................................................... 79
REFERENCES ........................................................................................................... 81
APPENDIX ................................................................................................................. 88
Appendix 1: Data summary ......................................................................................... 88
Appendix 2: Per cent (%) using health service by type of housing support program (three years before/one year after) ..................................................................... 90
Appendix 3: Tenant Survey results .............................................................................. 91
vii
LIST OF TABLES
Table 1: NPAH programs identified in Department of Housing database ................... 18
Table 2: Health service use data ............................................................................... 23
Table 3: Sample characteristics ................................................................................ 30
Table 4: Per cent (%) using health service by NPAH program and priority housing
(homelessness) (one year before/one year after) ............................................... 33
Table 5: Frequency and duration of health services by NPAH program and priority
housing (homelessness) (conditional means and standard deviations) .............. 37
Table 6: Frequency and duration of health services before and after entering public
housing tenancy by gender and Aboriginality (conditional means and standard
deviations) ......................................................................................................... 42
Table 7: Change in health cost associated with change in health service use—
selected health services (2012–13) .................................................................... 45
Table 8: NPAH program cost/person (2009–12) ........................................................ 47
Table 9: Reasons for vacation of public housing tenancy .......................................... 49
Table 10: Mean survival time (months) by NPAH program ........................................ 50
Table 11: Percent (%) using health service by length of tenancy (one year before/one
year after) .......................................................................................................... 51
Table 12: Tenancy duration (months) by service ....................................................... 52
Table 13: Study population characteristics—Tenant Survey ...................................... 55
Table 14: Lifetime experiences of homelessness (%) ................................................ 58
Table 15: Living situation immediately prior to current public housing tenancy (%) ... 60
Table 16: Support received before entering current public housing tenancy (%) ....... 61
Table 17: Tenants issues and support received since entering current public housing
tenancy (%) ........................................................................................................ 63
Table 18: Support received from social networks (%) ................................................ 64
Table 19: Tenant confidence in keeping current public housing (%) .......................... 65
Table 20: Tenant smoking status .............................................................................. 67
Table 21: Tenant alcohol consumption (%) ............................................................... 69
Table 22: Tenant most recent drug use (%) .............................................................. 70
Table 23: Psychological distress (%) ......................................................................... 71
Table 24: Rating of current health (%) ....................................................................... 73
Table 25: Change in health evaluation compared to one year ago (%)...................... 74
viii
LIST OF FIGURES
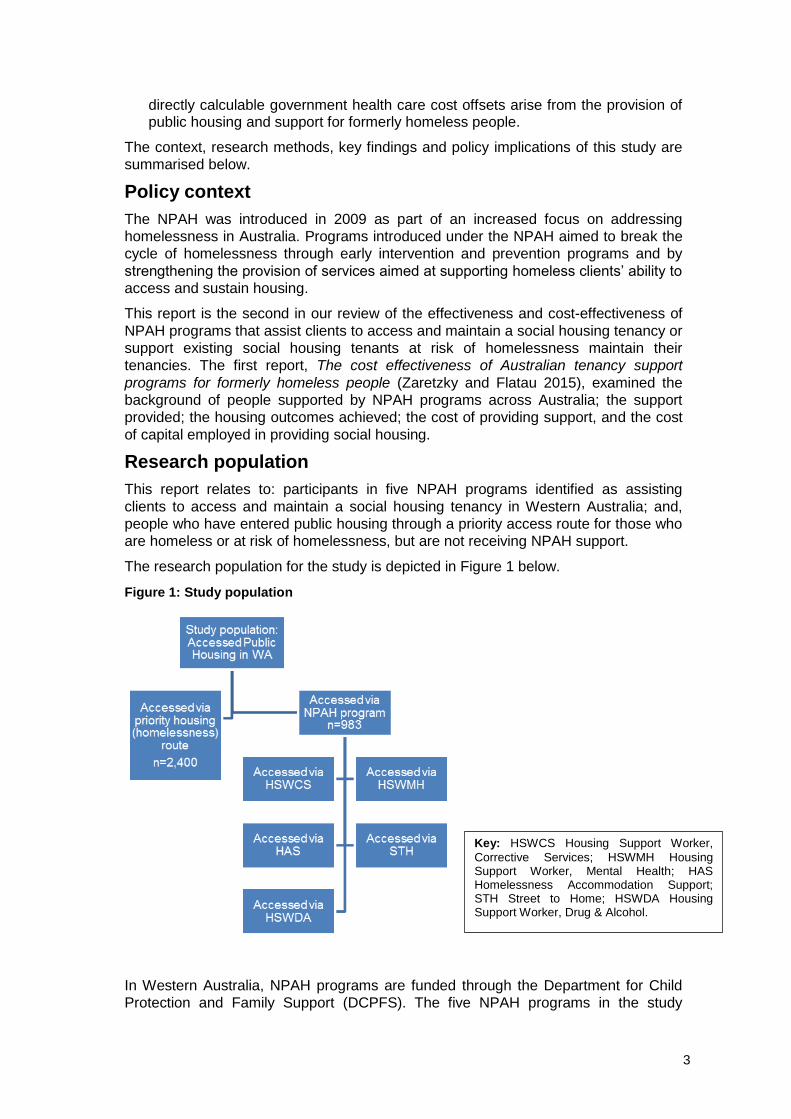
Figure 1: Study population .......................................................................................... 3
Figure 2: Overall study design ................................................................................... 21
Figure 3: Summary of the response rates and trajectory for the surveys ................... 24
Figure 4: Average annual presentations to emergency department by NPAH program
type and priority housing (homelessness) (conditional means) .......................... 36
Figure 5: Average number of days spent in hospital in one year by NPAH program
and priority housing (homelessness) (conditional means) .................................. 39
Figure 6: Average number of days spent in intensive care by NPAH program and
priority housing (homelessness) (conditional means) ......................................... 40
Figure 7: Average number of days spent in psychiatric care by NPAH program and
priority housing (homelessness) (conditional means) ......................................... 41
Figure 8: Average length of contact (hours) spent with mental health services by
NPAH program and priority housing (homelessness) (conditional means) ......... 41
Figure 9: Percentage of tenancies discontinued by time ........................................... 48
Figure 10: Survival analysis by NPAH program ......................................................... 50
Figure 11: Living situation immediately before entering public housing (%) ............... 59
Figure 12: Tenant issue and support received since entering current public housing
tenancy (%) ........................................................................................................ 62
Figure 13: Confidence to keep current public housing tenancy (%) ........................... 65
Figure 14: Smoking status (%) .................................................................................. 66
Figure 15: Days per week drinking alcohol (%) ......................................................... 68
Figure 16: Most recent drug use (%) ......................................................................... 70
Figure 17: Level of distress by priority housing (homelessness) and NPAH (%) ........ 71
Figure 18: Self-report health improvement by priority housing (homelessness) and
NPAH (%) .......................................................................................................... 74

ix
LIST OF BOXES
Box 1: The report points to four key findings. ............................................................ 76
x
ACRONYMS
AHURI Australian Housing and Urban Research Institute Limited
AIHW Australian Institute of Health and Welfare
COAG Council of Australian Governments
CPOP Community Program for Opioid Pharmacotherapy
DCP Department for Child Protection
DCPFS Department for Child Protection and Family Support
ED Emergency Department
EDDC Emergency Department Data Collection
FSP Full-Service Partnerships
HAS Homelessness Accommodation Support
HASI Housing and Accommodation Support Initiative
HILDA Household, Income and Labour Dynamics in Australia
HITH Hospital in the Home
HMDS Hospital Morbidity Data System
HSWCS Housing Support Worker, Corrective Services
HSWDA Housing Support Worker, Drug & Alcohol
HSWMH Housing Support Worker, Mental Health
ICU Intensive Care Unit
MHIS Mental Health Information System (WA)
NAHA National Affordable Housing Agreement
NPAH National Partnership Agreement on Homelessness
PH Priority housing (homelessness) tenants
SAAP Supported Accommodation Assistance Program
SHA State Housing Authority
SHS Specialist Homelessness Services
SHSC Specialist Homelessness Services Collection
SLK Statistical Linkage Key
SPSS Statistical Package for the Social Sciences
STH Street to Home
WA Western Australia
UK United Kingdom
USA United States of America
UWA University of Western Australia
1
EXECUTIVE SUMMARY
Key points
The National Partnership Agreement on Homelessness (NPAH) was introduced in 2009 as a joint Commonwealth/state and territory initiative designed to address homelessness in Australia. Our study examines five NPAH programs in Western Australia which support homeless people and those at risk of homelessness access and then sustain public housing allocations. In Australia, homeless people and those at risk of homelessness may receive crisis accommodation and other forms of support and may be assisted to get on to public housing waiting lists, but they are generally not supported to access guaranteed public housing allocations and assisted in various ways to sustain those tenancies over time.
Homelessness covers those people sleeping rough (primary homelessness), those in shelter, but with no tenure such as those in refuges and supported accommodation managed by homelessness services (secondary homelessness), or those in temporary or insecure accommodation, such as boarding houses and caravan parks (tertiary homelessness).
The five Western Australian NPAH programs examined in this study are Housing Support Worker programs for: (1–3) people at risk of homelessness exiting correctional institutions, mental health units, and drug and alcohol treatment services; (4) the Street to Home program for people who are sleeping rough; and, (5) the Homelessness Accommodation Support program for people exiting short or medium-term homelessness accommodation services. The report also includes an examination of public housing tenants who were not part of an NPAH program, but over the same period of time, entered into a public housing tenancy through a priority access pathway for those experiencing or at risk of homelessness (hereafter referred to as priority housing (homelessness)).
The extant literature indicates strong evidence of a compounding negative relationship between homelessness and mental and physical health and of high health care costs associated with homelessness. A growing body of evidence, based on self-report data in the Australian case, suggests that the provision of public housing and housing support may be a cost-effective means of improving health outcomes and reducing health system costs.
This report addresses the question of whether health service use and health service costs fall as a consequence of supported entry to public housing for formerly homeless people and those at risk of homelessness. It also examines the health and social outcomes of formerly homeless and at-risk of homelessness tenants.
An important benefit of the present study compared with previous Australian studies is the use of linked housing and health administrative data. The large sample size increases confidence in the findings presented because a larger number of clients and experiences are able to be investigated and the rigour of statistical analysis is improved.
The study links Western Australian person-level health service system records with person-level public housing tenancy records and tracks the health service use patterns of 983 NPAH and 2,400 priority housing (homelessness) tenants before entry into housing and following entry into housing. On the basis of the linked health and housing data in Western Australia, our study finds that the provision of public housing for NPAH program participants as well as those entering public housing through priority housing (homelessness) was associated with reduced
2
health service use (both in the proportion using services as well as frequency/duration of use) in the year following entry into public housing as compared with the year prior to entry.
In particular, significant reductions were evident, pre- and post-entry into public housing, in the proportion of NPAH program and priority housing (homelessness) tenants accessing an Emergency Department (ED), an Intensive Care Unit (ICU), or psychiatric service or mental health provider, staying overnight in a hospital, or having a prescription for opioid dependence. There was no significant change for hospital in the home (HITH) services. Reductions in the frequency of visits to an ED or ICU, the duration of time spent in hospital, in psychiatric care or with a mental health service provider and the mean number of prescriptions for opioid dependence were also observed, with only an increase, post-entry into public housing in average days per person/per year utilising HITH services.
This study also provides an estimate of the potential economic impact of the change in health service use associated with provision of public housing and NPAH program support for homeless people and those at risk of homelessness. The overall decrease in frequency and duration of health service use, comparing the year prior to and the year following entry into a public housing tenancy, results in a combined potential health system cost saving in Western Australia of $16.4 million per year or $4,846 per person per year. If priority homeless clients are excluded; the change per person with NPAH support is nearly triple this at $13,273 per person per year. The large cost offset is primarily related to reduced health service use among clients of the NPAH Mental Health program, where potential health savings amount to $84,135 per person per year. Across all NPAH programs, the change in stays in hospital ($3,114 per person per year) and in psychiatric care ($1,558 per person per year) account for the vast majority of potential health cost savings.
The average cost of providing support under the NPAH programs examined is estimated as $6,462 per person per year (2009–12). This is less than half the potential health cost offsets associated with the NPAH programs ($13,273 per person per year (2012–13)). In particular, the large estimated health cost offset associated with the NPAH Mental Health program ($84,135 per person per year) suggests a large potential positive impact on government budgets is associated with this program. Cost savings of the kind identified in the present study are presently not identified in government budgets. The estimated cost savings simply accrue to the health service system and result in more needs being met in the health care system than would otherwise be the case. In short, more resources are freed up in the health system to meet health needs because of a successful housing and homelessness program.
Tenancy sustainability rates were found to be relatively high for those entering public housing through the NPAH and priority housing (homelessness) routes. Evidence from our Tenancy Survey conducted among 277 tenants entering into public housing indicated that they were highly confident they could maintain their current public housing tenancy. The Tenancy Survey findings also suggested that prior to entering their public tenancy, many individuals were receiving support for diverse issues, but that support levels fell for the priority housing (homelessness) group on entry, while in the case of the NPAH program entrants, support was maintained in line with program requirements.
Overall, the study shows substantial reductions in health service use (both in terms of the number of people using services, and the frequency and duration of service use) from the focal NPAH programs in Western Australia. Significant and
3
directly calculable government health care cost offsets arise from the provision of public housing and support for formerly homeless people.
The context, research methods, key findings and policy implications of this study are
summarised below.
Policy context
The NPAH was introduced in 2009 as part of an increased focus on addressing
homelessness in Australia. Programs introduced under the NPAH aimed to break the
cycle of homelessness through early intervention and prevention programs and by
strengthening the provision of services aimed at supporting homeless clients’ ability to
access and sustain housing.
This report is the second in our review of the effectiveness and cost-effectiveness of
NPAH programs that assist clients to access and maintain a social housing tenancy or
support existing social housing tenants at risk of homelessness maintain their
tenancies. The first report, The cost effectiveness of Australian tenancy support
programs for formerly homeless people (Zaretzky and Flatau 2015), examined the
background of people supported by NPAH programs across Australia; the support
provided; the housing outcomes achieved; the cost of providing support, and the cost
of capital employed in providing social housing.
Research population
This report relates to: participants in five NPAH programs identified as assisting
clients to access and maintain a social housing tenancy in Western Australia; and,
people who have entered public housing through a priority access route for those who
are homeless or at risk of homelessness, but are not receiving NPAH support.
The research population for the study is depicted in Figure 1 below.
Figure 1: Study population
In Western Australia, NPAH programs are funded through the Department for Child
Protection and Family Support (DCPFS). The five NPAH programs in the study
Key: HSWCS Housing Support Worker,
Corrective Services; HSWMH Housing Support Worker, Mental Health; HAS Homelessness Accommodation Support; STH Street to Home; HSWDA Housing Support Worker, Drug & Alcohol.
4
include three housing support worker programs for people exiting correctional
institutions (HSWCS), people existing mental health units (HSWMH), people referred
through drug and alcohol treatment services (HSWDA); the Street to Home program
(STH) for people who are sleeping rough, and the Homelessness Accommodation
Support program (HAS) for people exiting short or medium term homelessness
accommodation services.
Eligibility for priority access to public housing in WA includes primary homelessness
covering those sleeping rough; secondary homelessness, where shelter is provided
but no formal tenure position is available and includes staying in accommodation
provided by homelessness services or staying temporarily with friends/family; and
tertiary homelessness which is having an insecure accommodation arrangement (e.g.,
boarding house or caravan park).
Research methods
This study comprised three elements.
First, a desk top review of the policy context of NPAH programs in WA and the
research literature surrounding the relationship between housing, homelessness and
health, and, in particular, whether housing provision can lead to improving health
outcomes and cost savings from reduced health service use.
Second, the linkage of Western Australian health service utilisation administrative
data (Department of Health WA) with public housing administrative data (Department
of Housing/The Housing Authority WA) for tenants supported by NPAH programs
(n=983) and priority housing (homelessness) tenants (n=2,400) to examine the impact
of public housing on health service utilisation and health system costs pre- and post-
housing tenancy. Housing Authority data included the type of public housing entry
(NPAH program or priority housing (homelessness)), duration of tenancy, and
demographics. The health service utilisation data included: hospital admissions and
length of stay, emergency department presentations, HITH, mental health and
psychiatric services, and prescribed drugs for opioid dependence.
The WA health and housing linked data analysis compares health service use one
year prior to and one year after public housing tenancy entry. We also examined the
three-year pattern of health care use prior to tenancy entry and compared health
service use outcomes in this three-year period versus the one-year period. The
analysis looked at changes in:
1. The proportion (percentage) of people using health services, comparing use in the year prior to entering a public housing tenancy with use one year following tenancy commencement.
2. The frequency or duration of use (e.g. the number of ED presentations or length of hospital stay).
The aim of the second component of the study was to examine the impact of the
provision of public housing with support on health service use and to estimate costs
and potential cost savings to government due to changes in health service use
following entry to a public housing tenancy. The relationship between NPAH program
participation, public housing tenancies (and sustaining those tenancies) and health
service use in Western Australia is examined through the linking of health system and
public housing administrative data. Western Australia’s internationally renowned
health data linkage system enables a unique exploration of these relationships.
Publically available data on health care unit prices/costs were applied to the linked
administrative data to compute the potential cost savings accruing to the public purse.
5
Third, a survey of current Western Australian Department of Housing tenants in NPAH
programs or housed via priority housing (homelessness) (n=277): this survey
contained questions on demographics, homelessness history, support received pre-
and post-housing tenancy, their confidence in maintaining their tenancy and self-
reported health status and health service use. The Tenant Survey was voluntary and
limited to current tenants only, and is not necessarily representative of the linked data
population.
Key findings
The provision of public housing significantly reduces health service use
In the year following entry to a public housing tenancy, the proportion of previously
homeless individuals accessing health services fell significantly as compared with the
year prior to entry among participants who entered with the assistance of an NPAH
program and those entering via a priority housing (homelessness) pathway.
Specifically, there were significant reductions in the proportion of people presenting to
emergency departments, staying overnight in hospital, presenting to an ICU and
psychiatric care, having contact with mental health services and with prescriptions for
opioid dependence for both entry pathways. HITH was the only health service with no
significant changes in the proportion of people accessing the service.
Further analysis examined changes in frequency or duration of health service use
within the subsamples of participants from each program who had accessed health
services either before or after entering their public housing tenancy. For both entry
pathways, there was an overall reduction (comparing the 12 months prior to entry with
the 12 months following entry) in the average length in stay in a hospital, in an ICU
and in psychiatric care, and in the average number of prescriptions per person/year.
There was also an overall reduction in the average number of hours spent per
person/year with a mental health service for NPAH participants and an overall
reduction in the average number of visits to an ED for priority housing (homelessness)
participants. There was an overall increase in average days per person/year spent in
HITH for both groups. This may reflect an efficient substitution into lower cost health
care options from high-cost health options as formerly homeless people now have a
home from which this service could work.
These results are generally in line with findings from our previous AHURI and other
studies using self-report data, but carry far greater weight due to the use of linked
longitudinal administrative data, the large sample size, and multiple health service
measures.
Reduction in health service use greatest for tenancies sustained between one and four years
The analysis of health service use was undertaken for all those in the research
population and compared health service use in the year prior to entry and the year
following entry. We reanalysed the data to examine the possible role played by the
duration of public housing tenancies post entry as a determinant of health care service
costs. Although all in our sample had entered a public housing tenancy at least a year
earlier than the close of our data window, the time since entering a tenancy differed
between tenants. Our analysis is, therefore, of a preliminary nature as those entering
public housing later in the data window simply had not had sufficient time, at the time
of the study, to build up a longer tenancy period.
In examining those tenancies sustained beyond a year with those that were not
sustained to the year point, tenancies sustained for over one year were found to be
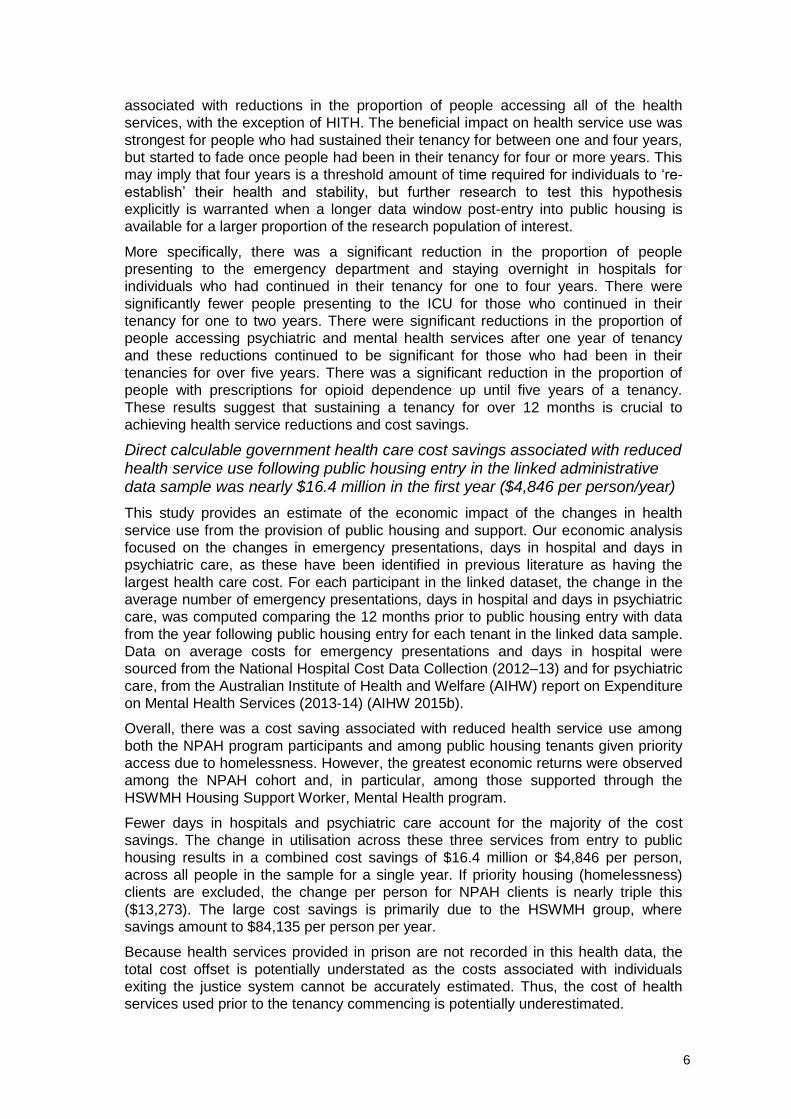
6
associated with reductions in the proportion of people accessing all of the health
services, with the exception of HITH. The beneficial impact on health service use was
strongest for people who had sustained their tenancy for between one and four years,
but started to fade once people had been in their tenancy for four or more years. This
may imply that four years is a threshold amount of time required for individuals to ‘re-
establish’ their health and stability, but further research to test this hypothesis
explicitly is warranted when a longer data window post-entry into public housing is
available for a larger proportion of the research population of interest.
More specifically, there was a significant reduction in the proportion of people
presenting to the emergency department and staying overnight in hospitals for
individuals who had continued in their tenancy for one to four years. There were
significantly fewer people presenting to the ICU for those who continued in their
tenancy for one to two years. There were significant reductions in the proportion of
people accessing psychiatric and mental health services after one year of tenancy
and these reductions continued to be significant for those who had been in their
tenancies for over five years. There was a significant reduction in the proportion of
people with prescriptions for opioid dependence up until five years of a tenancy.
These results suggest that sustaining a tenancy for over 12 months is crucial to
achieving health service reductions and cost savings.
Direct calculable government health care cost savings associated with reduced health service use following public housing entry in the linked administrative data sample was nearly $16.4 million in the first year ($4,846 per person/year)
This study provides an estimate of the economic impact of the changes in health
service use from the provision of public housing and support. Our economic analysis
focused on the changes in emergency presentations, days in hospital and days in
psychiatric care, as these have been identified in previous literature as having the
largest health care cost. For each participant in the linked dataset, the change in the
average number of emergency presentations, days in hospital and days in psychiatric
care, was computed comparing the 12 months prior to public housing entry with data
from the year following public housing entry for each tenant in the linked data sample.
Data on average costs for emergency presentations and days in hospital were
sourced from the National Hospital Cost Data Collection (2012–13) and for psychiatric
care, from the Australian Institute of Health and Welfare (AIHW) report on Expenditure
on Mental Health Services (2013-14) (AIHW 2015b).
Overall, there was a cost saving associated with reduced health service use among
both the NPAH program participants and among public housing tenants given priority
access due to homelessness. However, the greatest economic returns were observed
among the NPAH cohort and, in particular, among those supported through the
HSWMH Housing Support Worker, Mental Health program.
Fewer days in hospitals and psychiatric care account for the majority of the cost
savings. The change in utilisation across these three services from entry to public
housing results in a combined cost savings of $16.4 million or $4,846 per person,
across all people in the sample for a single year. If priority housing (homelessness)
clients are excluded, the change per person for NPAH clients is nearly triple this
($13,273). The large cost savings is primarily due to the HSWMH group, where
savings amount to $84,135 per person per year.
Because health services provided in prison are not recorded in this health data, the
total cost offset is potentially understated as the costs associated with individuals
exiting the justice system cannot be accurately estimated. Thus, the cost of health
services used prior to the tenancy commencing is potentially underestimated.
7
Of course, cost savings to government budgets revealed by the present research, but
not identified by policy-makers, do not result in actual reductions in budget allocations
at the time the savings occur. However, the decrease in demand for services from this
population group potentially allows for otherwise unmet needs to be met within the
existing budget allocation. They also provide the evidence base for more efficient
resource allocation decisions in the future.
Prior to entering their public tenancy, many individuals were receiving support for diverse issues
The Tenant Survey conducted as part of the research asked participants to report
issues they faced before and after entering their tenancy, and whether they received
support for them. Unsurprisingly, the most common type of support prior to entering
the tenancy was support to get a public housing tenancy (50.9%). Other common
supports received were for mental health needs (31.4%), and material needs (29.2%).
After entering public housing, 29.2 per cent reported issues with mental health needs
and 28.2 per cent reported issues with paying rent/bills on time. The majority of
respondents did receive support for their needs; for example, 23.1 per cent reported
receiving support for mental health needs and 18.8 per cent reported receiving
support to pay rent/bills on time.
Since moving into their current tenancy, fewer individuals reported that they were
receiving support for issues except for physical health and finding/keeping a job. For
every kind of support received after entering public housing, except finding/keeping a
job, mental health and drug/alcohol issues, individuals receiving support were more
likely to be priority housing (homelessness) tenants rather than NPAH tenants. This
finding may reflect a number of things including that, in general, NPAH support
workers had been largely successful in addressing the needs of tenants; that where
support was highest for NPAH tenants, it was precisely in a specific target area,
namely, mental health and drug/alcohol issues; and, that priority housing
(homelessness) tenants’ needs remained very high following entry. Despite the fact
that priority housing (homelessness) tenants were not receiving support through an
NPAH program, the findings suggest they clearly were receiving support from other
areas.
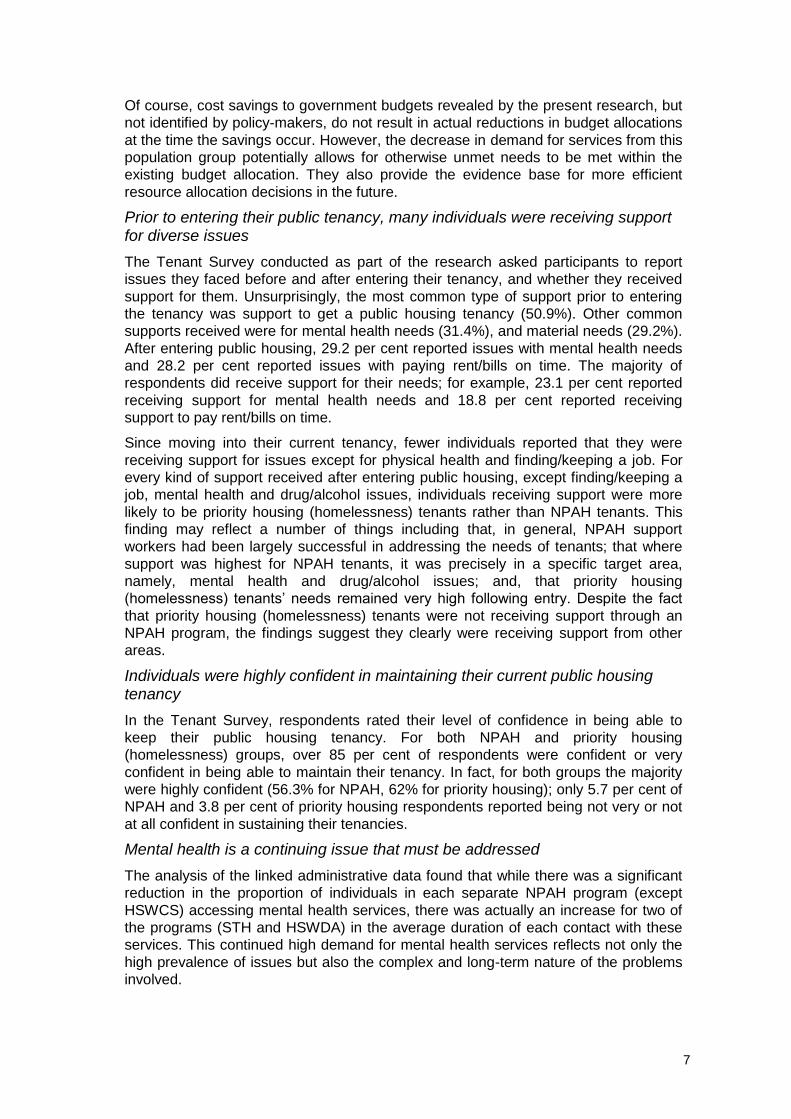
Individuals were highly confident in maintaining their current public housing tenancy
In the Tenant Survey, respondents rated their level of confidence in being able to
keep their public housing tenancy. For both NPAH and priority housing
(homelessness) groups, over 85 per cent of respondents were confident or very
confident in being able to maintain their tenancy. In fact, for both groups the majority
were highly confident (56.3% for NPAH, 62% for priority housing); only 5.7 per cent of
NPAH and 3.8 per cent of priority housing respondents reported being not very or not
at all confident in sustaining their tenancies.
Mental health is a continuing issue that must be addressed
The analysis of the linked administrative data found that while there was a significant
reduction in the proportion of individuals in each separate NPAH program (except
HSWCS) accessing mental health services, there was actually an increase for two of
the programs (STH and HSWDA) in the average duration of each contact with these
services. This continued high demand for mental health services reflects not only the
high prevalence of issues but also the complex and long-term nature of the problems
involved.
8
The Tenant Survey provides more insight into the prevalence of mental illness. While
the percentage of people who report receiving support for mental health issues falls
from prior to after entering a public housing tenancy from 31 per cent to 22 per cent,
29 per cent report having issues. This is likely to be an underestimate as the analysis
of the K10 questionnaire, an instrument designed to measure psychological distress,
found that almost half the sample was experiencing high or very high distress levels,
compared to 10 per cent of the general Australian population (ABS 2013a).
Policy implications
This report finds that the provision of stable public housing for people experiencing or
at risk of homelessness results in reduced health service use (both in terms of the
number of people and the frequency and duration of use), and associated cost
savings to the health system and public purse. Providing stable housing with support
should be a first priority to improving not only housing outcomes, but health outcomes
and consequently reducing health care costs. This is particularly the case for
individuals who experience mental health issues.
The findings support the role of public housing as a foundation for non-shelter
outcomes and, in particular, health outcomes. They also point to the importance of
continued support for highly vulnerable entrants to public housing, particularly for
those with a history of severe and persistent mental illness who are either homeless
or at risk of homelessness. They further support the need for integrated care
arrangements and for a holistic approach to health issues that recognises the
importance of housing and of support in terms of improved health outcomes.
Specifically, the study provides an evidence base for the continuation of NPAH
programs focused on the provision of housing with support. It also shows the
importance of linked health and housing data in policy-relevant research and impact
evaluations and provides the basis for future Australian studies in this area.
9
1 INTRODUCTION
A key focus of policies surrounding homelessness in recent years in Australia has
been on providing direct access to housing for those experiencing homelessness and
on supporting those who gain housing to maintain it, thus ending the cycle of
homelessness. This focus is particularly evident in programs funded under the 2009
National Partnership Agreement on Homelessness (NPAH) between the
Commonwealth of Australia, and Australian states and territories. NPAH programs
support those experiencing homelessness and those at-risk of homelessness to
access and sustain social housing in a variety of circumstances. Homelessness
covers those sleeping rough (primary homelessness), those in shelter but with no
tenure such as those in refuges and supported accommodation managed by
homelessness services and those ‘couch surfing’ (secondary homelessness), or those
in temporary or insecure accommodation such as boarding houses and caravan parks
(tertiary homelessness).
Our study examines five NPAH programs in Western Australia which support
homeless people to access and sustain public housing allocations. In the standard
case, without programs such as these, homeless people and those at risk of
homelessness receive crisis accommodation and other forms of support and may be
assisted to get onto public waiting lists, but they are not provided with direct support in
accessing guaranteed public housing and support to sustain those tenancies.
The five NPAH programs includes those exiting prisons or juvenile detention centres;
people with severe and persistent mental illness who are either homeless or at risk of
homeless when they are discharged from a Mental Health Inpatient Unit; people
sleeping rough; people who have undertaken treatment for drug and alcohol issues
and who may otherwise become homeless after exiting the treatment service or while
they are receiving assistance with their substance use; and people exiting short or
medium-term homelessness accommodation services (DCP n.d.; OAG 2012).
The five NPAH programs in question are:
1. Housing Support Worker Corrective Services (HSWCS) which supports those exiting prisons or juvenile detention centres.
2. Housing Support Worker Mental Health (HSWMH) which supports people with severe and persistent mental illness who are either homeless or at risk of homelessness when discharged from a Mental Health Inpatient Unit.
3. Street to Home (STH) which supports people sleeping rough.
4. Housing Support Worker Drug & Alcohol (HSWDA) which supports people who have undertaken treatment for drug and alcohol issues and who may otherwise become homeless while they are receiving assistance with their substance use or after exiting a treatment service.
5. Homelessness Accommodation Support (HAS) which supports people exiting short or medium-term homelessness accommodation services.
The present report is the second to be released in an AHURI-funded project that
examines the effectiveness and cost-effectiveness of NPAH programs aimed at
accessing and maintaining social tenancies for formerly homeless people and those at
high risk of homelessness. The first report, The cost effectiveness of Australian
tenancy support programs for formerly homeless people (Zaretzky and Flatau 2015),
examined the background of households supported by NPAH tenancy support
programs across Australia, the support provided and the housing outcomes achieved,
the cost of providing support and the cost of capital employed in providing social
10
housing. Zaretzky and Flatau (2015) showed that NPAH programs aimed at
supporting homeless clients and those at risk of homelessness to access and
maintain a social housing tenancy or maintain existing tenancies at risk of
homelessness, were successful in assisting households to sustain their tenancy and
prevent eviction.
In this second report, we focus on NPAH programs operating in Western Australia and
use Western Australia’s rich health service utilisation databases linked to public
housing administrative data. This is supplemented with a one-off survey of a sample
of current public housing tenants who were previously homeless or at risk of
homelessness. This provides the most in-depth examination to date in Australia of the
public health, social and economic impact of public housing programs to support
homeless people and those at risk of homelessness. In addition to the assessment of
the impact of NPAH program participation, the report also considers the benefit of
providing public housing for formerly homeless people more broadly, irrespective of
whether intensive NPAH-type support is provided. This is achieved by including in the
sample (both linked administrative data and the survey sample) people who have
entered public housing through a priority access route for those who are homeless or
at risk of homelessness, but are not receiving NPAH support. Eligibility for priority
public housing in WA includes primary homelessness covering those sleeping rough;
secondary homelessness, shelter but no formal tenure including staying in
accommodation provided by homelessness services or staying temporarily with
friends/family (‘couch surfing); and tertiary homelessness which is having an insecure
accommodation arrangement (e.g., boarding house or caravan park).
The present study comprises three parts. Part 1 entails a literature and desktop
review relating to the issues addressed in the study and the policy context. Part 2
involves the linking and analysis of administrative data on health service utilisation
from the Western Australian Department of Health, with public housing tenancy data
from the Western Australian Housing Authority (or Department of Housing) for tenants
supported by NPAH programs (n=983) and priority housing (homelessness) tenants
(n=2,400), to examine the impact of public housing on health service utilisation and
health system costs pre- and post-housing. Housing Authority data includes the
nature of public housing entry (type of NPAH program or priority housing
(homelessness)), duration of tenancy, and demographics. The health service
utilisation data included: hospital admissions and length of stay, emergency
department presentations, hospital in the home (HITH), mental health and psychiatric
services, and prescribed drugs for opioid dependence. Part 3 collected data from a
cross-sectional survey sent to public housing tenants (n=277) who entered public
housing through an NPAH program or priority housing (homelessness).
This study provides an estimate of the economic impact of the changes in health
service use from the provision of public housing and support through the NPAH
programs as well as those accessing housing through priority housing channels. Our
economic analysis focuses on the notional cost savings to government budgets that
the provision of public housing and support has from changes in emergency
presentation, days in hospital and days in psychiatric care. These services have been
identified in previous research as being highly used by people who are homeless, and
having the largest health care cost (Culhane, Metraux et al. 2002; Flatau, Zaretzky et
al. 2008; ARTD 2010; Zaretzky and Flatau 2013; Conroy, Bower et al. 2014).
Cost savings to government budgets revealed by research, but not identified by
policy-makers do not result in actual reductions in budget allocations at the time the
savings occur. However, the decrease in demand for services from this population
group potentially allows for otherwise unmet needs to be met within the existing
11
budget allocation. They also provide the evidence base for more efficient resource
allocation decisions in the future. For that to occur, stronger connections between
research and policy need to be built.
Linked administrative data has been used extensively in public health research in
Australia, but has been far less applied in other fields such as housing and
homelessness. The unique feature of the present study is the linkage of health service
utilisation administrative data with WA public housing records to examine the impact
on health service use and health costs among NPAH program participants and other
people given priority access to public housing due to homelessness (hereafter
referred to as priority housing (homelessness)). The Western Australian health service
utilisation data we draw on includes hospital admissions and length of stay,
emergency department presentations, hospital in the home (HITH), mental health and
psychiatric services, and prescribed drugs for opioid dependence. Importantly for this
study, the linked data identifies whether a particular tenant has received support
under an NPAH program or entered public housing under the priority access
homelessness route.
The present study contributes to the knowledge base by using administrative data
sources to examine the impact that public housing and support have on health service
use and subsequently on health costs. We supplement findings from the linked
administrative data with a survey of public housing tenants who either received
support under NPAH programs or who entered public housing through priority housing
access routes for those experiencing homelessness. The public housing Tenant
Survey provides additional insights into the background of public housing tenants,
their homelessness histories and most recent housing position prior to entry into
public housing, the tenancy-related issues they faced as tenants and the role of
support in meeting those issues, their use of alcohol, tobacco and drugs, their levels
of psychological distress, self-reported health status and perceived change in health
status and use of health services.
The report begins in Chapter 2 with a discussion of the background and rationale for
investigating the impact of public housing and support initiatives for homeless people
and those at risk of homelessness and also includes further background on the
NPAH. Chapter 3 outlines the methods used in the study, with particular focus on the
sources of linked health service utilisation and public tenant data used. Chapters 4
and 5 discuss the results of the linked health service utilisation and public housing
administrative data analysis and the Tenant Survey respectively. Chapter 6
summarises the findings of the report and concludes with a discussion of implications
for future research and policy.
12
2 BACKGROUND
This chapter provides the background and rationale for investigating the impact of
housing access and tenancy support initiatives, through the NPAH, on public health,
social and economic outcomes. It is structured as follows: Section 2.1 outlines the
relationship between housing, homelessness and health; Section 2.2 reviews the
recent literature around the impact of housing support on health and housing
outcomes; Section 2.3 reviews the literature on cost savings from reduced health
service use as a consequence of housing access and homelessness support; Section
2.4 summarises the current state of play of the National Partnership Agreement on
Homelessness (NPAH), particularly in regard to this study and relevant WA programs;
and, finally Section 2.5 describes some of the challenges in evaluating the impact of
NPAH programs.
2.1 Relationship between homelessness and health
There is now a substantial evidence base that homelessness and housing insecurity
can have significant negative impacts on non-shelter outcomes, particularly physical
and mental health outcomes (Fazel, Geddes et al. 2014). Moreover, there is a bi-
directional and compounding relationship between homelessness and health; housing
and health do not merely ‘go together’, but strongly influence each other (Foster,
Gronda et al. 2011; Department of Social Services 2008). For example, while mental
illness can precipitate homelessness, housing insecurity and homelessness also act
as a significant risk factor for poor mental health (Baker, Mason et al. 2014; Altena,
Brilleslijper-Kater et al. 2010). One of the suggested pathways is that adverse social
conditions (e.g. insecure housing, unemployment, social isolation) act as chronic
stressors that may contribute to the onset of mental health problems. Even for people
who are in housing, housing payment problems and rent arrears have significant
detrimental effects on mental wellbeing (Taylor, Pevalin et al. 2007). Both mental and
physical health issues can also adversely impact on employment and financial
security which, in turn, can precipitate homelessness (Nooe and Patterson 2010).
Rates of morbidity and premature mortality are higher in homeless groups than in the
general population; in both relative and absolute terms (Fazel, Geddes et al. 2014;The
Lancet 2014). People experiencing homelessness are over-represented in many
health statistics, including emergency department presentations, hospitalisation, and
psychiatric care. However, they are under-represented in the use of some other health
services, such as preventive health check-ups (Kushel, Perry et al. 2002; Salit, Kuhn
et al. 1998; Folsom, Hawthorne et al. 2005) and in respect of podiatry and dental
health care (relative to severe need) where health needs may not be met because of
high cost barriers (Flatau, Conroy et al. 2012). Decreased access to care also
contributes to increased risk for later-stage diagnosis among people who are
homeless (Rieke, Smolsky et al. 2015), poorer control of cardiovascular disease,
hypertension and diabetes (The Lancet 2014), and hospitalisation for preventable
conditions such as skin and respiratory conditions (Salit, Kuhn et al. 1998). In
homeless groups, there is an increased prevalence of infectious diseases (HIV,
tuberculosis, hepatitis C), non-communicable diseases, and higher rates of suicide
and unintentional injuries (Fazel, Geddes et al. 2014).
It is important to note that comorbidities are common in homeless populations (The
Lancet 2014). In particular, a significant proportion of homeless individuals suffer from
substance dependence and mental illness (The Lancet 2014; Fazel, Geddes et al.
2014; Cheung, Somers et al. 2015; Spicer, Smith et al. 2015). Homelessness,
substance abuse and mental illness have all individually been associated with higher
use of emergency departments and higher rates of hospitalisation (Kushel, Vittinghoff
13
et al. 2001; Kushel, Perry et al. 2002; Culhane, Metraux et al. 2002; Kim, Kertesz et
al. 2006; Chartier, Carrico et al. 2012), and so the impact on health service use and
costs are compounded when these circumstances are clustered together. For this
reason, mental health and substance abuse issues are of particular importance when
considering the relationship between health and homelessness. Typically, people
experiencing homelessness are more likely to engage with the ‘pointy end’ of the
health system, which bears a higher price tag than earlier intervention or health
service provision outside of hospital settings (Sadowski, Kee et al. 2009; The Lancet
2014).
2.2 Can the provision of housing and/or support improve health and housing outcomes?
Many of the existing studies investigating the relationship between housing and health
comprise evaluations of specific programs or interventions. A number of studies of
Housing First programs (i.e., the rapid housing of those experiencing homelessness
before presenting issues have been fully addressed) have demonstrated significant
reductions in homelessness, reduced health costs and improved housing tenancies
(Larimer, Malone et al. 2009, Gulcur, Ana et al. 2003; DeSilva, Manworren et al. 2011;
Conroy, Bower et al. 2014). One Housing First study also reported a decrease in visits
to emergency department, detoxification centre and medical clinics (DeSilva,
Manworren et al. 2011). A Canadian study reported a reduction in emergency
department visits among Housing First participants (compared to ‘treatment as usual’
participants), but found no difference in hospitalisations (Russolillo et al. 2014). In a
review of the Housing First approach, Fitzpatrick-Lewis, Ganann et al. (2011)
concluded that among people with a mental illness experiencing homelessness,
tenancies are improved when housing is provided on hospital discharge, and for those
with substance abuse issues, provision of permanent housing can decrease
substance abuse and therefore increase the likelihood of staying in a stable
accommodation environment. They also note that provision of housing can improve
health outcomes for homeless populations with HIV (Fitzpatrick-Lewis, Ganann et al.
2011). These findings are of particular interest in the present study. While the NPAH
programs being investigated were not Housing First programs per se, they do share a
common focus on ‘rapid housing’ of homeless people or those at risk of
homelessness in circumstances such as exiting from mental health and drug and
alcohol facilities, from corrective services facilities and from street-based
homelessness. In the case of the NPAH programs in Western Australia, greater pre-
entry support may be evident as well as perhaps post-entry support compared with
standard Housing First models.
Other wrap-around support programs, such as Australia’s Michael Project (Flatau,
Conroy et al. 2010; 2012), have also shown positive housing and health outcomes.
Sadowski, Kee et al. (2009) reported that offering housing and case management to
homeless adults with chronic mental illnesses resulted in fewer hospital and
emergency department visits when compared to usual care. Other studies have
shown that providing supportive housing can reduce the days/nights spent in
psychiatric hospitals and non-psychiatric hospitals (Perlman and Parvensky 2006;
Culhane, Metraux et al. (2002) as cited in Nooe and Patterson 2010), reduce
emergency department admissions (Rieke, Smolsky et al. 2015) and show an
increase in outpatient admissions (Rieke, Smolsky et al. 2015; Gilmer, Stefancic et al.
2010; Culhane, Metraux et al. 2002; Sadowski, Kee et al. 2009). The decrease in
emergency department visits and increase in outpatient visits implies that when
housed, individuals are able to more appropriately use health care services, that is,
fewer unnecessary emergency department visits are made.
14
However, these positive outcomes are not universal. In Gilmer, Stefancic et al.'s
(2010) evaluation of Full-Service Partnerships (FSP) in California, the mean number
of days of homelessness experienced, and the likelihood of receiving inpatient and
emergency services declined, but outpatient mental health visits increased. Mares
and Rosenheck (2011) also reported an increase in outpatient visits, as well as
increased visits to other medical, mental health, substance abuse and health care
services. They concluded that systems-level service integration programs, applied in
addition to intensive care arrangements, were associated with additional positive
housing outcomes, but not health outcomes. In a systematic review of the literature on
the impact of housing interventions on health and housing outcomes, Rog, Marshall et
al. (2014) summarised the evidence for permanent supportive housing as 'moderate',
with evidence that it can reduce homelessness, increase tenure and decrease
emergency department room visits and hospitalisation.
One of the gaps in the literature to date is larger scale studies that have accessed
linked housing and medical record data to examine the link between homelessness,
housing and health. Of the few published studies that have used linked health care
and housing data, the sample sizes have tended to be small. In the USA, Martinez
and Burt (2006) analysed administrative data of 236 adults and found that providing
permanent supportive housing to homeless people with psychiatric and substance
abuse disorders can reduce emergency department and hospital inpatient visits. In
another US study, Brown, Miao et al. (2015) interviewed and accessed the medical
records of 200 individuals and found that among homeless adults over 50 years old,
those who gained housing had fewer depressive symptoms and a lower rate of acute
care use than those who did not, but other measures of health status were not
significantly different. The use of linked administrative data on a larger scale is an
opportunity to improve knowledge both in terms of the number of different clients and
experiences that can be investigated and understood, and also the rigour of the
statistical analysis.
2.3 Can reducing homelessness contribute to cost savings to government via reduced health service use?
Economic analysis indicates that the health sector bears much of the cost and
consequences of recurring homelessness in Australia (Culhane, Metraux et al. 2002;
Corporation for Supportive Housing 2004; Perlman and Parvensky 2006; Social Policy
Research Centre 2007; Flatau and Zaretzky 2008; Flatau, Zaretzky et al. 2008;
Zaretzky, Flatau et al. 2008; Flatau, Conroy et al. 2010; 2012; ARTD 2010; Zaretzky
and Flatau 2013; 2015; Conroy, Bower et al. 2014). More broadly, housing has been
described as a central element in tackling broader health inequalities (Shaw 2004).
While it is recognised that investment into housing support can be expensive, a
growing body of international and Australian evidence suggests that, given the
disproportionate illness or health care cost burden attributable to housing insecurity
(e.g., higher rates of hospitalisation, use of emergency services, over-representation
in psychiatric services) (Redelmeier, Molin et al. 1995), housing support 'may
represent a more cost-effective as well as a more humane approach to the problem of
homelessness' (Salit, Kuhn et al. 1998).
There have been a number of attempts in international and Australian studies to
estimate the cost savings of reduced health service use when homelessness is
addressed or housing support provided. Evidence from the USA generally indicates
that providing housing support does reduce costs, although the patterns and extent of
cost saving can vary considerably for different health outcomes (Gilmer, Stefancic et
al. 2010; Larimer, Malone et al. 2009; Martinez and Burt 2006; Gulcur, Ana et al.
15
2003). For example, Larimer, Malone et al. (2009) found that, for the Housing First
group examined, Medicaid costs fell by 80 per cent in the 12 months after intervention
while emergency medical service costs fell by 56.6 per cent. The importance of
considering all services and costs was highlighted in a study by Gilmer, Stefancic et
al. (2010) which found that while the costs associated with inpatient and emergency
service use and some mental health services decreased for previously homeless
people participating in a Full-Service Partnerships (FSP) program, use of outpatient
services increased, resulting in a net increase to the total cost of services. Importantly,
however, this study also concluded that the total cost reductions in the health and
justice systems offset over 80 per cent of the cost of the FSP.
Australian studies have predominantly found homelessness support to be associated
with reduced use of high cost health services (Flatau and Zaretzky 2008; Flatau,
Zaretzky et al. 2008; Zaretzky, Flatau et al. 2008; Flatau, Conroy et al. 2010, 2012;
Bruce, McDermott et al. 2012; Zaretzky and Flatau 2013; 2015; Conroy, Bower et al.
2014). This is particularly true where longer term wrap around tenancy support is
provided, as shown in the Mission Australia Michael Project with homeless men,
where healthcare costs decreased by $8,222/person/year on average as consumers
moved away from the use of crisis and acute services towards the community end of
the health care system (Flatau, Conroy et al. 2010; 2012). In the subsequent Mission
Australia MISHA project that assisted homeless men using a ‘Housing First’ model but
with strong post-housing support, health costs were found to decrease by an average
47 per cent ($6,657/year) in the two years after support commenced, predominantly
relating to stays in hospital and psychiatric facilities (Conroy, Bower et al. 2014). An
important finding in the MISHA study was that in the first year of support, the use of
some health services actually increased for many clients as a result of previously
unmet needs being addressed, with broader decreases in health system use and
costs in the second year of support as health issues were stabilised (Conroy, Bower
et al. 2014). In another Australian study, the provision of supported housing for people
with a mental health diagnosis through the NSW Housing and Accommodation
Support Initiative (HASI), was associated with a 24 per cent decrease in mental health
inpatient hospital admissions (Bruce, McDermott et al. 2012). A decrease was also
observed in the average number of days spent in hospital per year of 59 per cent,
resulting in hospital costs avoided of $27,917 per person/year (Bruce, McDermott et
al. 2012).
Comparison across studies is difficult however, as there is considerable variation in
the type, source and quality of the health data sourced, ranging from self-reported use
of health services by people who were previously homeless, through to analysis of
Medicaid records in the US. Differences in the nature of the interventions to reduce
homelessness can also hinder the comparability or generalisability of findings.
Provision of housing alone, for example, is less likely to impact on health outcomes
and service use than interventions that couple housing with other forms of support
(Rog, Marshall et al. 2014). Additionally, there is evidence to suggest that some forms
of health system contacts (and thus costs) may initially increase (Conroy, Bower et al.
2014), particularly if there are previously undiagnosed or untreated health issues that
are better able to be addressed once people are in stable housing. Different methods
of calculating cost savings also renders comparisons between existing studies
difficult.
2.4 Evidence gaps addressed by this study
There is a small but growing body of evidence to support the contention that
intervening to reduce homelessness potentially yields improvements in health at the
individual level, and cost savings at the societal level. However, findings for these
16
outcomes are limited by small sample sizes. The limited number of studies and their
limited scope also signifies a notable gap in the literature. This study addresses two
challenges; first and foremost, understanding the public health, social and economic
impacts of the NPAH and access to public housing more broadly, and second,
addressing methodological issues in extant studies by using rich linked administrative
data and large sample sizes to increase confidence in the findings presented.
2.5 NPAH as an Australian Government initiative to reduce homelessness
As described in our first report in this AHURI study (Zaretzky and Flatau 2015), 2009
heralded the introduction of the new National Affordable Housing Agreement (NAHA)
and NPAH as the cornerstone of a concerted national effort to reduce homelessness
in Australia via greater focus on prevention, early intervention and the strengthening
of services aimed at supporting homeless clients’ ability to access and retain housing.
To implement the Agreement, each state and territory developed its own plan. The
approach in all jurisdictions except South Australia was to implement or expand a
range of programs each with a specific target group. In contrast, South Australia took
an integrated approach to homelessness assistance and delivered a range of regional
responses with a range of generic service elements to apply across all regions.
However, reporting on NPAH objectives varied considerably by jurisdiction. Audits
undertaken by five of the jurisdictions as well as the Australian National Audit Office
noted limitations with the publically available data making it difficult to assess both the
effectiveness of programs and the cost effectiveness. Appendix 1 of the First Report
from this AHURI study (Zaretzky and Flatau 2015) provides an overview of publically
available NPAH implementation plans, Annual Reports and evaluations.
Stated NPAH objectives included a dual focus on supporting not only access to stable
permanent housing, but also on the sustaining of those housing tenancies and
focusing on sustaining pre-existing tenancies that were at risk. It is the sustainability of
tenancies and how this relates to health outcomes and associated cost savings that is
as much the focus of this AHURI study as the access to the housing.
In our first report from this study (Zaretzky and Flatau 2015), an overview was
provided of NPAH programs across all Australian jurisdictions that were aimed at
accessing and sustaining social tenancies for formerly homeless people and those at
risk of homelessness. Specialist Homelessness Service Collection (SHSC) data
showed that for clients who were able to access housing during support, the
proportion living in public or community housing increased from 36.3 per cent prior to
support to 87.6 per cent at completion of support, and correspondingly the proportion
classified as homeless decreased from 33.7 per cent prior to support to 2.1 per cent at
completion of support. Where data was available, it suggested that the vast majority of
tenancies were sustained for 12 months or more (Zaretzky and Flatau 2015).
Homelessness administrative data, such as that examined in our first report, does not,
however, provide any broader outcome measures on which to gauge the impact of
accommodation outcomes on non-accommodation aspects of client’s lives and on
aspects of government expenditure outside of homelessness. In particular, it does not
provide an insight into whether the positive accommodation outcomes result in
improved health outcomes for clients or a beneficial impact on the health system.
Previous Australian studies have used a survey method to examine this issue (see
e.g. Flatau, Zaretzky et al. 2008; Flatau, Conroy et al. 2010; 2012; Zaretzky and
Flatau 2013, 2015; Conroy, Bower et al. 2014). However, the data is limited in
duration, relies on client self-report, uses comparatively small samples and is costly to
obtain. The method used in this report of linking homelessness and health data avoids
17
these issues. Nevertheless, it will be instructive to see whether previous findings
based on self-report data line up with the results from linked administrative data.
2.5.1 NPAH and homelessness in Western Australia
In 2009, Western Australia and the Commonwealth signed the four-year National
Partnership Agreement on Homelessness (OAG 2012). The stated overarching
intentions of NPAH were to:
intervene early to prevent people from becoming homeless
break the cycle of homelessness by helping people get back on their feet
provide pathways between homelessness services and connect people to mainstream services that help them to sustain their housing.
The NPAH Implementation Plan in WA (OAG 2012) set out 20 programs to help
homeless people and those at risk of homelessness. Overall, these programs sought
to provide one-on-one support for up to 12 months to help people find and stay in
stable housing, and to help connect people with mainstream mental and general
health services, as well as other support such as financial counselling, employment or
education. In WA, the Department for Child Protection and Family Support (DCPFS)
has been the lead agency for the Agreement in WA, and contracted a range of not-for-
profit organisations to deliver these programs.
In this AHURI study, the focus is on those NPAH programs that were identified as
assisting clients to access and maintain a social housing tenancy or to maintain an
existing social housing tenancy. DCPFS identified eight NPAH programs that met this
definition (as discussed in the first report from this study) and the Department of
Housing database has a flag for clients entering a public housing tenancy under five
of these NPAH programs (see Table 1 below).
In this second report, we examine the health and tenancy outcomes for participants
from these five NPAH programs. Clients assisted in these five programs represent
approximately 80 per cent of clients assisted in identified NPAH tenancy-related
programs (OAG 2012). There is also an NPAH program in WA that supports people to
maintain an existing social housing tenancy (estimated to represent approximately
20% of clients assisted in identified NPAH tenancy-related programs in WA overall),
but there is no flag for this program in the Department of Housing database, so it
could not be included in this study.
An evaluation of Western Australia’s NPAH programs was conducted between
January 2011 and December 2012 (Cant, Meddin et al. 2013). It found that in the two-
year period 5,094 individual clients were assisted across 14 NPAH programs (Cant,
Meddin et al. 2013). It was found that clients often had complex and multiple needs
requiring ongoing support for an array of issues including: mental health conditions,
domestic family violence, long-term unemployment, disability, severe financial
hardship, trauma, serious health complications, caring responsibilities, and language
difficulties. On top of this, many case workers were working with clients presenting
with dual diagnosis of mental health and/or drug and alcohol conditions (up to 39% of
clients in one service) (Cant, Meddin et al. 2013). Overall, clients interviewed in the
evaluation stated that support in combination with the accommodation provided was
life changing and, in some cases, lifesaving (Cant, Meddin et al. 2013).
2.5.2 Priority housing access in Western Australia
In addition to those entering public housing through an NPAH program, people with
urgent housing needs in Western Australia can be given priority access to public
rental housing. Homelessness is the predominant reason for this priority housing
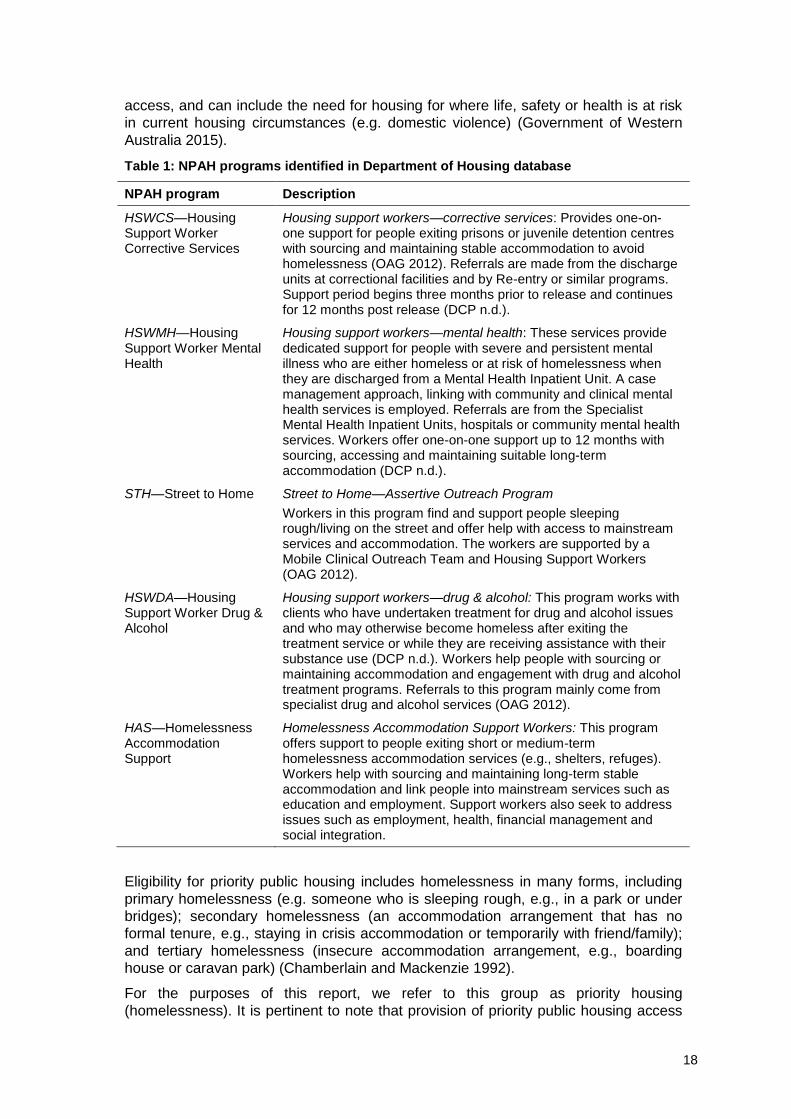
18
access, and can include the need for housing for where life, safety or health is at risk
in current housing circumstances (e.g. domestic violence) (Government of Western
Australia 2015).
Table 1: NPAH programs identified in Department of Housing database
NPAH program Description
HSWCS—Housing Support Worker Corrective Services
Housing support workers—corrective services: Provides one-on-one support for people exiting prisons or juvenile detention centres with sourcing and maintaining stable accommodation to avoid homelessness (OAG 2012). Referrals are made from the discharge units at correctional facilities and by Re-entry or similar programs. Support period begins three months prior to release and continues for 12 months post release (DCP n.d.).
HSWMH—Housing Support Worker Mental Health
Housing support workers—mental health: These services provide dedicated support for people with severe and persistent mental illness who are either homeless or at risk of homelessness when they are discharged from a Mental Health Inpatient Unit. A case management approach, linking with community and clinical mental health services is employed. Referrals are from the Specialist Mental Health Inpatient Units, hospitals or community mental health services. Workers offer one-on-one support up to 12 months with sourcing, accessing and maintaining suitable long-term accommodation (DCP n.d.).
STH—Street to Home Street to Home—Assertive Outreach Program
Workers in this program find and support people sleeping rough/living on the street and offer help with access to mainstream services and accommodation. The workers are supported by a Mobile Clinical Outreach Team and Housing Support Workers (OAG 2012).
HSWDA—Housing Support Worker Drug & Alcohol
Housing support workers—drug & alcohol: This program works with clients who have undertaken treatment for drug and alcohol issues and who may otherwise become homeless after exiting the treatment service or while they are receiving assistance with their substance use (DCP n.d.). Workers help people with sourcing or maintaining accommodation and engagement with drug and alcohol treatment programs. Referrals to this program mainly come from specialist drug and alcohol services (OAG 2012).
HAS—Homelessness Accommodation Support
Homelessness Accommodation Support Workers: This program offers support to people exiting short or medium-term homelessness accommodation services (e.g., shelters, refuges). Workers help with sourcing and maintaining long-term stable accommodation and link people into mainstream services such as education and employment. Support workers also seek to address issues such as employment, health, financial management and social integration.
Eligibility for priority public housing includes homelessness in many forms, including
primary homelessness (e.g. someone who is sleeping rough, e.g., in a park or under
bridges); secondary homelessness (an accommodation arrangement that has no
formal tenure, e.g., staying in crisis accommodation or temporarily with friend/family);
and tertiary homelessness (insecure accommodation arrangement, e.g., boarding
house or caravan park) (Chamberlain and Mackenzie 1992).
For the purposes of this report, we refer to this group as priority housing
(homelessness). It is pertinent to note that provision of priority public housing access
19
via this route differs from entry via a wrap-around, targeted support program like
NPAH. However, it does not preclude the possibility that people may have been, or
are, receiving various types of support from other sources. This was evident in the
subsample responding to the Tenant Survey (see Section 5 of this report). Many of
those entering public housing via a priority access homelessness channel do so from
prevailing support services.
2.6 Challenges in assessing the impact of NPAH programs
As noted in the WA Auditor General Office report on the Implementation of the NPAH
on Homelessness in Western Australia (OAG 2012), it is difficult to know whether the
NPAH programs actually reduced homelessness for clients assisted by them, unless
there is data on how many people became and remained housed over the NPAH
period, and ideally beyond that (OAG 2012). At the time of writing the OAG report, it
was noted that such data were not readily available, even for programs with a stated
aim of assisting clients to sustain tenancies.
Continuing shortages in the availability of public housing has been recognised as one
of the factors impeding attainment of the intended 7 per cent decrease in the number
of people experiencing homelessness in WA (OAG 2012). It is important, therefore, to
look at other ways to gauge the impacts of the NPAH program. This study seeks to do
this by looking at the proportion of tenancies sustained among NPAH participants and
assessing changes in health service usage prior to and following entry into the NPAH
program and the associated public housing tenancy.
2.7 Summary
People experiencing homelessness are over-represented in a myriad of health
statistics, including premature mortality, emergency presentations, recurrent
hospitalisation and psychiatric care (Fazel, Geddes et al. 2014; Moore, Gerdtz et al.
2007). Conversely, they are less likely to use preventive health services (Kushel,
Perry et al. 2002; Folsom, Hawthorne et al. 2005) or to seek earlier intervention for
manageable chronic diseases (The Lancet 2014). A significant proportion of
individuals experiencing homelessness suffer from substance dependence and
mental illness (Cheung, Somers et al. 2015; The Lancet 2014; Fazel, Geddes et al.
2014) and comorbidities are higher among this population group.
People who are homeless are more likely to have contact with the acute and pointy
end of the health system, which is far more expensive than early intervention or
primary care provision outside of hospital settings (Sadowski, Kee et al. 2009; The
Lancet 2014). In addition to the consequential demand on health system resources
(Culhane, Metraux et al. 2002; Zaretzky, Flatau et al. 2008; Zaretzky and Flatau 2013;
Conroy, Bower et al. 2014), the homelessness sector is strained by the proportion of
clients needing more intense support due to underlying health issues (Foster, Gronda
et al. 2011).
Thus intervening to reduce homelessness could not only improve an individual’s
health but also generate cost savings at a societal level. There is a small but growing
body of evidence supporting this argument, with several studies showing that Housing
First and other wrap-around support programs can significantly reduce homelessness,
improve health outcomes or reduce health service use and reduce health costs
(Rieke, Smolsky et al. 2015; Gilmer, Stefancic et al. 2010; Culhane, Metraux et al.
2002; Sadowski, Kee et al. 2009; Larimer, Malone et al. 2009; Gulcur, Ana et al. 2003;
DeSilva, Manworren et al. 2011). However, research to date has primarily relied on
self-reported health data, single intervention studies or small sample sizes. This
present study addresses this challenge, using longitudinal linked administrative data
20
from health and housing with a large sample of participants from five NPAH programs
implemented in WA, and additional data from formerly homeless people provided with
priority public housing access during the same study window.
Determining whether or not NPAH programs have reduced homelessness is difficult
due to the lack of available data. Furthermore, continuing public housing shortages
restrict the attainment of the intended 7 per cent decrease in the number of homeless
people in WA (OAG 2012). For this reason, this study takes a different perspective
and investigates the impacts of NPAH programs on health service usage.
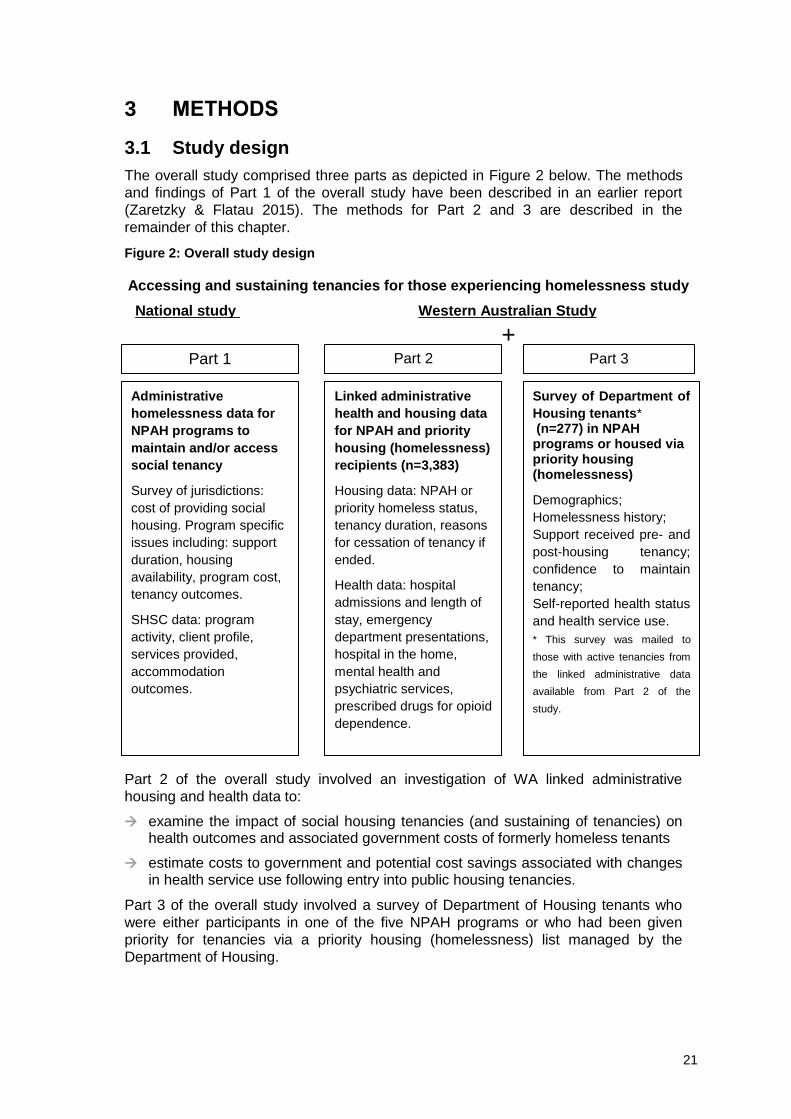
21
3 METHODS
3.1 Study design
The overall study comprised three parts as depicted in Figure 2 below. The methods
and findings of Part 1 of the overall study have been described in an earlier report
(Zaretzky & Flatau 2015). The methods for Part 2 and 3 are described in the
remainder of this chapter.
Figure 2: Overall study design
Part 2 of the overall study involved an investigation of WA linked administrative
housing and health data to:
examine the impact of social housing tenancies (and sustaining of tenancies) on health outcomes and associated government costs of formerly homeless tenants
estimate costs to government and potential cost savings associated with changes in health service use following entry into public housing tenancies.
Part 3 of the overall study involved a survey of Department of Housing tenants who
were either participants in one of the five NPAH programs or who had been given
priority for tenancies via a priority housing (homelessness) list managed by the
Department of Housing.
Accessing and sustaining tenancies for those experiencing homelessness study
National study Western Australian Study
Administrative
homelessness data for
NPAH programs to
maintain and/or access
social tenancy
Survey of jurisdictions:
cost of providing social
housing. Program specific
issues including: support
duration, housing
availability, program cost,
tenancy outcomes.
SHSC data: program
activity, client profile,
services provided,
accommodation
outcomes.
Linked administrative
health and housing data
for NPAH and priority
housing (homelessness)
recipients (n=3,383)
Housing data: NPAH or
priority homeless status,
tenancy duration, reasons
for cessation of tenancy if
ended.
Health data: hospital
admissions and length of
stay, emergency
department presentations,
hospital in the home,
mental health and
psychiatric services,
prescribed drugs for opioid
dependence.
Survey of Department of
Housing tenants* (n=277) in NPAH programs or housed via priority housing (homelessness)
Demographics;
Homelessness history;
Support received pre- and
post-housing tenancy;
confidence to maintain
tenancy;
Self-reported health status
and health service use.
* This survey was mailed to
those with active tenancies from
the linked administrative data
available from Part 2 of the
study.
Part 1 Part 2 Part 3
+
22
3.2 Measures
Appendix 1 summarises the data that was obtained from the Departments of Health
and Housing, as well as the measures collected via the Tenant Survey.
3.3 Sources of data
3.3.1 Department of Housing data
The Department of Housing dataset comprised tenants who received support to
access and/or to sustain their tenancy through an NPAH program from 1 August 2009
to 31 August 2013 and a comparison group who had received a public housing
tenancy through priority access channels due to homelessness, but who were not
supported by an NPAH program (priority housing (homelessness) tenants). The
variables provided are outlined in Appendix 1. Only de-identified data from the
Department of Housing was provided to the research team.
3.3.2 Department of Health data
The Department of Housing data was provided to the Department of Health Data
Linkage Branch to extract and link with data from five WA Department of Health data
collections:
Emergency Department Data Collection (EDDC): contains data on emergency department activity in WA’s public hospitals and activity in private hospitals under contract with the WA Government.
Hospital Morbidity Data System (HMDS): includes all hospitals in WA (public and private). The HMDS contains inpatient discharge summary data from all public and private hospitals in WA. Each unit record in the HMDS is an episode of care, which starts with a formal admission to hospital and ends with a formal discharge or separation from hospital. The HMDS includes all episodes of care that occur in the following Western Australian health services: public acute hospitals; public psychiatric hospitals; private acute hospitals (licensed by WA Health); private psychiatric hospitals (licensed by WA Health); and private day surgeries (licensed by WA health). The HMDS has some exclusions and does not include episodes of care (or equivalent unit of measurement) pertaining to: patients attending outpatient or community health services; patients in private residential aged care facilities; patients in community residential care facilities; and patients treated in Defence Force health services.
Mental Health Information System (MHIS): psychiatric episodes can be inpatient (public and private) and outpatient (public only). Inpatient data is sourced from Psychiatric Inpatient Units; Community Accommodation Support Program Hostels; Community Residential Facilities; Acute general hospitals. Outpatient data is sourced from; Psychiatric Clinics; Triage Services; Community mental health centres; Psychiatric Day centres; Outreach programs; and Rehabilitation programs.
Mortality Register Data: all deaths registered in the state.
Monitoring of Drugs of Dependence System Data Collection: the Community Program for Opioid Pharmacotherapy (CPOP) framework was developed to regulate the prescribing of opioid pharmacotherapy used for the treatment of opioid dependence in Western Australia. CPOP Drugs include: Methadone, Subutex and Suboxone.
Seven key health service variables were created from the linked health system data
for the purposes of analysis (see Table 2 below). As people entered their tenancy at
different times, the period for which health data was available after entry to a tenancy
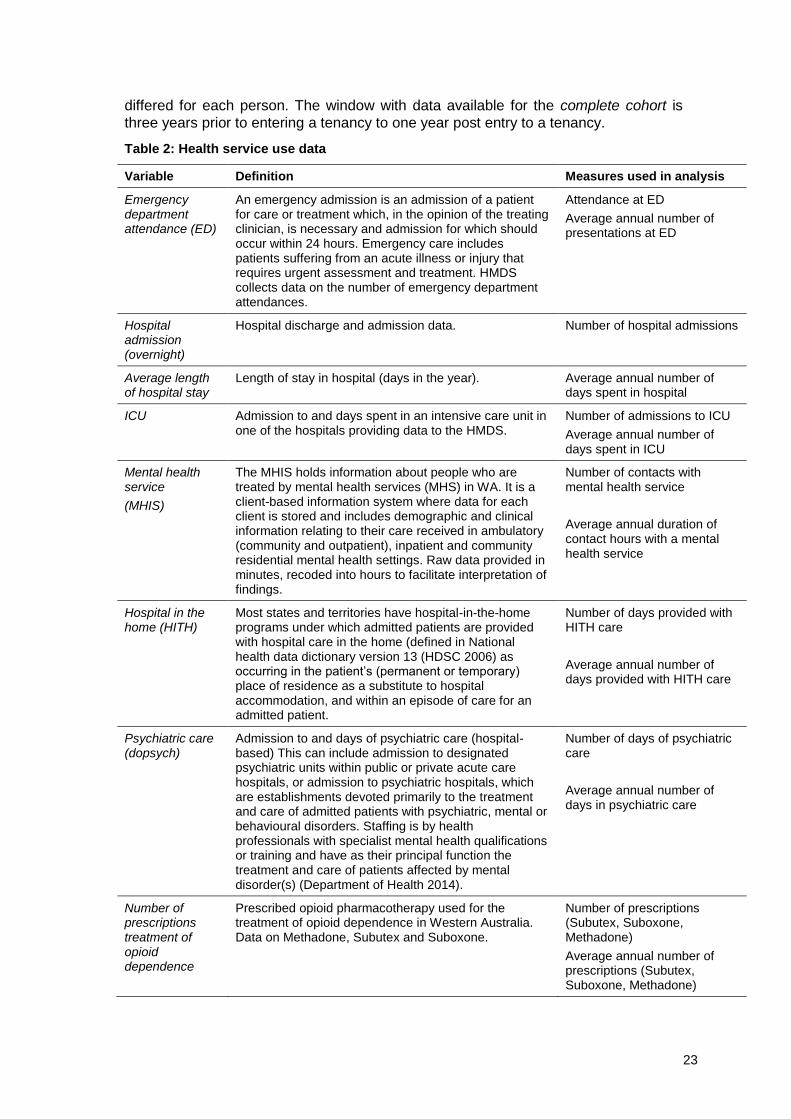
23
differed for each person. The window with data available for the complete cohort is
three years prior to entering a tenancy to one year post entry to a tenancy.
Table 2: Health service use data
Variable Definition Measures used in analysis
Emergency department attendance (ED)
An emergency admission is an admission of a patient for care or treatment which, in the opinion of the treating clinician, is necessary and admission for which should occur within 24 hours. Emergency care includes patients suffering from an acute illness or injury that requires urgent assessment and treatment. HMDS collects data on the number of emergency department attendances.
Attendance at ED
Average annual number of presentations at ED
Hospital admission (overnight)
Hospital discharge and admission data. Number of hospital admissions
Average length of hospital stay
Length of stay in hospital (days in the year). Average annual number of days spent in hospital
ICU Admission to and days spent in an intensive care unit in one of the hospitals providing data to the HMDS.
Number of admissions to ICU
Average annual number of days spent in ICU
Mental health service
(MHIS)
The MHIS holds information about people who are treated by mental health services (MHS) in WA. It is a client-based information system where data for each client is stored and includes demographic and clinical information relating to their care received in ambulatory (community and outpatient), inpatient and community residential mental health settings. Raw data provided in minutes, recoded into hours to facilitate interpretation of findings.
Number of contacts with mental health service
Average annual duration of contact hours with a mental health service
Hospital in the home (HITH)
Most states and territories have hospital-in-the-home programs under which admitted patients are provided with hospital care in the home (defined in National health data dictionary version 13 (HDSC 2006) as occurring in the patient’s (permanent or temporary) place of residence as a substitute to hospital accommodation, and within an episode of care for an admitted patient.
Number of days provided with HITH care
Average annual number of days provided with HITH care
Psychiatric care (dopsych)
Admission to and days of psychiatric care (hospital-based) This can include admission to designated psychiatric units within public or private acute care hospitals, or admission to psychiatric hospitals, which are establishments devoted primarily to the treatment and care of admitted patients with psychiatric, mental or behavioural disorders. Staffing is by health professionals with specialist mental health qualifications or training and have as their principal function the treatment and care of patients affected by mental disorder(s) (Department of Health 2014).
Number of days of psychiatric care
Average annual number of days in psychiatric care
Number of prescriptions treatment of opioid dependence
Prescribed opioid pharmacotherapy used for the treatment of opioid dependence in Western Australia. Data on Methadone, Subutex and Suboxone.
Number of prescriptions (Subutex, Suboxone, Methadone)
Average annual number of prescriptions (Subutex, Suboxone, Methadone)
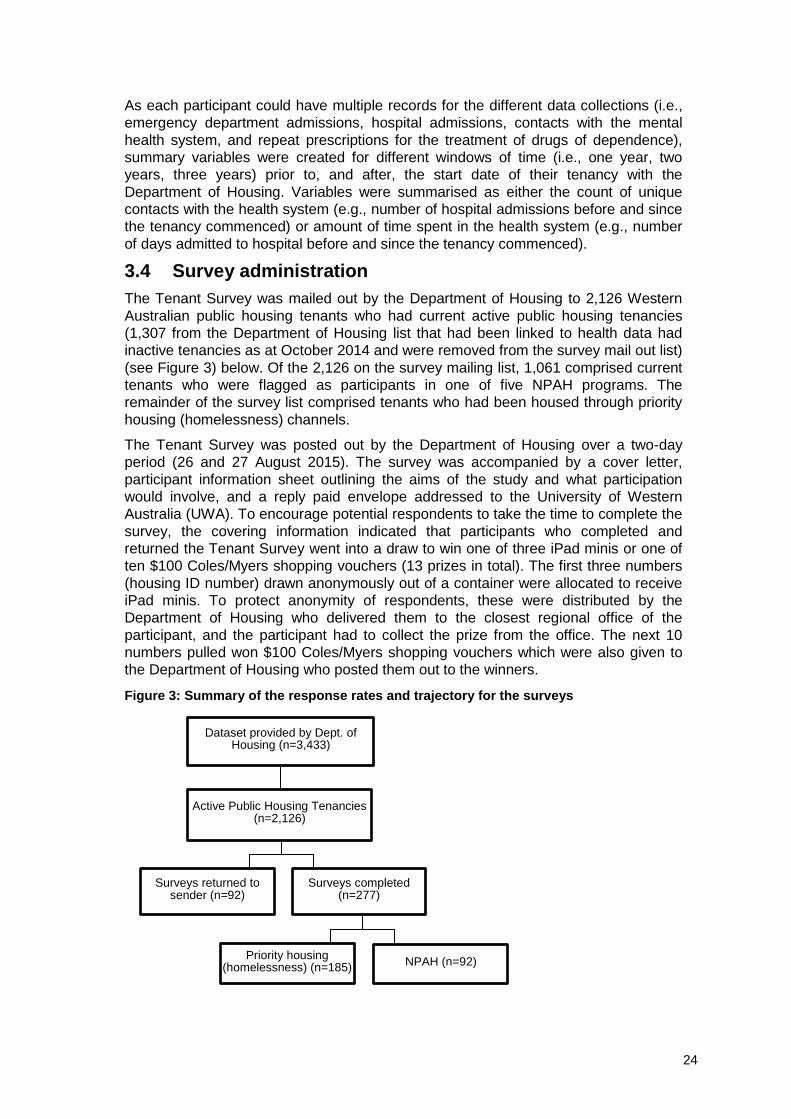
24
As each participant could have multiple records for the different data collections (i.e.,
emergency department admissions, hospital admissions, contacts with the mental
health system, and repeat prescriptions for the treatment of drugs of dependence),
summary variables were created for different windows of time (i.e., one year, two
years, three years) prior to, and after, the start date of their tenancy with the
Department of Housing. Variables were summarised as either the count of unique
contacts with the health system (e.g., number of hospital admissions before and since
the tenancy commenced) or amount of time spent in the health system (e.g., number
of days admitted to hospital before and since the tenancy commenced).
3.4 Survey administration
The Tenant Survey was mailed out by the Department of Housing to 2,126 Western
Australian public housing tenants who had current active public housing tenancies
(1,307 from the Department of Housing list that had been linked to health data had
inactive tenancies as at October 2014 and were removed from the survey mail out list)
(see Figure 3) below. Of the 2,126 on the survey mailing list, 1,061 comprised current
tenants who were flagged as participants in one of five NPAH programs. The
remainder of the survey list comprised tenants who had been housed through priority
housing (homelessness) channels.
The Tenant Survey was posted out by the Department of Housing over a two-day
period (26 and 27 August 2015). The survey was accompanied by a cover letter,
participant information sheet outlining the aims of the study and what participation
would involve, and a reply paid envelope addressed to the University of Western
Australia (UWA). To encourage potential respondents to take the time to complete the
survey, the covering information indicated that participants who completed and
returned the Tenant Survey went into a draw to win one of three iPad minis or one of
ten $100 Coles/Myers shopping vouchers (13 prizes in total). The first three numbers
(housing ID number) drawn anonymously out of a container were allocated to receive
iPad minis. To protect anonymity of respondents, these were distributed by the
Department of Housing who delivered them to the closest regional office of the
participant, and the participant had to collect the prize from the office. The next 10
numbers pulled won $100 Coles/Myers shopping vouchers which were also given to
the Department of Housing who posted them out to the winners.
Figure 3: Summary of the response rates and trajectory for the surveys
Dataset provided by Dept. of Housing (n=3,433)
Surveys returned to sender (n=92)
Surveys completed (n=277)
NPAH (n=92) Priority housing (homelessness) (n=185)
Active Public Housing Tenancies (n=2,126)
25
Of the 2,126 surveys posted, 92 were ‘returned to sender’ at the Department of
Housing and 277 were completed and returned to UWA. This represents a response
rate of 13.6 per cent which is low when compared to other studies that used mail out
surveys with a public housing demographic (e.g., 27.3% of WA public housing tenants
(AIHW 2014c)). However, the AIHW study was able to send out two reminders to
complete the survey where we were unable to do this.
3.5 Data linkage
3.5.1 Linkage of Department of Health and Department of Housing data
Western Australia’s comprehensive data linkage system systematically links available
administrative health data within WA by matching patient names and other identifiers
(Holman, Bass et al. 1999). The Department of Housing dataset was provided directly
to the Department of Health, Data Linkage Branch, via a secure file transfer system
(SUFEX). This file contained the identifying information (e.g., name, date of birth)
necessary to enable data linkage with the health data collections (note: all identifying
information was removed from the dataset before it was supplied to the research
team). The file also contained a unique study ID to enable data from the Tenant
Survey to be linked at a later date.
The Department of Housing dataset included 3,433 records, but after the removal of
duplicates (n=30) and records that could not be linked (n=20), the final dataset
included information on 3,383 unique Department of Housing clients. Of these, 983
clients received support from NPAH and 2,400 received housing through priority
channels due to homelessness.
Separate files for each of the linked datasets were provided to the research team
following data linkage. Each record included a Statistical Linkage Key (SLK) that
enabled each housing tenant to be matched with their corresponding health system
data.
3.5.2 Linkage of Tenant Survey data to linked administrative data
Permission was sought from Tenant Survey respondents to link (in a de-identified
way) Tenant Survey data to the health and housing administrative linked data set. The
Participant Information sheet for the Tenant Survey explained that the Tenant Survey
was part of a larger data linkage project, and that if permission were granted, survey
answers would be confidentially linked to housing and health data to help the research
team see the ‘bigger picture’ of how housing tenancy, support and health, might be
related. An example was provided related to using the data to see whether people are
less likely to go to hospital with health problems when they have more stable housing
and better support.
Survey respondents were assured that the data linkage process maintains their
privacy as name, address and any other personal details are all replaced by a unique
anonymous code that is used by each organisation. Research projects can then use
information from different organisations without needing to know any personal details
about individuals.
The surveys were printed out with a unique housing ID code which corresponded to
the data linkage SLK and the tenant. The Department of Housing generated cover
letters with the same ID code, and the corresponding survey and cover letter were
packaged at the Department of Housing to ensure that no identifying information was
handled outside of the Department of Housing.
26
3.6 Data analysis
3.6.1 Data analysis (housing and health data)
The linked housing and health data analysis included computation of the proportion
(percentage) of people accessing health services. For those who used these services,
the frequency or duration of use was computed; mean annual service use prior to and
following entry into a tenancy were compared; and health outcomes in relation to
tenancy status (current or ended) and length of tenancy were analysed. Statistical
Package for the Social Sciences (SPSS) version 21 was used for all analyses. Three
years of health service use data was available for the period prior to tenancy entry
and one year of data for the period after tenancy entry. The main analysis refers to
comparison of health service use in the 12 months prior to and the 12 months after
tenancy entry. By design, all those in the research population had health service and
housing tenancy data for this balanced pre- and post-entry analysis. Past a year on
entry, the data becomes unbalanced given the staggered entry of people into housing.
Additional analyses also examine the average annual percentage of people who
accessed a service in the three years prior to tenancy entry. Our starting assumption
is that homelessness is likely to be more severe in the period immediate prior to entry
into housing and that services are targeting entry into NPAH programs in light of this.
Moreover, we hypothesise, given links between homelessness and health costs, that
health costs will be highest in this period as well. Without complete histories of
homelessness of those in the research population we cannot be sure of these working
assumptions.
The percentage of people who used a service prior to tenancy entry was based on the
annual recorded number of people accessing a service in the year prior to tenancy
entry. Additionally, the percentage of people who accessed a service in the three
years prior to entry to a tenancy was calculated, and converted into a variable
representing the average annual percentage of people accessing the service. The
percentage of people who accessed a service after entry to a tenancy is based on a
one-year period. The percentage of people who accessed a service before versus
after entry to a tenancy was then compared. Two comparisons were made:
1. The main analysis compares the percentage of people who accessed the service in the year prior to tenancy entry with the year after tenancy entry.
2. The second analysis compares the mean annual percentage of people who accessed the service in the three years prior to tenancy entry with the percentage of people who accessed the service in the year after tenancy entry.
The mean frequency and duration of health service use was then calculated for the
year before and the year after entry to a tenancy. The mean frequency or duration
was calculated conditionally on the basis that the individual accessed the particular
service in the period of interest; that is, mean service frequency or duration before
commencing a tenancy (among those who had accessed a service in the year prior to
tenancy) or mean service frequency or duration after commencing public housing
tenancy (among those who accessed the service after tenant entry).
The percentage of people accessing prescriptions for drug dependency and the
frequency of access was assessed through the number of prescriptions issued.
Prescriptions for Subutex, Suboxone and Methadone were combined into one variable
for analysis of drug dependency service usage.
Housing outcomes were determined on current tenancy status and the reason for
tenancy termination if individuals had not sustained their tenancy. Kaplan-Meier
survival analysis was used to calculate cumulative ‘survival’ functions (i.e., for how
27
long do tenants remain in, or survive, in their tenancy) for tenancy length as the data
is ‘right censored’ at the end of the observation window (some individuals have yet to
leave their tenancy).
Calculations for the percentage of people accessing a health service and the mean
frequency or duration of service usage before and after entry to a tenancy and
housing outcomes were completed with the data split by type of support program. The
percentage of people accessing a service was also split by tenancy length. Frequency
or duration of service use was also split by gender and Indigenous status.
For those who had left their tenancy, the agreement start date and end dates are
known while for those who have so far sustained their tenancy, only the agreement
start date is known. These variables can be used to find the tenancy length based on
the date of 24 October 2014 as the last known time point of information for those who
have so far sustained their tenancy.
3.6.2 Economic impact; health costs and the cost of providing NPAH support
The economic impact of the NPAH services was assessed by examining the dollar
value associated with any change in usage of health services and the cost of
providing tenancy support through NPAH programs.
The dollar value of change in health service usage was calculated for three health
areas—emergency presentations, days in hospital and days in psychiatric care. These
areas are shown in previous studies to have the largest economic impact due to the
high cost of each episode of care and the comparatively wide use of these services by
the homeless (Flatau, Conroy et al. 2012; Conroy, Bower et al. 2014; Zaretzky and
Flatau 2013).
The change in the cost of health service use across all clients and the average
change per person were calculated by program and health service. The total cost of
health service use both prior to and after entry into public housing tenancy were
calculated by applying the unit cost for each health service to the number of times a
service was used in the year prior to and the year after the tenancy commenced.
The total number of times a service was used in each period was calculated from the
number of people who accessed the service in that period and the mean frequency or
duration of service use. The number of people who accessed the service in each
annual period and the mean frequency or duration of service use were obtained from
the linked health data and calculated as described in Section 3.6.1.
Total cost of health service = number of people to access service * average
duration or frequency of use * unit cost per incident.
The change in total cost was calculated as the total cost in the year prior to tenancy
minus the change in total cost in the year after tenancy. The change in health service
cost per person was calculated with reference to all people supported by the program.
Change in cost was calculated as:
Change in health service cost across all clients = Total cost of health service prior to entering tenancy minus Total cost of health service after entering tenancy.
Change in health service cost per person = Change in health service cost across all clients divided by total people supported under the program(s) (NPAH and/or PH).
The unit cost per incident for each health service was obtained for Western Australia
for the period 2012–13 from:
28
‘Emergency presentations’ and ‘Cost per hospital day’ from IHPA (2015): National Hospital Cost Data Collection Australian Public Hospitals Cost Report 2012-13, Round 17.
Cost per psychiatric care day from AIHW (2015b): Mental Health Services in Australia, Expenditure on Mental Health Services, Table EXP.7.
The cost of providing tenancy support through NPAH programs was estimated from
publically available data for the period 2009–12:
NPAH program cost/person = Program expenditure (2009–12)/people assisted
2009–12
Program expenditure data is not publically available for the period 2012–13. Data was
sourced from:
Expenditure: OAG 2012, Implementation of the National Partnership Agreement on Homelessness in Western Australia: Report 13 to October 2012, Office of the Auditor General Western Australia, Perth.
People assisted: WA Government 2013, NPAH Annual Report 2011–2012, [14 October 2015].
Where health service use decreases from prior to after entry to a tenancy there is
potential impact on the government health budget through health costs avoided and/or
existing services being more able to meet overall demand. In terms of whole-of-
government cost, the potential health costs avoided represent an offset to the cost of
providing NPAH support. The net cost of support would be estimated as NPAH
program cost minus change in health service cost. As NPAH program cost data
(2009–12) is not available for the same period as the health cost data (2012–13), it is
not possible to calculate a figure for the net cost of NPAH support. It is only possible
to compare the direction and relative magnitude of the change in health costs and
NPAH program costs.
3.7 Ethics
As the study involved data linkage and the accessing of Department of Health data,
ethics approval had to be obtained from the Department of Health. Ethics approval
was granted by the Department of Health WA Human Research Ethics Committee,
number 2014/48. As required by the Ethics Committee, only de-identified data could
be provided to the research team. The following steps ensured the anonymity of the
Department of Housing tenants:
Data linkage—The Department of Housing created a database of tenants meeting the study criteria. The file included identifying information (e.g., name, date of birth), housing support details, and a SLK generated by the Department of Housing to allow the subsequent linkage of the Tenant Survey data. The Department of Housing provided this file directly to the Department of Health, Data Linkage Branch. The identifying information was used to link tenants with their health system information. The Department of Health then removed all identifying information before providing the research team with the linked Department of Housing and Department of Health data.
Tenant Survey—The Tenant Survey was provided to the Department of Housing, who sent the survey to current public housing tenants who have received or who are receiving NPAH support. These survey forms included the SLK generated by the Department of Housing, but no other identifying information. On completion, clients were asked to post the surveys to the research team at UWA. Those completing the Tenant Survey were asked to provide informed consent for their

29
survey information to be linked with their health data. For those who provided consent, the SLK on the survey was used to link this information with their health data already held by the research team.
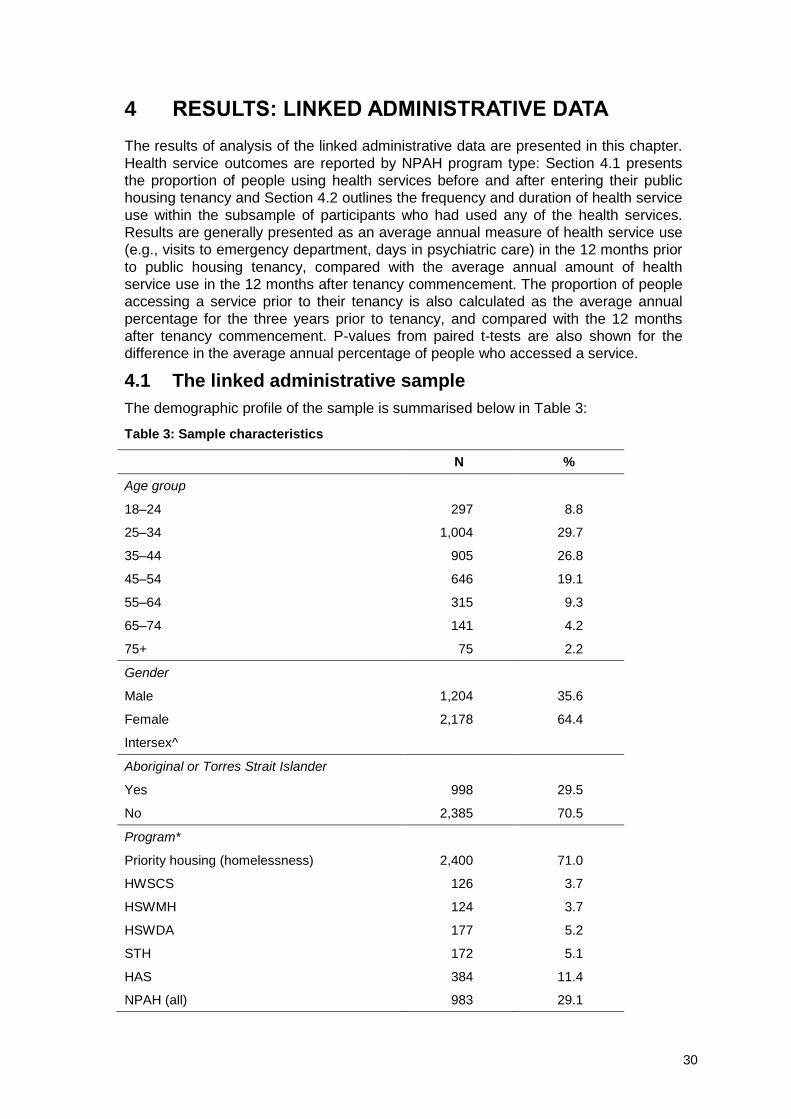
30
4 RESULTS: LINKED ADMINISTRATIVE DATA
The results of analysis of the linked administrative data are presented in this chapter.
Health service outcomes are reported by NPAH program type: Section 4.1 presents
the proportion of people using health services before and after entering their public
housing tenancy and Section 4.2 outlines the frequency and duration of health service
use within the subsample of participants who had used any of the health services.
Results are generally presented as an average annual measure of health service use
(e.g., visits to emergency department, days in psychiatric care) in the 12 months prior
to public housing tenancy, compared with the average annual amount of health
service use in the 12 months after tenancy commencement. The proportion of people
accessing a service prior to their tenancy is also calculated as the average annual
percentage for the three years prior to tenancy, and compared with the 12 months
after tenancy commencement. P-values from paired t-tests are also shown for the
difference in the average annual percentage of people who accessed a service.
4.1 The linked administrative sample
The demographic profile of the sample is summarised below in Table 3:
Table 3: Sample characteristics
N %
Age group
18–24 297 8.8
25–34 1,004 29.7
35–44 905 26.8
45–54 646 19.1
55–64 315 9.3
65–74 141 4.2
75+ 75 2.2
Gender
Male 1,204 35.6
Female 2,178 64.4
Intersex^
Aboriginal or Torres Strait Islander
Yes 998 29.5
No 2,385 70.5
Program*
Priority housing (homelessness) 2,400 71.0
HWSCS 126 3.7
HSWMH 124 3.7
HSWDA 177 5.2
STH 172 5.1
HAS 384 11.4
NPAH (all) 983 29.1
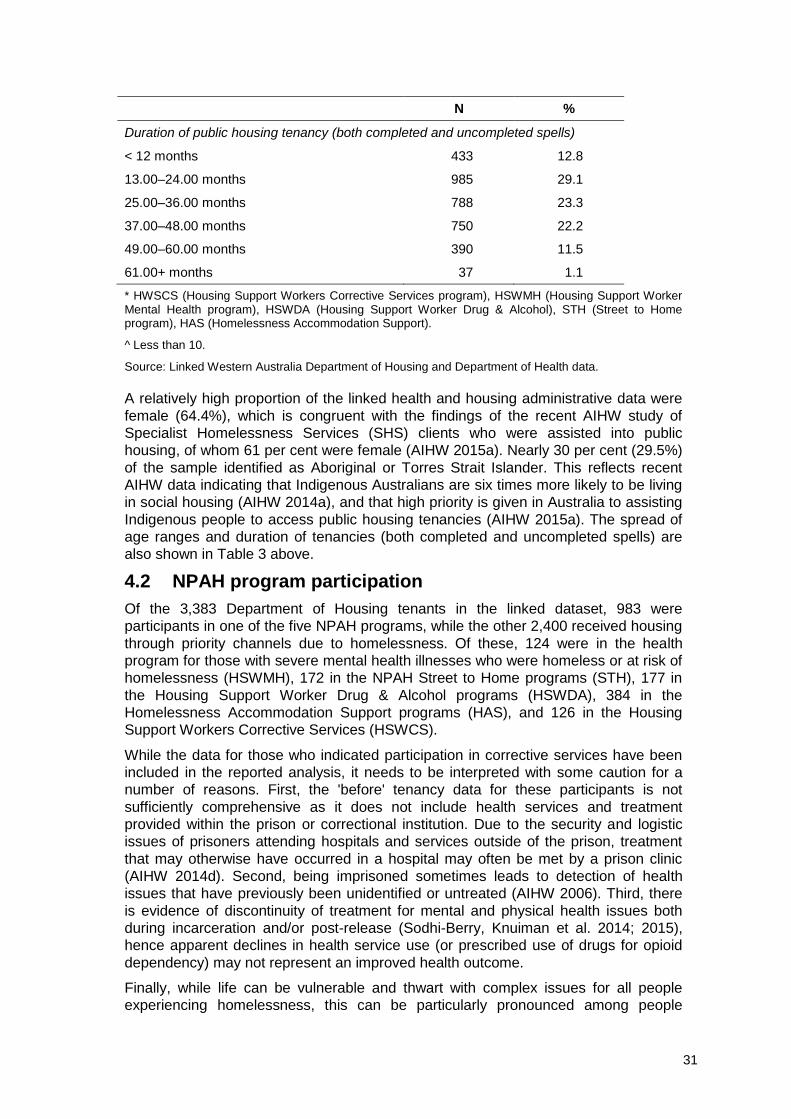
31
N %
Duration of public housing tenancy (both completed and uncompleted spells)
< 12 months 433 12.8
13.00–24.00 months 985 29.1
25.00–36.00 months 788 23.3
37.00–48.00 months 750 22.2
49.00–60.00 months 390 11.5
61.00+ months 37 1.1
* HWSCS (Housing Support Workers Corrective Services program), HSWMH (Housing Support Worker Mental Health program), HSWDA (Housing Support Worker Drug & Alcohol), STH (Street to Home program), HAS (Homelessness Accommodation Support).
^ Less than 10.
Source: Linked Western Australia Department of Housing and Department of Health data.
A relatively high proportion of the linked health and housing administrative data were
female (64.4%), which is congruent with the findings of the recent AIHW study of
Specialist Homelessness Services (SHS) clients who were assisted into public
housing, of whom 61 per cent were female (AIHW 2015a). Nearly 30 per cent (29.5%)
of the sample identified as Aboriginal or Torres Strait Islander. This reflects recent
AIHW data indicating that Indigenous Australians are six times more likely to be living
in social housing (AIHW 2014a), and that high priority is given in Australia to assisting
Indigenous people to access public housing tenancies (AIHW 2015a). The spread of
age ranges and duration of tenancies (both completed and uncompleted spells) are
also shown in Table 3 above.
4.2 NPAH program participation
Of the 3,383 Department of Housing tenants in the linked dataset, 983 were
participants in one of the five NPAH programs, while the other 2,400 received housing
through priority channels due to homelessness. Of these, 124 were in the health
program for those with severe mental health illnesses who were homeless or at risk of
homelessness (HSWMH), 172 in the NPAH Street to Home programs (STH), 177 in
the Housing Support Worker Drug & Alcohol programs (HSWDA), 384 in the
Homelessness Accommodation Support programs (HAS), and 126 in the Housing
Support Workers Corrective Services (HSWCS).
While the data for those who indicated participation in corrective services have been
included in the reported analysis, it needs to be interpreted with some caution for a
number of reasons. First, the 'before' tenancy data for these participants is not
sufficiently comprehensive as it does not include health services and treatment
provided within the prison or correctional institution. Due to the security and logistic
issues of prisoners attending hospitals and services outside of the prison, treatment
that may otherwise have occurred in a hospital may often be met by a prison clinic
(AIHW 2014d). Second, being imprisoned sometimes leads to detection of health
issues that have previously been unidentified or untreated (AIHW 2006). Third, there
is evidence of discontinuity of treatment for mental and physical health issues both
during incarceration and/or post-release (Sodhi-Berry, Knuiman et al. 2014; 2015),
hence apparent declines in health service use (or prescribed use of drugs for opioid
dependency) may not represent an improved health outcome.
Finally, while life can be vulnerable and thwart with complex issues for all people
experiencing homelessness, this can be particularly pronounced among people
32
exiting correctional institutions (Baldry, McDonnell et al. 2006). Hence, health issues
may be exacerbated for reasons unrelated to housing tenancy status. In particular,
this group is known to have higher requirements for assistance with drug/alcohol
counselling and is one of the lowest achieving groups in the SHS population for
achieving all case management goals (AIHW 2016), which has obvious implications
for their health status.
4.3 Priority housing (homelessness) participation
Over 70 per cent of the Department of Housing tenants in the linked dataset had
entered their public housing tenancy through the priority housing (homelessness)
access route (n=2,400). Priority access can be granted in a number of circumstances
related directly or indirectly to homelessness. When the reason for access is broken
down, the vast majority were granted access as they were currently homeless, with
nearly half of the group gaining access due to secondary homelessness (47.8%), less
than 3 per cent were given priority access for reasons other than those directly listed
as homelessness, although causes cited such as domestic violence are intimately
linked to homelessness.
4.4 Proportion of people using health services before and after entering public housing tenancy
The proportion of people within each NPAH program and the priority housing
(homelessness) group who used health services one year prior to and one year
following entry into their public housing tenancy is shown in Table 4 below. The p-
values denote whether there was a significant difference in the proportion of people
using a health service prior to and following entry into a public housing tenancy.
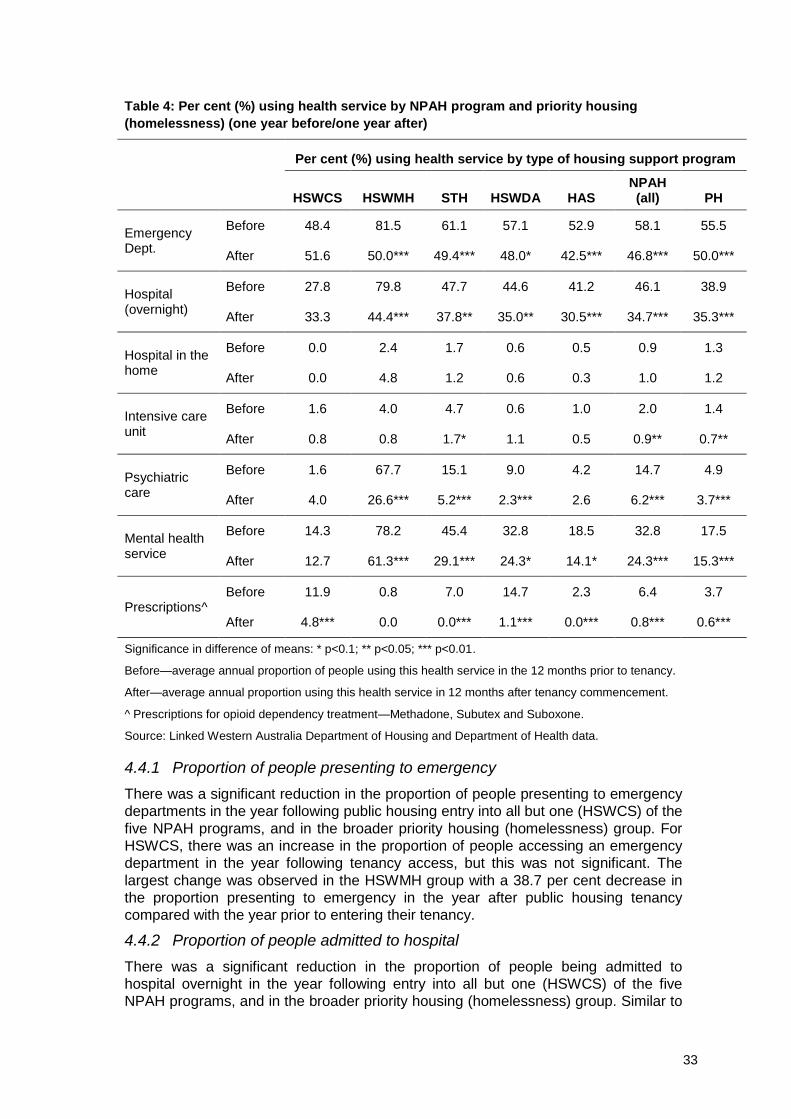
33
Table 4: Per cent (%) using health service by NPAH program and priority housing
(homelessness) (one year before/one year after)
Per cent (%) using health service by type of housing support program
HSWCS HSWMH STH HSWDA HAS NPAH (all) PH
Emergency Dept.
Before 48.4 81.5 61.1 57.1 52.9 58.1 55.5
After 51.6 50.0*** 49.4*** 48.0* 42.5*** 46.8*** 50.0***
Hospital (overnight)
Before 27.8 79.8 47.7 44.6 41.2 46.1 38.9
After 33.3 44.4*** 37.8** 35.0** 30.5*** 34.7*** 35.3***
Hospital in the home
Before 0.0 2.4 1.7 0.6 0.5 0.9 1.3
After 0.0 4.8 1.2 0.6 0.3 1.0 1.2
Intensive care unit
Before 1.6 4.0 4.7 0.6 1.0 2.0 1.4
After 0.8 0.8 1.7* 1.1 0.5 0.9** 0.7**
Psychiatric care
Before 1.6 67.7 15.1 9.0 4.2 14.7 4.9
After 4.0 26.6*** 5.2*** 2.3*** 2.6 6.2*** 3.7***
Mental health service
Before 14.3 78.2 45.4 32.8 18.5 32.8 17.5
After 12.7 61.3*** 29.1*** 24.3* 14.1* 24.3*** 15.3***
Prescriptions^ Before 11.9 0.8 7.0 14.7 2.3 6.4 3.7
After 4.8*** 0.0 0.0*** 1.1*** 0.0*** 0.8*** 0.6***
Significance in difference of means: * p<0.1; ** p<0.05; *** p<0.01.
Before—average annual proportion of people using this health service in the 12 months prior to tenancy.
After—average annual proportion using this health service in 12 months after tenancy commencement.
^ Prescriptions for opioid dependency treatment—Methadone, Subutex and Suboxone.
Source: Linked Western Australia Department of Housing and Department of Health data.
4.4.1 Proportion of people presenting to emergency
There was a significant reduction in the proportion of people presenting to emergency
departments in the year following public housing entry into all but one (HSWCS) of the
five NPAH programs, and in the broader priority housing (homelessness) group. For
HSWCS, there was an increase in the proportion of people accessing an emergency
department in the year following tenancy access, but this was not significant. The
largest change was observed in the HSWMH group with a 38.7 per cent decrease in
the proportion presenting to emergency in the year after public housing tenancy
compared with the year prior to entering their tenancy.
4.4.2 Proportion of people admitted to hospital
There was a significant reduction in the proportion of people being admitted to
hospital overnight in the year following entry into all but one (HSWCS) of the five
NPAH programs, and in the broader priority housing (homelessness) group. Similar to
34
the proportion of people presenting to the ED, there was also an increase in the
proportion of people from HSWCS who were being admitted to hospital overnight, but
this was not statistically significant. The largest change was observed in the HSWMH
group with a 44.4 per cent decrease in the year after public housing tenancy
compared with the year prior to entering their tenancy.
4.4.3 Proportion of people using hospital in the home
There were no statistically significant changes observed in the proportion of people
using HITH services in the year after accessing their tenancy compared with the year
prior to entry into their tenancy.
4.4.4 Proportion of people accessing the ICU
When looking at individual NPAH programs there was only a significant reduction in
the proportion of people accessing the ICU for those who entered their tenancy
through the STH program. Overall, there was a significant reduction for both NPAH
(55% decrease) and priority housing (homelessness) (50% decrease) entry pathways.
4.4.5 Proportion of people accessing psychiatric care
There was a significant reduction in the proportion of people admitted for psychiatric
care in the HSWMH, STH and HSWDA programs and the priority housing
(homelessness) group. There was an increase in the proportion of people from
HSWCS accessing psychiatric care, but this was not significant. The largest reduction
was observed in the HSWDA group, where there was a 74.4 per cent reduction
observed.
4.4.6 Proportion of people accessing mental health services
There was a significant reduction in the proportion of people accessing mental health
services for all NPAH (except HSWCS) and the priority housing (homelessness)
group following entry into a tenancy. The largest reduction in proportion was observed
for the STH group with a decrease of 35.9 per cent.
4.4.7 Proportion of people with prescriptions for drug treatment
The overall proportion of people prescribed any of the three drugs (Methadone,
Subutex, Suboxone) was small, but there was still significant reductions observed for
all NPAH groups (except HSWMH) and the priority housing (homelessness group).
The largest reduction in proportion was observed for STH, HAS and HSWMH where
there was a 100 per cent decrease.
4.4.8 Changes in the proportion of people using health services in three years prior to public tenancy compared with the year after entry
As data was available for people’s health service utilisation for a three-year window
prior to entry into their public housing tenancy, further analysis was undertaken to look
at the average proportion of people using services in this period compared with the
year following tenancy entry (See Appendix 2). While the one-year prior/one-year
post-tenancy commencement data shows significant reductions in the proportion of
people accessing all services (with the exception of HITH), analysis of the average
three-year utilisation prior to tenancy entry conversely shows a number of increases in
the proportion of people accessing some services. Specifically, among NPAH
program participants, significant increases were observed in overnight hospital
admittance and accessing of mental health services. Among the priority housing
(homelessness) cohort, significant increases in the proportion of people who entered
through priority housing (homelessness) were observed in the proportion of people
35
admitted to hospital overnight, and use of HITH, psychiatric care and mental health
services.
In examining these patterns of use over three years versus one year prior, it was
generally observed that the proportion of people who accessed health services
increased markedly over the three years prior to entering the public housing tenancy,
increasing to a very high level in the year prior to tenancy and then dropping back to a
lower level in the year after entry, although not to as low a level as the average over
the three years prior to tenancy entry.
The data available do not provide insight into why these differences exist between
average use in the three years prior to tenancy, compared with one-year prior, but the
most plausible reason is that the seriousness of health issues and, therefore, use of
services rose sharply in the year prior to entry into housing as compared with the
three-year history. In other words, support via the NPAH programs appears to have
been targeted at a point in time in the cycle when health needs and health care use
were escalating indicating appropriate targeting of the program. One possible
explanation for this outcome is that, on average, housing situations became
progressively less stable over the three-year period prior to tenancy entry and the
incidence and severity of homelessness worsens. As a result, the average health
situation deteriorates resulting in a larger proportion of people accessing health
services. This hypothesis is consistent with the literature detailed previously and
supports a conjecture that the NPAH programs were targeted to those experiencing
increasing need.
In many cases, support under NPAH commenced prior to tenancy entry, so it is also
possible that health service use increased prior to entry as a result of NPAH support
assisting people to access health services and to stabilise their health situation. The
decrease in the proportion of people accessing health services in the year after entry
potentially, on this reading, also reflects the dual effects of addressing health needs
and stabilisation of the health situation. This would be consistent with evidence from
the MISHA study (Conroy, Bower et al. 2014), which found that a decrease in health
costs was observed for only 52.5 per cent of people when comparing the 12 months
after support commenced and a tenancy was entered into and the 12 months prior,
with 47.5 per cent incurring an increase in costs. In contrast, when examining the
second year after support commenced and comparing it with the 12 months prior to
support, a decrease in health costs was observed for 71.2 per cent of people and
there was a large decrease in the average health cost/person. This was interpreted as
suggesting that, for many people, existing and previously neglected health issues
were addressed in the first 12 months of support resulting in an increase in health
service access for some. This subsequently reduced in the second year of support as
their health situation stabilised.
This issue should be examined further when health service data for this complete
cohort becomes available for the second and third year after entering a tenancy. This
will provide a balanced six-year data window for the three years prior and the three
years after tenancies commence, allowing trend analysis of access to services in
these periods. Future research should also consider the linking of health, housing and
homelessness administrative data.
4.5 Frequency and duration of health service use
Further analysis was undertaken with the subsample of participants who had used the
seven health services before and/or after entering their public housing tenancy to look
at the frequency of use (number of presentations annually in the case of emergency
departments); duration of use (computed as average annual days of service use) for
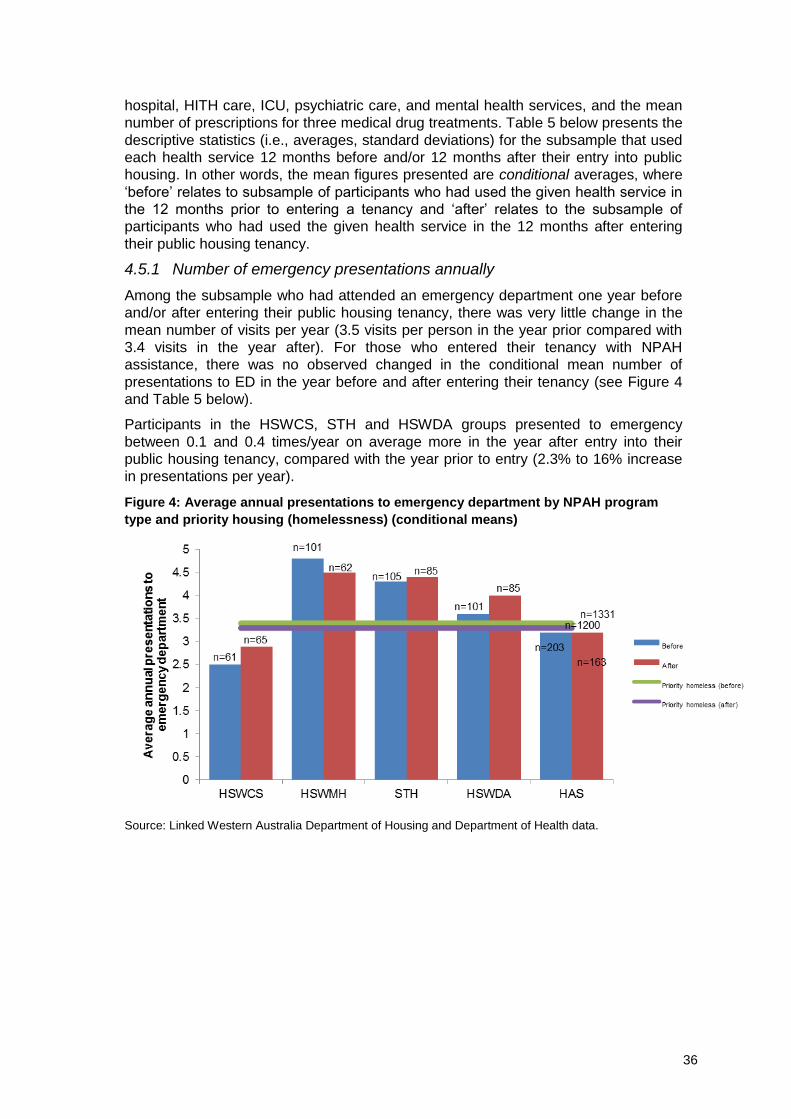
36
hospital, HITH care, ICU, psychiatric care, and mental health services, and the mean
number of prescriptions for three medical drug treatments. Table 5 below presents the
descriptive statistics (i.e., averages, standard deviations) for the subsample that used
each health service 12 months before and/or 12 months after their entry into public
housing. In other words, the mean figures presented are conditional averages, where
‘before’ relates to subsample of participants who had used the given health service in
the 12 months prior to entering a tenancy and ‘after’ relates to the subsample of
participants who had used the given health service in the 12 months after entering
their public housing tenancy.
4.5.1 Number of emergency presentations annually
Among the subsample who had attended an emergency department one year before
and/or after entering their public housing tenancy, there was very little change in the
mean number of visits per year (3.5 visits per person in the year prior compared with
3.4 visits in the year after). For those who entered their tenancy with NPAH
assistance, there was no observed changed in the conditional mean number of
presentations to ED in the year before and after entering their tenancy (see Figure 4
and Table 5 below).
Participants in the HSWCS, STH and HSWDA groups presented to emergency
between 0.1 and 0.4 times/year on average more in the year after entry into their
public housing tenancy, compared with the year prior to entry (2.3% to 16% increase
in presentations per year).
Figure 4: Average annual presentations to emergency department by NPAH program
type and priority housing (homelessness) (conditional means)
Source: Linked Western Australia Department of Housing and Department of Health data.
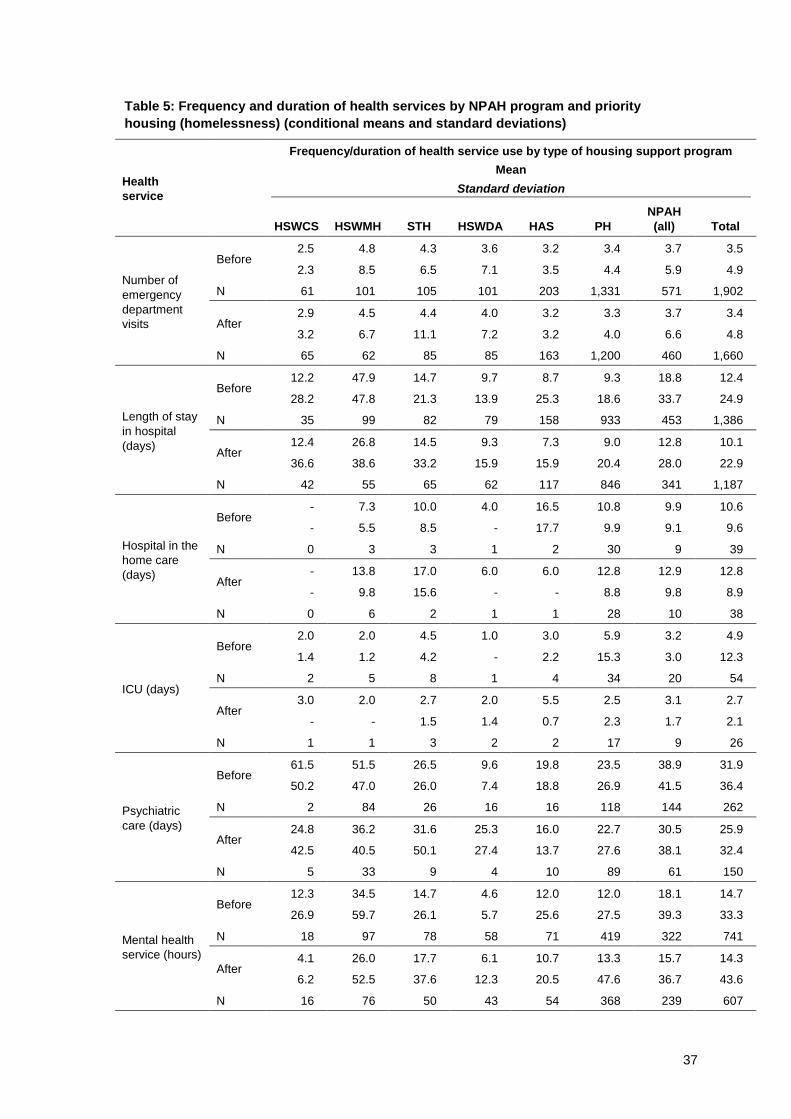
37
Table 5: Frequency and duration of health services by NPAH program and priority
housing (homelessness) (conditional means and standard deviations)
Health
service
Frequency/duration of health service use by type of housing support program
Mean
Standard deviation
HSWCS HSWMH STH HSWDA HAS PH
NPAH
(all) Total
Number of
emergency
department
visits
Before 2.5 4.8 4.3 3.6 3.2 3.4 3.7 3.5
2.3 8.5 6.5 7.1 3.5 4.4 5.9 4.9
N 61 101 105 101 203 1,331 571 1,902
After 2.9 4.5 4.4 4.0 3.2 3.3 3.7 3.4
3.2 6.7 11.1 7.2 3.2 4.0 6.6 4.8
N 65 62 85 85 163 1,200 460 1,660
Length of stay
in hospital
(days)
Before 12.2 47.9 14.7 9.7 8.7 9.3 18.8 12.4
28.2 47.8 21.3 13.9 25.3 18.6 33.7 24.9
N 35 99 82 79 158 933 453 1,386
After 12.4 26.8 14.5 9.3 7.3 9.0 12.8 10.1
36.6 38.6 33.2 15.9 15.9 20.4 28.0 22.9
N 42 55 65 62 117 846 341 1,187
Hospital in the
home care
(days)
Before - 7.3 10.0 4.0 16.5 10.8 9.9 10.6
- 5.5 8.5 - 17.7 9.9 9.1 9.6
N 0 3 3 1 2 30 9 39
After - 13.8 17.0 6.0 6.0 12.8 12.9 12.8
- 9.8 15.6 - - 8.8 9.8 8.9
N 0 6 2 1 1 28 10 38
ICU (days)
Before 2.0 2.0 4.5 1.0 3.0 5.9 3.2 4.9
1.4 1.2 4.2 - 2.2 15.3 3.0 12.3
N 2 5 8 1 4 34 20 54
After 3.0 2.0 2.7 2.0 5.5 2.5 3.1 2.7
- - 1.5 1.4 0.7 2.3 1.7 2.1
N 1 1 3 2 2 17 9 26
Psychiatric
care (days)
Before 61.5 51.5 26.5 9.6 19.8 23.5 38.9 31.9
50.2 47.0 26.0 7.4 18.8 26.9 41.5 36.4
N 2 84 26 16 16 118 144 262
After 24.8 36.2 31.6 25.3 16.0 22.7 30.5 25.9
42.5 40.5 50.1 27.4 13.7 27.6 38.1 32.4
N 5 33 9 4 10 89 61 150
Mental health
service (hours)
Before 12.3 34.5 14.7 4.6 12.0 12.0 18.1 14.7
26.9 59.7 26.1 5.7 25.6 27.5 39.3 33.3
N 18 97 78 58 71 419 322 741
After 4.1 26.0 17.7 6.1 10.7 13.3 15.7 14.3
6.2 52.5 37.6 12.3 20.5 47.6 36.7 43.6
N 16 76 50 43 54 368 239 607
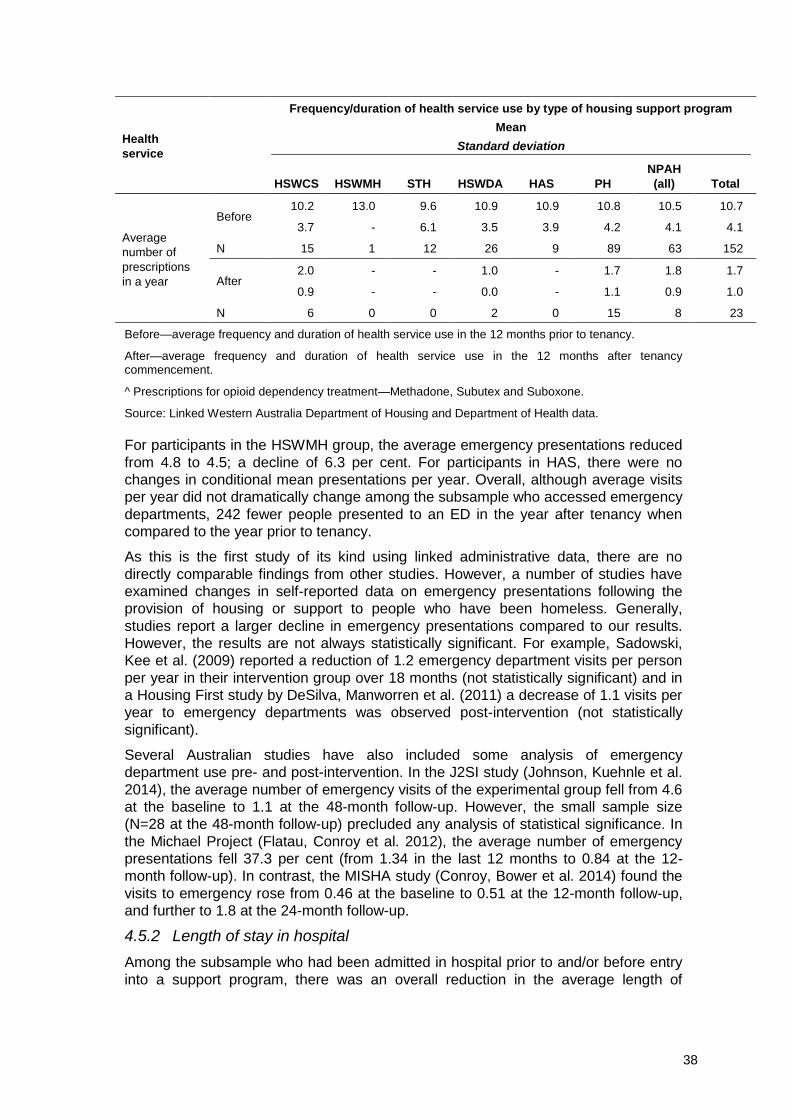
38
Health
service
Frequency/duration of health service use by type of housing support program
Mean
Standard deviation
HSWCS HSWMH STH HSWDA HAS PH
NPAH
(all) Total
Average
number of
prescriptions
in a year
Before 10.2 13.0 9.6 10.9 10.9 10.8 10.5 10.7
3.7 - 6.1 3.5 3.9 4.2 4.1 4.1
N 15 1 12 26 9 89 63 152
After 2.0 - - 1.0 - 1.7 1.8 1.7
0.9 - - 0.0 - 1.1 0.9 1.0
N 6 0 0 2 0 15 8 23
Before—average frequency and duration of health service use in the 12 months prior to tenancy.
After—average frequency and duration of health service use in the 12 months after tenancy commencement.
^ Prescriptions for opioid dependency treatment—Methadone, Subutex and Suboxone.
Source: Linked Western Australia Department of Housing and Department of Health data.
For participants in the HSWMH group, the average emergency presentations reduced
from 4.8 to 4.5; a decline of 6.3 per cent. For participants in HAS, there were no
changes in conditional mean presentations per year. Overall, although average visits
per year did not dramatically change among the subsample who accessed emergency
departments, 242 fewer people presented to an ED in the year after tenancy when
compared to the year prior to tenancy.
As this is the first study of its kind using linked administrative data, there are no
directly comparable findings from other studies. However, a number of studies have
examined changes in self-reported data on emergency presentations following the
provision of housing or support to people who have been homeless. Generally,
studies report a larger decline in emergency presentations compared to our results.
However, the results are not always statistically significant. For example, Sadowski,
Kee et al. (2009) reported a reduction of 1.2 emergency department visits per person
per year in their intervention group over 18 months (not statistically significant) and in
a Housing First study by DeSilva, Manworren et al. (2011) a decrease of 1.1 visits per
year to emergency departments was observed post-intervention (not statistically
significant).
Several Australian studies have also included some analysis of emergency
department use pre- and post-intervention. In the J2SI study (Johnson, Kuehnle et al.
2014), the average number of emergency visits of the experimental group fell from 4.6
at the baseline to 1.1 at the 48-month follow-up. However, the small sample size
(N=28 at the 48-month follow-up) precluded any analysis of statistical significance. In
the Michael Project (Flatau, Conroy et al. 2012), the average number of emergency
presentations fell 37.3 per cent (from 1.34 in the last 12 months to 0.84 at the 12-
month follow-up). In contrast, the MISHA study (Conroy, Bower et al. 2014) found the
visits to emergency rose from 0.46 at the baseline to 0.51 at the 12-month follow-up,
and further to 1.8 at the 24-month follow-up.
4.5.2 Length of stay in hospital
Among the subsample who had been admitted in hospital prior to and/or before entry
into a support program, there was an overall reduction in the average length of
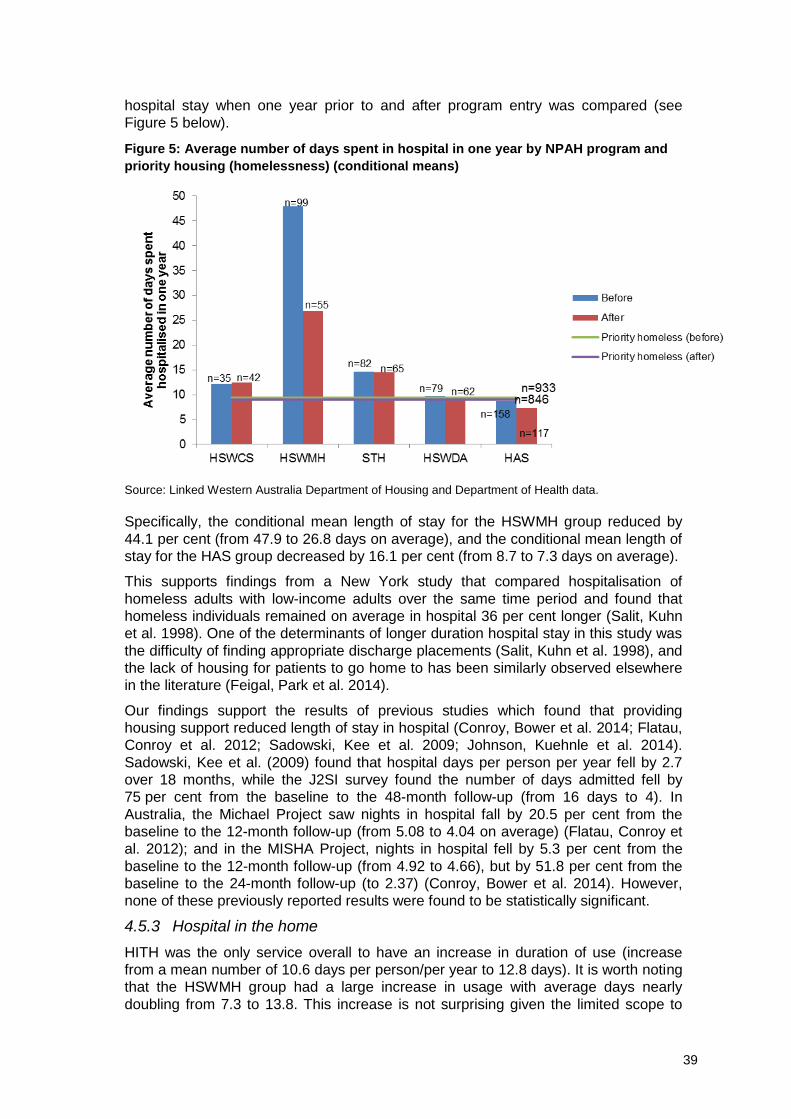
39
hospital stay when one year prior to and after program entry was compared (see
Figure 5 below).
Figure 5: Average number of days spent in hospital in one year by NPAH program and
priority housing (homelessness) (conditional means)
Source: Linked Western Australia Department of Housing and Department of Health data.
Specifically, the conditional mean length of stay for the HSWMH group reduced by
44.1 per cent (from 47.9 to 26.8 days on average), and the conditional mean length of
stay for the HAS group decreased by 16.1 per cent (from 8.7 to 7.3 days on average).
This supports findings from a New York study that compared hospitalisation of
homeless adults with low-income adults over the same time period and found that
homeless individuals remained on average in hospital 36 per cent longer (Salit, Kuhn
et al. 1998). One of the determinants of longer duration hospital stay in this study was
the difficulty of finding appropriate discharge placements (Salit, Kuhn et al. 1998), and
the lack of housing for patients to go home to has been similarly observed elsewhere
in the literature (Feigal, Park et al. 2014).
Our findings support the results of previous studies which found that providing
housing support reduced length of stay in hospital (Conroy, Bower et al. 2014; Flatau,
Conroy et al. 2012; Sadowski, Kee et al. 2009; Johnson, Kuehnle et al. 2014).
Sadowski, Kee et al. (2009) found that hospital days per person per year fell by 2.7
over 18 months, while the J2SI survey found the number of days admitted fell by
75 per cent from the baseline to the 48-month follow-up (from 16 days to 4). In
Australia, the Michael Project saw nights in hospital fall by 20.5 per cent from the
baseline to the 12-month follow-up (from 5.08 to 4.04 on average) (Flatau, Conroy et
al. 2012); and in the MISHA Project, nights in hospital fell by 5.3 per cent from the
baseline to the 12-month follow-up (from 4.92 to 4.66), but by 51.8 per cent from the
baseline to the 24-month follow-up (to 2.37) (Conroy, Bower et al. 2014). However,
none of these previously reported results were found to be statistically significant.
4.5.3 Hospital in the home
HITH was the only service overall to have an increase in duration of use (increase
from a mean number of 10.6 days per person/per year to 12.8 days). It is worth noting
that the HSWMH group had a large increase in usage with average days nearly
doubling from 7.3 to 13.8. This increase is not surprising given the limited scope to
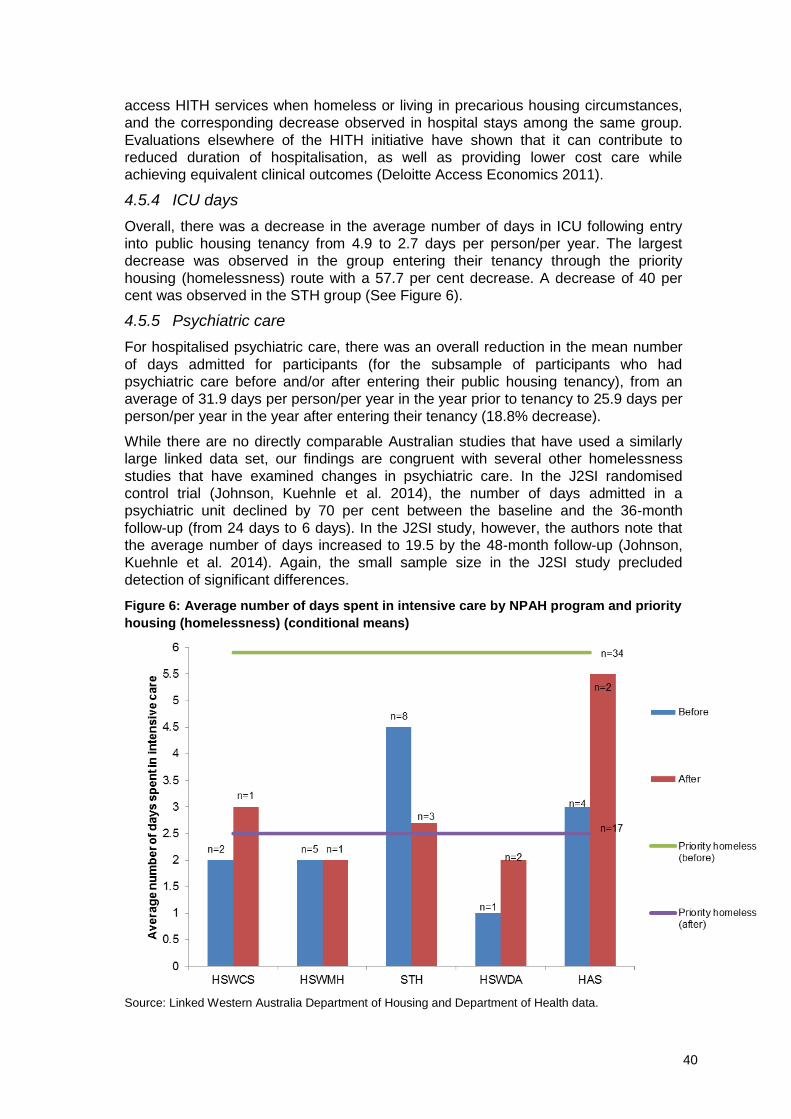
40
access HITH services when homeless or living in precarious housing circumstances,
and the corresponding decrease observed in hospital stays among the same group.
Evaluations elsewhere of the HITH initiative have shown that it can contribute to
reduced duration of hospitalisation, as well as providing lower cost care while
achieving equivalent clinical outcomes (Deloitte Access Economics 2011).
4.5.4 ICU days
Overall, there was a decrease in the average number of days in ICU following entry
into public housing tenancy from 4.9 to 2.7 days per person/per year. The largest
decrease was observed in the group entering their tenancy through the priority
housing (homelessness) route with a 57.7 per cent decrease. A decrease of 40 per
cent was observed in the STH group (See Figure 6).
4.5.5 Psychiatric care
For hospitalised psychiatric care, there was an overall reduction in the mean number
of days admitted for participants (for the subsample of participants who had
psychiatric care before and/or after entering their public housing tenancy), from an
average of 31.9 days per person/per year in the year prior to tenancy to 25.9 days per
person/per year in the year after entering their tenancy (18.8% decrease).
While there are no directly comparable Australian studies that have used a similarly
large linked data set, our findings are congruent with several other homelessness
studies that have examined changes in psychiatric care. In the J2SI randomised
control trial (Johnson, Kuehnle et al. 2014), the number of days admitted in a
psychiatric unit declined by 70 per cent between the baseline and the 36-month
follow-up (from 24 days to 6 days). In the J2SI study, however, the authors note that
the average number of days increased to 19.5 by the 48-month follow-up (Johnson,
Kuehnle et al. 2014). Again, the small sample size in the J2SI study precluded
detection of significant differences.
Figure 6: Average number of days spent in intensive care by NPAH program and priority
housing (homelessness) (conditional means)
Source: Linked Western Australia Department of Housing and Department of Health data.
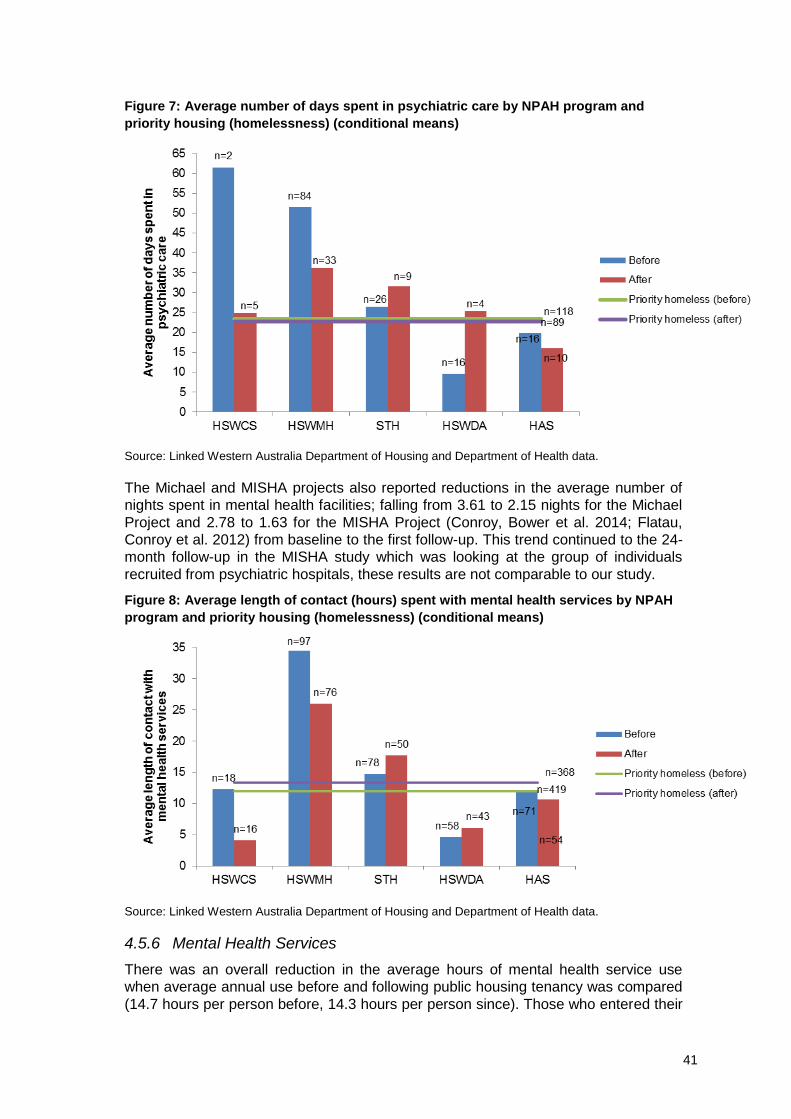
41
Figure 7: Average number of days spent in psychiatric care by NPAH program and
priority housing (homelessness) (conditional means)
Source: Linked Western Australia Department of Housing and Department of Health data.
The Michael and MISHA projects also reported reductions in the average number of
nights spent in mental health facilities; falling from 3.61 to 2.15 nights for the Michael
Project and 2.78 to 1.63 for the MISHA Project (Conroy, Bower et al. 2014; Flatau,
Conroy et al. 2012) from baseline to the first follow-up. This trend continued to the 24-
month follow-up in the MISHA study which was looking at the group of individuals
recruited from psychiatric hospitals, these results are not comparable to our study.
Figure 8: Average length of contact (hours) spent with mental health services by NPAH
program and priority housing (homelessness) (conditional means)
Source: Linked Western Australia Department of Housing and Department of Health data.
4.5.6 Mental Health Services
There was an overall reduction in the average hours of mental health service use
when average annual use before and following public housing tenancy was compared
(14.7 hours per person before, 14.3 hours per person since). Those who entered their
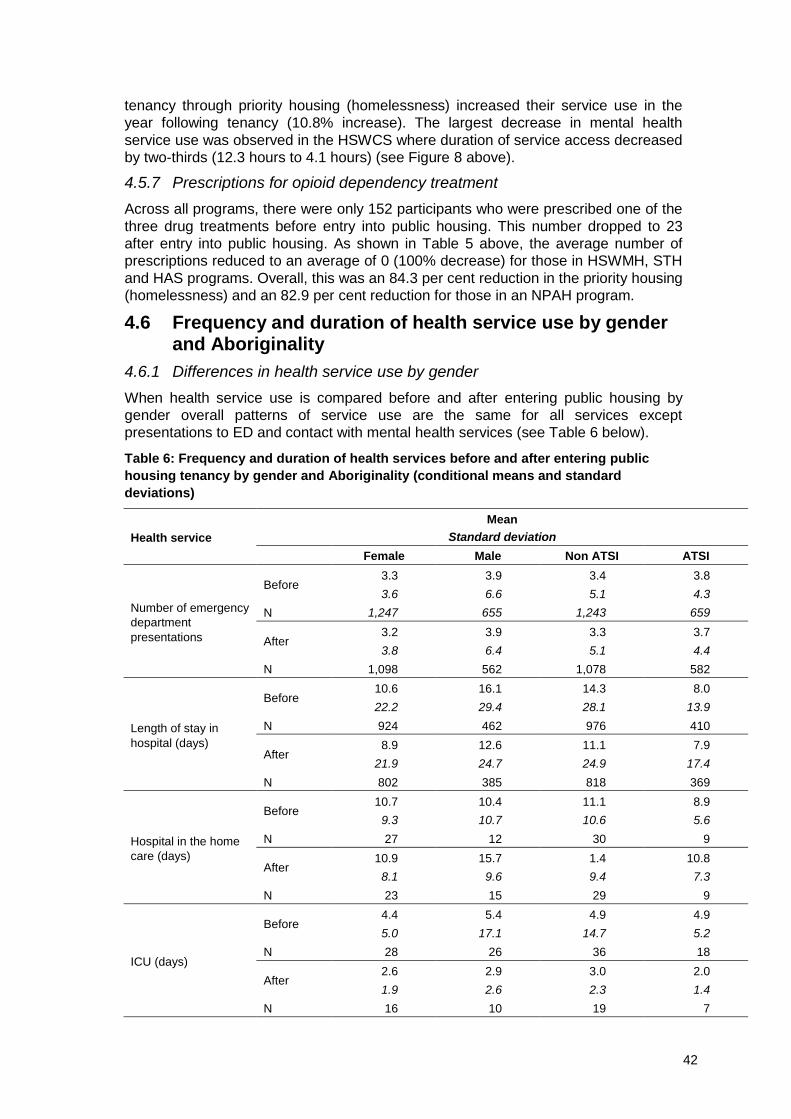
42
tenancy through priority housing (homelessness) increased their service use in the
year following tenancy (10.8% increase). The largest decrease in mental health
service use was observed in the HSWCS where duration of service access decreased
by two-thirds (12.3 hours to 4.1 hours) (see Figure 8 above).
4.5.7 Prescriptions for opioid dependency treatment
Across all programs, there were only 152 participants who were prescribed one of the
three drug treatments before entry into public housing. This number dropped to 23
after entry into public housing. As shown in Table 5 above, the average number of
prescriptions reduced to an average of 0 (100% decrease) for those in HSWMH, STH
and HAS programs. Overall, this was an 84.3 per cent reduction in the priority housing
(homelessness) and an 82.9 per cent reduction for those in an NPAH program.
4.6 Frequency and duration of health service use by gender and Aboriginality
4.6.1 Differences in health service use by gender
When health service use is compared before and after entering public housing by
gender overall patterns of service use are the same for all services except
presentations to ED and contact with mental health services (see Table 6 below).
Table 6: Frequency and duration of health services before and after entering public
housing tenancy by gender and Aboriginality (conditional means and standard
deviations)
Health service
Mean
Standard deviation
Female Male Non ATSI ATSI
Number of emergency
department
presentations
Before 3.3 3.9 3.4 3.8
3.6 6.6 5.1 4.3
N 1,247 655 1,243 659
After 3.2 3.9 3.3 3.7
3.8 6.4 5.1 4.4
N 1,098 562 1,078 582
Length of stay in
hospital (days)
Before 10.6 16.1 14.3 8.0
22.2 29.4 28.1 13.9
N 924 462 976 410
After 8.9 12.6 11.1 7.9
21.9 24.7 24.9 17.4
N 802 385 818 369
Hospital in the home
care (days)
Before 10.7 10.4 11.1 8.9
9.3 10.7 10.6 5.6
N 27 12 30 9
After 10.9 15.7 1.4 10.8
8.1 9.6 9.4 7.3
N 23 15 29 9
ICU (days)
Before 4.4 5.4 4.9 4.9
5.0 17.1 14.7 5.2
N 28 26 36 18
After 2.6 2.9 3.0 2.0
1.9 2.6 2.3 1.4
N 16 10 19 7
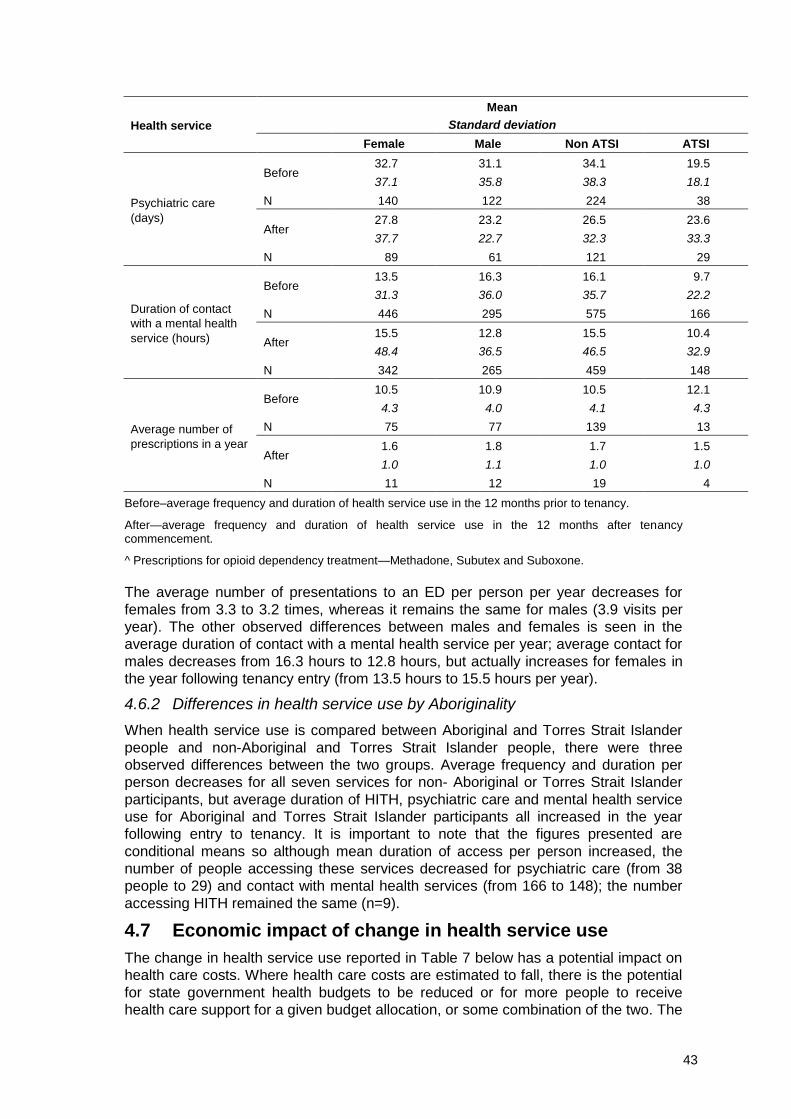
43
Health service
Mean
Standard deviation
Female Male Non ATSI ATSI
Psychiatric care
(days)
Before 32.7 31.1 34.1 19.5
37.1 35.8 38.3 18.1
N 140 122 224 38
After 27.8 23.2 26.5 23.6
37.7 22.7 32.3 33.3
N 89 61 121 29
Duration of contact
with a mental health
service (hours)
Before 13.5 16.3 16.1 9.7
31.3 36.0 35.7 22.2
N 446 295 575 166
After 15.5 12.8 15.5 10.4
48.4 36.5 46.5 32.9
N 342 265 459 148
Average number of
prescriptions in a year
Before 10.5 10.9 10.5 12.1
4.3 4.0 4.1 4.3
N 75 77 139 13
After 1.6 1.8 1.7 1.5
1.0 1.1 1.0 1.0
N 11 12 19 4
Before–average frequency and duration of health service use in the 12 months prior to tenancy.
After—average frequency and duration of health service use in the 12 months after tenancy commencement.
^ Prescriptions for opioid dependency treatment—Methadone, Subutex and Suboxone.
The average number of presentations to an ED per person per year decreases for
females from 3.3 to 3.2 times, whereas it remains the same for males (3.9 visits per
year). The other observed differences between males and females is seen in the
average duration of contact with a mental health service per year; average contact for
males decreases from 16.3 hours to 12.8 hours, but actually increases for females in
the year following tenancy entry (from 13.5 hours to 15.5 hours per year).
4.6.2 Differences in health service use by Aboriginality
When health service use is compared between Aboriginal and Torres Strait Islander
people and non-Aboriginal and Torres Strait Islander people, there were three
observed differences between the two groups. Average frequency and duration per
person decreases for all seven services for non- Aboriginal or Torres Strait Islander
participants, but average duration of HITH, psychiatric care and mental health service
use for Aboriginal and Torres Strait Islander participants all increased in the year
following entry to tenancy. It is important to note that the figures presented are
conditional means so although mean duration of access per person increased, the
number of people accessing these services decreased for psychiatric care (from 38
people to 29) and contact with mental health services (from 166 to 148); the number
accessing HITH remained the same (n=9).
4.7 Economic impact of change in health service use
The change in health service use reported in Table 7 below has a potential impact on
health care costs. Where health care costs are estimated to fall, there is the potential
for state government health budgets to be reduced or for more people to receive
health care support for a given budget allocation, or some combination of the two. The
44
potential change in health service costs from the year prior to entering a tenancy to
the year after is determined for selected services; emergency presentation, days in
hospital and days in psychiatric care. These are the three cost areas that have been
shown in other studies to have the largest economic impact due to the high cost of
each episode of care and the comparatively wide use of these services by the
homeless (Flatau, Conroy et al. 2012; Conroy, Bower et al. 2014; Zaretzky and Flatau
2013). They are also three areas where comparison of the proportion of people
accessing health services in the year prior to and after entering a tenancy shows a
significant change.
In total, the change in the use of these three services results in a combined cost offset
across all services of $16,394,449 or $4,846 per person/year (across all people in the
sample). When priority housing (homelessness) tenants are excluded from the
analysis, the change per person is a much larger $13,273/person/year. This large cost
offset relates predominantly to the HSWMH Health group, where the offsets amounted
to $84,135/person/year.
Analysis of the linked administrative data shows that provision of housing leads to a
significant reduction in the proportion of people accessing the emergency department
for both NPAH and priority housing (homelessness) (19.4% and 9.9% decrease
respectively). Overcrowding is one of the most serious problems and also the most
avoidable cause of harm that faces our hospital system (Fatovich and Hirsch 2003;
Richardson and Mountain 2009). The greatest contributing factor is access block,
which is the inability to provide patients with a bed in a timely fashion (>8 hours total
in the ED) (Fatovich and Hirsch 2003; Richardson and Mountain 2009). Given that
overcrowding in ED can lead to reduced quality of care and to poorer patient
outcomes (Richardson and Mountain 2009), providing housing has the potential to
reduce overcrowding, thus freeing up beds and resources to provide a higher quality
care to other patients.
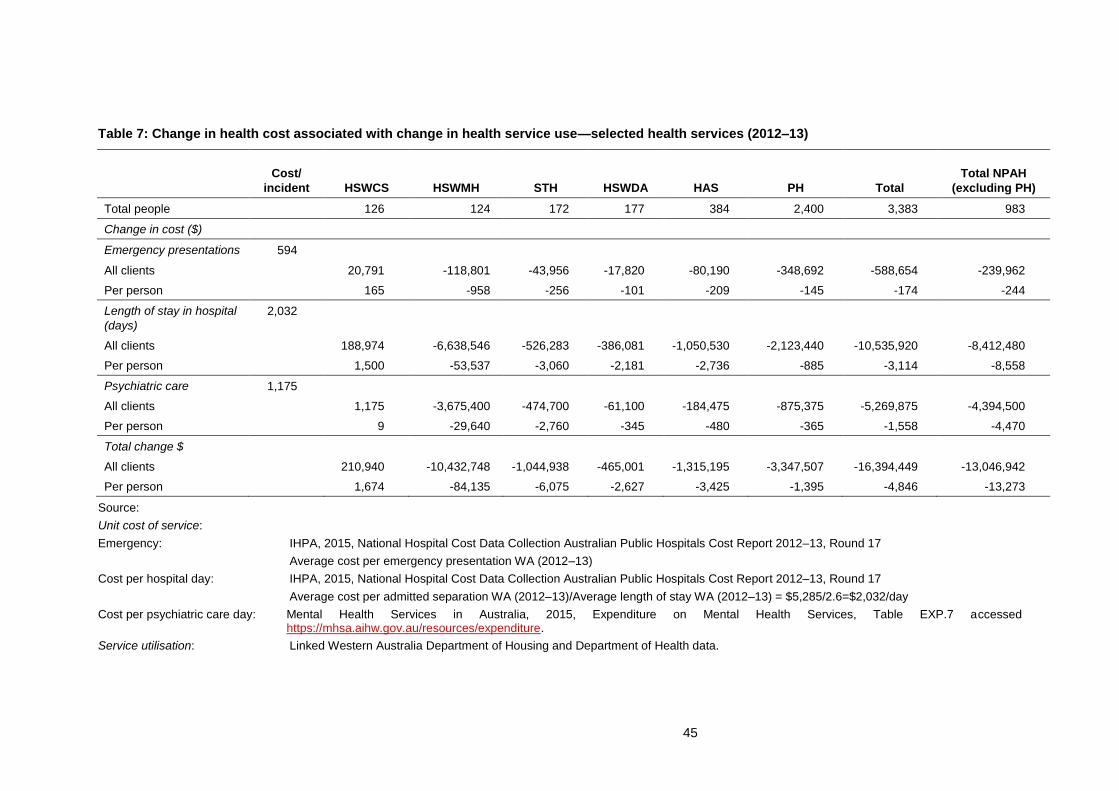
45
Table 7: Change in health cost associated with change in health service use—selected health services (2012–13)
Cost/
incident HSWCS HSWMH STH HSWDA HAS PH Total
Total NPAH
(excluding PH)
Total people
126 124 172 177 384 2,400 3,383 983
Change in cost ($)
Emergency presentations 594
All clients 20,791 -118,801 -43,956 -17,820 -80,190 -348,692 -588,654 -239,962
Per person 165 -958 -256 -101 -209 -145 -174 -244
Length of stay in hospital
(days)
2,032
All clients 188,974 -6,638,546 -526,283 -386,081 -1,050,530 -2,123,440 -10,535,920 -8,412,480
Per person 1,500 -53,537 -3,060 -2,181 -2,736 -885 -3,114 -8,558
Psychiatric care 1,175
All clients 1,175 -3,675,400 -474,700 -61,100 -184,475 -875,375 -5,269,875 -4,394,500
Per person 9 -29,640 -2,760 -345 -480 -365 -1,558 -4,470
Total change $
All clients 210,940 -10,432,748 -1,044,938 -465,001 -1,315,195 -3,347,507 -16,394,449 -13,046,942
Per person 1,674 -84,135 -6,075 -2,627 -3,425 -1,395 -4,846 -13,273
Source:
Unit cost of service:
Emergency: IHPA, 2015, National Hospital Cost Data Collection Australian Public Hospitals Cost Report 2012–13, Round 17
Average cost per emergency presentation WA (2012–13)
Cost per hospital day: IHPA, 2015, National Hospital Cost Data Collection Australian Public Hospitals Cost Report 2012–13, Round 17
Average cost per admitted separation WA (2012–13)/Average length of stay WA (2012–13) = $5,285/2.6=$2,032/day
Cost per psychiatric care day: Mental Health Services in Australia, 2015, Expenditure on Mental Health Services, Table EXP.7 accessed https://mhsa.aihw.gov.au/resources/expenditure.
Service utilisation: Linked Western Australia Department of Housing and Department of Health data.
46
The STH program displayed the second largest cost decrease of $6,075/person/year.
The only program associated with an increase in costs is HSWCS, and this finding
should be interpreted with care. As discussed previously (Chapter 3), health services
provided in prison are not recorded in this health data and the cost of health services
used prior to the tenancy commencing is potentially underestimated. Consequently,
the total cost offset is potentially understated.
Stays in hospital and stays in psychiatric care account for the vast majority of cost
savings identified, being $3,114 and $1,558/person/year respectively. Again these
related primarily to the HSWMH program. The comparatively small decrease in the
cost of emergency presentations reflects the fact that although the proportion of
people who accessed emergency decreased significantly for those who did access
emergency in each period, on average across all programs there was only a very
small decrease in the mean frequency of visits from the year prior to entering a
tenancy to the year after, although there was some variation between programs.
Comparison of these health costs avoided for people supported by the NPAH
programs ($13,273/person/year 2012–13) (see Table 7 above) with the cost of
providing these programs suggests that on average the cost support is offset by
savings associated with reduced use of higher cost health services. Data is not
publically available to estimate the cost of NPAH support for 2012–13. Over the 2009–
12 period, the average cost of NPAH support for programs examined is estimated at
$6,462/person/year (Table 8 below). This is for all people supported under these
programs. As the health costs and support costs are from different periods they are
not directly comparable. Therefore it is not possible to estimate the cost of support net
of health cost offsets. However, the data does suggest that the average health costs
avoided as a result of people being housed and supported would substantially offset
the cost of support.
When considering individual programs, the cost of delivering the HSWMH program is
likely to be either totally or substantially offset by savings from health costs avoided.
No separate estimate is available for the annual cost of the HSWMH program. Table 8
below reports that the average cost/person/year for people assisted when leaving
child protection, correctional and health facilities was $8,646/person/year (2009–13).
Of the 571 people assisted by these programs only 11 per cent were leaving child
protection and an equivalent number of people were assisted under the health-related
and the correctional services program, suggesting that the cost/person for the
HSWMH health program is markedly less than the associated health costs avoided of
$84,135/person/year. A large positive impact on government budgets is associated
with this program.1 The cost of the STH, HAS and HSWDA programs would also be at
least partially offset by savings associated with health costs avoided.
It should be noted that health savings reported here relate to one year only. The
MISHA project (Conroy, Bower et al. 2014) found a large variation in change in health
costs in the first year after support and that in the second year of support, health costs
decreased for a substantial proportion of those people whose costs increased in the
first year after support. This suggests that the health savings reported here are likely
to at least continue into subsequent years and could potentially be larger.
The total cost of supported tenancies also includes the cost of providing social
housing; both recurrent and capital, and the costs associated with evictions if these
tenancies fail. These issues are considered in the first report of this study (Zaretzky
1 Number of people assisted 2009–12: assistance leaving child protection services, 64; assistance
leaving correctional facilities, 255; assistance leaving mental health facilities, 252. Total people assisted 571.
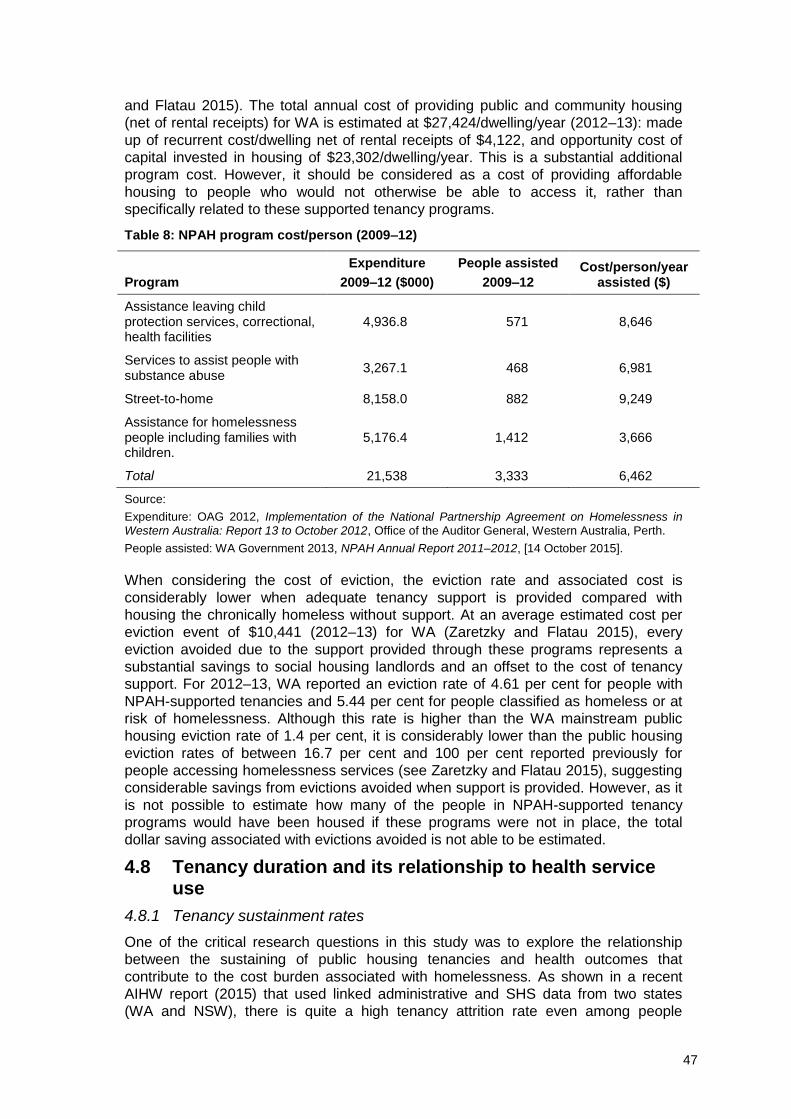
47
and Flatau 2015). The total annual cost of providing public and community housing
(net of rental receipts) for WA is estimated at $27,424/dwelling/year (2012–13): made
up of recurrent cost/dwelling net of rental receipts of $4,122, and opportunity cost of
capital invested in housing of $23,302/dwelling/year. This is a substantial additional
program cost. However, it should be considered as a cost of providing affordable
housing to people who would not otherwise be able to access it, rather than
specifically related to these supported tenancy programs.
Table 8: NPAH program cost/person (2009–12)
Program
Expenditure
2009–12 ($000)
People assisted
2009–12 Cost/person/year
assisted ($)
Assistance leaving child protection services, correctional, health facilities
4,936.8 571 8,646
Services to assist people with substance abuse
3,267.1 468 6,981
Street-to-home 8,158.0 882 9,249
Assistance for homelessness people including families with children.
5,176.4 1,412 3,666
Total 21,538 3,333 6,462
Source:
Expenditure: OAG 2012, Implementation of the National Partnership Agreement on Homelessness in Western Australia: Report 13 to October 2012, Office of the Auditor General, Western Australia, Perth.
People assisted: WA Government 2013, NPAH Annual Report 2011–2012, [14 October 2015].
When considering the cost of eviction, the eviction rate and associated cost is
considerably lower when adequate tenancy support is provided compared with
housing the chronically homeless without support. At an average estimated cost per
eviction event of $10,441 (2012–13) for WA (Zaretzky and Flatau 2015), every
eviction avoided due to the support provided through these programs represents a
substantial savings to social housing landlords and an offset to the cost of tenancy
support. For 2012–13, WA reported an eviction rate of 4.61 per cent for people with
NPAH-supported tenancies and 5.44 per cent for people classified as homeless or at
risk of homelessness. Although this rate is higher than the WA mainstream public
housing eviction rate of 1.4 per cent, it is considerably lower than the public housing
eviction rates of between 16.7 per cent and 100 per cent reported previously for
people accessing homelessness services (see Zaretzky and Flatau 2015), suggesting
considerable savings from evictions avoided when support is provided. However, as it
is not possible to estimate how many of the people in NPAH-supported tenancy
programs would have been housed if these programs were not in place, the total
dollar saving associated with evictions avoided is not able to be estimated.
4.8 Tenancy duration and its relationship to health service use
4.8.1 Tenancy sustainment rates
One of the critical research questions in this study was to explore the relationship
between the sustaining of public housing tenancies and health outcomes that
contribute to the cost burden associated with homelessness. As shown in a recent
AIHW report (2015) that used linked administrative and SHS data from two states
(WA and NSW), there is quite a high tenancy attrition rate even among people
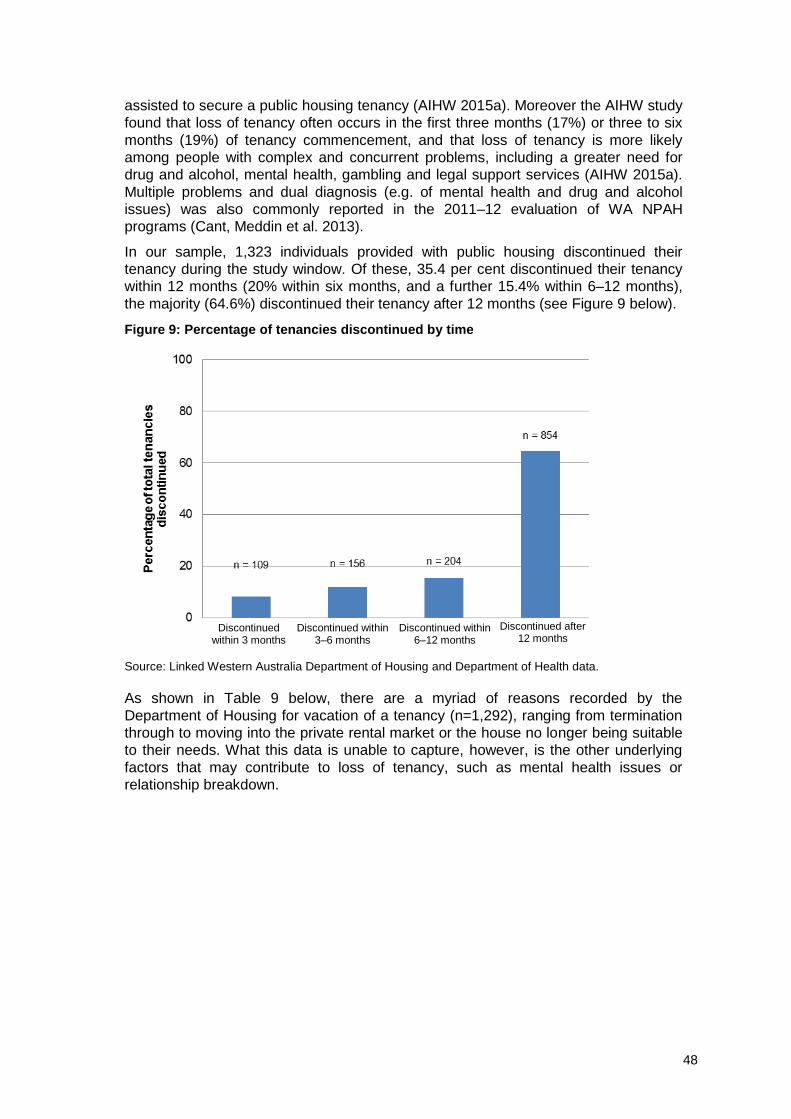
48
assisted to secure a public housing tenancy (AIHW 2015a). Moreover the AIHW study
found that loss of tenancy often occurs in the first three months (17%) or three to six
months (19%) of tenancy commencement, and that loss of tenancy is more likely
among people with complex and concurrent problems, including a greater need for
drug and alcohol, mental health, gambling and legal support services (AIHW 2015a).
Multiple problems and dual diagnosis (e.g. of mental health and drug and alcohol
issues) was also commonly reported in the 2011–12 evaluation of WA NPAH
programs (Cant, Meddin et al. 2013).
In our sample, 1,323 individuals provided with public housing discontinued their
tenancy during the study window. Of these, 35.4 per cent discontinued their tenancy
within 12 months (20% within six months, and a further 15.4% within 6–12 months),
the majority (64.6%) discontinued their tenancy after 12 months (see Figure 9 below).
Figure 9: Percentage of tenancies discontinued by time
Source: Linked Western Australia Department of Housing and Department of Health data.
As shown in Table 9 below, there are a myriad of reasons recorded by the
Department of Housing for vacation of a tenancy (n=1,292), ranging from termination
through to moving into the private rental market or the house no longer being suitable
to their needs. What this data is unable to capture, however, is the other underlying
factors that may contribute to loss of tenancy, such as mental health issues or
relationship breakdown.
Discontinued within 3 months
Discontinued within 6–12 months
Discontinued after 12 months
Discontinued within 3–6 months
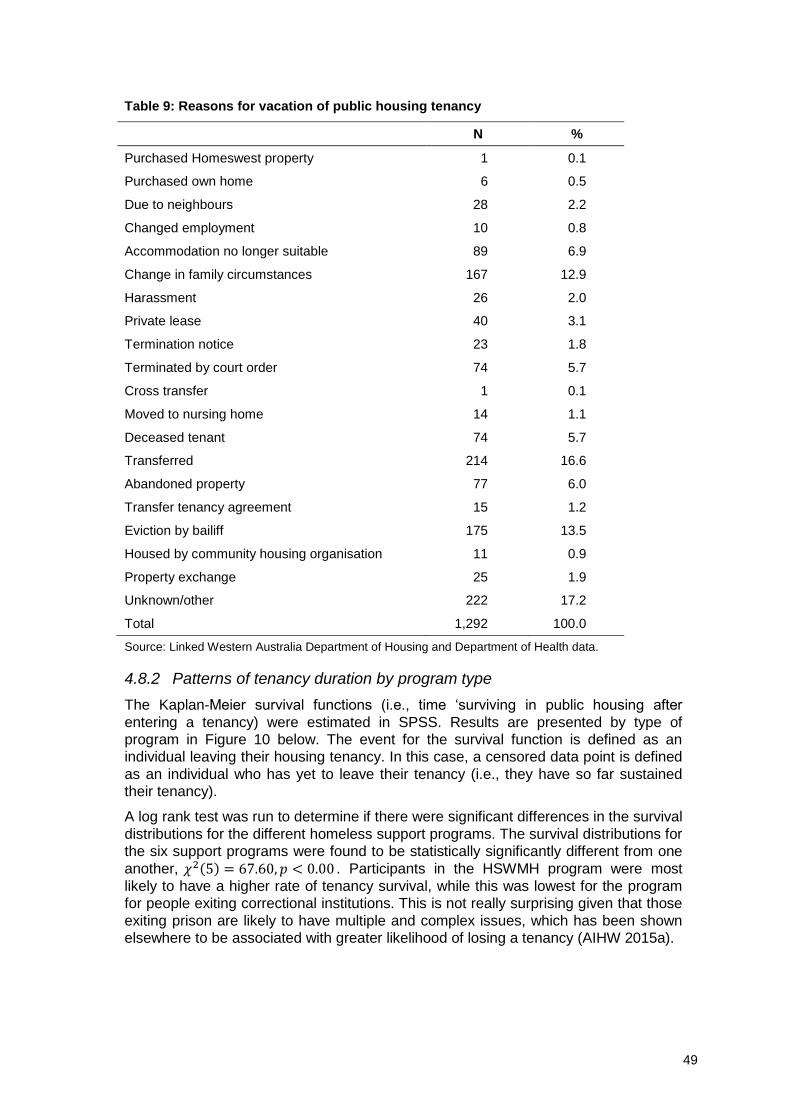
49
Table 9: Reasons for vacation of public housing tenancy
N %
Purchased Homeswest property 1 0.1
Purchased own home 6 0.5
Due to neighbours 28 2.2
Changed employment 10 0.8
Accommodation no longer suitable 89 6.9
Change in family circumstances 167 12.9
Harassment 26 2.0
Private lease 40 3.1
Termination notice 23 1.8
Terminated by court order 74 5.7
Cross transfer 1 0.1
Moved to nursing home 14 1.1
Deceased tenant 74 5.7
Transferred 214 16.6
Abandoned property 77 6.0
Transfer tenancy agreement 15 1.2
Eviction by bailiff 175 13.5
Housed by community housing organisation 11 0.9
Property exchange 25 1.9
Unknown/other 222 17.2
Total 1,292 100.0
Source: Linked Western Australia Department of Housing and Department of Health data.
4.8.2 Patterns of tenancy duration by program type
The Kaplan-Meier survival functions (i.e., time ‘surviving in public housing after
entering a tenancy) were estimated in SPSS. Results are presented by type of
program in Figure 10 below. The event for the survival function is defined as an
individual leaving their housing tenancy. In this case, a censored data point is defined
as an individual who has yet to leave their tenancy (i.e., they have so far sustained
their tenancy).
A log rank test was run to determine if there were significant differences in the survival
distributions for the different homeless support programs. The survival distributions for
the six support programs were found to be statistically significantly different from one
another, 𝜒2(5) = 67.60, 𝑝 < 0.00 . Participants in the HSWMH program were most
likely to have a higher rate of tenancy survival, while this was lowest for the program
for people exiting correctional institutions. This is not really surprising given that those
exiting prison are likely to have multiple and complex issues, which has been shown
elsewhere to be associated with greater likelihood of losing a tenancy (AIHW 2015a).
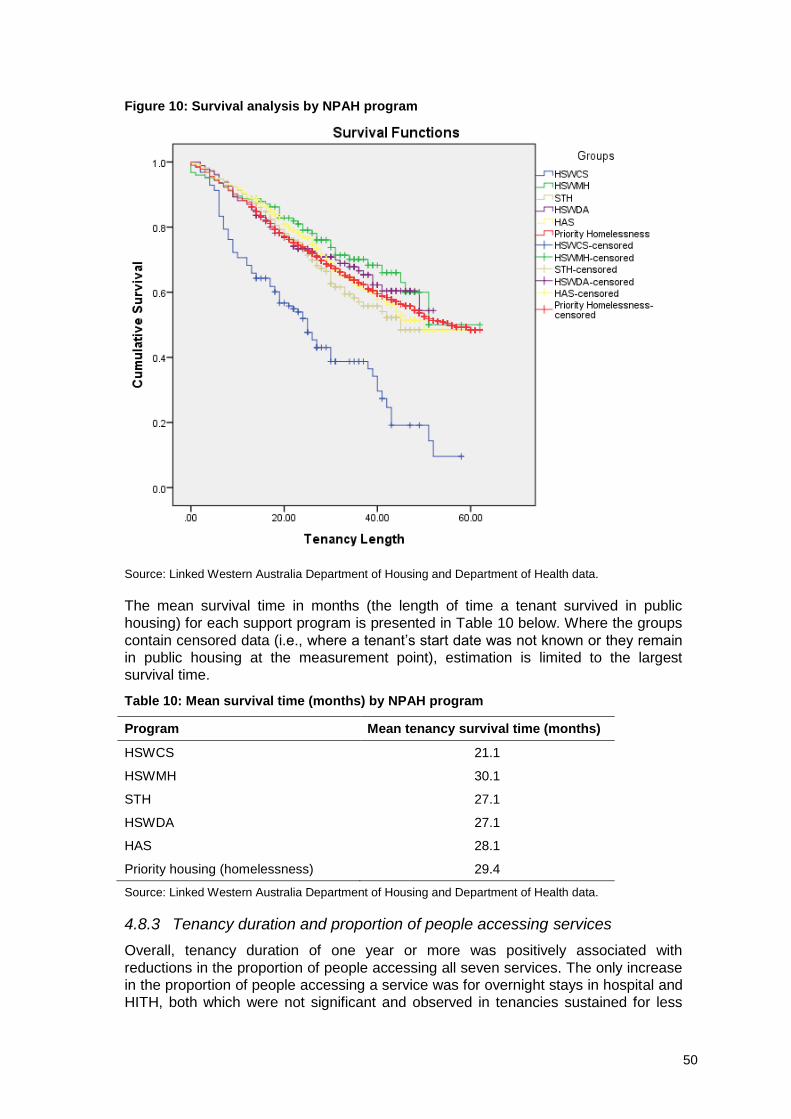
50
Figure 10: Survival analysis by NPAH program
Source: Linked Western Australia Department of Housing and Department of Health data.
The mean survival time in months (the length of time a tenant survived in public
housing) for each support program is presented in Table 10 below. Where the groups
contain censored data (i.e., where a tenant’s start date was not known or they remain
in public housing at the measurement point), estimation is limited to the largest
survival time.
Table 10: Mean survival time (months) by NPAH program
Program Mean tenancy survival time (months)
HSWCS 21.1
HSWMH 30.1
STH 27.1
HSWDA 27.1
HAS 28.1
Priority housing (homelessness) 29.4
Source: Linked Western Australia Department of Housing and Department of Health data.
4.8.3 Tenancy duration and proportion of people accessing services
Overall, tenancy duration of one year or more was positively associated with
reductions in the proportion of people accessing all seven services. The only increase
in the proportion of people accessing a service was for overnight stays in hospital and
HITH, both which were not significant and observed in tenancies sustained for less
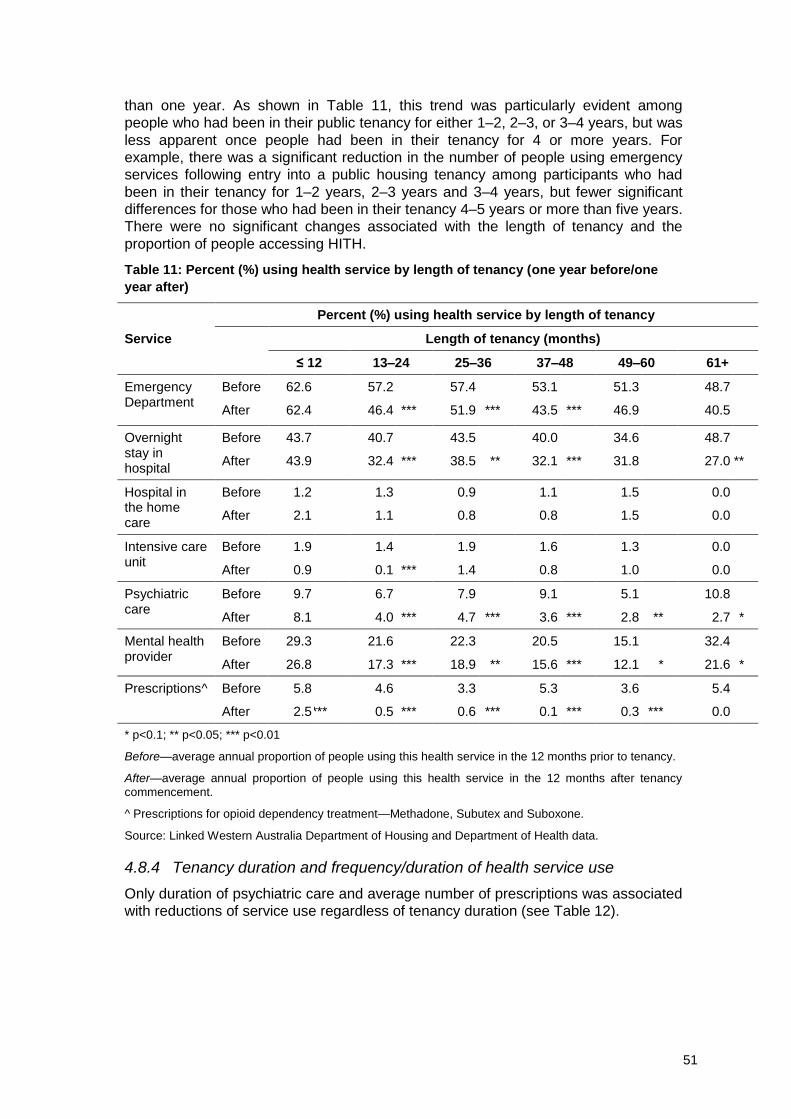
51
than one year. As shown in Table 11, this trend was particularly evident among
people who had been in their public tenancy for either 1–2, 2–3, or 3–4 years, but was
less apparent once people had been in their tenancy for 4 or more years. For
example, there was a significant reduction in the number of people using emergency
services following entry into a public housing tenancy among participants who had
been in their tenancy for 1–2 years, 2–3 years and 3–4 years, but fewer significant
differences for those who had been in their tenancy 4–5 years or more than five years.
There were no significant changes associated with the length of tenancy and the
proportion of people accessing HITH.
Table 11: Percent (%) using health service by length of tenancy (one year before/one
year after)
Percent (%) using health service by length of tenancy
Service Length of tenancy (months)
≤ 12 13–24 25–36 37–48 49–60 61+
Emergency Department
Before 62.6 57.2 57.4 53.1 51.3 48.7
After 62.4 46.4 *** 51.9 *** 43.5 *** 46.9 40.5
Overnight stay in hospital
Before 43.7 40.7 43.5 40.0 34.6 48.7
After 43.9 32.4 *** 38.5 ** 32.1 *** 31.8 27.0 **
Hospital in the home care
Before 1.2 1.3 0.9 1.1 1.5 0.0
After 2.1 1.1 0.8 0.8 1.5 0.0
Intensive care unit
Before 1.9 1.4 1.9 1.6 1.3 0.0
After 0.9 0.1 *** 1.4 0.8 1.0 0.0
Psychiatric care
Before 9.7 6.7 7.9 9.1 5.1 10.8
After 8.1 4.0 *** 4.7 *** 3.6 *** 2.8 ** 2.7 *
Mental health provider
Before 29.3 21.6 22.3 20.5 15.1 32.4
After 26.8 17.3 *** 18.9 ** 15.6 *** 12.1 * 21.6 *
Prescriptions^ Before 5.8 4.6 3.3 5.3 3.6 5.4
After 2.5 *** 0.5 *** 0.6 *** 0.1 *** 0.3 *** 0.0
* p<0.1; ** p<0.05; *** p<0.01
Before—average annual proportion of people using this health service in the 12 months prior to tenancy.
After—average annual proportion of people using this health service in the 12 months after tenancy commencement.
^ Prescriptions for opioid dependency treatment—Methadone, Subutex and Suboxone.
Source: Linked Western Australia Department of Housing and Department of Health data.
4.8.4 Tenancy duration and frequency/duration of health service use
Only duration of psychiatric care and average number of prescriptions was associated
with reductions of service use regardless of tenancy duration (see Table 12).
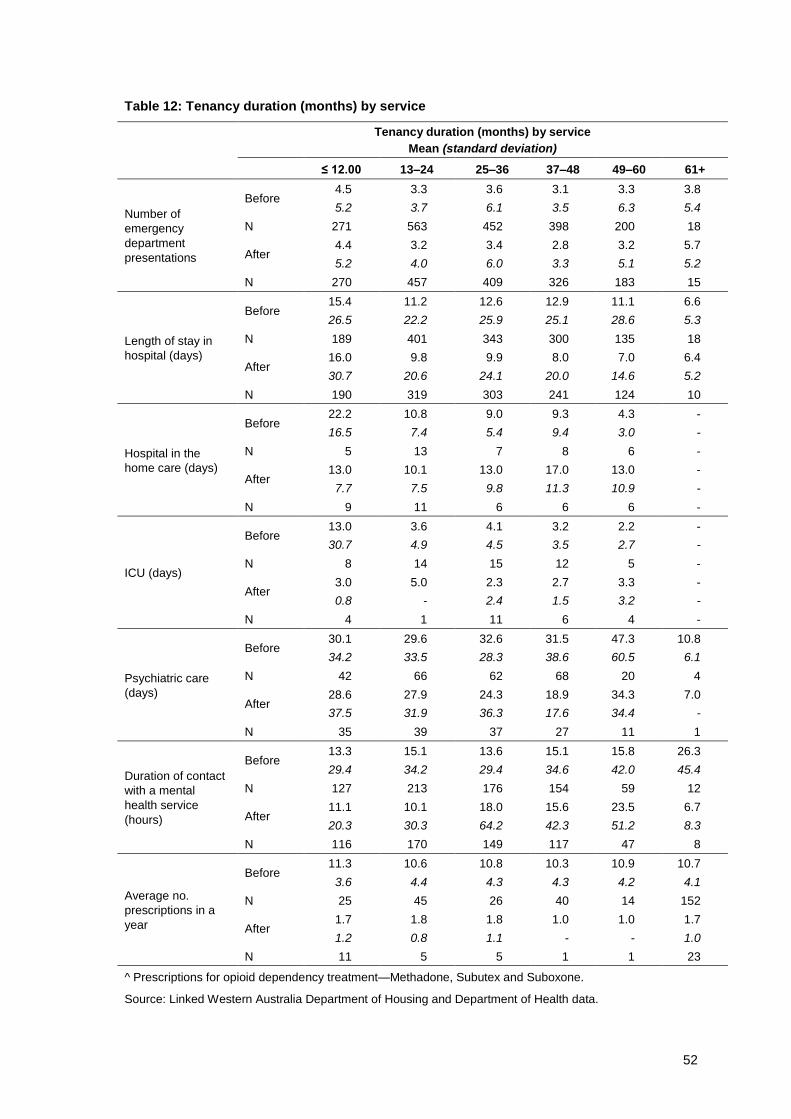
52
Table 12: Tenancy duration (months) by service
Tenancy duration (months) by service
Mean (standard deviation)
≤ 12.00 13–24 25–36 37–48 49–60 61+
Number of
emergency
department
presentations
Before 4.5 3.3 3.6 3.1 3.3 3.8
5.2 3.7 6.1 3.5 6.3 5.4
N 271 563 452 398 200 18
After 4.4 3.2 3.4 2.8 3.2 5.7
5.2 4.0 6.0 3.3 5.1 5.2
N 270 457 409 326 183 15
Length of stay in
hospital (days)
Before 15.4 11.2 12.6 12.9 11.1 6.6
26.5 22.2 25.9 25.1 28.6 5.3
N 189 401 343 300 135 18
After 16.0 9.8 9.9 8.0 7.0 6.4
30.7 20.6 24.1 20.0 14.6 5.2
N 190 319 303 241 124 10
Hospital in the
home care (days)
Before 22.2 10.8 9.0 9.3 4.3 -
16.5 7.4 5.4 9.4 3.0 -
N 5 13 7 8 6 -
After 13.0 10.1 13.0 17.0 13.0 -
7.7 7.5 9.8 11.3 10.9 -
N 9 11 6 6 6 -
ICU (days)
Before 13.0 3.6 4.1 3.2 2.2 -
30.7 4.9 4.5 3.5 2.7 -
N 8 14 15 12 5 -
After 3.0 5.0 2.3 2.7 3.3 -
0.8 - 2.4 1.5 3.2 -
N 4 1 11 6 4 -
Psychiatric care
(days)
Before 30.1 29.6 32.6 31.5 47.3 10.8
34.2 33.5 28.3 38.6 60.5 6.1
N 42 66 62 68 20 4
After 28.6 27.9 24.3 18.9 34.3 7.0
37.5 31.9 36.3 17.6 34.4 -
N 35 39 37 27 11 1
Duration of contact
with a mental
health service
(hours)
Before 13.3 15.1 13.6 15.1 15.8 26.3
29.4 34.2 29.4 34.6 42.0 45.4
N 127 213 176 154 59 12
After 11.1 10.1 18.0 15.6 23.5 6.7
20.3 30.3 64.2 42.3 51.2 8.3
N 116 170 149 117 47 8
Average no.
prescriptions in a
year
Before 11.3 10.6 10.8 10.3 10.9 10.7
3.6 4.4 4.3 4.3 4.2 4.1
N 25 45 26 40 14 152
After 1.7 1.8 1.8 1.0 1.0 1.7
1.2 0.8 1.1 - - 1.0
N 11 5 5 1 1 23
^ Prescriptions for opioid dependency treatment—Methadone, Subutex and Suboxone.
Source: Linked Western Australia Department of Housing and Department of Health data.
53
The average number of ED presentations per person per year reduced up until a
person had been in their tenancy for more than five years, where average ED
presentations increased by 50 per cent. It is important to note that there was only a
small sample of people accessing ED after being in a tenancy for more than five
years. A participant whose tenancy was 12 months or less was associated with an
increase in the length of overnight stays in hospital (increased from 15.4 days to 16
days per person per year). Tenancies sustained between one and two years were
associated with shorter durations of stay/frequencies of use of all services except for
days spent in ICU, which increased from 3.6 days to 5 days per person per year.
4.9 Summary
The linked administrative data provides detailed information about housing tenancies
and health service use for nearly 3,400 individuals, both NPAH program participants
(n=983) as well as those entering through priority housing (homelessness) (n=2,400).
The provision of public housing is shown to have a significant impact in reducing
health service use both in terms of the proportion of people using health services, and
the frequency and duration of health service use. There were significant reductions in
the proportions of people accessing the ED, staying overnight in hospital, spending
time in the ICU, psychiatric services and mental health services and the number of
people with prescriptions for opioid dependence. There were no significant increases
in the proportion of people accessing any of the seven services in any of the
programs.
Further analysis examined the changes in frequency or duration of health service use
within the subsamples of participants from each program who had accessed health
services either before or after entering their public housing tenancy. Overall, looking at
the whole sample of participants there was an average annual reduction in frequency
of use of all services in the relevant subsample with the exception of HITH after
entering a tenancy. Looking at those who entered through an NPAH program, there
were reductions in the average annual service use for all services except for average
annual ED visits where no change was observed and HITH where there was an
increase in average annual days spent using the service. Looking at those who
entered their tenancy through priority housing (homelessness), there was an observed
increased in average annual contact with those using HITH services and those using
mental health services.
It is important to note that there were few significant results for the HSWCS group.
This may stem from the smaller number of participants, incomplete data, and the
potential for health issues to be related to circumstance unrelated to housing tenancy.
Importantly, the reduction in health service use observed can be a source of
considerable cost savings. This study focuses on the changes in emergency
presentation, days in hospital and days in psychiatric care. These have been identified
in previous literature as having the largest economic impact. Stays in hospital and
psychiatric care account for the vast majority of cost savings. The size of combined
cost offsets from the change in use of these three services is estimated to be nearly
$16.4 million, or just under $5,000 per person. This figure is potentially understated
given the incomplete data from individuals exiting the justice system.
Finally, this chapter also explored the relationship between tenancy duration and
health outcomes. The patterns of tenancy duration and reduction in health services
vary over time. In particular, tenancies sustained for less than one year only
generated a significant reduction in the proportion of people with prescriptions for
opioid dependence, while tenancies sustained for over one year are associated with
54
reductions in the proportion of people accessing all of the health services, with the
exception of HITH. This effect is strongest for people who had sustained their tenancy
for between one and four years, and fades once people had been in their tenancy for
four or more years. Individuals who had sustained their tenancy for one to two years
experienced a significant reduction in the largest number of distinct health services (all
services except HITH). For those who sustained their tenancy for more than five
years, there were still significant reductions associated with the proportion of people
staying overnight in a hospital, and the proportion of people seeking psychiatric care
and mental health services; however after four years the number of significant
changes starts to fade. This may imply that four years is the amount of time required
for individuals to ‘re-establish’ their health and stability, while sustaining a tenancy for
over 12 months is crucial to achieving health service reductions and cost savings. In
our sample, 1,323 individuals lost or discontinued their tenancy during the study
window—nearly two-thirds of whom vacated their tenancy after 12 months.
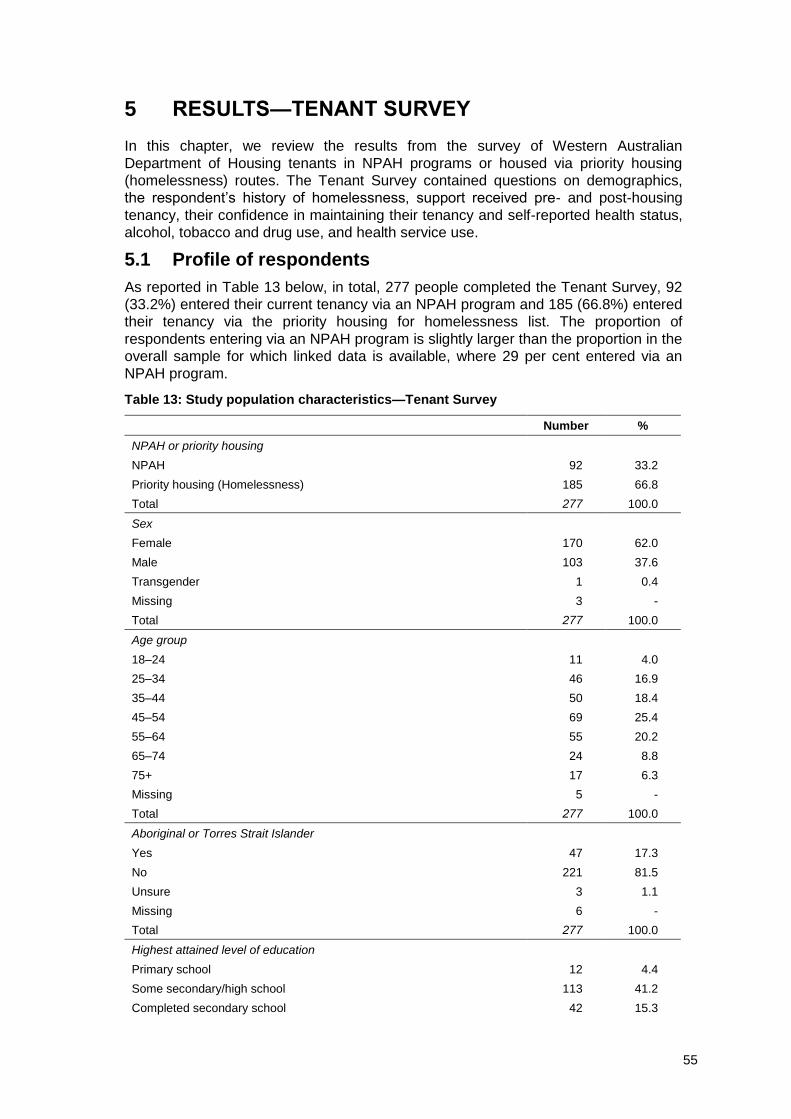
55
5 RESULTS—TENANT SURVEY
In this chapter, we review the results from the survey of Western Australian
Department of Housing tenants in NPAH programs or housed via priority housing
(homelessness) routes. The Tenant Survey contained questions on demographics,
the respondent’s history of homelessness, support received pre- and post-housing
tenancy, their confidence in maintaining their tenancy and self-reported health status,
alcohol, tobacco and drug use, and health service use.
5.1 Profile of respondents
As reported in Table 13 below, in total, 277 people completed the Tenant Survey, 92
(33.2%) entered their current tenancy via an NPAH program and 185 (66.8%) entered
their tenancy via the priority housing for homelessness list. The proportion of
respondents entering via an NPAH program is slightly larger than the proportion in the
overall sample for which linked data is available, where 29 per cent entered via an
NPAH program.
Table 13: Study population characteristics—Tenant Survey
Number %
NPAH or priority housing
NPAH 92 33.2
Priority housing (Homelessness) 185 66.8
Total 277 100.0
Sex
Female 170 62.0
Male 103 37.6
Transgender 1 0.4
Missing 3 -
Total 277 100.0
Age group
18–24 11 4.0
25–34 46 16.9
35–44 50 18.4
45–54 69 25.4
55–64 55 20.2
65–74 24 8.8
75+ 17 6.3
Missing 5 -
Total 277 100.0
Aboriginal or Torres Strait Islander
Yes 47 17.3
No 221 81.5
Unsure 3 1.1
Missing 6 -
Total 277 100.0
Highest attained level of education
Primary school 12 4.4
Some secondary/high school 113 41.2
Completed secondary school 42 15.3
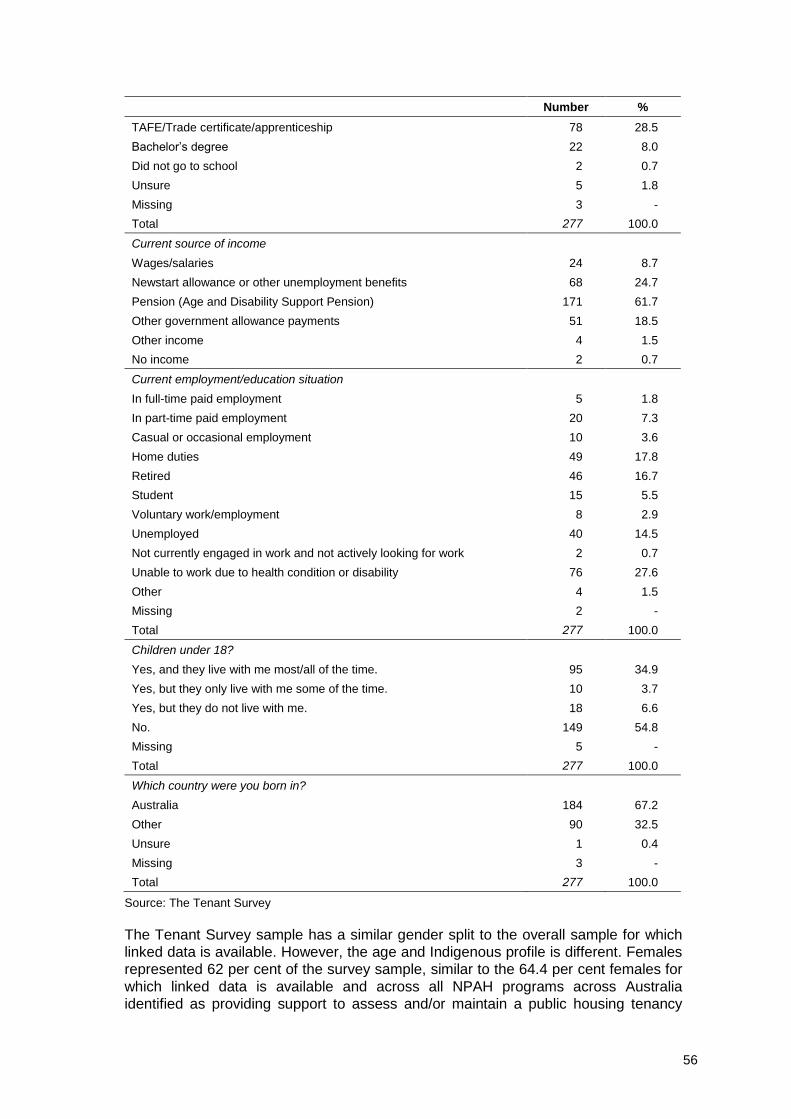
56
Number %
TAFE/Trade certificate/apprenticeship 78 28.5
Bachelor’s degree 22 8.0
Did not go to school 2 0.7
Unsure 5 1.8
Missing 3 -
Total 277 100.0
Current source of income
Wages/salaries 24 8.7
Newstart allowance or other unemployment benefits 68 24.7
Pension (Age and Disability Support Pension) 171 61.7
Other government allowance payments 51 18.5
Other income 4 1.5
No income 2 0.7
Current employment/education situation
In full-time paid employment 5 1.8
In part-time paid employment 20 7.3
Casual or occasional employment 10 3.6
Home duties 49 17.8
Retired 46 16.7
Student 15 5.5
Voluntary work/employment 8 2.9
Unemployed 40 14.5
Not currently engaged in work and not actively looking for work 2 0.7
Unable to work due to health condition or disability 76 27.6
Other 4 1.5
Missing 2 -
Total 277 100.0
Children under 18?
Yes, and they live with me most/all of the time. 95 34.9
Yes, but they only live with me some of the time. 10 3.7
Yes, but they do not live with me. 18 6.6
No. 149 54.8
Missing 5 -
Total 277 100.0
Which country were you born in?
Australia 184 67.2
Other 90 32.5
Unsure 1 0.4
Missing 3 -
Total 277 100.0
Source: The Tenant Survey
The Tenant Survey sample has a similar gender split to the overall sample for which
linked data is available. However, the age and Indigenous profile is different. Females
represented 62 per cent of the survey sample, similar to the 64.4 per cent females for
which linked data is available and across all NPAH programs across Australia
identified as providing support to assess and/or maintain a public housing tenancy
57
(67.5% female) (Zaretzky and Flatau 2015). The age profile of the survey sample is
significantly different (p=0.003) than for the complete linked data sample, with just
under half of all survey respondents (45.6%) in the 45 to 64 age group, and 39.3 per
cent of survey respondents under 44 years of age. In comparison, 65.3 per cent of
those for which linked data is available are under 44 years. There is an
underrepresentation of Indigenous tenants in the sample resulting in a significant
difference between the samples (p=0.000), with 17.3 per cent of survey participants
indicating they are Indigenous compared with 29.5 per cent of clients in the linked
data. As a consequence of the skewness in the Tenant Survey data, the survey is not
representative of the linked data sample. The skewness in age and Indigenous status
is likely to affect interpretation of some of the results of the survey.
Of those responding to the survey, 41.2 per cent had completed some secondary
school, with a further 15.3 per cent having completed secondary school. In total,
36.5 per cent had completed some form of post-secondary education; 28.5 per cent
TAFE/Trade certificate/apprentice and 8 per cent had completed a Bachelor’s degree.
In total, 12.7 per cent of respondents reported that they were employed in paid work in
some capacity. However, only 1.8 per cent was in full-time employment. A large
proportion of the Tenant Survey respondents (27.6%) reported not being able to work
due to health conditions. The vast majority of respondents reported a government
payment as their main income source, 24.7 per cent received Newstart unemployment
benefits, 61.7 per cent received a pension (includes Disability Support Pension) and
18.5 per cent reported some other type of government benefit. Only 8.7 per cent
reported a wage or salary as their main income source. The educational, income
source and employment characteristics are similar to other homeless populations (see
e.g. Zaretzky and Flatau 2013).
Over half of all respondents (54.8%) did not have children, and only 34.9 per cent
have children who live with them most/all of the time. Around two-thirds (67.2%) of
respondents were born in Australia.
5.2 Prior experiences of homelessness
The survey included measures to examine cumulative lifetime experiences of
homelessness. This has been shown to be predictive of a range of outcomes,
including some relating to health. In a study of homeless veterans in the US (Tsai,
Kasprow et al. 2014), those with alcohol and drug use disorders had more extensive
homeless histories.
Approximately half of all respondents reported they had slept rough at some stage
over their lifetime; 54.5 per cent of NPAH and 50.3 per cent of priority housing
(homelessness) respondents (see Table 14 below).
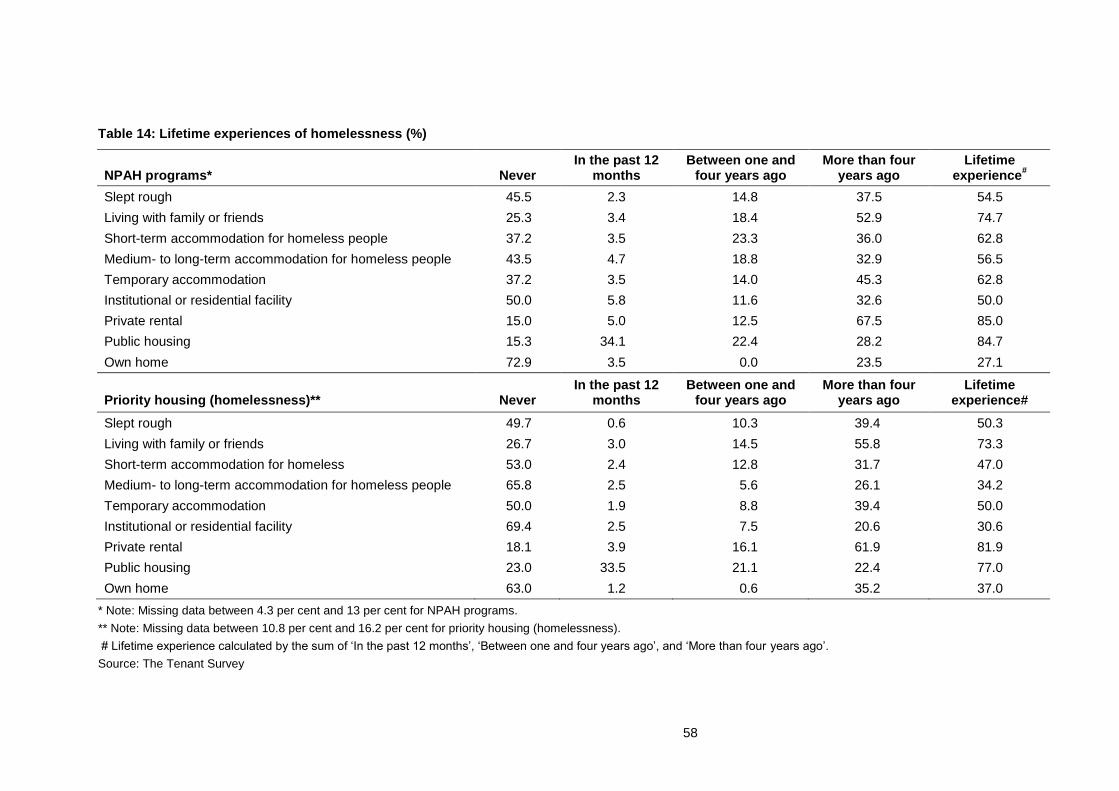
58
Table 14: Lifetime experiences of homelessness (%)
NPAH programs* Never In the past 12
months Between one and
four years ago More than four
years ago Lifetime
experience#
Slept rough 45.5 2.3 14.8 37.5 54.5
Living with family or friends 25.3 3.4 18.4 52.9 74.7
Short-term accommodation for homeless people 37.2 3.5 23.3 36.0 62.8
Medium- to long-term accommodation for homeless people 43.5 4.7 18.8 32.9 56.5
Temporary accommodation 37.2 3.5 14.0 45.3 62.8
Institutional or residential facility 50.0 5.8 11.6 32.6 50.0
Private rental 15.0 5.0 12.5 67.5 85.0
Public housing 15.3 34.1 22.4 28.2 84.7
Own home 72.9 3.5 0.0 23.5 27.1
Priority housing (homelessness)** Never In the past 12
months Between one and
four years ago More than four
years ago Lifetime
experience#
Slept rough 49.7 0.6 10.3 39.4 50.3
Living with family or friends 26.7 3.0 14.5 55.8 73.3
Short-term accommodation for homeless 53.0 2.4 12.8 31.7 47.0
Medium- to long-term accommodation for homeless people 65.8 2.5 5.6 26.1 34.2
Temporary accommodation 50.0 1.9 8.8 39.4 50.0
Institutional or residential facility 69.4 2.5 7.5 20.6 30.6
Private rental 18.1 3.9 16.1 61.9 81.9
Public housing 23.0 33.5 21.1 22.4 77.0
Own home 63.0 1.2 0.6 35.2 37.0
* Note: Missing data between 4.3 per cent and 13 per cent for NPAH programs.
** Note: Missing data between 10.8 per cent and 16.2 per cent for priority housing (homelessness).
# Lifetime experience calculated by the sum of ‘In the past 12 months’, ‘Between one and four years ago’, and ‘More than four years ago’.
Source: The Tenant Survey
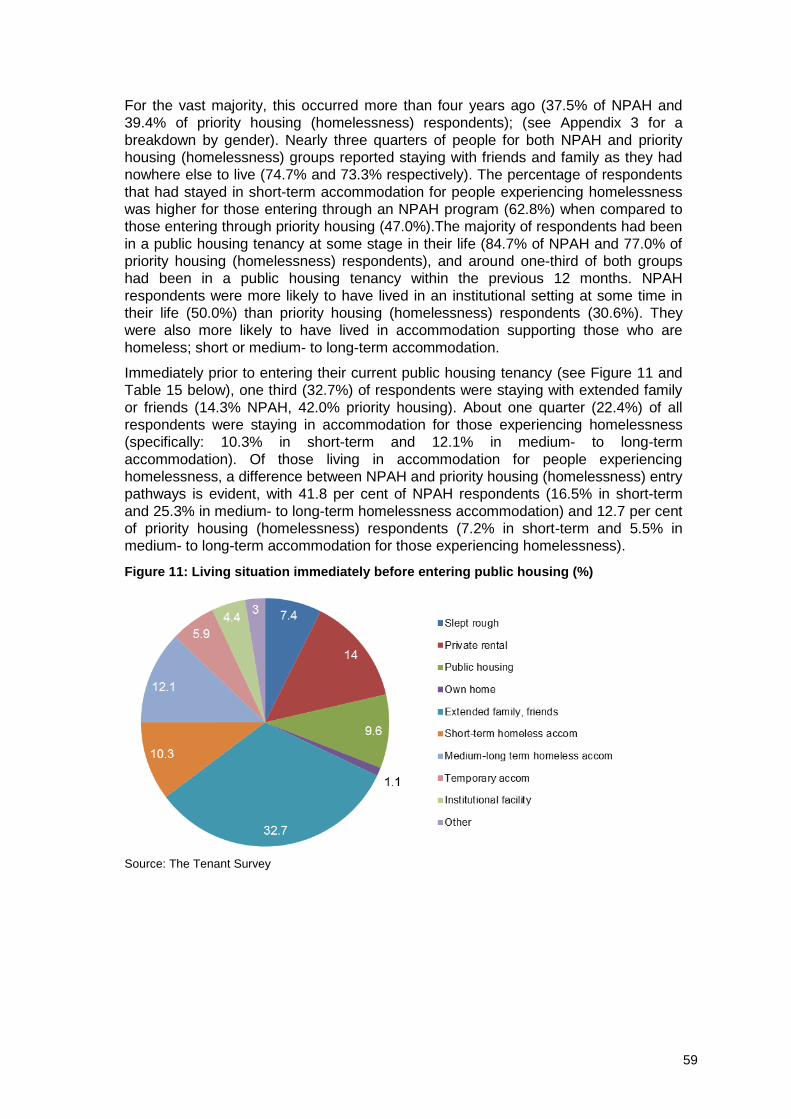
59
For the vast majority, this occurred more than four years ago (37.5% of NPAH and
39.4% of priority housing (homelessness) respondents); (see Appendix 3 for a
breakdown by gender). Nearly three quarters of people for both NPAH and priority
housing (homelessness) groups reported staying with friends and family as they had
nowhere else to live (74.7% and 73.3% respectively). The percentage of respondents
that had stayed in short-term accommodation for people experiencing homelessness
was higher for those entering through an NPAH program (62.8%) when compared to
those entering through priority housing (47.0%).The majority of respondents had been
in a public housing tenancy at some stage in their life (84.7% of NPAH and 77.0% of
priority housing (homelessness) respondents), and around one-third of both groups
had been in a public housing tenancy within the previous 12 months. NPAH
respondents were more likely to have lived in an institutional setting at some time in
their life (50.0%) than priority housing (homelessness) respondents (30.6%). They
were also more likely to have lived in accommodation supporting those who are
homeless; short or medium- to long-term accommodation.
Immediately prior to entering their current public housing tenancy (see Figure 11 and
Table 15 below), one third (32.7%) of respondents were staying with extended family
or friends (14.3% NPAH, 42.0% priority housing). About one quarter (22.4%) of all
respondents were staying in accommodation for those experiencing homelessness
(specifically: 10.3% in short-term and 12.1% in medium- to long-term
accommodation). Of those living in accommodation for people experiencing
homelessness, a difference between NPAH and priority housing (homelessness) entry
pathways is evident, with 41.8 per cent of NPAH respondents (16.5% in short-term
and 25.3% in medium- to long-term homelessness accommodation) and 12.7 per cent
of priority housing (homelessness) respondents (7.2% in short-term and 5.5% in
medium- to long-term accommodation for those experiencing homelessness).
Figure 11: Living situation immediately before entering public housing (%)
Source: The Tenant Survey
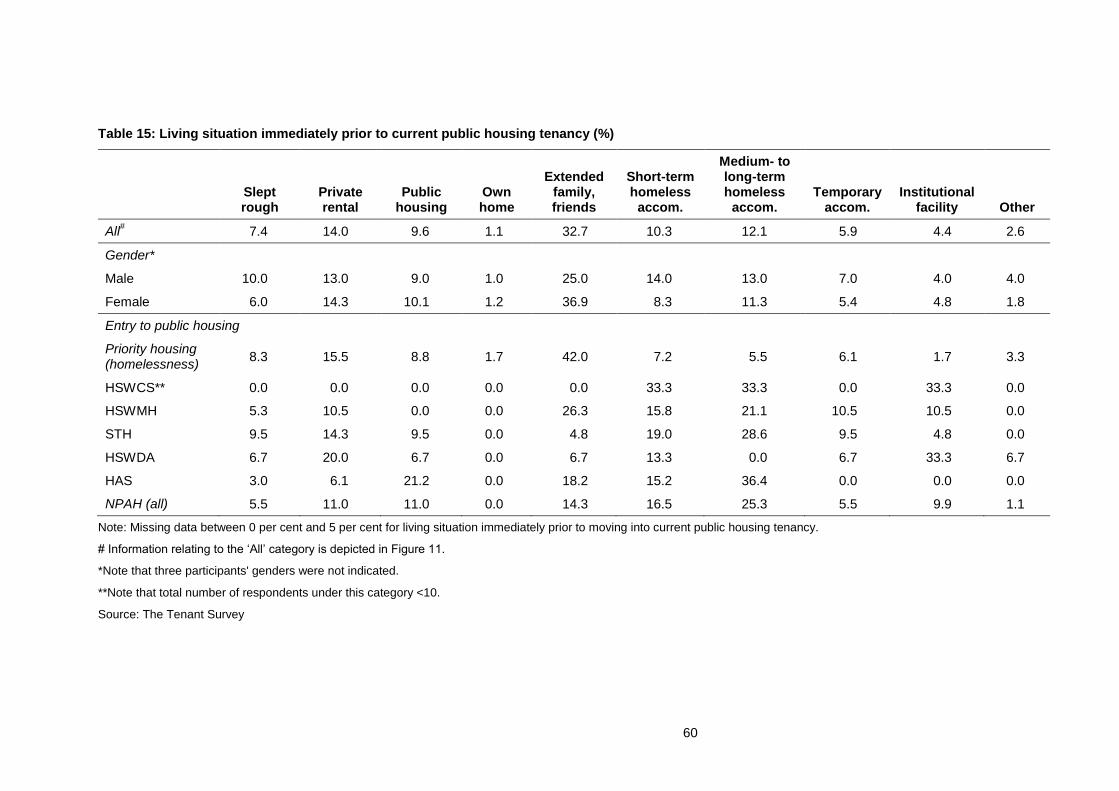
60
Table 15: Living situation immediately prior to current public housing tenancy (%)
Slept rough
Private rental
Public housing
Own home
Extended family, friends
Short-term homeless
accom.
Medium- to long-term homeless
accom. Temporary
accom. Institutional
facility Other
All# 7.4 14.0 9.6 1.1 32.7 10.3 12.1 5.9 4.4 2.6
Gender*
Male 10.0 13.0 9.0 1.0 25.0 14.0 13.0 7.0 4.0 4.0
Female 6.0 14.3 10.1 1.2 36.9 8.3 11.3 5.4 4.8 1.8
Entry to public housing
Priority housing (homelessness)
8.3 15.5 8.8 1.7 42.0 7.2 5.5 6.1 1.7 3.3
HSWCS** 0.0 0.0 0.0 0.0 0.0 33.3 33.3 0.0 33.3 0.0
HSWMH 5.3 10.5 0.0 0.0 26.3 15.8 21.1 10.5 10.5 0.0
STH 9.5 14.3 9.5 0.0 4.8 19.0 28.6 9.5 4.8 0.0
HSWDA 6.7 20.0 6.7 0.0 6.7 13.3 0.0 6.7 33.3 6.7
HAS 3.0 6.1 21.2 0.0 18.2 15.2 36.4 0.0 0.0 0.0
NPAH (all) 5.5 11.0 11.0 0.0 14.3 16.5 25.3 5.5 9.9 1.1
Note: Missing data between 0 per cent and 5 per cent for living situation immediately prior to moving into current public housing tenancy.
# Information relating to the ‘All’ category is depicted in Figure 11.
*Note that three participants' genders were not indicated.
**Note that total number of respondents under this category <10.
Source: The Tenant Survey
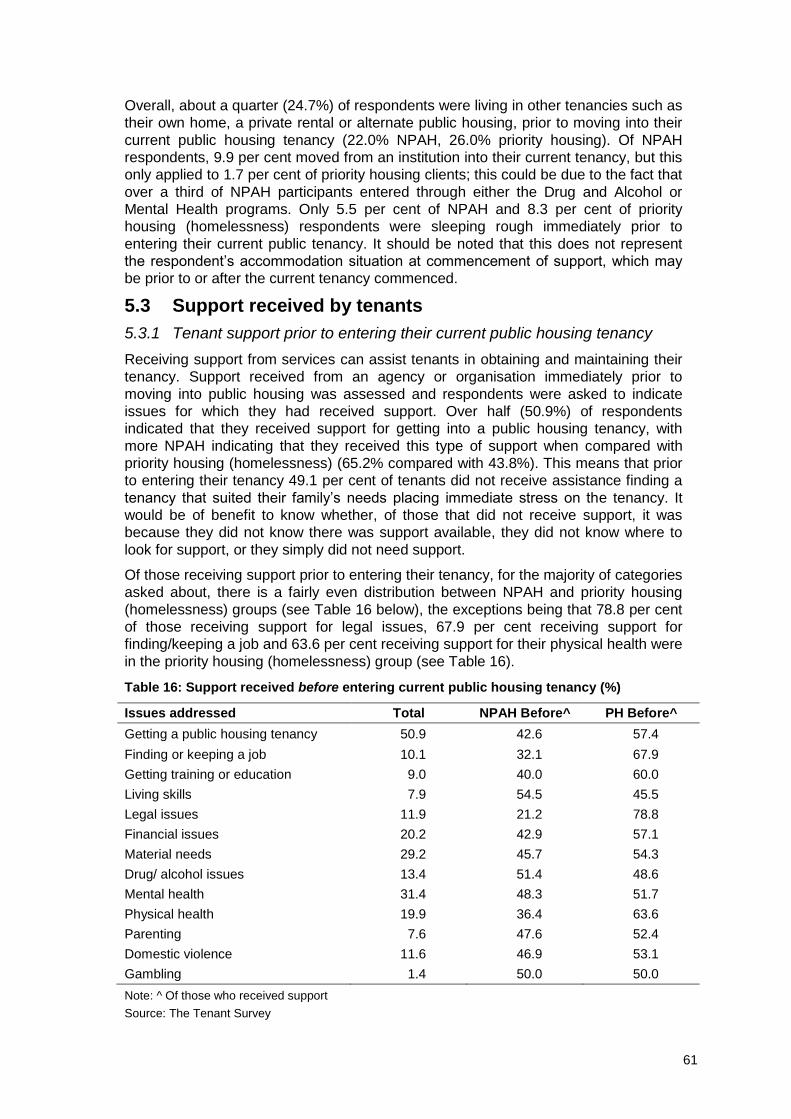
61
Overall, about a quarter (24.7%) of respondents were living in other tenancies such as
their own home, a private rental or alternate public housing, prior to moving into their
current public housing tenancy (22.0% NPAH, 26.0% priority housing). Of NPAH
respondents, 9.9 per cent moved from an institution into their current tenancy, but this
only applied to 1.7 per cent of priority housing clients; this could be due to the fact that
over a third of NPAH participants entered through either the Drug and Alcohol or
Mental Health programs. Only 5.5 per cent of NPAH and 8.3 per cent of priority
housing (homelessness) respondents were sleeping rough immediately prior to
entering their current public tenancy. It should be noted that this does not represent
the respondent’s accommodation situation at commencement of support, which may
be prior to or after the current tenancy commenced.
5.3 Support received by tenants
5.3.1 Tenant support prior to entering their current public housing tenancy
Receiving support from services can assist tenants in obtaining and maintaining their
tenancy. Support received from an agency or organisation immediately prior to
moving into public housing was assessed and respondents were asked to indicate
issues for which they had received support. Over half (50.9%) of respondents
indicated that they received support for getting into a public housing tenancy, with
more NPAH indicating that they received this type of support when compared with
priority housing (homelessness) (65.2% compared with 43.8%). This means that prior
to entering their tenancy 49.1 per cent of tenants did not receive assistance finding a
tenancy that suited their family’s needs placing immediate stress on the tenancy. It
would be of benefit to know whether, of those that did not receive support, it was
because they did not know there was support available, they did not know where to
look for support, or they simply did not need support.
Of those receiving support prior to entering their tenancy, for the majority of categories
asked about, there is a fairly even distribution between NPAH and priority housing
(homelessness) groups (see Table 16 below), the exceptions being that 78.8 per cent
of those receiving support for legal issues, 67.9 per cent receiving support for
finding/keeping a job and 63.6 per cent receiving support for their physical health were
in the priority housing (homelessness) group (see Table 16).
Table 16: Support received before entering current public housing tenancy (%)
Issues addressed Total NPAH Before^ PH Before^
Getting a public housing tenancy 50.9 42.6 57.4
Finding or keeping a job 10.1 32.1 67.9
Getting training or education 9.0 40.0 60.0
Living skills 7.9 54.5 45.5
Legal issues 11.9 21.2 78.8
Financial issues 20.2 42.9 57.1
Material needs 29.2 45.7 54.3
Drug/ alcohol issues 13.4 51.4 48.6
Mental health 31.4 48.3 51.7
Physical health 19.9 36.4 63.6
Parenting 7.6 47.6 52.4
Domestic violence 11.6 46.9 53.1
Gambling 1.4 50.0 50.0
Note: ^ Of those who received support
Source: The Tenant Survey
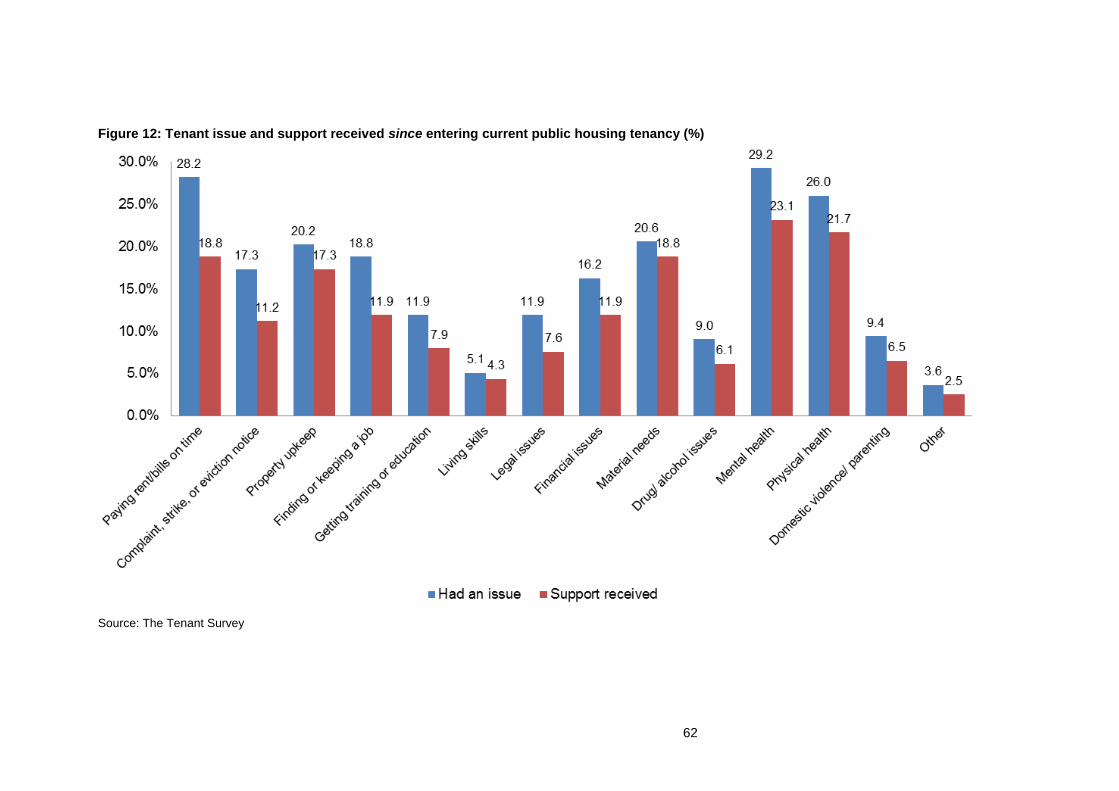
62
Figure 12: Tenant issue and support received since entering current public housing tenancy (%)
Source: The Tenant Survey
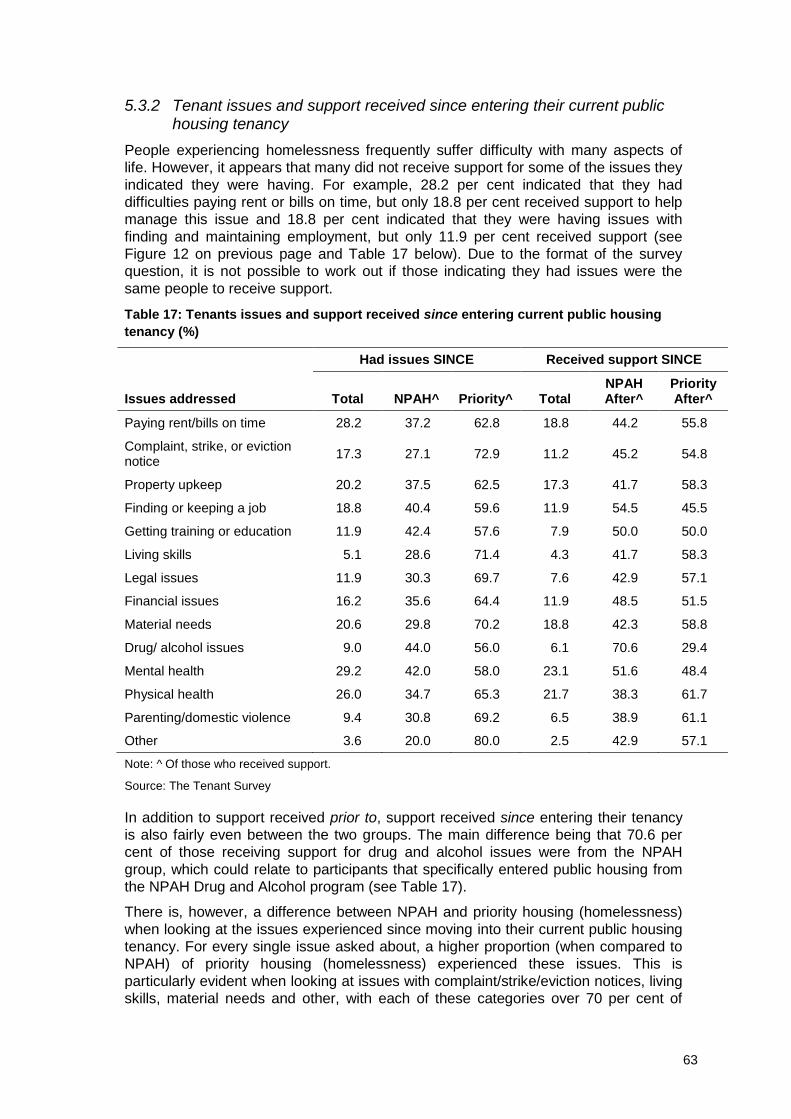
63
5.3.2 Tenant issues and support received since entering their current public housing tenancy
People experiencing homelessness frequently suffer difficulty with many aspects of
life. However, it appears that many did not receive support for some of the issues they
indicated they were having. For example, 28.2 per cent indicated that they had
difficulties paying rent or bills on time, but only 18.8 per cent received support to help
manage this issue and 18.8 per cent indicated that they were having issues with
finding and maintaining employment, but only 11.9 per cent received support (see
Figure 12 on previous page and Table 17 below). Due to the format of the survey
question, it is not possible to work out if those indicating they had issues were the
same people to receive support.
Table 17: Tenants issues and support received since entering current public housing
tenancy (%)
Had issues SINCE Received support SINCE
Issues addressed Total NPAH^ Priority^ Total NPAH After^
Priority After^
Paying rent/bills on time 28.2 37.2 62.8 18.8 44.2 55.8
Complaint, strike, or eviction notice
17.3 27.1 72.9 11.2 45.2 54.8
Property upkeep 20.2 37.5 62.5 17.3 41.7 58.3
Finding or keeping a job 18.8 40.4 59.6 11.9 54.5 45.5
Getting training or education 11.9 42.4 57.6 7.9 50.0 50.0
Living skills 5.1 28.6 71.4 4.3 41.7 58.3
Legal issues 11.9 30.3 69.7 7.6 42.9 57.1
Financial issues 16.2 35.6 64.4 11.9 48.5 51.5
Material needs 20.6 29.8 70.2 18.8 42.3 58.8
Drug/ alcohol issues 9.0 44.0 56.0 6.1 70.6 29.4
Mental health 29.2 42.0 58.0 23.1 51.6 48.4
Physical health 26.0 34.7 65.3 21.7 38.3 61.7
Parenting/domestic violence 9.4 30.8 69.2 6.5 38.9 61.1
Other 3.6 20.0 80.0 2.5 42.9 57.1
Note: ^ Of those who received support.
Source: The Tenant Survey
In addition to support received prior to, support received since entering their tenancy
is also fairly even between the two groups. The main difference being that 70.6 per
cent of those receiving support for drug and alcohol issues were from the NPAH
group, which could relate to participants that specifically entered public housing from
the NPAH Drug and Alcohol program (see Table 17).
There is, however, a difference between NPAH and priority housing (homelessness)
when looking at the issues experienced since moving into their current public housing
tenancy. For every single issue asked about, a higher proportion (when compared to
NPAH) of priority housing (homelessness) experienced these issues. This is
particularly evident when looking at issues with complaint/strike/eviction notices, living
skills, material needs and other, with each of these categories over 70 per cent of
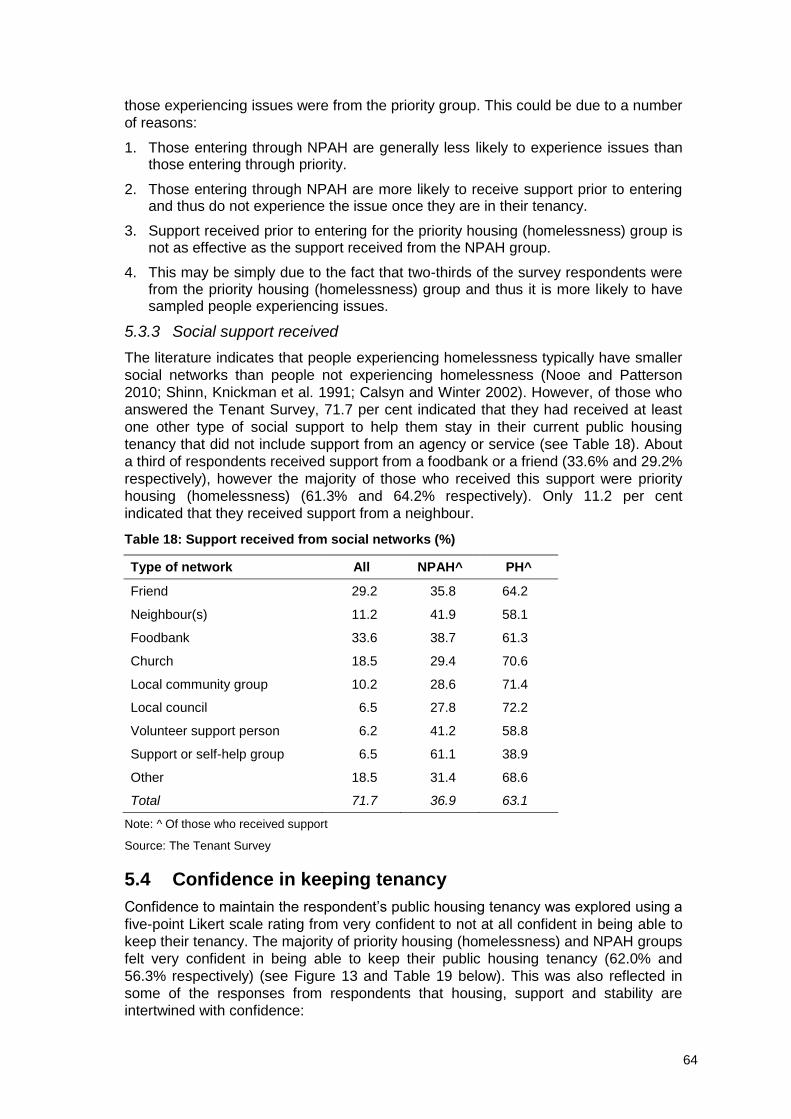
64
those experiencing issues were from the priority group. This could be due to a number
of reasons:
1. Those entering through NPAH are generally less likely to experience issues than those entering through priority.
2. Those entering through NPAH are more likely to receive support prior to entering and thus do not experience the issue once they are in their tenancy.
3. Support received prior to entering for the priority housing (homelessness) group is not as effective as the support received from the NPAH group.
4. This may be simply due to the fact that two-thirds of the survey respondents were from the priority housing (homelessness) group and thus it is more likely to have sampled people experiencing issues.
5.3.3 Social support received
The literature indicates that people experiencing homelessness typically have smaller
social networks than people not experiencing homelessness (Nooe and Patterson
2010; Shinn, Knickman et al. 1991; Calsyn and Winter 2002). However, of those who
answered the Tenant Survey, 71.7 per cent indicated that they had received at least
one other type of social support to help them stay in their current public housing
tenancy that did not include support from an agency or service (see Table 18). About
a third of respondents received support from a foodbank or a friend (33.6% and 29.2%
respectively), however the majority of those who received this support were priority
housing (homelessness) (61.3% and 64.2% respectively). Only 11.2 per cent
indicated that they received support from a neighbour.
Table 18: Support received from social networks (%)
Type of network All NPAH^ PH^
Friend 29.2 35.8 64.2
Neighbour(s) 11.2 41.9 58.1
Foodbank 33.6 38.7 61.3
Church 18.5 29.4 70.6
Local community group 10.2 28.6 71.4
Local council 6.5 27.8 72.2
Volunteer support person 6.2 41.2 58.8
Support or self-help group 6.5 61.1 38.9
Other 18.5 31.4 68.6
Total 71.7 36.9 63.1
Note: ^ Of those who received support
Source: The Tenant Survey
5.4 Confidence in keeping tenancy
Confidence to maintain the respondent’s public housing tenancy was explored using a
five-point Likert scale rating from very confident to not at all confident in being able to
keep their tenancy. The majority of priority housing (homelessness) and NPAH groups
felt very confident in being able to keep their public housing tenancy (62.0% and
56.3% respectively) (see Figure 13 and Table 19 below). This was also reflected in
some of the responses from respondents that housing, support and stability are
intertwined with confidence:
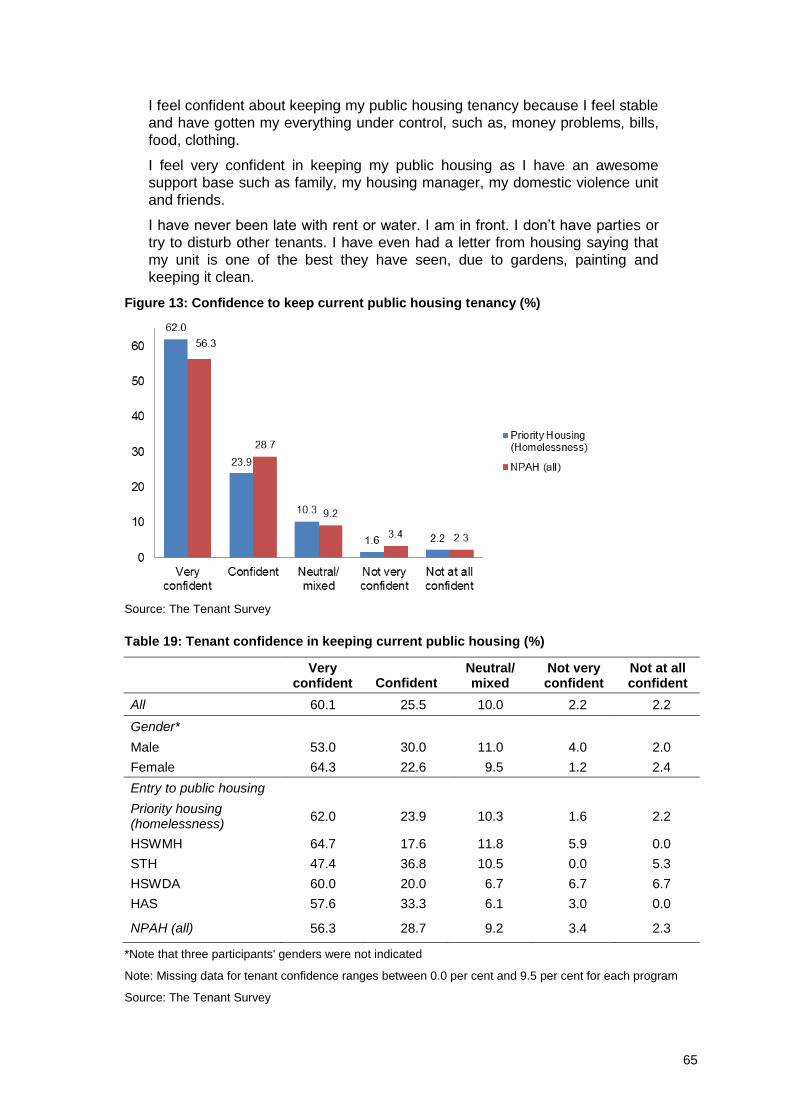
65
I feel confident about keeping my public housing tenancy because I feel stable
and have gotten my everything under control, such as, money problems, bills,
food, clothing.
I feel very confident in keeping my public housing as I have an awesome
support base such as family, my housing manager, my domestic violence unit
and friends.
I have never been late with rent or water. I am in front. I don’t have parties or
try to disturb other tenants. I have even had a letter from housing saying that
my unit is one of the best they have seen, due to gardens, painting and
keeping it clean.
Figure 13: Confidence to keep current public housing tenancy (%)
Source: The Tenant Survey
Table 19: Tenant confidence in keeping current public housing (%)
Very
confident Confident Neutral/ mixed
Not very confident
Not at all confident
All 60.1 25.5 10.0 2.2 2.2
Gender*
Male 53.0 30.0 11.0 4.0 2.0
Female 64.3 22.6 9.5 1.2 2.4
Entry to public housing
Priority housing (homelessness)
62.0 23.9 10.3 1.6 2.2
HSWMH 64.7 17.6 11.8 5.9 0.0
STH 47.4 36.8 10.5 0.0 5.3
HSWDA 60.0 20.0 6.7 6.7 6.7
HAS 57.6 33.3 6.1 3.0 0.0
NPAH (all) 56.3 28.7 9.2 3.4 2.3
*Note that three participants' genders were not indicated
Note: Missing data for tenant confidence ranges between 0.0 per cent and 9.5 per cent for each program
Source: The Tenant Survey
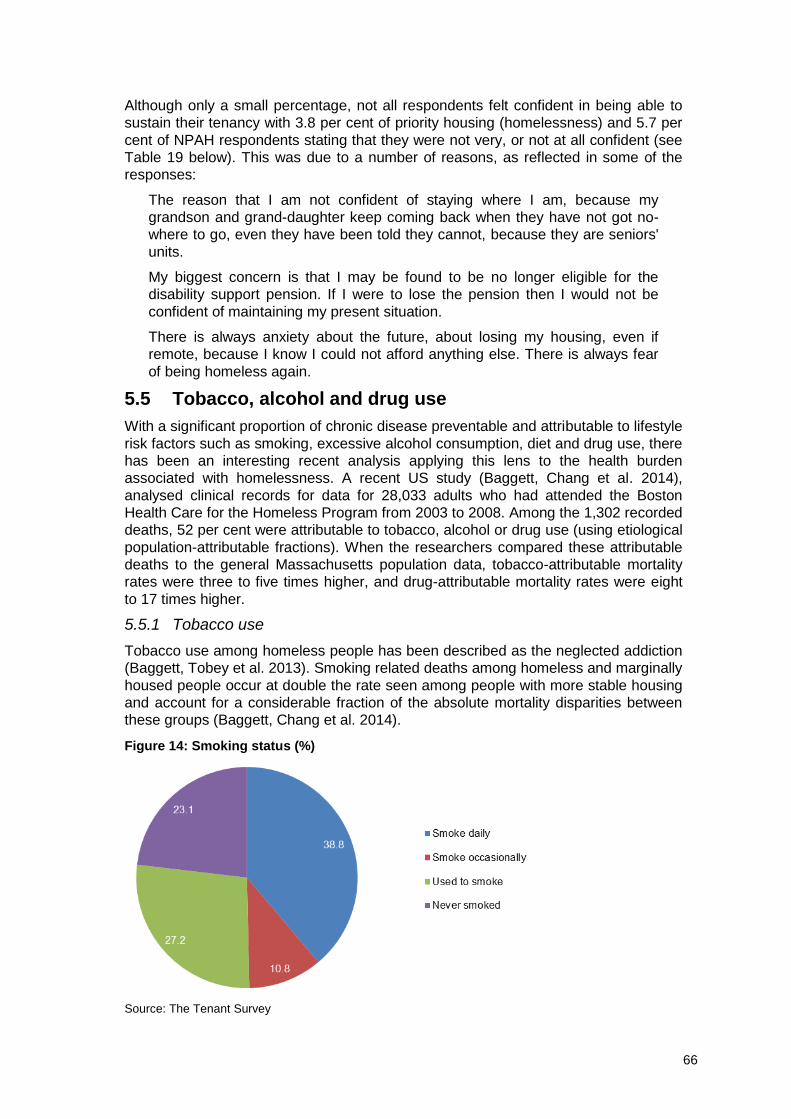
66
Although only a small percentage, not all respondents felt confident in being able to
sustain their tenancy with 3.8 per cent of priority housing (homelessness) and 5.7 per
cent of NPAH respondents stating that they were not very, or not at all confident (see
Table 19 below). This was due to a number of reasons, as reflected in some of the
responses:
The reason that I am not confident of staying where I am, because my
grandson and grand-daughter keep coming back when they have not got no-
where to go, even they have been told they cannot, because they are seniors'
units.
My biggest concern is that I may be found to be no longer eligible for the
disability support pension. If I were to lose the pension then I would not be
confident of maintaining my present situation.
There is always anxiety about the future, about losing my housing, even if
remote, because I know I could not afford anything else. There is always fear
of being homeless again.
5.5 Tobacco, alcohol and drug use
With a significant proportion of chronic disease preventable and attributable to lifestyle
risk factors such as smoking, excessive alcohol consumption, diet and drug use, there
has been an interesting recent analysis applying this lens to the health burden
associated with homelessness. A recent US study (Baggett, Chang et al. 2014),
analysed clinical records for data for 28,033 adults who had attended the Boston
Health Care for the Homeless Program from 2003 to 2008. Among the 1,302 recorded
deaths, 52 per cent were attributable to tobacco, alcohol or drug use (using etiological
population-attributable fractions). When the researchers compared these attributable
deaths to the general Massachusetts population data, tobacco-attributable mortality
rates were three to five times higher, and drug-attributable mortality rates were eight
to 17 times higher.
5.5.1 Tobacco use
Tobacco use among homeless people has been described as the neglected addiction
(Baggett, Tobey et al. 2013). Smoking related deaths among homeless and marginally
housed people occur at double the rate seen among people with more stable housing
and account for a considerable fraction of the absolute mortality disparities between
these groups (Baggett, Chang et al. 2014).
Figure 14: Smoking status (%)
Source: The Tenant Survey
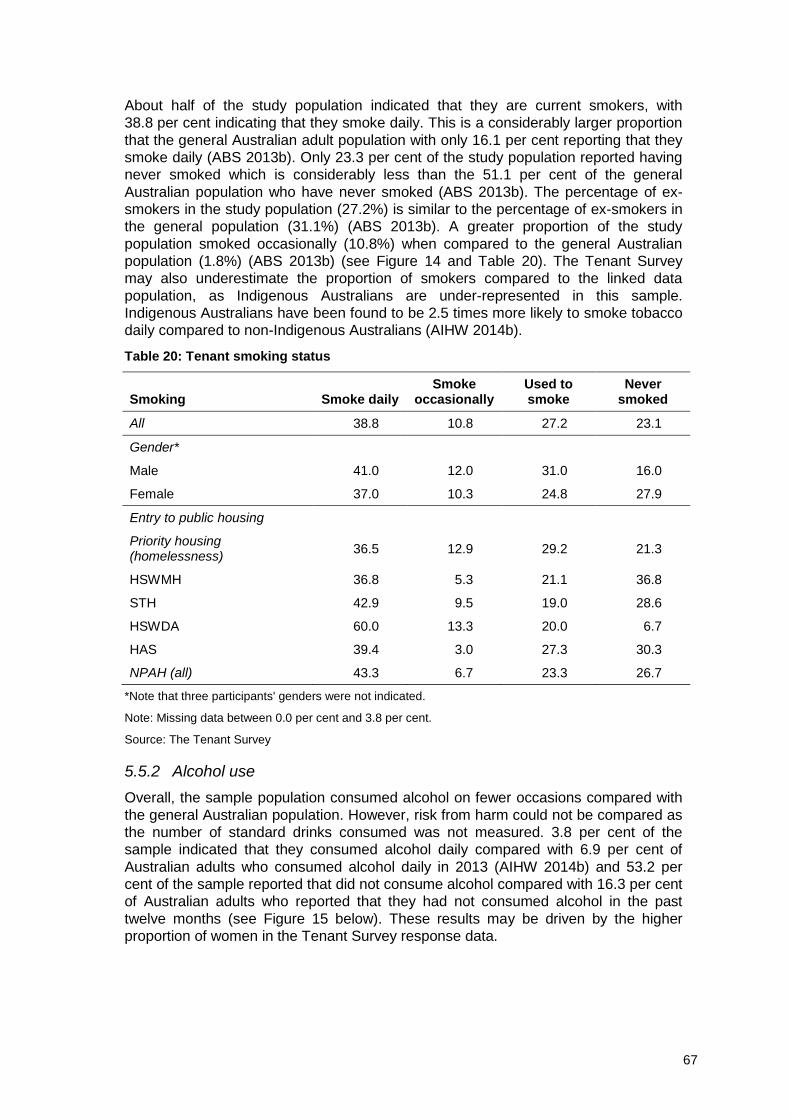
67
About half of the study population indicated that they are current smokers, with
38.8 per cent indicating that they smoke daily. This is a considerably larger proportion
that the general Australian adult population with only 16.1 per cent reporting that they
smoke daily (ABS 2013b). Only 23.3 per cent of the study population reported having
never smoked which is considerably less than the 51.1 per cent of the general
Australian population who have never smoked (ABS 2013b). The percentage of ex-
smokers in the study population (27.2%) is similar to the percentage of ex-smokers in
the general population (31.1%) (ABS 2013b). A greater proportion of the study
population smoked occasionally (10.8%) when compared to the general Australian
population (1.8%) (ABS 2013b) (see Figure 14 and Table 20). The Tenant Survey
may also underestimate the proportion of smokers compared to the linked data
population, as Indigenous Australians are under-represented in this sample.
Indigenous Australians have been found to be 2.5 times more likely to smoke tobacco
daily compared to non-Indigenous Australians (AIHW 2014b).
Table 20: Tenant smoking status
Smoking Smoke daily Smoke
occasionally Used to smoke
Never smoked
All 38.8 10.8 27.2 23.1
Gender*
Male 41.0 12.0 31.0 16.0
Female 37.0 10.3 24.8 27.9
Entry to public housing
Priority housing (homelessness)
36.5 12.9 29.2 21.3
HSWMH 36.8 5.3 21.1 36.8
STH 42.9 9.5 19.0 28.6
HSWDA 60.0 13.3 20.0 6.7
HAS 39.4 3.0 27.3 30.3
NPAH (all) 43.3 6.7 23.3 26.7
*Note that three participants' genders were not indicated.
Note: Missing data between 0.0 per cent and 3.8 per cent.
Source: The Tenant Survey
5.5.2 Alcohol use
Overall, the sample population consumed alcohol on fewer occasions compared with
the general Australian population. However, risk from harm could not be compared as
the number of standard drinks consumed was not measured. 3.8 per cent of the
sample indicated that they consumed alcohol daily compared with 6.9 per cent of
Australian adults who consumed alcohol daily in 2013 (AIHW 2014b) and 53.2 per
cent of the sample reported that did not consume alcohol compared with 16.3 per cent
of Australian adults who reported that they had not consumed alcohol in the past
twelve months (see Figure 15 below). These results may be driven by the higher
proportion of women in the Tenant Survey response data.
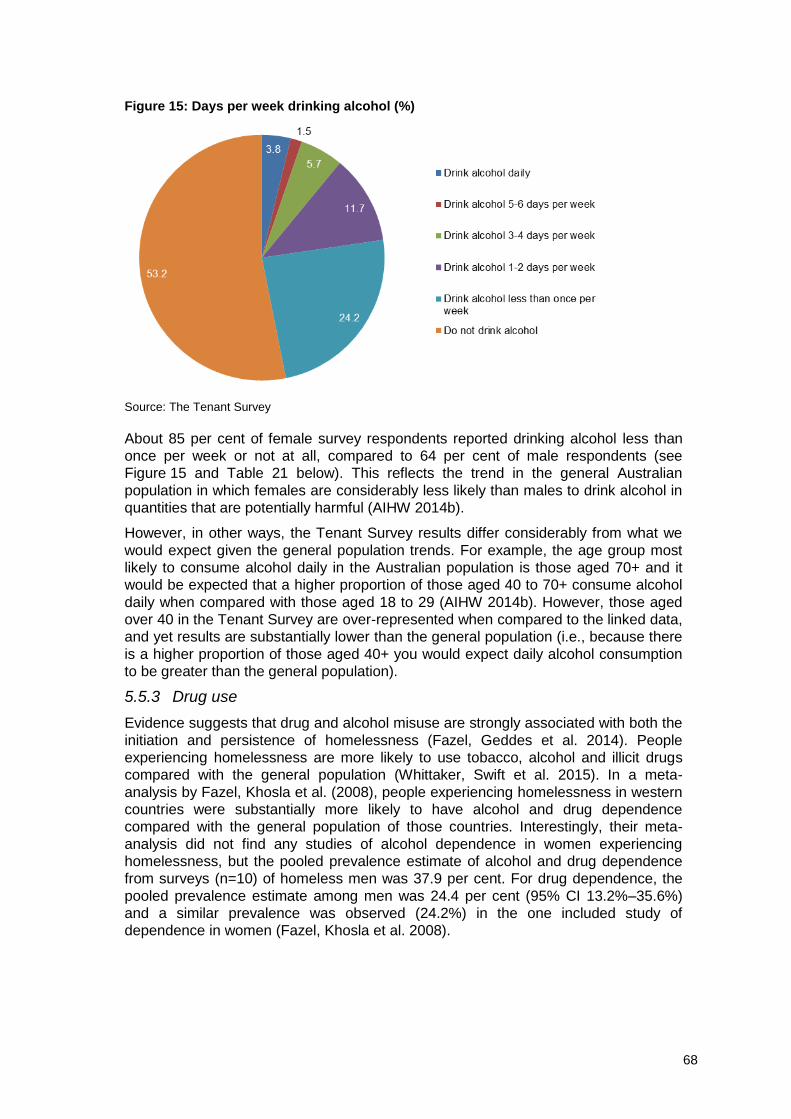
68
Figure 15: Days per week drinking alcohol (%)
Source: The Tenant Survey
About 85 per cent of female survey respondents reported drinking alcohol less than
once per week or not at all, compared to 64 per cent of male respondents (see
Figure 15 and Table 21 below). This reflects the trend in the general Australian
population in which females are considerably less likely than males to drink alcohol in
quantities that are potentially harmful (AIHW 2014b).
However, in other ways, the Tenant Survey results differ considerably from what we
would expect given the general population trends. For example, the age group most
likely to consume alcohol daily in the Australian population is those aged 70+ and it
would be expected that a higher proportion of those aged 40 to 70+ consume alcohol
daily when compared with those aged 18 to 29 (AIHW 2014b). However, those aged
over 40 in the Tenant Survey are over-represented when compared to the linked data,
and yet results are substantially lower than the general population (i.e., because there
is a higher proportion of those aged 40+ you would expect daily alcohol consumption
to be greater than the general population).
5.5.3 Drug use
Evidence suggests that drug and alcohol misuse are strongly associated with both the
initiation and persistence of homelessness (Fazel, Geddes et al. 2014). People
experiencing homelessness are more likely to use tobacco, alcohol and illicit drugs
compared with the general population (Whittaker, Swift et al. 2015). In a meta-
analysis by Fazel, Khosla et al. (2008), people experiencing homelessness in western
countries were substantially more likely to have alcohol and drug dependence
compared with the general population of those countries. Interestingly, their meta-
analysis did not find any studies of alcohol dependence in women experiencing
homelessness, but the pooled prevalence estimate of alcohol and drug dependence
from surveys (n=10) of homeless men was 37.9 per cent. For drug dependence, the
pooled prevalence estimate among men was 24.4 per cent (95% CI 13.2%–35.6%)
and a similar prevalence was observed (24.2%) in the one included study of
dependence in women (Fazel, Khosla et al. 2008).
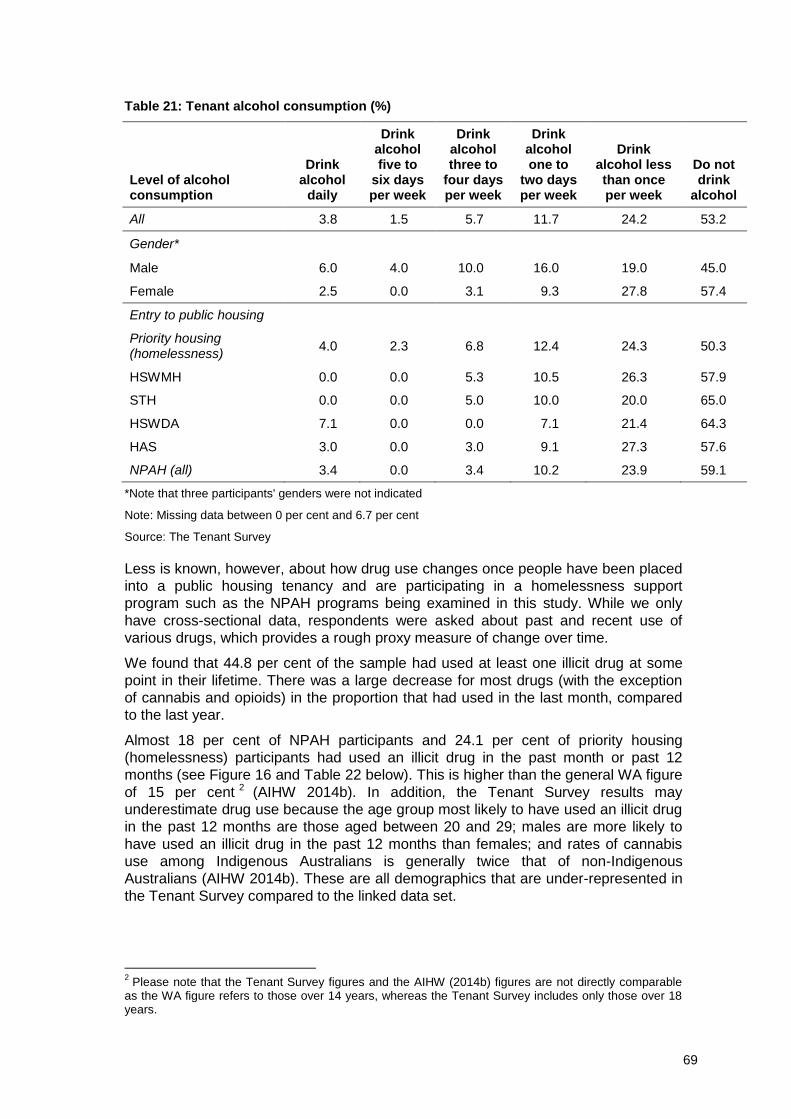
69
Table 21: Tenant alcohol consumption (%)
Level of alcohol consumption
Drink alcohol
daily
Drink alcohol five to
six days per week
Drink alcohol three to
four days per week
Drink alcohol one to
two days per week
Drink alcohol less than once per week
Do not drink
alcohol
All 3.8 1.5 5.7 11.7 24.2 53.2
Gender*
Male 6.0 4.0 10.0 16.0 19.0 45.0
Female 2.5 0.0 3.1 9.3 27.8 57.4
Entry to public housing
Priority housing (homelessness)
4.0 2.3 6.8 12.4 24.3 50.3
HSWMH 0.0 0.0 5.3 10.5 26.3 57.9
STH 0.0 0.0 5.0 10.0 20.0 65.0
HSWDA 7.1 0.0 0.0 7.1 21.4 64.3
HAS 3.0 0.0 3.0 9.1 27.3 57.6
NPAH (all) 3.4 0.0 3.4 10.2 23.9 59.1
*Note that three participants' genders were not indicated
Note: Missing data between 0 per cent and 6.7 per cent
Source: The Tenant Survey
Less is known, however, about how drug use changes once people have been placed
into a public housing tenancy and are participating in a homelessness support
program such as the NPAH programs being examined in this study. While we only
have cross-sectional data, respondents were asked about past and recent use of
various drugs, which provides a rough proxy measure of change over time.
We found that 44.8 per cent of the sample had used at least one illicit drug at some
point in their lifetime. There was a large decrease for most drugs (with the exception
of cannabis and opioids) in the proportion that had used in the last month, compared
to the last year.
Almost 18 per cent of NPAH participants and 24.1 per cent of priority housing
(homelessness) participants had used an illicit drug in the past month or past 12
months (see Figure 16 and Table 22 below). This is higher than the general WA figure
of 15 per cent 2 (AIHW 2014b). In addition, the Tenant Survey results may
underestimate drug use because the age group most likely to have used an illicit drug
in the past 12 months are those aged between 20 and 29; males are more likely to
have used an illicit drug in the past 12 months than females; and rates of cannabis
use among Indigenous Australians is generally twice that of non-Indigenous
Australians (AIHW 2014b). These are all demographics that are under-represented in
the Tenant Survey compared to the linked data set.
2 Please note that the Tenant Survey figures and the AIHW (2014b) figures are not directly comparable
as the WA figure refers to those over 14 years, whereas the Tenant Survey includes only those over 18 years.
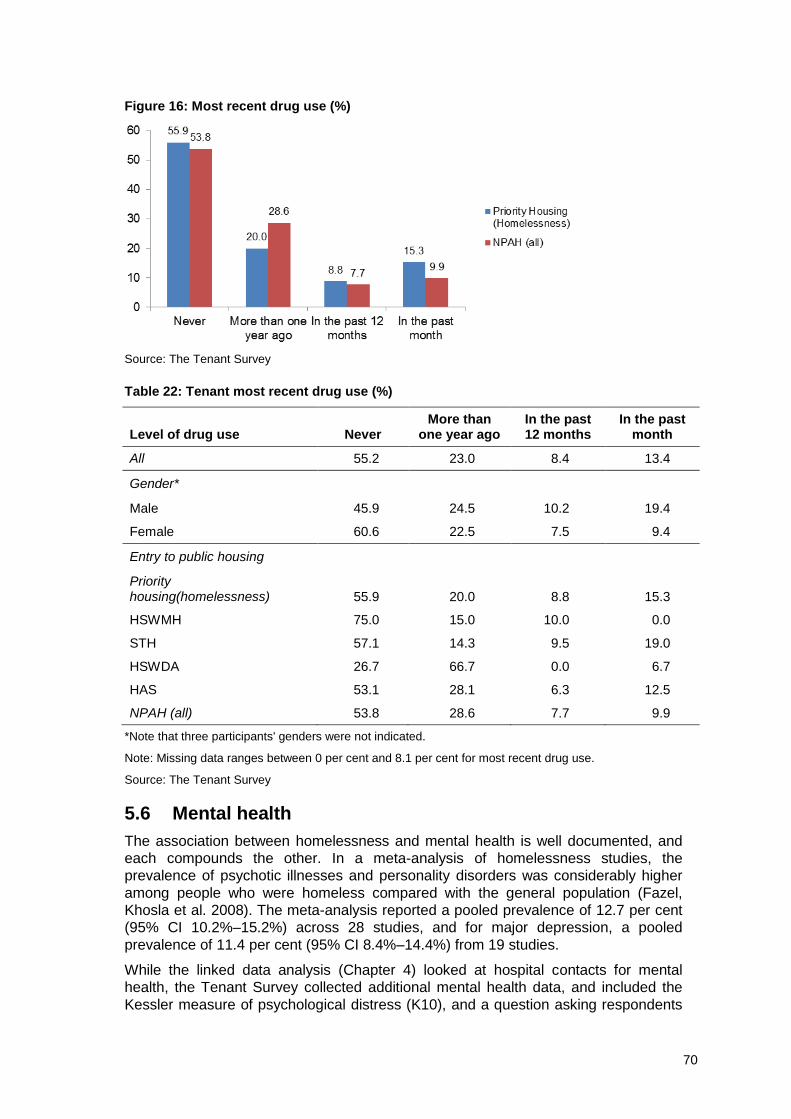
70
Figure 16: Most recent drug use (%)
Source: The Tenant Survey
Table 22: Tenant most recent drug use (%)
Level of drug use Never More than
one year ago In the past 12 months
In the past month
All 55.2 23.0 8.4 13.4
Gender*
Male 45.9 24.5 10.2 19.4
Female 60.6 22.5 7.5 9.4
Entry to public housing
Priority housing(homelessness) 55.9 20.0 8.8 15.3
HSWMH 75.0 15.0 10.0 0.0
STH 57.1 14.3 9.5 19.0
HSWDA 26.7 66.7 0.0 6.7
HAS 53.1 28.1 6.3 12.5
NPAH (all) 53.8 28.6 7.7 9.9
*Note that three participants' genders were not indicated.
Note: Missing data ranges between 0 per cent and 8.1 per cent for most recent drug use.
Source: The Tenant Survey
5.6 Mental health
The association between homelessness and mental health is well documented, and
each compounds the other. In a meta-analysis of homelessness studies, the
prevalence of psychotic illnesses and personality disorders was considerably higher
among people who were homeless compared with the general population (Fazel,
Khosla et al. 2008). The meta-analysis reported a pooled prevalence of 12.7 per cent
(95% CI 10.2%–15.2%) across 28 studies, and for major depression, a pooled
prevalence of 11.4 per cent (95% CI 8.4%–14.4%) from 19 studies.
While the linked data analysis (Chapter 4) looked at hospital contacts for mental
health, the Tenant Survey collected additional mental health data, and included the
Kessler measure of psychological distress (K10), and a question asking respondents
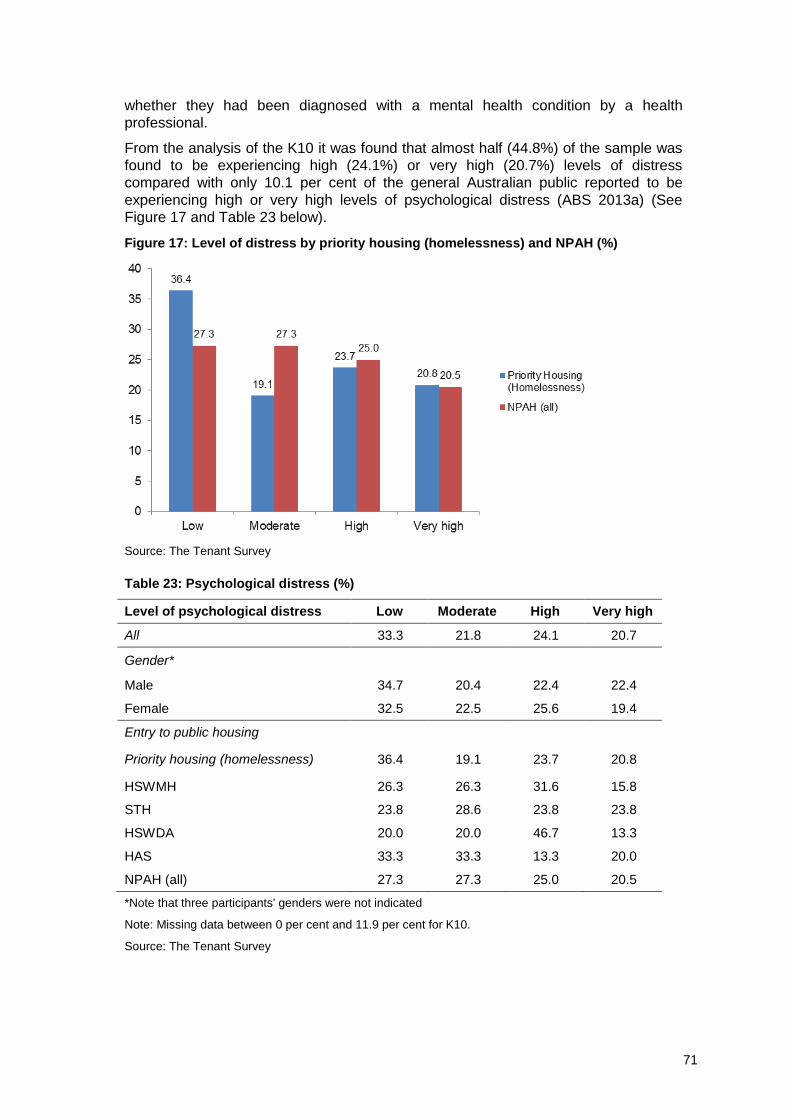
71
whether they had been diagnosed with a mental health condition by a health
professional.
From the analysis of the K10 it was found that almost half (44.8%) of the sample was
found to be experiencing high (24.1%) or very high (20.7%) levels of distress
compared with only 10.1 per cent of the general Australian public reported to be
experiencing high or very high levels of psychological distress (ABS 2013a) (See
Figure 17 and Table 23 below).
Figure 17: Level of distress by priority housing (homelessness) and NPAH (%)
Source: The Tenant Survey
Table 23: Psychological distress (%)
Level of psychological distress Low Moderate High Very high
All 33.3 21.8 24.1 20.7
Gender*
Male 34.7 20.4 22.4 22.4
Female 32.5 22.5 25.6 19.4
Entry to public housing
Priority housing (homelessness) 36.4 19.1 23.7 20.8
HSWMH 26.3 26.3 31.6 15.8
STH 23.8 28.6 23.8 23.8
HSWDA 20.0 20.0 46.7 13.3
HAS 33.3 33.3 13.3 20.0
NPAH (all) 27.3 27.3 25.0 20.5
*Note that three participants' genders were not indicated
Note: Missing data between 0 per cent and 11.9 per cent for K10.
Source: The Tenant Survey
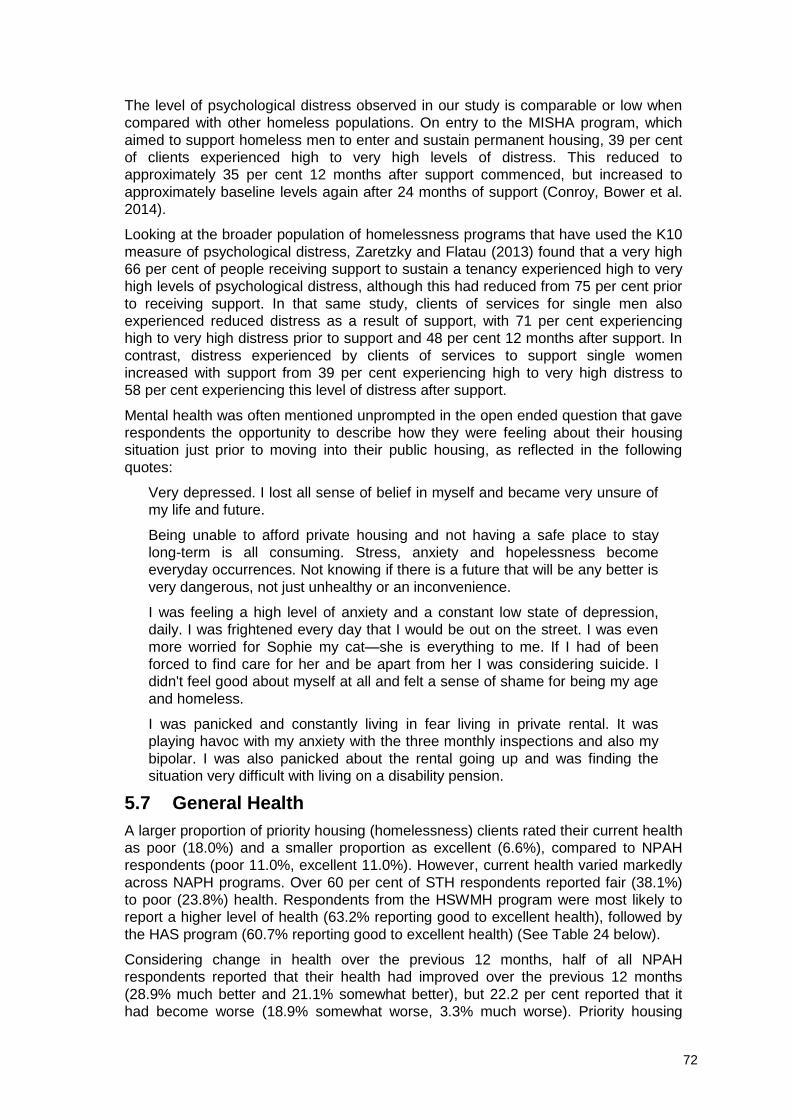
72
The level of psychological distress observed in our study is comparable or low when
compared with other homeless populations. On entry to the MISHA program, which
aimed to support homeless men to enter and sustain permanent housing, 39 per cent
of clients experienced high to very high levels of distress. This reduced to
approximately 35 per cent 12 months after support commenced, but increased to
approximately baseline levels again after 24 months of support (Conroy, Bower et al.
2014).
Looking at the broader population of homelessness programs that have used the K10
measure of psychological distress, Zaretzky and Flatau (2013) found that a very high
66 per cent of people receiving support to sustain a tenancy experienced high to very
high levels of psychological distress, although this had reduced from 75 per cent prior
to receiving support. In that same study, clients of services for single men also
experienced reduced distress as a result of support, with 71 per cent experiencing
high to very high distress prior to support and 48 per cent 12 months after support. In
contrast, distress experienced by clients of services to support single women
increased with support from 39 per cent experiencing high to very high distress to
58 per cent experiencing this level of distress after support.
Mental health was often mentioned unprompted in the open ended question that gave
respondents the opportunity to describe how they were feeling about their housing
situation just prior to moving into their public housing, as reflected in the following
quotes:
Very depressed. I lost all sense of belief in myself and became very unsure of
my life and future.
Being unable to afford private housing and not having a safe place to stay
long-term is all consuming. Stress, anxiety and hopelessness become
everyday occurrences. Not knowing if there is a future that will be any better is
very dangerous, not just unhealthy or an inconvenience.
I was feeling a high level of anxiety and a constant low state of depression,
daily. I was frightened every day that I would be out on the street. I was even
more worried for Sophie my cat—she is everything to me. If I had of been
forced to find care for her and be apart from her I was considering suicide. I
didn't feel good about myself at all and felt a sense of shame for being my age
and homeless.
I was panicked and constantly living in fear living in private rental. It was
playing havoc with my anxiety with the three monthly inspections and also my
bipolar. I was also panicked about the rental going up and was finding the
situation very difficult with living on a disability pension.
5.7 General Health
A larger proportion of priority housing (homelessness) clients rated their current health
as poor (18.0%) and a smaller proportion as excellent (6.6%), compared to NPAH
respondents (poor 11.0%, excellent 11.0%). However, current health varied markedly
across NAPH programs. Over 60 per cent of STH respondents reported fair (38.1%)
to poor (23.8%) health. Respondents from the HSWMH program were most likely to
report a higher level of health (63.2% reporting good to excellent health), followed by
the HAS program (60.7% reporting good to excellent health) (See Table 24 below).
Considering change in health over the previous 12 months, half of all NPAH
respondents reported that their health had improved over the previous 12 months
(28.9% much better and 21.1% somewhat better), but 22.2 per cent reported that it
had become worse (18.9% somewhat worse, 3.3% much worse). Priority housing
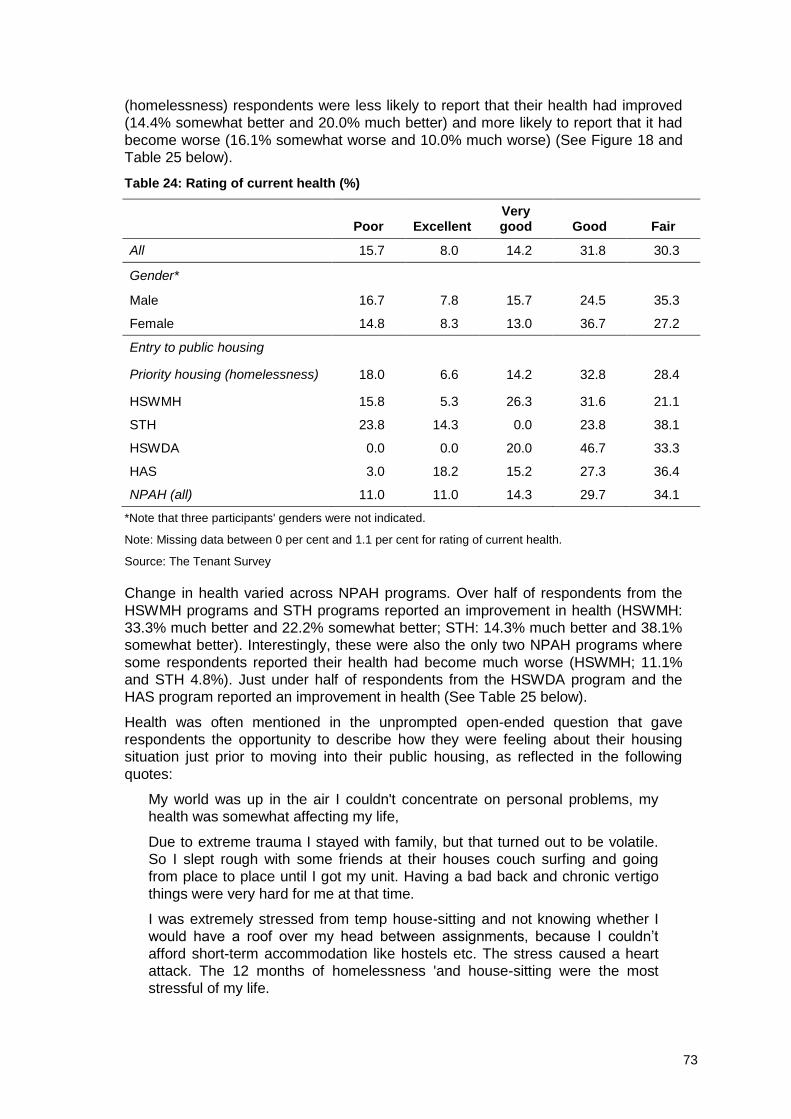
73
(homelessness) respondents were less likely to report that their health had improved
(14.4% somewhat better and 20.0% much better) and more likely to report that it had
become worse (16.1% somewhat worse and 10.0% much worse) (See Figure 18 and
Table 25 below).
Table 24: Rating of current health (%)
Poor Excellent
Very good Good Fair
All 15.7 8.0 14.2 31.8 30.3
Gender*
Male 16.7 7.8 15.7 24.5 35.3
Female 14.8 8.3 13.0 36.7 27.2
Entry to public housing
Priority housing (homelessness) 18.0 6.6 14.2 32.8 28.4
HSWMH 15.8 5.3 26.3 31.6 21.1
STH 23.8 14.3 0.0 23.8 38.1
HSWDA 0.0 0.0 20.0 46.7 33.3
HAS 3.0 18.2 15.2 27.3 36.4
NPAH (all) 11.0 11.0 14.3 29.7 34.1
*Note that three participants' genders were not indicated.
Note: Missing data between 0 per cent and 1.1 per cent for rating of current health.
Source: The Tenant Survey
Change in health varied across NPAH programs. Over half of respondents from the
HSWMH programs and STH programs reported an improvement in health (HSWMH:
33.3% much better and 22.2% somewhat better; STH: 14.3% much better and 38.1%
somewhat better). Interestingly, these were also the only two NPAH programs where
some respondents reported their health had become much worse (HSWMH; 11.1%
and STH 4.8%). Just under half of respondents from the HSWDA program and the
HAS program reported an improvement in health (See Table 25 below).
Health was often mentioned in the unprompted open-ended question that gave
respondents the opportunity to describe how they were feeling about their housing
situation just prior to moving into their public housing, as reflected in the following
quotes:
My world was up in the air I couldn't concentrate on personal problems, my
health was somewhat affecting my life,
Due to extreme trauma I stayed with family, but that turned out to be volatile.
So I slept rough with some friends at their houses couch surfing and going
from place to place until I got my unit. Having a bad back and chronic vertigo
things were very hard for me at that time.
I was extremely stressed from temp house-sitting and not knowing whether I
would have a roof over my head between assignments, because I couldn’t
afford short-term accommodation like hostels etc. The stress caused a heart
attack. The 12 months of homelessness 'and house-sitting were the most
stressful of my life.
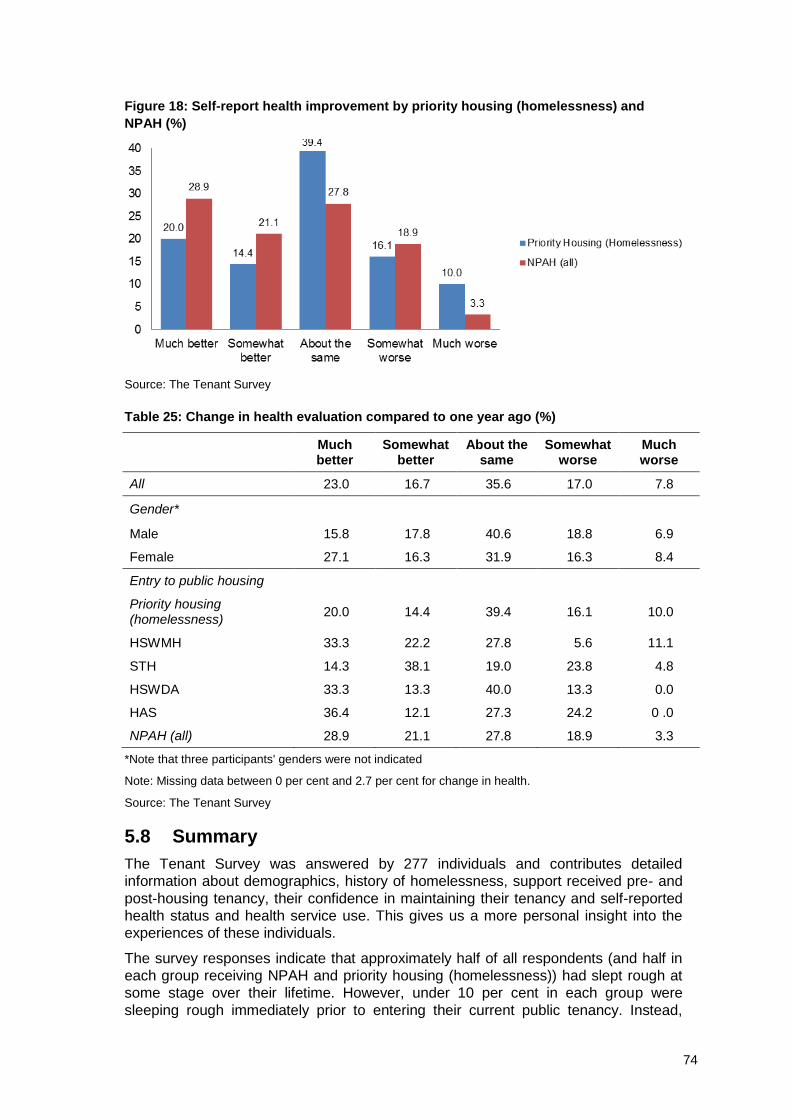
74
Figure 18: Self-report health improvement by priority housing (homelessness) and
NPAH (%)
Source: The Tenant Survey
Table 25: Change in health evaluation compared to one year ago (%)
Much better
Somewhat better
About the same
Somewhat worse
Much worse
All 23.0 16.7 35.6 17.0 7.8
Gender*
Male 15.8 17.8 40.6 18.8 6.9
Female 27.1 16.3 31.9 16.3 8.4
Entry to public housing
Priority housing (homelessness)
20.0 14.4 39.4 16.1 10.0
HSWMH 33.3 22.2 27.8 5.6 11.1
STH 14.3 38.1 19.0 23.8 4.8
HSWDA 33.3 13.3 40.0 13.3 0.0
HAS 36.4 12.1 27.3 24.2 0 .0
NPAH (all) 28.9 21.1 27.8 18.9 3.3
*Note that three participants' genders were not indicated
Note: Missing data between 0 per cent and 2.7 per cent for change in health.
Source: The Tenant Survey
5.8 Summary
The Tenant Survey was answered by 277 individuals and contributes detailed
information about demographics, history of homelessness, support received pre- and
post-housing tenancy, their confidence in maintaining their tenancy and self-reported
health status and health service use. This gives us a more personal insight into the
experiences of these individuals.
The survey responses indicate that approximately half of all respondents (and half in
each group receiving NPAH and priority housing (homelessness)) had slept rough at
some stage over their lifetime. However, under 10 per cent in each group were
sleeping rough immediately prior to entering their current public tenancy. Instead,
75
immediately prior, over 40 per cent of NPAH respondents were living in
short/medium/long-term homelessness accommodation while over 40 per cent of
priority housing (homelessness) respondents were living with family and friends.
Previous research indicates that people who are homeless are high users of tobacco,
alcohol and illicit drugs (Whittaker, Swift et al. 2015). We found that while a much
higher proportion of the study population (49.6%) indicated that they were current
smokers than the general Australian adult population (16.1%), the sample population
consumed alcohol on fewer occasions than the general population. Approximately
45 per cent of the sample had used at least one illicit drug at some point in their
lifetime. For those who entered public housing (in both NPAH and priority housing
(homelessness)), a greater percentage had consumed in the last month than in the 11
months prior. The exception is HSWMH, where zero individuals indicated that they
had consumed drugs in the last month, implying that drug use had stopped. However,
the result for other programs is not as easy to interpret. It may be that those who
consumed in the past 12 months have since stopped, or it may be that they are
infrequent but continual users. Those who consumed in the past month may be more
frequent but continual users or new users. Thus, it is not clear whether there has been
an increase in frequency of drug use, or an increase in uptake of drug use, or both.
The survey instrument only asked about most recent use, not about history, and so
we are unable to distinguish between the two.
The survey also provided more information about self-reported health status. Only
11.0 per cent of NPAH respondents and 6.6 per cent of priority housing respondents
indicated that their health was excellent. However, when considering change over the
previous 12 months, half of all NPAH respondents reported that their health had
improved. Priority housing (homelessness) respondents were less likely to report that
their health had improved, and more likely to report that it had become worse, despite
the fact that of those individuals receiving support for physical health after entering
public housing nearly two-thirds were priority housing (homelessness) clients. In terms
of mental health, the analysis of the K10 found that nearly half of the sample were
experiencing high or very high levels of distress compared to 10.1 per cent in the
general Australian population (ABS 2013a).
People experiencing homelessness frequently suffer difficulties in diverse aspects of
life. The Tenant Survey asked people to report on which issues they faced before and
after entering their tenancy, and whether they received support for it. Unsurprisingly,
the most common type of support prior to entering the tenancy was support to get a
public housing tenancy (50.9%). Other common supports received were for mental
health (31.4%), and for material needs (29.2%). After entering public housing,
29.2 per cent reported issues with mental health and 28.2 per cent reported issues
with paying rent/bills on time. About 23 per cent reported receiving support for mental
health and 18.8 per cent reported receiving support to pay rent/bills on time. For every
kind of support received after entering public housing (except finding/keeping a job,
mental health and drug/alcohol issues), individuals receiving support were more likely
to be priority housing (homelessness) clients than NPAH participants.
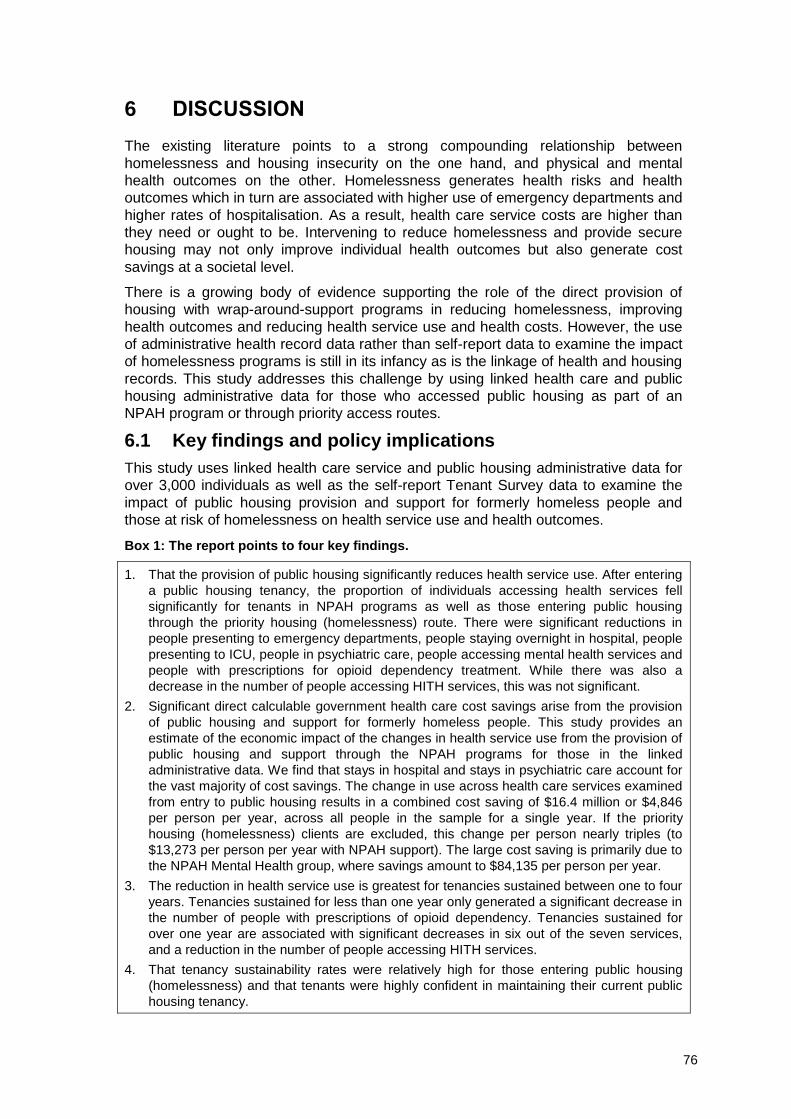
76
6 DISCUSSION
The existing literature points to a strong compounding relationship between
homelessness and housing insecurity on the one hand, and physical and mental
health outcomes on the other. Homelessness generates health risks and health
outcomes which in turn are associated with higher use of emergency departments and
higher rates of hospitalisation. As a result, health care service costs are higher than
they need or ought to be. Intervening to reduce homelessness and provide secure
housing may not only improve individual health outcomes but also generate cost
savings at a societal level.
There is a growing body of evidence supporting the role of the direct provision of
housing with wrap-around-support programs in reducing homelessness, improving
health outcomes and reducing health service use and health costs. However, the use
of administrative health record data rather than self-report data to examine the impact
of homelessness programs is still in its infancy as is the linkage of health and housing
records. This study addresses this challenge by using linked health care and public
housing administrative data for those who accessed public housing as part of an
NPAH program or through priority access routes.
6.1 Key findings and policy implications
This study uses linked health care service and public housing administrative data for
over 3,000 individuals as well as the self-report Tenant Survey data to examine the
impact of public housing provision and support for formerly homeless people and
those at risk of homelessness on health service use and health outcomes.
Box 1: The report points to four key findings.
1. That the provision of public housing significantly reduces health service use. After entering
a public housing tenancy, the proportion of individuals accessing health services fell
significantly for tenants in NPAH programs as well as those entering public housing
through the priority housing (homelessness) route. There were significant reductions in
people presenting to emergency departments, people staying overnight in hospital, people
presenting to ICU, people in psychiatric care, people accessing mental health services and
people with prescriptions for opioid dependency treatment. While there was also a
decrease in the number of people accessing HITH services, this was not significant.
2. Significant direct calculable government health care cost savings arise from the provision
of public housing and support for formerly homeless people. This study provides an
estimate of the economic impact of the changes in health service use from the provision of
public housing and support through the NPAH programs for those in the linked
administrative data. We find that stays in hospital and stays in psychiatric care account for
the vast majority of cost savings. The change in use across health care services examined
from entry to public housing results in a combined cost saving of $16.4 million or $4,846
per person per year, across all people in the sample for a single year. If the priority
housing (homelessness) clients are excluded, this change per person nearly triples (to
$13,273 per person per year with NPAH support). The large cost saving is primarily due to
the NPAH Mental Health group, where savings amount to $84,135 per person per year.
3. The reduction in health service use is greatest for tenancies sustained between one to four
years. Tenancies sustained for less than one year only generated a significant decrease in
the number of people with prescriptions of opioid dependency. Tenancies sustained for
over one year are associated with significant decreases in six out of the seven services,
and a reduction in the number of people accessing HITH services.
4. That tenancy sustainability rates were relatively high for those entering public housing
(homelessness) and that tenants were highly confident in maintaining their current public
housing tenancy.
77
This report provides a clear indication that the provision of stable housing is effective
in reducing health care service use and associated costs. Providing stable housing
should, therefore, be a first priority to improving not only housing outcomes, but health
outcomes and consequently health care costs. This is particularly the case for
individuals with mental health issues who are also experiencing homelessness or who
are at risk of homelessness. The most significant reductions in health service use and
associated cost savings observed in this study related to mental health; both within
the NPAH program that provided access to housing and support for people referred
through the mental health system and more broadly, for a significant reduction in the
proportion of people accessing hospital-based psychiatric care in three of the NPAH
programs.
While mental health has traditionally been cast as the remit of the health sector, there
is increasing recognition, confirmed by the findings of the present study, that many of
the key determinants of mental illness, and avenues for effectively improving mental
wellbeing lie outside of the health sector (Fisher and Baum 2010). Encouragingly, this
has been recognised in the 2015 Mental Health Commission review of mental health
programs and services in Australia, which highlights the crucial role that non-clinical
services and other sectors outside of health play in the prevention of and recovery
from mental illness (Australian Government 2015). Housing first type initiatives are in
fact cited as an illustrative example in the Mental Health Commission review, which
notes that the 'initial expenditure will be more than offset with savings in use of crisis
and inpatient services' (Australian Government n.d).
The earlier Council of Australian Governments (COAG) roadmap for mental health
reform (COAG 2012) also referred to housing and homelessness as one of the
sectors that can play a critical role in fulfilling governments’ commitment to 'develop
better mental health services and support across all relevant government portfolios,
including mental health, health, education, early childhood, child protection, youth,
employment and workplace relations, housing and homelessness, police and the
justice system'. This aligns well with the NPAH program themes of more joined-up
service provision and support for people who are homeless or require support to
access or maintain housing tenancy.
Our findings also point to the importance of continued support for highly vulnerable
entrants to public housing, and, in particular, those with a history of severe and
persistent mental illness who are either homeless or at risk of homelessness. They
further support the need for integrated care arrangements and for a holistic approach
to health issues that recognises the importance of housing and of support in terms of
improved health outcomes. These conclusions align strongly with recent mental health
system reforms being rolled out across Australia, which advocate for a more
integrated and stepped care approach for those individuals with greater mental health-
related needs (Turnbull and Ley 2015). The NPAH program in this study that showed
greatest reductions in health service use overall was the mental health support
program (HSWMH), which provided a case management approach to mental health
support as well as assisting its clients to access and maintain suitable long-term
accommodation and source other forms of support. More broadly, there were also
reductions in mental health-related service use among participants in some of the
other NPAH programs, which suggests that securing stable housing and addressing
other forms of support can also contribute significantly to preventing and reducing the
massive burden of mental health in Australia. These findings highlight the potential for
multi-faceted interventions to simultaneously improve mental health and
homelessness outcomes, and yield cost savings in both domains. From a policy
perspective this provides compelling evidence not only for the continuation of NPAH
78
and similar programs, but also for the roll out of more integrated programs that have a
tripartite homelessness, housing and health agenda.
Beyond mental health, housing has been described as a central element in tackling
broader health inequalities (Shaw 2004), but systematic reviews highlight the need for
better evidence as to what constitutes effective interventions (Prior and Harfield
2012). This study helps to address this evidence gap, as it provides some compelling
evidence for the role that programs such as NPAH can play not only in reducing
homelessness, but also simultaneously improving health outcomes that will yield a
significant cost saving to government overall. The findings in particular support the
role of public housing as a foundation for non-shelter outcomes and in particular
health outcomes. Inter-sectoral solutions and integration are popular terms in public
policy discourse currently at both federal and jurisdictional level, and our findings
suggest that the NPAH initiative (with housing, health and other social support
elements) serves as an effective example of a more integrated approach in action.
These findings highlight the potential for multi-faceted interventions to simultaneously
improve mental health and homelessness outcomes, and yield cost savings in both
domains. From a policy perspective, this provides compelling evidence not only for the
continuation of NPAH and similar programs, but also for the roll out of more integrated
programs that have a dual homelessness and health agenda.
Linked data sets are an increasingly important resource for shaping and evaluating
public policy initiatives in a range of sectors, including health care, housing, and social
services (Kamateri, Panopoulou et al. 2015; Olver 2014). Originating in health
research, there is now substantial evidence of the way in which linking datasets can
provide key evidence to guide health policy towards better outcomes (Olver 2014).
Emerging expansions of linked data analysis across other areas of research further
exemplifies the enormous opportunity this presents to direct and evaluate policy and
programs in a range of sectors, including homelessness. As articulated by Petrila
(2014):
Policy initiatives in one area—for instance, housing—typically can affect
individual and community outcomes in other areas such as health or
education. As a result, analyzing data from only one system frequently results
in a one dimensional perspective that misses myriad outcomes in other
systems, and thus makes it more difficult to accurately diagnose a problem
and develop a solution.
One example of linked data expansion for future research is including homelessness
data with health and housing data. It was our intention to do so in the present study,
but we were advised to await the results of a study by AIHW (2015) which linked data
from Specialist Homelessness Services (SHS) agencies and public housing
authorities in WA and NSW. AIHW identified 18,688 public housing tenants who
sought support from SHS either before or during their public housing tenancy, or after
losing it. Two key results highlight the importance of linking housing and
homelessness data. First, of those adults assisted by specialist homelessness
agencies into public housing who then exited public housing, just under one-half
returned to a specialist homelessness agency for support (AIHW 2015a). Second, of
those who only accessed support from SHS agencies after losing their public housing
tenancy, almost half were identified as homeless (AIHW 2015a). A critical piece of
future research is to extend the current work so that it combines the homelessness,
health and housing data.
There appears to be a significant risk of becoming homeless after losing a public
housing tenancy. This is reflected in the responses to the Tenant Survey; while
79
confidence in maintaining tenancies was generally high, frequently respondents
commented that there was constant anxiety about becoming homeless (again). Those
who did not sustain their public housing tenancies were found to be more likely to
have complex and multiple needs, reporting a greater need for mental health and drug
and alcohol support services. Future work in this area should consider not only the
relationship between housing and health, but also the impact of experiences with
homelessness.
There remain considerable challenges, however, for researchers wishing to have
timely access to linked data, particularly when multiple data sets are sought from
different jurisdictions or sectors. For the homelessness and housing sector, this
hinders the realisation of the vast opportunities that linked data can yield for public
policy and the forging of greater links between research, policy and practice. But as
has been demonstrated in WA’s renowned data linkage initiative, concerns about
confidentiality, privacy and use for intended purpose only can be rigorously addressed
(Olver 2014). There is a general consensus in the international literature and
Australian discourse that there is currently suboptimal use of big data and linked data
for policy-making and collaborative social impact (Misur
homelessness field has much to gain if this can be more effectively harnessed, and
indeed AHURI is well placed to support greater use of linked data in its portfolio of
research.
While this study has emphasised the significant potential benefits from a health
system and public resource allocation perspective of housing people who have been
homeless, the cost-effectiveness of initiatives such as NPAH and priority housing
(homelessness) is but one part of their justification; as more fundamentally, access to
shelter is a key human right, as is health. Thus the coupling of public housing with
access to support is also a more humane approach to the problem of homelessness
(Salit, Kuhn et al. 1998).
6.2 Limitations and future research
As previously stated, there are significant benefits to linking health, housing and
homelessness data in future research. As part of that analysis, it would be ideal to
examine health service use, homelessness and housing outcomes for those eligible
for the NPAH programs in question and for the priority access programs but who did
not receive support. We believe that this may be possible with careful linkage of the
health, corrective services and homelessness data, but this will require an exploratory
study to examine the extent to which this can be realised. One area of difficulty is that
homelessness administrative data may identify some of those eligible but has limited
ability to provide broader outcome measures on which to gauge the impact of
accommodation outcomes on non-accommodation aspects of client’s lives and on
aspects of government expenditure outside of homelessness. Further linkage with
Centrelink data may be required.
Future research can also consider a more precise pricing of heath care use than that
relevant for the present exercise. For example, the reported average costs for each
category of health service incident (e.g., emergency visit, psychiatric care) were used,
and this may mask variations in costs associated with different subcategories of those
incidents (e.g., an emergency department visit for a more critical or complex health
issue). As the specific reasons for particular emergency visits were not included in the
analysed data, we had to use an average cost per visit (or per day in hospital), rather
than, for example, the health condition that prompted the visit. It is acknowledged also
that the costs of service delivery may vary between different hospitals (e.g., between
a small regional versus large metropolitan hospital), but this was not identifiable within
80
the data available. Future studies with more disaggregated data may be able to
explore this further, but from a government policy perspective, the aggregated picture
of potential cost savings is nonetheless appropriate.
A limitation with the Tenant Survey is the low response rate. The Tenant Survey has a
response rate half that of comparable studies (i.e., surveys of Western Australian
public housing tenants), one main reason for this was the inability to send out any
reminders, or call and prompt tenants to complete our survey. As a result of this, the
demographics of the Tenant Survey are skewed in comparison to the demographics
of the public housing tenant list with the mean age of survey participants higher and a
smaller proportion of Indigenous participants.
There is a potential non-response bias for a number of questions; overall tenants were
confident in being able to keep their tenancy, this could be influenced by the fact that
tenants who were not confident also did not feel confident answering the survey;
Indigenous Australians are under-represented in the Tenant Survey, thus there is
potential that the proportion of smokers is also under-represented as Indigenous
Australians are 2.5 times more likely to smoke tobacco daily; results that alcohol
consumption is lower in the study population compared with the general population
could be due to the over-representation of females in the Tenant Survey, as females
are considerably less likely than males to drink alcohol in potentially harmful
quantities; drug usage may also be under represented in the Tenant Survey data as
males aged 20–29 are the most likely to have used an illicit substance in the past 12
months and older females made up the majority of survey respondents.
Another limitation of the Tenant Survey is that it was only produced in English. This
poses a potential sampling bias by excluding participants from culturally and
linguistically diverse groups.
81
REFERENCES
ABS, (2013a) Profiles of Health, Australia, 2011–2013 Psychological Distress, cat. no.
4338.0, Australian Bureau of Statistics, http://www.abs.gov.au/ausstats/
[email protected]/Lookup/4338.0main+features42011-13.
ABS, (2013b) Profiles of Health, Australia 2011–2013 Tobacco Smoking, cat. no.
4338.0, Australian Bureau of Statistics,
http://www.abs.gov.au/ausstats/[email protected]/Lookup/by%20Subject/4338.0~2011
-13~Main%20Features~Tobacco%20smoking~10008.
AIHW (2006) Towards a National Prisoner Health Information System, cat. no. PHE
79, Australian Institute of Health and Welfare, Canberra.
AIHW (2014a) Housing Assistance for Indigenous Australians, cat. no. IHW 131,
Australian Institute of Health and Welfare, Canberra.
AIHW (2014b) National Drug Strategy Household Survey Detailed Report 2013,
Australian Institute of Health and Welfare, Canberra.
AIHW (2014c) National Social Housing Survey Detailed Results 2014. cat. no. HOU
278, Australian Institute of Health and Welfare, Canberra.
AIHW (2014d) Prisoner Health Services in Australia 2012, bulletin no. 123, cat. no.
AUS 183, Australian Institute of Health and Welfare, Canberra.
AIHW (2015a), Exploring Transitions Between Homelessness and Public Housing,
cat. no. HOU 277, Australian Institute of Health and Welfare, Canberra.
AIHW (2015b), Expenditure on Mental Health Services, Australian Institute of Health
and Welfare, Canberra, https://mhsa.aihw.gov.au/resources/expenditure/.
AIHW (2016), Clients exiting custodial arrangements, accessed 3 February 2016,
http://www.aihw.gov.au/homelessness/specialist-homelessness-services-
2014-15/exiting-custodial-arrangements/.
Altena, A. M., Brilleslijper-Kater, S.N. and Wolf, J.R. (2010) 'Effective interventions for
homeless youth: A systematic review', American Journal of Preventive
Medicine, vol. 38, no. 6: 637–645.
ARTD (2010) Review of the Homelessness Intervention Project, report to the NSW
Department of Premier and Cabinet, ARTD Consultants, Sydney.
Australian Government (2015) Australian Government Response to Contributing
Lives, Thriving Communities—Review of Mental Health Programmes and
Services, Department of Health, Canberra, Australia.
Australian Government (n.d) Fact Sheet 8—What This Means for Non-Clinical
Support Services such as Housing, Employment, Education, Justice and
Welfare, National Mental Health Commission.
Baggett, T.P., Chang, Y., Singer, D.E., Porneala, B.C., Gaeta, J.M., O’Connell, J.J.
and Rigotti, N.A. (2014) 'Tobacco-, alcohol-, and drug-attributable deaths and
their contribution to mortality disparities in a cohort of homeless adults in
Boston', American Journal of Public Health, vol. 105, no. 6: 1189–1197.
Baggett, T.P., Tobey, M.L. and Rigotti, N.A. (2013) 'Tobacco use among homeless
people—addressing the neglected addiction', New England Journal of
Medicine, vol. 369, no. 3: 201–204.
82
Baker, E., Mason, K., Bentley, R. and Mallett, S. (2014) 'Exploring the bi-directional
relationship between health and housing in Australia', Urban Policy and
Research, vol. 32, no. 1: 71–84.
Baldry, E., McDonnell, D., Maplestone, P. and Peeters, M. (2006) 'Ex-prisoners,
homelessness and the state in Australia', Australian & New Zealand Journal of
Criminology, vol. 39, no. 1: 20–33.
Brown, R.T., Miao, Y., Mitchell, S.L., Bharel, M., Patel, M., Ard, K.L., Grande, L.J.,
Blazey-Martin, D., Floru, D. and Steinman, M.A. (2015) 'Health Outcomes of
Obtaining Housing Among Older Homeless Adults', American Journal of Public
Health, vol. 105, no. 7: 1482–1488.
Bruce, J., McDermott, S., Ramia, I., Bullen, J. and Fisher, K.R. (2012) Evaluation of
the Housing and Accommodation Support Initiative (HASI) Final Report, A
report by the Social Policy Research Centre and ARDT Consultants for NSW
Health and Housing NSW.
Calsyn, R.J. and Winter, J.P. (2002) 'Social support, psychiatric symptoms, and
housing: a causal analysis', Journal of Community Psychology, vol. 30, no. 3:
247–259.
Cant, R., Meddin, B. and Penter, C. (2013) 'National Partnership Agreement on
Homelessness; Evaluation of Western Australian Programs; Final Report',
Social Systems & Evaluations, Perth, Western Australia.
Chamberlain, C. and Mackenzie, D. (1992) 'Understanding contemporary
homelessness: issues of definition and meaning', The Australian Journal of
Social Issues, vol. 27, no. 4: 274.
Chartier, M., Carrico, A.W., Weiser, S.D., Kushel, M.B. and Riley, E.D. (2012)
'Specific psychiatric correlates of acute care utilization among unstably housed
HIV-positive adults', AIDS Care, vol. 24, no. 12: 1514–1518.
Cheung, A, Somers, J, Moniruzzaman, A, Patterson, M, Frankish, C, Krausz, M &
Palepu, A (2015), 'Emergency department use and hospitalizations among
homeless adults with substance dependence and mental disorders', Addiction
Science & Clinical Practice, vol. 10, no. 1: 17.
COAG (2012) The Roadmap for National Mental Health Reform 2012–2022,
Australian Government, Canberra.
Conroy, E., Bower, M., Flatau, P., Zaretzky, K., Eardley, T. and Burns, L. (2014) The
MISHA Project. From Homelessness to Sustained Housing 2010–2013, A
Research Report produced for Mission Australia.
Corporation for Supportive Housing (2004) Benefits of Supportive Housing: Changes
in Residents’ Use of Public Services, report prepared by Harder+Company
Community Research, Corporation for Supportive Housing, New York.
Culhane, D.P., Metraux, S. and Hadley, T. (2002) 'Public service reductions
associated with placement of homeless persons with severe mental illness in
supportive housing', Housing Policy Debate, vol. 13, no. 1: 107–163.
DCP, National Partnership Agreement on Homelessness Western Australian
Initiatives Information Update, Department of Child Protection,
https://www.dcp.wa.gov.au/servicescommunity/Documents/NPAHFactSheet.p
df.
83
Deloitte Access Economics (2011) Economic Analysis of Hospital in the Home (HITH),
Hospital in the Home Society of Australasia, Deloitte Access Economics,
Australia.
Department of Health (2014) Hospital Morbidity Data System (HMDS) Reference
Manual, July 2014, Department of Health, Government of Western Australia.
Department of Social Services (2008) The Road Home: A National Approach to
Reducing Homelessness, Commonwealth of Australia, Canberra.
DeSilva, M.B., Manworren, J. and Targonski, P. (2011) 'Impact of a Housing First
program on health utilization outcomes among chronically homeless persons',
Journal of Primary Care & Community Health, vol. 2, no. 1: 16–20.
Fatovich, D. and Hirsch, R. (2003) 'Entry overload, emergency department
overcrowding, and ambulance bypass', Emergency Medicine Journal, vol. 20,
no. 5: 406–409.
Fazel, S., Geddes, J.R. and Kushel, M. (2014) 'The health of homeless people in
high-income countries: descriptive epidemiology, health consequences, and
clinical and policy recommendations', The Lancet, vol. 384, no. 9953: 1529–
1540.
Fazel, S., Khosla, V., Doll, H. and Geddes, J. (2008) 'The prevalence of mental
disorders among the homeless in western countries: systematic review and
meta-regression analysis', PLoS Med, vol. 5, no. 12: e225.
Feigal, J., Park, B., Bramante, C., Nordgaard, C., Menk, J. and Song, J. (2014)
'Homelessness and discharge delays from an urban safety net hospital', Public
Health, vol. 128, no. 11: 1033–1035.
Fisher, M. and Baum, F. (2010) 'The social determinants of mental health:
implications for research and health promotion', Australian and New Zealand
Journal of Psychiatry, vol. 44, no. 12: 1057–1063.
Fitzpatrick-Lewis, D., Ganann, R., Krishnaratne, S., Ciliska, D., Kouyoumdjian, F. and
Hwang, S.W. (2011) 'Effectiveness of interventions to improve the health and
housing status of homeless people: a rapid systematic review', BMC Public
Health, vol. 11, no. 1: 638.
Flatau, P., Conroy, E., Marchant, T., Burns, L., Spicer, B., Di Nicola, K., Edwards, R.,
Bauskis, A., Athanassios, M. and Larsen, K. (2012) 'The Michael Project
2007–2010', New Perspectives and Possibilities for Homeless Men, Sydney:
Mission Australia.
Flatau, P., Conroy, E., Marchant, T., Burns, L., Spicer, B., Nicola, K.D., Edwards, R.,
Bauskis, A., Athanassios, M. and Larsen, K. (2010), Increasing our
understanding of homeless men: the Michael Project, Mission Australia,
Sydney.
Flatau, P. and Zaretzky, K. (2008) 'The economic evaluation of homelessness
programmes', European Journal of Homelessness, 2 (December), 305, vol.
320.
Flatau, P., Zaretzky, K., Brady, M., Haigh, Y. and Martin, R. (2008) The Cost-
Effectiveness of Homelessness Programs: A First Assessment, Melbourne,
Vic.
Folsom, D.P., Hawthorne, W., Lindamer, L., Gilmer, T., Bailey, A., Golshan, S.,
Garcia, P., Unützer, J., Hough, R. and Jeste, D.V. (2005) 'Prevalence and risk
84
factors for homelessness and utilization of mental health services among
10,340 patients with serious mental illness in a large public mental health
system', American Journal of Psychiatry, vol. 162, no. 2: 370–376.
Foster, G., Gronda, H., Mallett, S. and Bentley, R. (2011) Precarious Housing and
Health: Research Synthesis, Australian Housing and Urban Research Institute,
Hanover Welfare Services, University of Melbourne, University of Adelaide and
Melbourne Citymission, Australia.
Gilmer, T.P., Stefancic, A., Ettner, S.L., Manning, W.G. and Tsemberis, S. (2010)
'Effect of Full-Service Partnerships on Homelessness, Use and Costs of
Mental Health Services, and Quality of Life Among Adults With Serious Mental
Illness', Archives of General Psychiatry, vol. 6, no. 67.
Government of Western Australia (2015) Priority Public Housing Assistance, Housing
Authority, accessed 3 February 2016, http://www.housing.wa.gov.au/
housingoptions/rentaloptions/publichousing/priority/Pages/default.aspx.
Gulcur, L., Stefancic, A., Shinn, M., Tsemberis, S. and Fischer, S.N. (2003) 'Housing,
hospitalization, and cost outcomes for homeless individuals with psychiatric
disabilities participating in continuum of care and housing first programmes',
Journal of Community & Applied Social Psychology, vol. 13, no. 2: 171–186.
Health Data Standards Committee (HDSC) (2006) National Health Data Dictionary,
version 13, National health data dictionary, cat. no. HWI 88, AIHW, Canberra.
accessed 18 May 2016, http://www.aihw.gov.au/publication-
detail/?id=6442467867.
Holman, C.D.J., Bass, A.J., Rouse, I.L. and Hobbs, M.S.T. (1999) 'Population‐based
linkage of health records in Western Australia: development of a health
services research linked database', Australian and New Zealand Journal of
Public Health, vol. 23, no. 5: 453–459.
IHPA (2015) 'National Hospital Cost Data Collection Australian Public Hospitals Cost
Report 2012–13, Round 17'.
Johnson, G., Kuehnle, D., Parkinson, S., Sesa, S. and Tseng, Y. (2014) 'Sustaining
exits from long-term homelessness: A randomised controlled trial examining
the 48 month social outcomes from the Journey to Social Inclusion pilot
program', Sacred Heart Mission, St Kilda.
Kamateri, E., Panopoulou, E., Tambouris, E., Tarabanis, K., Ojo, A., Lee, D. and
Price, D. (2015) 'A comparative analysis of tools and technologies for policy
making', in Policy Practice and Digital Science, vol. 10, eds M. Janssen, M.A.
Wimmer and A. Deljoo, Springer International Publishing: 125–156.
Kim, T.W., Kertesz, S.G., Horton, N.J., Tibbetts, N. and Samet, J.H. (2006) 'Episodic
homelessness and health care utilization in a prospective cohort of HIV-
infected persons with alcohol problems', BMC Health Services Research, vol.
6, no. 1: 1.
Kushel, M.B., Perry, S., Clark, R., Moss, A.R. and Bangsberg, D. (2002) 'Emergency
department use among the homeless and marginally housed: Results from a
community-based study', American Journal of Public Health, vol. 92, no. 5:
778–784.
Kushel, M.B., Vittinghoff, E. and Haas, J.S. (2001), 'Factors associated with the health
care utilization of homeless persons', JAMA, vol. 285, no. 2: 200–206.
85
Larimer, M.E., Malone, D.K., Garner, M.D., Atkins, D.C., Burlingham, B., Lonczak,
H.S., Tanzer, K., Ginzler, J., Clifasefi, S.L., Hobson, W.G. and Marlatt, A.G.
(2009) 'Health care and public service use and costs before and after provision
of housing for chronically homeless persons with severe alcohol problems',
The Journal of the American Medical Association, vol. 13, no. 301.
Mares, A.S. and Rosenheck, R.A. (2011) 'A comparison of treatment outcomes
among chronically homelessness adults receiving comprehensive housing and
health care services versus usual local care', Administration and Policy in
Mental Health and Mental Health Services Research, vol. 38, no. 6: 459–475.
Martinez, T.E. and Burt, M.R. (2006) 'Impact of permanent supportive housing on the
use of acute care health services by homeless adults', Psychiatric Services,
vol. 57, no. 7: 992–999.
Misuraca, G., Mureddu, F. and Osimo, D. (2014), 'Policy-making 2.0: unleashing the
power of big data for public governance', in Open Government, vol. 4, eds M.
Gascó-Hernández, Springer, New York: 171–188.
Moore, G., Gerdtz, M. and Manias, E. (2007) 'Homelessness, health status and
emergency department use: an integrated review of the literature',
Australasian Emergency Nursing Journal, vol. 10, no. 4: 178–185.
Nooe, R.M. and Patterson, D.A. (2010) 'The ecology of homelessness', Journal of
Human Behavior in the Social Environment, vol. 20, no. 2: 105–152.
OAG (2012) Implementation of the National Partnership Agreement on Homelessness
in Western Australia: Report 13 to October 2012, Office of the Auditor General,
Western Australia, Perth.
Olver, I. (2014) 'Linking data to improve health outcomes', Medical Journal of Australia
vol. 7: 368–369.
Perlman, J. and Parvensky, J. (2006) 'Denver Housing First collaborative', Cost
Benefit Analysis and Program Outcomes Report. Colorado Coalition for the
Homeless, Colorado.
Petrila, J., Data Integration for Social Policy: Challenges and Opportunities,
http://www.whatcountsforamerica.org/portfolio/data-integration-for-social-
policy-challenges-and-opportunities/.
Prior, J. and Harfield, S. (2012), 'Health, well-being and vulnerable populations'.
International Encyclopedia of Housing and Home, Vol. 2: 355 - 361.
Redelmeier, D., Molin, J-P. and Tibshirani, R.J. (1995) 'A randomised trial of
compassionate care for the homeless in an emergency department', The
Lancet, vol. 345, no. 8958: 1131–1134.
Richardson, D.B. and Mountain, D. (2009) 'Myths versus facts in emergency
department overcrowding and hospital access block', Medical Journal of
Australia, vol. 190, no. 7: 369.
Rieke, K., Smolsky, A., Bock, E., Erkes, L.P., Porterfield, E. and Watanabe-Galloway,
S. (2015) 'Mental and nonmental health hospital admissions among chronically
homeless adults before and after supportive housing placement', Social Work
in Public Health, vol. 30, no. 6: 496–503.
Rog, D.J., Marshall, T., Dougherty, R.H., George, P., Daniels, A.S., Ghose, S.S. and
Delphin-Rittmon, M.E. (2014) 'Permanent supportive housing: assessing the
evidence', Psychiatric Services, vol. 65, no. 3: 287–294.
86
Russolillo, A.L., Patterson, M., McCandless, L., Moniruzzaman, A. and Somers, J.
(2014) Emergency Department Utilization Among Formerly Homeless Adults
with Mental Disorders After 1-year of Housing First: A Randomized Controlled
Trial, International Journal of Housing Policy vol. 14, no. 1: 79–97.
Sadowski, L.S., Kee, R.A., VanderWeele, T.J. and Buchanan, D. (2009), 'Effect of a
housing and case management program on emergency department visits and
hospitalizations among chronically ill homeless adults: A randomized trial.',
The Journal of the American Medical Association, vol. 17, no. 301.
Salit, S.A., Kuhn, E.M., Hartz, A.J., Vu, J.M. and Mosso, A.L. (1998), 'Hospitalization
costs associated with homelessness in New York City', New England Journal
of Medicine, vol. 338, no. 24: 1734–1740.
Shaw, M. (2004) 'Housing and public health', Annual Review of Public Health, vol. 25:
397–418.
Shinn, M., Knickman, J.R. and Weitzman, B.C. (1991) 'Social relationships and
vulnerability to becoming homeless among poor families', American
Psychologist, vol. 46, no. 11: 1180.
Social Policy Research Centre (2007) Housing and Accommodation Support Initiative
[HASI] Stage 1 Evaluation Report, prepared for NSW Department of Health,
Social Policy Research Centre, University of New South Wales, Sydney.
Sodhi-Berry, N., Knuiman, M., Alan, J., Morgan, V.A. and Preen, D.B. (2015) 'Pre-
and post-sentence mental health service use by a population cohort of older
offenders (‡45 years) in Western Australia', Social Psychiatry Psychiatric
Epidemiology, vol. 50: 1097–1110.
Sodhi-Berry, N., Knuiman, M., Preen, D.B., Alan, J. and Morgan, V.A. (2014)
'Predictors of post-sentence mental health service use in a population cohort
of first-time adult offenders in Western Australia', Criminal Behaviour and
Mental Health, vol. 25, no. 5: 355–374.
Spicer B., Smith, D.I., Conroy, E., Flatau, P., Burns, L. (2015), Mental Illness and
Housing Outcomes Among a Sample of Homeless Men in an Australian Urban
Centre, Australian & New Zealand Journal of Psychiatry, vol. 49, no. 5: 471–
480.
Taylor, M.P., Pevalin, D.J. and Todd, J. (2007) 'The psychological costs of
unsustainable housing commitments', Psychological medicine, vol. 37, no. 07:
1027–1036.
The Lancet (2014), 'Health of the homeless (editorial)', The Lancet, vol. 384, no. 9953:
1478, 31 October.
Tsai, J., Kasprow, W.J. and Rosenheck, R.A. (2014) 'Alcohol and drug use disorders
among homeless veterans: Prevalence and association with supported
housing outcomes', Addictive Behaviors, vol. 39, no. 2: 455–460.
Turnbull, M. and Ley, S. (2015) Media Release: A New Blueprint for Mental Health
Services, Canberra, Australia.
Whittaker, E., Swift, W., Roxburgh, A., Dietze, P., Cogger, S., Bruno, R., Sindicich, N.
and Burns, L. (2015) 'Multiply disadvantaged: Health and service utilisation
factors faced by homeless injecting drug consumers in Australia', Drug and
Alcohol Review, vol. 34, no. 4: 379–387.
87
Zaretzky, K. and Flatau, P. (2013) The Cost of Homelessness and the Net Benefit of
Homelessness Programs: A National Study, Final Report no.218, Australian
Housing and Urban Research Institute, Melbourne,
www.ahuri.edu.au/research/final-reports/218.
Zaretzky, K. and Flatau, P. (2015) The Cost Effectiveness of Australian Tenancy
Support Programs for Formerly Homeless People, AHURI Final Report no.
252, Australian Housing and Urban Research Institute, Melbourne,
www.ahuri.edu.au/research/final-reports/252.
Zaretzky, K., Flatau, P. and Brady, M. (2008) 'What is the (net) cost to government of
homelessness programs?', The Australian Journal of Social Issues, vol. 43,
no. 2: 231–254.
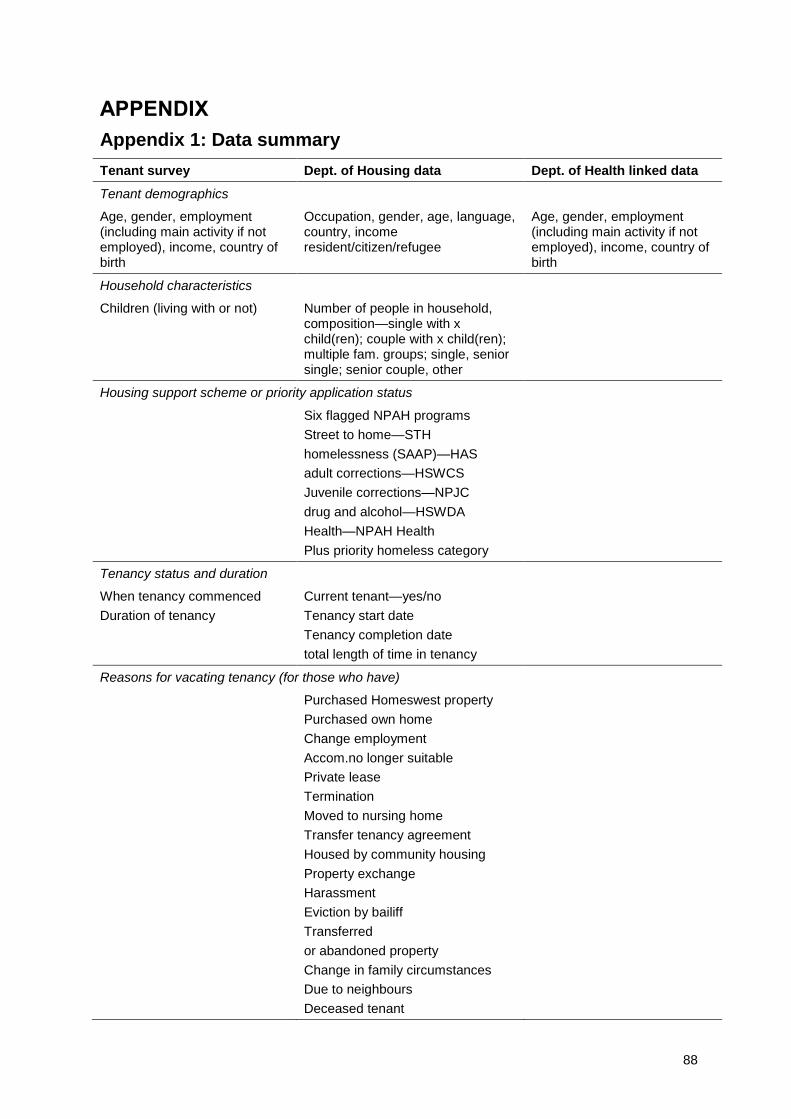
88
APPENDIX
Appendix 1: Data summary
Tenant survey Dept. of Housing data Dept. of Health linked data
Tenant demographics
Age, gender, employment (including main activity if not employed), income, country of birth
Occupation, gender, age, language, country, income resident/citizen/refugee
Age, gender, employment (including main activity if not employed), income, country of birth
Household characteristics
Children (living with or not) Number of people in household, composition—single with x child(ren); couple with x child(ren); multiple fam. groups; single, senior single; senior couple, other
Housing support scheme or priority application status
Six flagged NPAH programs
Street to home—STH
homelessness (SAAP)—HAS
adult corrections—HSWCS
Juvenile corrections—NPJC
drug and alcohol—HSWDA
Health—NPAH Health
Plus priority homeless category
Tenancy status and duration
When tenancy commenced
Duration of tenancy
Current tenant—yes/no
Tenancy start date
Tenancy completion date
total length of time in tenancy
Reasons for vacating tenancy (for those who have)
Purchased Homeswest property
Purchased own home
Change employment
Accom.no longer suitable
Private lease
Termination
Moved to nursing home
Transfer tenancy agreement
Housed by community housing
Property exchange
Harassment
Eviction by bailiff
Transferred
or abandoned property
Change in family circumstances
Due to neighbours
Deceased tenant
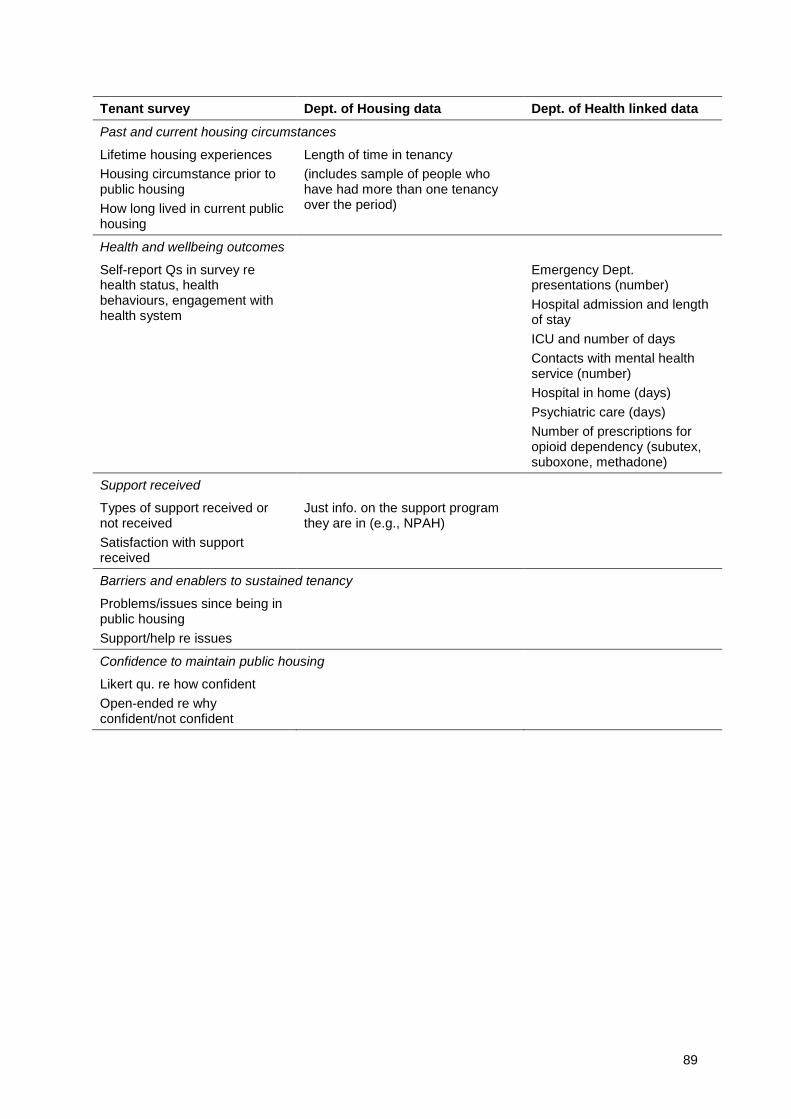
89
Tenant survey Dept. of Housing data Dept. of Health linked data
Past and current housing circumstances
Lifetime housing experiences
Housing circumstance prior to public housing
How long lived in current public housing
Length of time in tenancy
(includes sample of people who have had more than one tenancy over the period)
Health and wellbeing outcomes
Self-report Qs in survey re health status, health behaviours, engagement with health system
Emergency Dept. presentations (number)
Hospital admission and length of stay
ICU and number of days
Contacts with mental health service (number)
Hospital in home (days)
Psychiatric care (days)
Number of prescriptions for opioid dependency (subutex, suboxone, methadone)
Support received
Types of support received or not received
Satisfaction with support received
Just info. on the support program they are in (e.g., NPAH)
Barriers and enablers to sustained tenancy
Problems/issues since being in public housing
Support/help re issues
Confidence to maintain public housing
Likert qu. re how confident
Open-ended re why confident/not confident
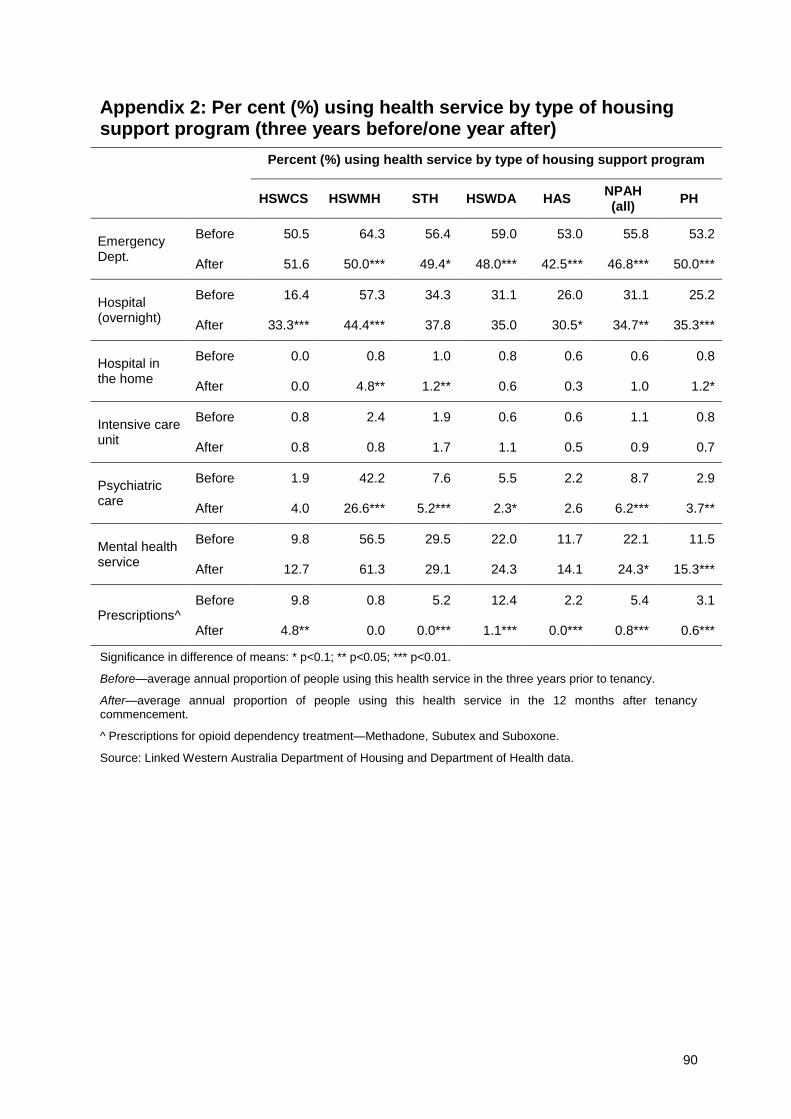
90
Appendix 2: Per cent (%) using health service by type of housing support program (three years before/one year after)
Percent (%) using health service by type of housing support program
HSWCS HSWMH STH HSWDA HAS NPAH (all)
PH
Emergency Dept.
Before 50.5 64.3 56.4 59.0 53.0 55.8 53.2
After 51.6 50.0*** 49.4* 48.0*** 42.5*** 46.8*** 50.0***
Hospital (overnight)
Before 16.4 57.3 34.3 31.1 26.0 31.1 25.2
After 33.3*** 44.4*** 37.8 35.0 30.5* 34.7** 35.3***
Hospital in the home
Before 0.0 0.8 1.0 0.8 0.6 0.6 0.8
After 0.0 4.8** 1.2** 0.6 0.3 1.0 1.2*
Intensive care unit
Before 0.8 2.4 1.9 0.6 0.6 1.1 0.8
After 0.8 0.8 1.7 1.1 0.5 0.9 0.7
Psychiatric care
Before 1.9 42.2 7.6 5.5 2.2 8.7 2.9
After 4.0 26.6*** 5.2*** 2.3* 2.6 6.2*** 3.7**
Mental health service
Before 9.8 56.5 29.5 22.0 11.7 22.1 11.5
After 12.7 61.3 29.1 24.3 14.1 24.3* 15.3***
Prescriptions^ Before 9.8 0.8 5.2 12.4 2.2 5.4 3.1
After 4.8** 0.0 0.0*** 1.1*** 0.0*** 0.8*** 0.6***
Significance in difference of means: * p<0.1; ** p<0.05; *** p<0.01.
Before—average annual proportion of people using this health service in the three years prior to tenancy.
After—average annual proportion of people using this health service in the 12 months after tenancy commencement.
^ Prescriptions for opioid dependency treatment—Methadone, Subutex and Suboxone.
Source: Linked Western Australia Department of Housing and Department of Health data.
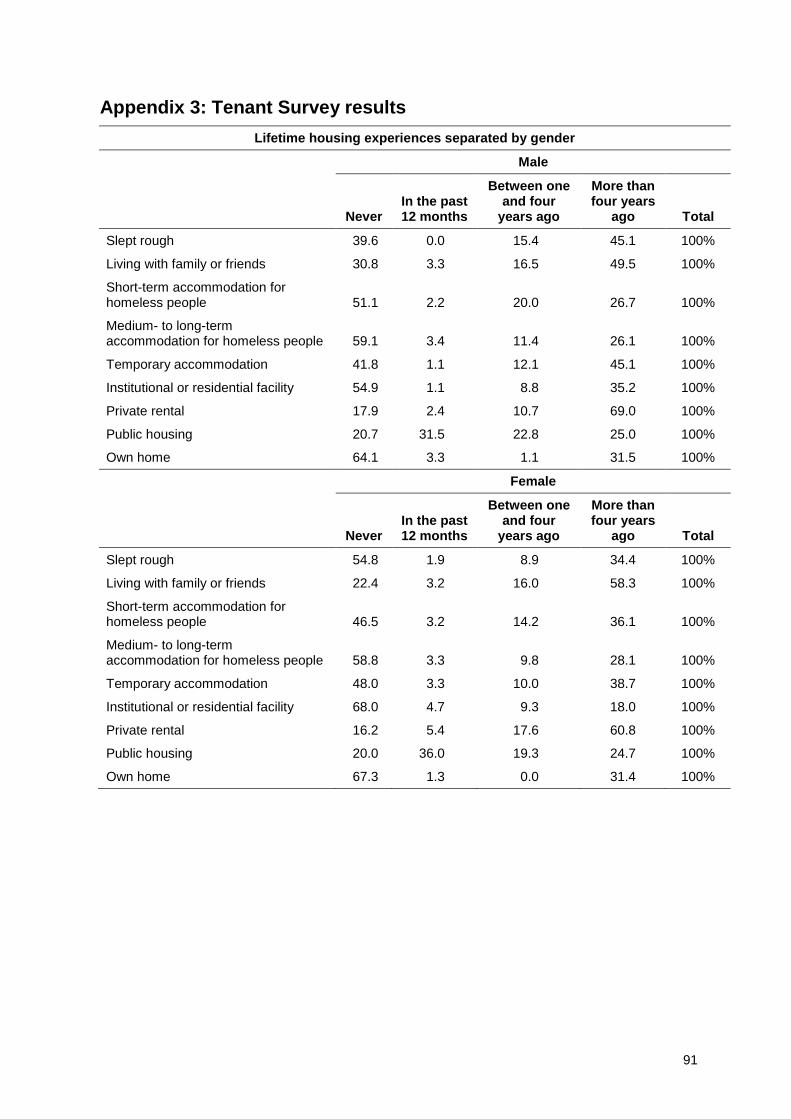
91
Appendix 3: Tenant Survey results
Lifetime housing experiences separated by gender
Male
Never In the past 12 months
Between one and four
years ago
More than four years
ago Total
Slept rough 39.6 0.0 15.4 45.1 100%
Living with family or friends 30.8 3.3 16.5 49.5 100%
Short-term accommodation for homeless people 51.1 2.2 20.0 26.7 100%
Medium- to long-term accommodation for homeless people 59.1 3.4 11.4 26.1 100%
Temporary accommodation 41.8 1.1 12.1 45.1 100%
Institutional or residential facility 54.9 1.1 8.8 35.2 100%
Private rental 17.9 2.4 10.7 69.0 100%
Public housing 20.7 31.5 22.8 25.0 100%
Own home 64.1 3.3 1.1 31.5 100%
Female
Never In the past 12 months
Between one and four
years ago
More than four years
ago Total
Slept rough 54.8 1.9 8.9 34.4 100%
Living with family or friends 22.4 3.2 16.0 58.3 100%
Short-term accommodation for homeless people 46.5 3.2 14.2 36.1 100%
Medium- to long-term accommodation for homeless people 58.8 3.3 9.8 28.1 100%
Temporary accommodation 48.0 3.3 10.0 38.7 100%
Institutional or residential facility 68.0 4.7 9.3 18.0 100%
Private rental 16.2 5.4 17.6 60.8 100%
Public housing 20.0 36.0 19.3 24.7 100%
Own home 67.3 1.3 0.0 31.4 100%

AHURI Research Centres
AHURI Research Centre—Curtin University
AHURI Research Centre—RMIT University
AHURI Research Centre—Swinburne University of Technology
AHURI Research Centre—The University of Adelaide
AHURI Research Centre—The University of New South Wales
AHURI Research Centre—The University of Sydney
AHURI Research Centre—The University of Western Australia
AHURI Research Centre—University of Tasmania
Australian Housing and Urban Research Institute
Level 1, 114 Flinders Street, Melbourne Victoria 3000
Phone +61 3 9660 2300
Email [email protected] Web www.ahuri.edu.au