Embed Size (px)
Citation preview

Paper for LoWER-conference ‘Comb
26-27 October 2001
Amsterdam, 10 August, 2001
Cees NIEROP
University of Amsterdam
Roetersstraat 11
1018 WB Amsterdam
The Netherlands
Tel. +31(0)20 – 525 4053
Email: [email protected]
What are the Consequenc
Arrangements for
es of Non-Standard Work
the quality of life?
ining Home, Work and Education’,
, Braga, Portugal
2
Abstract
In the present paper, an attempt is made to measure the consequences for the quality of life of
working with a part-time and/or temporary contract. Quality of life has been defined in a
utilitarian and a liberal way. In the utilitarian definition, the quality of life is determined by
the extent to which one is happy or satisfied with his or her life. In the liberal definition, it is
not happiness which is the chief human end, but living according to one’s own, freely formed,
conception of the good life. The liberal definition used in this paper builds on the works of
John Rawls and Amartya Sen. In the estimation, cohort effects, the gender-dimension and
education-differentials are taken into account.
The main conclusions of the research are (i) that temporary work arrangements either on a
full-time or on a part-time base decrease the life-satisfaction and, in addition, decrease the
capabilities for freely living according to one’s conception of the good-life. This holds
especially for the lower-educated employees. (ii) Working part-time increases in most cases
the life-satisfaction and the capabilities for a high quality of life in the liberal sense. This
holds especially for women.
3
I. Introduction
Non-standard work arrangements � such as part-time work and temporary employment � have
risen significantly over the past decades. Increasing competion by global changes, forced
employers at the end of the 70s to drop the rigid and secure labour relations of the post-war
era, and to search for greater flexibility in employment to counterbalance the rapid changes in
the world market and consumer�s demands. Labour laws designed to protect employees with
permanent contracts, also encouraged employers to search for other work arrangements in
order to avoid the mandates and the costs associated with these laws.
Non-standard work arrangements offer the employer certain advantages. The employer
is better able � as compared to permanent, full-time work arrangements � to recruit or dispose
of labour as required, to alter labour costs in line with market needs, to allocate labour
efficiently within the firm and to fix working hours to suit business requirements [Reilly
1998]. Flexible work arrangements, such as fixed-term contracts, temporary work agency
employment, variable working hours, on call employment etc. are important instruments of
adjustment for the employer.
However, flexible work arrangements seem to have negative consequences for
employees. It is often associated with lower pay, insecurity, stress, and social exclusion.
Studies of the US indicate that most of the part-time work is involuntary (Kalleberg 2000,
Blank). Moreover, part-time work is also often associated with marginal employment in low-
paid, low status jobs (such as sales, catering, and cleaning) (Nolan et al. 2001; Kalleberg
2000: 345). Most studies have shown that part-timers earn less per hour than full-timers, even
after controlling for education, experience and other relevant factors. Also most of the
temporary work seems to be involuntary and also temporary workers earn on average less
than regular workers (Kalleberg 2000). It is said that working in flexible work arrangements
has severe social consequences.
On the other hand, however, there are a number of circumstances in which flexible
work arrangements could offer the employee some important benefits. A flexible job could
offer the employee opportunities to combine domestic needs and life-style preferences with
working part-time or temporary. For example, an employee who works temporary has � in
contrast to the employee with a permanent contract � the opportunity to have long holidays.
Furthermore, temporary work could enhance the work variety.

4
In the present paper, I will investigate which of the tendencies mentioned above is
strongest. Whether working in flexible work arrangements leads primarily to feelings of
insecurity, loss of confidence and decreases the opportunities to live according to the own
preferences, or whether it leads to feelings of freedom, happiness and increases the
opportunities for autonomous living. In answering the questions cohort effects, the gender-
dimension, and education-differentials will be taken into account. The research question will
be answered with the help of the German Socio Economic Panel Data (GSOEP).
The next section describes the data, section III gives an overview of the incidence of
part-time and temporary work in Germany in the mid-nineties. Section IV and V explain and
develop the concept of �quality of life� with the help of the GSOEP-variables. In section VII
and VIII results will be presented and analysed.
II. The data
The data are taken from the German Socio Economic Panel Data (GSOEP), the 1996 wave.
The GSOEP is a household survey which is annually taken. The sample consists of 6574
unweighted individuals1. They are all employed and between 16 and 64 years old. The sample
multiplied by the individual weighting factors is supposed to be national representative.
Working non-standard is in this paper defined as working less than 35 hours per week or
working with a contract of limited duration. In the present paper the individuals are weighted
by the standardised weighting factor. That is: the individual weighting factor is divided by the
mean of the weighting factor of the sample. Hence, the mean of the new constructed
weighting factor is exactly 1.
In order to measure whether part-time and/or temporary work leads to a lower quality
of life, we should know where part-time and temporary work is primary located. If part-time
and/or temporary work is concentrated in the �unpleasant� jobs, the probability of a
correlation between a low quality of life is much larger. However, this needs not to be caused
by the type of work-arrangement. The next section gives an overview of the incidence of part-
time and temporary work in Germany in the mid-nineties.
1 In the appendix, more information on the sample-size.
5
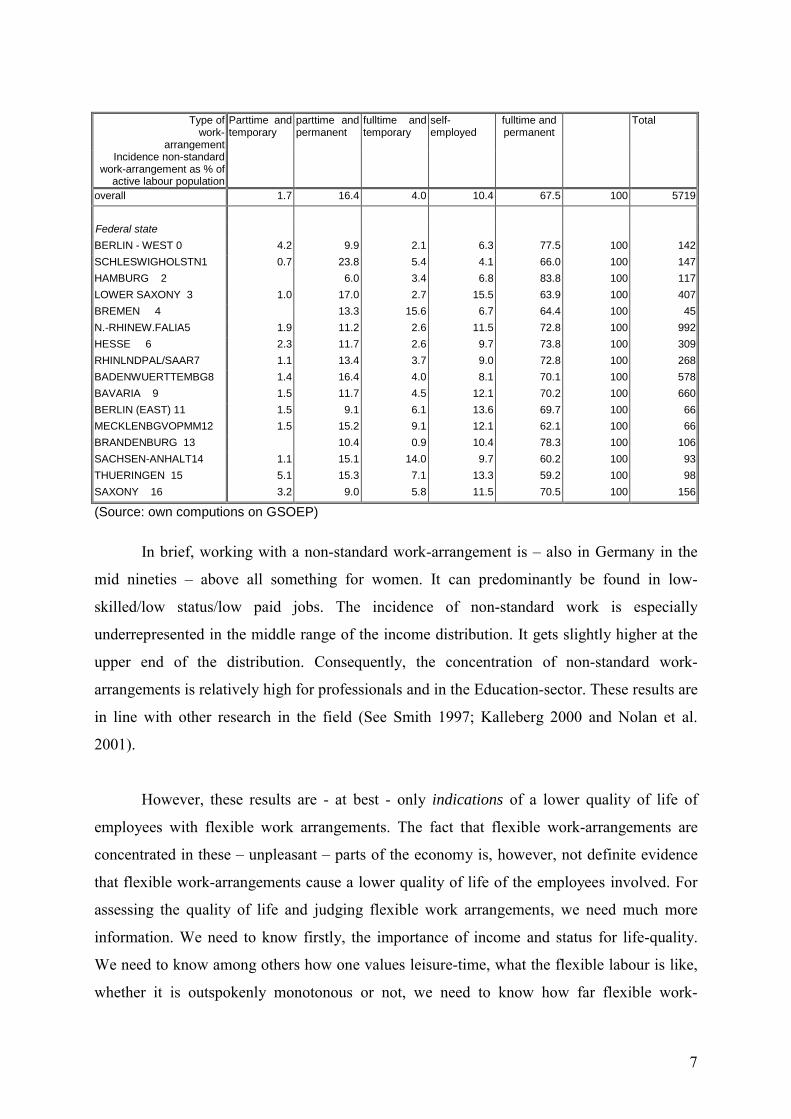
III. The incidence of part-time and temporary work in Germany in the mid-nineties
Table 1 shows the incidence of non-standard work-arrangements in Germany in 1996 by a
range of labour-market characteristics. It shows firstly that working part-time and/or
temporary is far more typical for women than for men. Secondly, temporary work is primary
located in the age-category 15-24: almost three times as much of the adolescent work with a
temporary contract than the rest of the labour population does. Furthermore, Part-time and
permanent work-arrangements are more typical for the older employees. The incidence of
part-time work in the age-category 55-64 exceeds slightly the overall mean.
If one takes the industry into account, one sees that non-standard work-arrangements
is primary located in the government and non-profit industries. Especially the scores on part-
time work in the industries mentioned are exceeding the average incidence of part-time work.
Furthermore, the incidence of non-standard work-arrangements in the consumer�s services,
retail and repair, and hotels and catering, is very high.
Regarding the incidence of non-standard work-arrangements by occupation, the
conclusion must be drawn that working part-time is more typical for the low-skilled and low
status jobs than for the other professions. The incidence of non-standard work-arrangements
in the categories �elementary occupations� and �service workers� are both well above the share
of the professions mentioned in total employment. Furthermore, there is a relatively high
incidence of temporary jobs in the profession �professionals�.
Health- and the Retail- and Repair-industry, are according to the research of Nolan et
al., in Germany low-paying industries (2001: 108). Thus, non-standard work-arrangements
must be located at the lower end of the income distribution. Table 1 confirms this view. If one
regards the net income distribution, one sees that the incidence of part-time and temporary
work beneath the level of 2/3 of the median of the income distribution, is almost four times
the average incidence. The high incidence of temporary and/or part-time work at the lower
end of the income distribution is not surprising. It is hard to earn as much on a part-time base
as on a full-time base. However, if one regards the incidence beneath 2/3 of the median of the
hourly wage distribution, the conclusions are almost the same : the incidence of non-standard
work-arrangements at the lower end of the hourly wage distribution are well above the
average incidence.

6
Table 1: incidence of non-standard work-arrangements
Type ofwork-
arrangement
Parttime andtemporary
parttime andpermanent
fulltime andtemporary
self-employed
fulltime andpermanent
Total
Incidence non-standardwork-arrangement as % of
active labour populationOverall 1.7 16.4 4.0 10.4 67.5 100 5719GenderMale 0.7 2.9 4.3 12.8 79.3 100 3181 Female 3.0 33.3 3.6 7.4 52.7 100 2539
Age-category16-24 years 0.7 7.2 14.4 9.8 67.9 100 30525-39 years 2.1 14.9 4.0 8.0 71.1 100 272840-54 years 1.2 19.5 2.9 13.1 63.5 100 200055-64 years 2.2 17.6 2.8 12.5 64.9 100 686
Industry by naceAB: agriculture 12.0 0.9 40.7 46.3 100 108C: mining 7.7 92.3 100 13D: manufacturing 0.5 7.0 3.2 4.4 84.9 100 1553E: utilities 1.5 1.5 3.0 94.0 100 67F: construction 5.9 3.1 10.8 80.2 100 389G50-51 Wholesale 13.8 4.1 19.5 62.6 100 123G51: Retail and repair 2.2 35.2 3.9 15.5 43.3 100 543H: hotels and catering 11.8 7.9 26.3 53.9 100 76I: Transport andcommunication
1.5 9.8 1.9 9.4 77.4 100 266
J: Financial intermediation 0.5 19.9 0.5 10.0 69.2 100 201K: business activities 18.8 0.4 43.9 36.8 100 223L: public administration 3.3 13.9 5.0 0.9 76.9 100 575M: education 5.6 31.5 6.4 10.5 46.0 100 409N: health and social work 2.4 22.9 4.8 11.7 58.1 100 454O: other community, socialand personal activities
4.3 30.1 8.0 1.2 56.4 100 163
Occupation by isco_881 legislators, senior officialsand managers
2.0 18.6 4.7 2.5 72.2 100 187
2 Proffesionals 3.2 17.8 5.0 13.2 60.7 100 1118 3 Technicians andassociate professionals
0.5 14.3 0.9 24.0 60.2 100 566
4 Clerks 1.5 23.1 2.1 2.3 71.0 100 5205 Service workers andshop and market salesworkers
2.2 26.9 3.6 6.1 61.2 100 495
6 Skilled agricultural andfishery workers
1.9 85.2 13.0 100 54
7 Craft and related tradeworkers
0.1 2.4 4.0 8.6 85.0 100 931
8 Plant and machineoperators and assemblers
0.4 3.2 6.5 7.9 82.0 100 278
9 elementary occupations 3.6 44.3 3.9 3.3 45.0 100 307
IncomeHourly wage < 2/3*median 3.8 33.8 9.1 0.7 52.6 100 681Hourly wage > 3/2*median 2.6 16.2 1.0 1.4 78.8 100 723Monthly net income <2/3*median
6.5 57.3 3.7 11.4 21.0 100 1094
Monthly net income >3/2*median
0.4 4.6 1.5 15.2 78.4 100 943
7
Type ofwork-
arrangement
Parttime andtemporary
parttime andpermanent
fulltime andtemporary
self-employed
fulltime andpermanent
Total
Incidence non-standardwork-arrangement as % of
active labour populationoverall 1.7 16.4 4.0 10.4 67.5 100 5719
Federal stateBERLIN - WEST 0 4.2 9.9 2.1 6.3 77.5 100 142SCHLESWIGHOLSTN1 0.7 23.8 5.4 4.1 66.0 100 147HAMBURG 2 6.0 3.4 6.8 83.8 100 117LOWER SAXONY 3 1.0 17.0 2.7 15.5 63.9 100 407BREMEN 4 13.3 15.6 6.7 64.4 100 45N.-RHINEW.FALIA5 1.9 11.2 2.6 11.5 72.8 100 992HESSE 6 2.3 11.7 2.6 9.7 73.8 100 309RHINLNDPAL/SAAR7 1.1 13.4 3.7 9.0 72.8 100 268BADENWUERTTEMBG8 1.4 16.4 4.0 8.1 70.1 100 578BAVARIA 9 1.5 11.7 4.5 12.1 70.2 100 660BERLIN (EAST) 11 1.5 9.1 6.1 13.6 69.7 100 66MECKLENBGVOPMM12 1.5 15.2 9.1 12.1 62.1 100 66BRANDENBURG 13 10.4 0.9 10.4 78.3 100 106SACHSEN-ANHALT14 1.1 15.1 14.0 9.7 60.2 100 93THUERINGEN 15 5.1 15.3 7.1 13.3 59.2 100 98SAXONY 16 3.2 9.0 5.8 11.5 70.5 100 156
(Source: own computions on GSOEP)
In brief, working with a non-standard work-arrangement is � also in Germany in the
mid nineties � above all something for women. It can predominantly be found in low-
skilled/low status/low paid jobs. The incidence of non-standard work is especially
underrepresented in the middle range of the income distribution. It gets slightly higher at the
upper end of the distribution. Consequently, the concentration of non-standard work-
arrangements is relatively high for professionals and in the Education-sector. These results are
in line with other research in the field (See Smith 1997; Kalleberg 2000 and Nolan et al.
2001).
However, these results are - at best - only indications of a lower quality of life of
employees with flexible work arrangements. The fact that flexible work-arrangements are
concentrated in these � unpleasant � parts of the economy is, however, not definite evidence
that flexible work-arrangements cause a lower quality of life of the employees involved. For
assessing the quality of life and judging flexible work arrangements, we need much more
information. We need to know firstly, the importance of income and status for life-quality.
We need to know among others how one values leisure-time, what the flexible labour is like,
whether it is outspokenly monotonous or not, we need to know how far flexible work-
8
arrangements are an individual choice or not, and we need to know how well a flexible work-
arrangement fits in the broader life-program of the individual. Above all, we need to define
quality of life. We need to answer the question whether quality of life should be measured in
terms of happiness and satisfaction or in terms of development or self-realisation. This is the
subject of the next section.
IV. QUALITY OF LIFE
In assessing quality of life, there are in political philosophy two dominant strands:
utilitarianism and liberalism. Of both strands, there are different versions. In the present
paper, only the basic ideas of both strands will be addressed (see for an overview of both
strands: Kymlicka 1995 and Rachels 1993).
Utilitarians define quality of life in terms of utillity. The exact definition of utility is,
however, a matter of dispute. Bentham and other early utilitarians, like John Stuart Mill, saw
utility or welfare as a desirable or agreeable state of consciousness. Bentham defined utility or
happiness as the balance of pleasure over pain. Pleasure should and will be seeked and pain
will be avoided. The experience or the sensation of pleasure is the chief good for mankind. Or
as Mill puts it: �The Utilitarian doctrine is that happiness is desirable, as an end; all other
things being desirable as means to that end� (Mill quoted in Rachels 1993: 103).
According to modern views however, pleasure and pain are much too shallow to
represent the full range of conscious states which determine an individual�s overall utility.
According to Dworkin, the concepts of �enjoyment� and �dissatisfaction� capture the range of
important conscious states much better. Therefore, the balance of enjoyment over
dissatisfaction is a more proper definition of utility. So, for increasing their utility, individuals
will seek enjoyment and avoid dissatisfaction. The better one succeeds, the happier one is and
the higher is, according to this theory, his or her quality of life. In this theory are only the
feelings of happiness important for the quality of life. How happiness should be measured is,
however, within and outside the utilitarian strand a subject of dispute (see for an overview
Kymlicka 1995, Dworkin 1981; ). One of the questions is, whether feelings of happiness
should be measured or �success� in a number of areas. Pending further inquiry, the present
paper attempts to measure feelings of happiness or satisfaction and leaves aside the success-
question.

9
The utilitarian account of �quality of life� has been the most dominant in the field of
philosophy, economics and public policy until the beginning of the seventies. Since then the
liberal account is gaining field. In the liberal account two concepts are of utmost importance:
human dignity and � related � neutrality.
The concept of human dignity, originally founded by Kant, requires that human beings
may never be used as a mean to an end. Or in Kant�s terminology: human beings are ends in
themselves. This is in sharp contrast to animals: �animals are merely means to an end. That
end is Man�, according to Kant. This is so because, firstly, human beings have desires and
goals in relation to their projects. Kant considers animals to be unable to have self-conscious
desires and goals. The second reason human beings have dignity is because they are rational
agents. That is: they are capable of making their own decisions, setting their own goals, and
guiding their own conduct by reason alone. Whilst human beings are rational agents with
rational plans and desires, they are ends in themselves. This means they may never be allowed
to be used as a mean for other ends than his own. This statement is strongly related to the
second distinctive feature of liberalism: neutrality.
Neutrality requires that we may never manipulate people, or use people to achieve our
purposes, no matter how good these purposes may be. If human beings are capable of setting
their own goals and have to be treated as ends in themselves, they should be free to pursue
their own goals and projects and the state should not reward or penalise particular projects or
conceptions of the good life. The extent to which one lives according to the own conception
of the good � happily or unhappily � determines in liberalism human dignity. And human
dignity determines instead of happiness or well-being, in liberalism the quality of life. The
questions what this dignified life consists of and which means are needed for a dignified life,
has in recent decades very persuasively been addressed by among others John Rawls and
Amartya Sen.
Building on Kant�s ideas, Rawls states that the chief human good is realising his
�higher-order-interests�. The higher-order interests are the interests concerning realising the
needs for forming, revising, and pursuing a conception of the good life (1993: 72). For
realising these higher-order interests, Rawls states that, �primary goods� are needed. The
�primary goods� are the basic liberties, income and wealth and the bases of self-respect. These
primary goods are so called �all purpose means�, things that men presumed to want whatever
else they want (1971: 260). Hence, the more primary goods one possesses, the more is one
capable of forming, revising and pursuing an own conception of the good life, which is the
chief human good. However, given the Kantian concepts of dignity and neutrality, the extent

10
to which individuals succeed in advancing their way of life, is for a liberal state not the
ultimate end. The end is to maximise the extent to which individuals are capable to succeed in
advancing their way of life. Therefore for measuring the quality of life, one should measure
the capabilities for forming, revising and pursuing a conception of the good life. These
capabilities concern, according to Rawls, the primary goods: the basic liberties, income,
wealth and the bases of self-respect.
Sen�s view of capabilities for life-quality is more broader. He sees living as a
combination of various doings and beings. These doings and beings represent part of the
states of a person � in particular the various things that he or she manages to do or be in
leading a life. Sen calls these doings and beings �functionings�. And a capability �reflects the
alternative combinations of functionings the person can achieve, and from which he or she
can choose one collection� (Sen 1993: 31, italics added - CN). According to Sen, life-quality
should be assessed in the concepts mentioned above: capabilities and functionings.
Some functionings are very basic, such as being adequately nourished, being in good
health, well sheltered, etc. For these functionings one may need for instance � among others �
Rawls�s primary goods income and wealth. (Or in Sen�s terminology: one should have the
capabitly to get enough food in order to be well nourished ( = functioning)).
Besides the basic functionings, there are also more complex functionings, such as
achieving self-respect, being socially integrated, having control over own life and � in
reference to Adam Smith � appearing in public without shame (Sen 1993). The extent to
which one has the capability to function in the ways mentioned above, determines according
to Sen the quality of life.
In the present paper, the consequences of flexible work-arrangements for the quality of
life will be assessed along the lines mentioned above. In the next section, the utilitarian and
liberal accounts of the quality of life will be further developed with the help of the variables
of the GSOEP-dataset.
V. DESCRIPTION OF THE KEY VARIABLES
The utilitarian account
In this section, an attempt will be made to operationalise the utilitarian, Rawlsian and Sennian
account of life-quality in order to determine the relationship between flexibible work-

11
arrangements and the quality of life. The three notions are all highly abstract and by way of
operationalising them, one loses much of the meaning of the concepts. However, for assessing
the consequences of for example policy or labour-market developments, measuring � even in
a poor way � the impact on the quality of life is from utmost importance.
In the GSOEP-dataset, there are two kinds of variables which attempt to measure the
well-being or happiness. Variables which measure life satisfaction and variables which
measure stress. The variables which measure life-satisfaction can be distinguished in variables
which measure general satisfaction and variables which measure domain satisfaction. With
general satisfaction is meant the satisfaction with life as a whole. In the GSOEP-dataset, two
variables measure the general satisfaction. From a scale from 1 (extremely dissatisfied) to 10
(extremely satisfied), the interviewees answer the questions: �How satisfied are you with your
life today?�, and �How happy do you think you will be in five years from now?�
Besides these general satisfaction variables, there are nine domain satisfaction-
variables in the dataset. These variables measure the satisfaction with specific domains of life
(Van Praag 2000: 2). Like the general satisfaction-variables, the domain satisfaction variables
have a scale from 1 to 10. In the dataset, the interviewee�s satisfaction with (1) health, (2)
work, (3) housework, (4) household income, (5) dwelling, (6) amount of leisure time, (7)
goods and services, (8) standard of living, and (9) environment has been measured.
In addition to the two mentioned general-satisfaction variable, I add one self-
constructed variable: the aggregate of the nine domain-satisfaction variables mentioned
above. All variables will be divided by their mean in order to make the effects comparable to
each other. In the next section, I will examine to what extent flexible work-arrangements
explain the variation of the general- and domain-satisfaction-variables.
Besides the mentioned variables which measure satisfaction, there are also in the
GSOEP-dataset several variables which measure stress. From a scale from 1 (applies fully) to
4 (does not apply), the interviewees have been asked to what extent the following statements
apply:
• Have control over own life
• Plans are successful
• Confident about future
• Not lonely

12
• enjoys work
• Able to cope with things
I have aggregated the scores on these variables and divided by the mean. This constructed
variable appears in the next sections under the name �control over life�.
Furthermore, in measuring stress, I take into account three variables which measure
from a scale from 1 (big worries) to 3 (no worries) to what extent one is worried about (1)
finances, (2) dwelling, and (3) job security. The variables will be aggregated and divided by
the mean to standardise the scores and make them comparable with the satisfaction-variables.
I call this constructed variable �the amount of worries�. In the next section, it wil be examined
to what extent flexible work-arrangements produce the feelings mentioned above and the
aggregate of the control- and worries-variables: stress.
The liberal account
In the liberal account, the focus is on human dignity and autonomy rather than on subjective
feelings of utility, well-being or satisfaction. Rawls stated that for human dignity, one should
have the capabilities to form, revise and pursue an own conception of the good life. The
primary goods reflect, according to Rawls, these capabilities. The primary goods were: the
basic liberties, income and wealth and the bases of self-respect. The more primary goods one
has, the more is one capable to live according to the own conception of the good, which is the
chief human good.
In this paper, I assume that all interviewees have the same basic liberties. The focus
will be on income and wealth, and the bases of self-respect. The primary goods income and
wealth are relatively easy to operationalise for the research. In the present paper, we use the
post-government household income as a proxy for the primary good �income� and the variable
�estimated value of the income from dividend and interest� as a proxy for wealth. How the
�bases of self-respect should be operationalised is far more complex. Pending further inquiry,
I decided to use the �control over life� variable mentioned in section IV to construct the
primary good �bases of self-respect�. This vector appears in section VI under the name
primary goods.
The proxies of the primary goods will be taken together. This metric will be an
indication of the extent to which one is capable to pursue an own conception of the good. The

13
question whether flexible work-arrangements increase or decrease this metric, will be
addressed in the next section.
Sen�s theory focuses on the extent to which one is capable to function as a human
being. For functioning as a human being, one should at least have the capabilities to be
adequately nourished, adequately sheltered, the capability of escaping avoidable morbidity
and premature mortality. In the present paper, income will serve as a proxy for these
capabilities. I assume that one should have at least two third of the median of the net
household income for elementary human functioning. And, in addition one should at least
have a fair state of health. This has been measured in the GSOEP from a scale from 1 (none)
to 3 (strong).
What exactly the capabilities for the more complex functionings are, is far more
difficult to determine. In order to operationalise Sen�s account of quality of life, I decided to
use the actual functioning in a range of areas of life as proxies for the capabilities. These are
indeed poor proxies because it leaves aside the choice element. That is: it leaves aside
whether for instance one chooses not to participate in local politics or to attend to cultural
events. Hence, if one does not participate in politics, the conclusion could be wrong that this
person lacks the capability. Nevertheless, for participating in local politics one should at least
have the capability. By observing the actual functioning, one captures at least some of the
capabilities. Pending further inquiry, I decided to measure the more complex capabilities in
the way mentioned above.
The GSOEP-dataset consists of several variables which measure from a scale from 1 (every
week) to 4 (never) the extent to which one attends to social events. The following variables
will be used for measuring the extent one is socially integrated:
• attend cultural events
• attend cinema, pop, jazz concerts
• participate in sports
• attend social gatherings
• help out friends, relatives, acquaintances
• participate in local politics
• attend church or other religious events
The construction of the variables mentioned above will appear in the next sections under the
name degree of social integration.
14
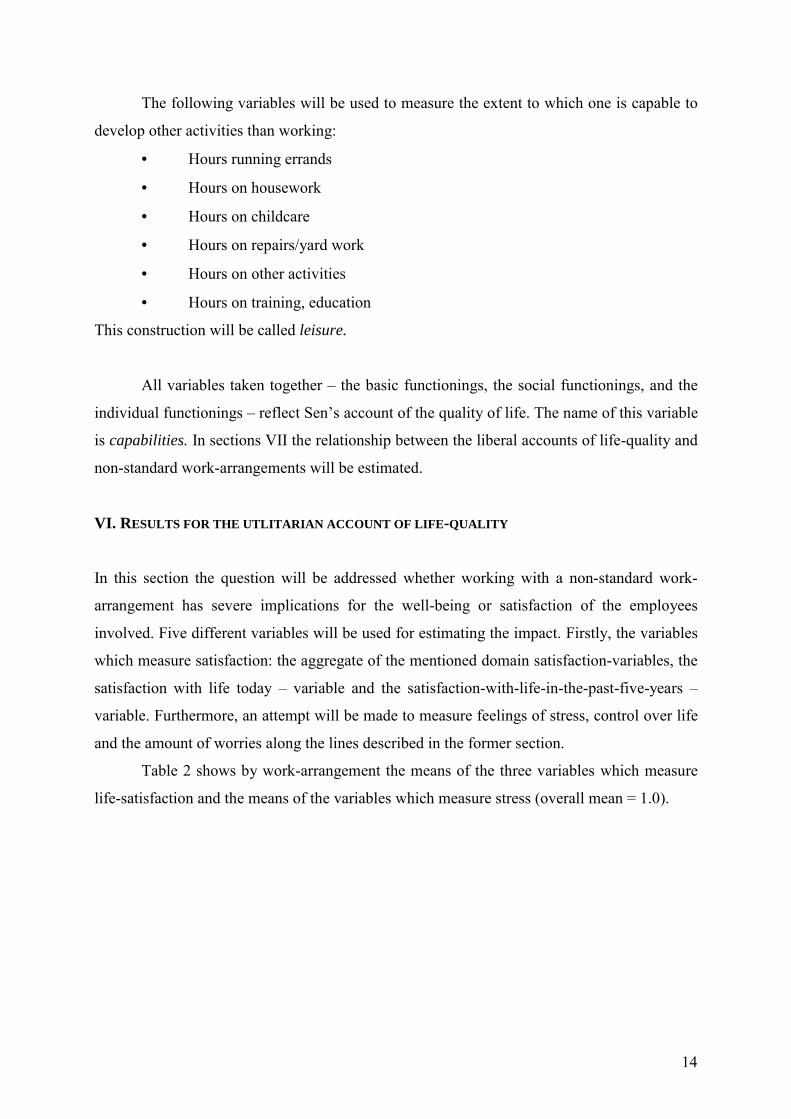
The following variables will be used to measure the extent to which one is capable to
develop other activities than working:
• Hours running errands
• Hours on housework
• Hours on childcare
• Hours on repairs/yard work
• Hours on other activities
• Hours on training, education
This construction will be called leisure.
All variables taken together � the basic functionings, the social functionings, and the
individual functionings � reflect Sen�s account of the quality of life. The name of this variable
is capabilities. In sections VII the relationship between the liberal accounts of life-quality and
non-standard work-arrangements will be estimated.
VI. RESULTS FOR THE UTLITARIAN ACCOUNT OF LIFE-QUALITY
In this section the question will be addressed whether working with a non-standard work-
arrangement has severe implications for the well-being or satisfaction of the employees
involved. Five different variables will be used for estimating the impact. Firstly, the variables
which measure satisfaction: the aggregate of the mentioned domain satisfaction-variables, the
satisfaction with life today � variable and the satisfaction-with-life-in-the-past-five-years �
variable. Furthermore, an attempt will be made to measure feelings of stress, control over life
and the amount of worries along the lines described in the former section.
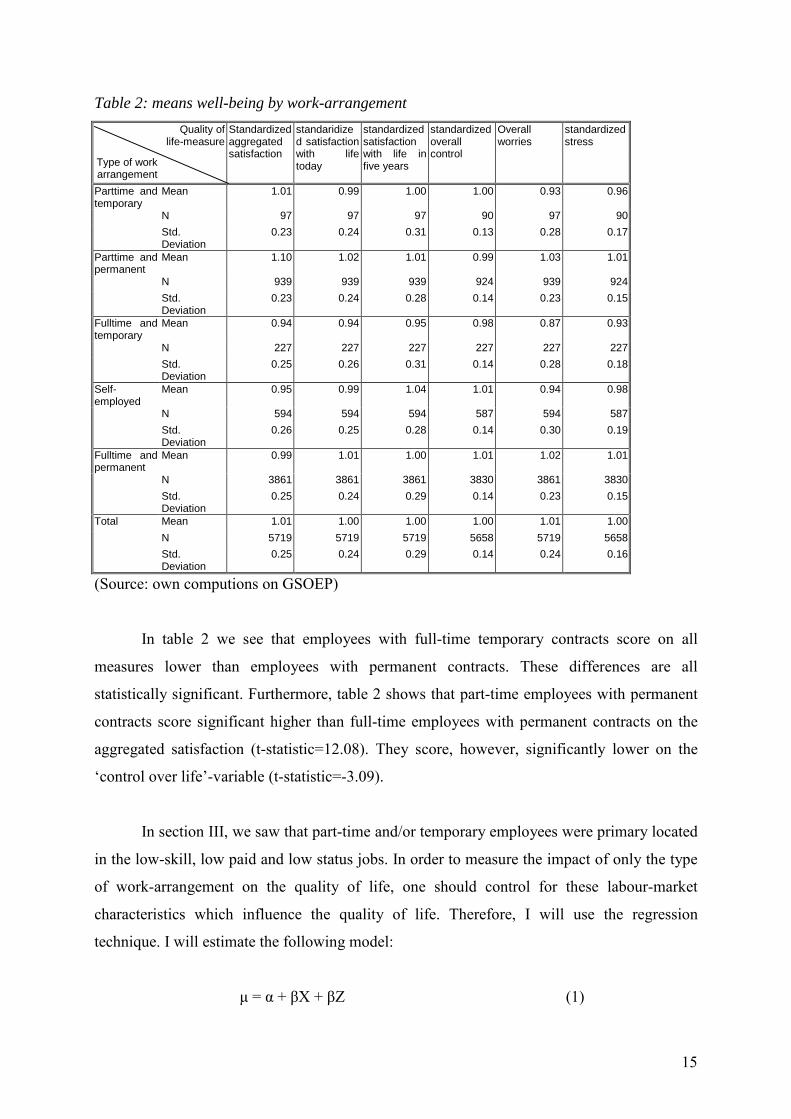
Table 2 shows by work-arrangement the means of the three variables which measure
life-satisfaction and the means of the variables which measure stress (overall mean = 1.0).
15
Table 2: means well-being by work-arrangementQuality of
life-measure
Type of workarrangement
Standardizedaggregatedsatisfaction
standaridized satisfactionwith lifetoday
standardizedsatisfactionwith life infive years
standardizedoverallcontrol
Overallworries
standardizedstress
Parttime andtemporary
Mean 1.01 0.99 1.00 1.00 0.93 0.96
N 97 97 97 90 97 90Std.Deviation
0.23 0.24 0.31 0.13 0.28 0.17
Parttime andpermanent
Mean 1.10 1.02 1.01 0.99 1.03 1.01
N 939 939 939 924 939 924Std.Deviation
0.23 0.24 0.28 0.14 0.23 0.15
Fulltime andtemporary
Mean 0.94 0.94 0.95 0.98 0.87 0.93
N 227 227 227 227 227 227Std.Deviation
0.25 0.26 0.31 0.14 0.28 0.18
Self-employed
Mean 0.95 0.99 1.04 1.01 0.94 0.98
N 594 594 594 587 594 587Std.Deviation
0.26 0.25 0.28 0.14 0.30 0.19
Fulltime andpermanent
Mean 0.99 1.01 1.00 1.01 1.02 1.01
N 3861 3861 3861 3830 3861 3830Std.Deviation
0.25 0.24 0.29 0.14 0.23 0.15
Total Mean 1.01 1.00 1.00 1.00 1.01 1.00N 5719 5719 5719 5658 5719 5658Std.Deviation
0.25 0.24 0.29 0.14 0.24 0.16
(Source: own computions on GSOEP)
In table 2 we see that employees with full-time temporary contracts score on all
measures lower than employees with permanent contracts. These differences are all
statistically significant. Furthermore, table 2 shows that part-time employees with permanent
contracts score significant higher than full-time employees with permanent contracts on the
aggregated satisfaction (t-statistic=12.08). They score, however, significantly lower on the
�control over life�-variable (t-statistic=-3.09).
In section III, we saw that part-time and/or temporary employees were primary located
in the low-skill, low paid and low status jobs. In order to measure the impact of only the type
of work-arrangement on the quality of life, one should control for these labour-market
characteristics which influence the quality of life. Therefore, I will use the regression
technique. I will estimate the following model:
µ = α + βX + βZ (1)

16
where µ is subsequently the aggregated satisfaction, the satisfaction with life today, the
expected satisfaction with life the next five years, the control over life, the amount of worries,
and the amount of stress, α is the constant, X the type of working-arrangement and Z includes
dummies for gender, age, children, industry, profession, income and federal state.
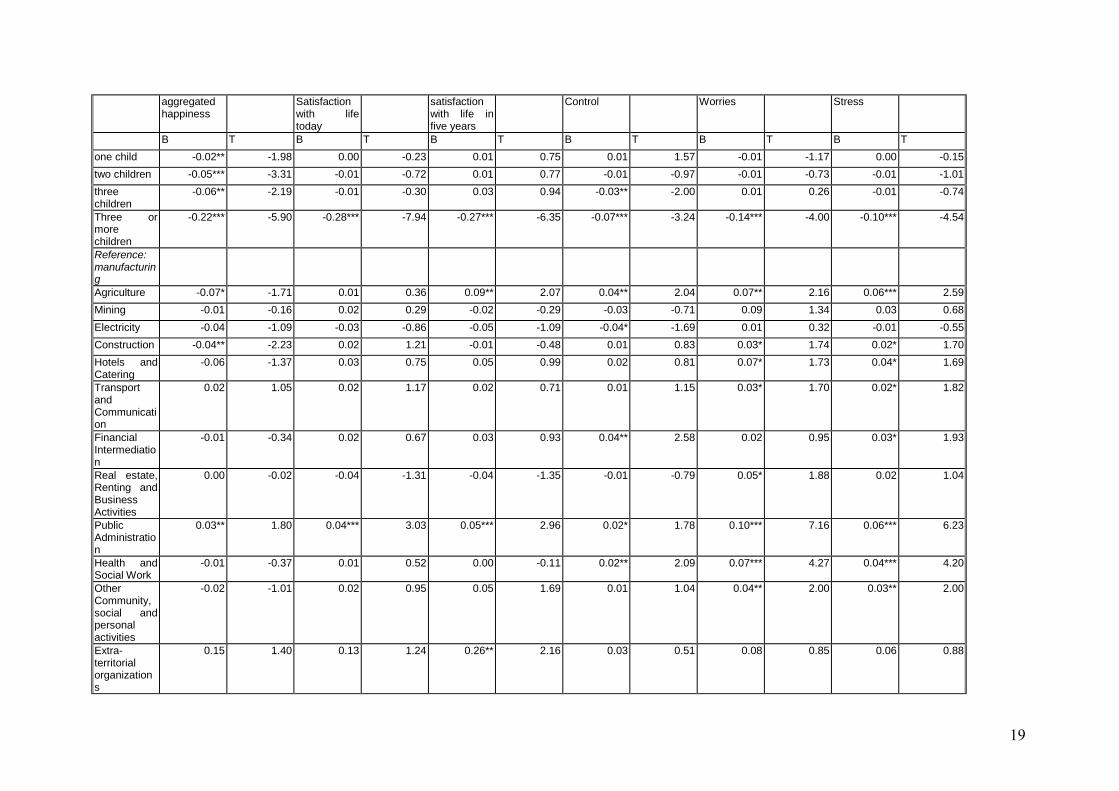
In the following tables the α and the β�s are estimated in the whole sample and in different
sub-samples. Table 3 reports the estimates for the whole sample.

Table 3: Regression on satisfaction-measuresaggregated happiness satisfaction with life today satisfaction with life in five
yearscontrol worries stress
B T B T B T B T B T B T(Constant) 1.38*** 10.95 1.41*** 11.71 1.35*** 9.38 1.18*** 16.54 1.26 11.05 1.22*** 16.09Reference:full-time,permanent,maleparttime andtemporary
-0.06 -1.40 -0.08** -2.14 -0.08* -1.62 -0.03 -1.50 -0.04 -1.13 -0.04 -1.56
parttime andpermanent
-0.01 -0.31 -0.04 -1.20 -0.03 -0.97 -0.04** -2.26 0.03 1.12 0.00 -0.22
fulltime andtemporary
-0.04* -1.92 -0.05** -2.37 -0.05** -2.30 -0.01 -0.77 -0.15*** -7.93 -0.08*** -6.34
parttime andfemale
0.09** 2.58 0.06** 1.93 0.08** 2.03 0.03* 1.85 0.03 0.84 0.03 1.50
Female 0.06*** 4.95 -0.01 -0.91 0.00 0.19 -0.02*** -2.84 -0.02 -1.44 -0.02** -2.42Reference:40-54 yrs16-24 years -0.06 -1.54 -0.02 -0.52 0.03 0.70 -0.01 -0.65 0.01 0.33 0.00 -0.0624-39 years 0.00 0.26 0.03 1.61 0.07*** 3.13 0.00 0.17 0.03** 1.88 0.02 1.5055-64 years -0.03 -1.45 -0.08*** -3.42 -0.06** -2.11 -0.01 -0.57 -0.07*** -3.29 -0.04*** -2.75Age ofindividual
-0.01** -2.27 -0.02*** -3.93 -0.02*** -3.57 -0.01** -2.81 -0.02*** -4.71 -0.02*** -4.87
age squared 0.00 1.81 0.00*** 3.82 0.00*** 3.14 0.00** 2.13 0.00*** 4.93 0.00*** 4.71Reference:high-schoolless thanhighschool
0.00 0.44 0.01 0.91 0.01 0.62 -0.01 -1.58 -0.01 -1.54 -0.01* -1.90
more thanhighschool
-0.01 -0.71 0.00 0.06 0.02 1.04 0.03*** 3.50 0.07*** 6.24 0.05*** 6.34
Reference:hourly wagebetween 2/3*median and3/2* medianhourly wage< 2/3 *median
-0.05** -2.48 -0.02 -1.14 0.01 0.58 -0.01 -1.39 -0.03** -1.81 -0.02** -2.02

18
aggregatedhappiness
Satisfactionwith lifetoday
satisfactionwith life infive years
Control Worries Stress
B T B T B T B T B T B Thourly wage> 3/2 *median
-0.01 -0.29 -0.02 -0.83 -0.02 -0.81 0.00 -0.29 0.00 -0.21 0.00 -0.30
hourly wage 0.00** -2.00 0.00 1.32 0.01*** 2.58 0.00*** 3.09 0.01*** 4.25 0.01*** 4.65Hourly wagesquared
0.00* 1.89 0.00 -0.57 0.00 -1.43 0.00 -1.57 0.00*** -4.18 0.00*** -3.89
post-governmenthouseholdincome permonth
0.00 1.49 0.00 1.42 0.00 1.72 0.00 -0.11 0.00*** 2.38 0.00* 1.74
post-governmenthouseholdincome permonthsquared
0.00 -0.91 0.00 -1.11 0.00 -0.72 0.00 0.42 0.00 -1.07 0.00 -0.61
Reference:net hhincomebetween 2/3*median and3/2* mediannethouseholdincome lessthan 2/3 ofmedian
-0.02 -1.12 -0.05*** -3.22 0.01 0.48 -0.01 -1.05 0.00 0.30 0.00 -0.26
Nethouseholdincome morethan 3/2 ofmedian
0.01 0.30 0.00 -0.13 0.00 -0.20 0.02** 1.93 -0.01 -0.54 0.01 0.50
Reference:marriedSingle -0.02* -1.80 -0.04** -2.82 0.00 -0.26 -0.02** -2.14 0.03*** 2.78 0.01 1.09Widowed 0.11*** 3.83 0.00 0.05 -0.08** -2.25 -0.01 -0.64 0.00 0.06 0.00 -0.26Divorced 0.00 0.19 -0.06*** -3.72 -0.05** -2.46 0.00 -0.01 0.01 0.54 0.00 0.41Seperated 0.03 1.09 -0.07** -2.31 -0.05 -1.35 -0.04** -2.15 -0.04 -1.55 -0.04** -2.18Reference:no children
19
aggregatedhappiness
Satisfactionwith lifetoday
satisfactionwith life infive years
Control Worries Stress
B T B T B T B T B T B Tone child -0.02** -1.98 0.00 -0.23 0.01 0.75 0.01 1.57 -0.01 -1.17 0.00 -0.15two children -0.05*** -3.31 -0.01 -0.72 0.01 0.77 -0.01 -0.97 -0.01 -0.73 -0.01 -1.01threechildren
-0.06** -2.19 -0.01 -0.30 0.03 0.94 -0.03** -2.00 0.01 0.26 -0.01 -0.74
Three ormorechildren
-0.22*** -5.90 -0.28*** -7.94 -0.27*** -6.35 -0.07*** -3.24 -0.14*** -4.00 -0.10*** -4.54
Reference:manufacturingAgriculture -0.07* -1.71 0.01 0.36 0.09** 2.07 0.04** 2.04 0.07** 2.16 0.06*** 2.59Mining -0.01 -0.16 0.02 0.29 -0.02 -0.29 -0.03 -0.71 0.09 1.34 0.03 0.68Electricity -0.04 -1.09 -0.03 -0.86 -0.05 -1.09 -0.04* -1.69 0.01 0.32 -0.01 -0.55Construction -0.04** -2.23 0.02 1.21 -0.01 -0.48 0.01 0.83 0.03* 1.74 0.02* 1.70Hotels andCatering
-0.06 -1.37 0.03 0.75 0.05 0.99 0.02 0.81 0.07* 1.73 0.04* 1.69
TransportandCommunication
0.02 1.05 0.02 1.17 0.02 0.71 0.01 1.15 0.03* 1.70 0.02* 1.82
FinancialIntermediation
-0.01 -0.34 0.02 0.67 0.03 0.93 0.04** 2.58 0.02 0.95 0.03* 1.93
Real estate,Renting andBusinessActivities
0.00 -0.02 -0.04 -1.31 -0.04 -1.35 -0.01 -0.79 0.05* 1.88 0.02 1.04
PublicAdministration
0.03** 1.80 0.04*** 3.03 0.05*** 2.96 0.02* 1.78 0.10*** 7.16 0.06*** 6.23
Health andSocial Work
-0.01 -0.37 0.01 0.52 0.00 -0.11 0.02** 2.09 0.07*** 4.27 0.04*** 4.20
OtherCommunity,social andpersonalactivities
-0.02 -1.01 0.02 0.95 0.05 1.69 0.01 1.04 0.04** 2.00 0.03** 2.00
Extra-territorialorganizations
0.15 1.40 0.13 1.24 0.26** 2.16 0.03 0.51 0.08 0.85 0.06 0.88

20
aggregatedhappiness
Satisfactionwith lifetoday
satisfactionwith life infive years
Control Worries Stress
B T B T B T B T B T B TWholesale -0.02 -0.63 -0.02 -0.76 0.02 0.52 0.01 0.51 0.09*** 3.29 0.05*** 2.72Retail andRepair
-0.02 -1.19 -0.02 -1.35 -0.03 -1.52 -0.01 -1.00 -0.03* -1.78 -0.02* -1.81
Reference:professionalsLegislators,seniorofficials andmanagers
-0.03 -1.38 -0.03 -1.36 -0.03 -1.06 0.02 1.23 0.01 0.56 0.01 1.00
Techniciansandassociateprofessionals
-0.02 -1.25 -0.03** -1.71 -0.02 -0.79 0.00 -0.20 0.02 1.25 0.01 0.85
Clerks 0.02 1.22 -0.01 -0.68 0.00 -0.05 0.00 0.14 0.00 0.30 0.00 0.29Serviceworkers andshop andmarket salesworkers
0.00 0.11 0.00 -0.29 -0.01 -0.50 0.01 0.49 -0.01 -0.67 0.00 -0.27
Skilledagriculturaland fisheryworkers
0.01 0.05 -0.23** -1.94 -0.23* -1.61 -0.09 -1.21 0.01 0.08 -0.04 -0.51
Craft andrelated tradeworkers
-0.03** -2.32 -0.05*** -3.61 -0.04** -2.46 -0.02** -2.50 -0.04*** -3.14 -0.03*** -3.54
Plant andmachineoperatorsandassemblers
-0.03* -1.64 -0.05** -2.49 -0.08*** -3.53 -0.05*** -3.89 -0.04** -2.14 -0.04*** -3.44
Elementaryoccupations
-0.01 -0.31 -0.01 -0.32 -0.01 -0.26 -0.03** -2.10 -0.06*** -2.87 -0.04*** -3.14
Reference:North-RheinWestfaliaBerlin-west -0.06** -2.65 -0.13*** -5.87 -0.10*** -3.73 -0.03** -2.07 -0.08*** -3.89 -0.05*** -3.90SchlesweigHolstein
0.03 1.06 0.00 -0.18 -0.05* -1.68 0.03** 2.34 0.05** 2.46 0.04*** 2.95
Hamburg 0.09*** 2.69 0.02 0.54 0.04 1.17 0.03 1.60 0.01 0.32 0.02 0.99Lower-Saxony
0.03* 1.70 0.02 0.97 0.01 0.33 0.01 0.84 0.03** 2.33 0.02** 2.15
21
aggregatedhappiness
Satisfactionwith lifetoday
satisfactionwith life infive years
Control Worries Stress
B T B T B T B T B T B TBremen -0.08* -1.76 0.11** 2.55 0.13** 2.51 0.04 1.48 0.07* 1.78 0.06** 2.04Hesse 0.00 -0.09 -0.03* -1.70 -0.05** -2.54 -0.01 -1.08 -0.01 -0.56 -0.01 -0.93Rheinland,Pfalz, Saar
0.00 0.18 0.02 1.16 0.03 1.26 0.01 0.72 0.03* 1.93 0.02* 1.79
Baden-Wuerttemberg
-0.04** -2.57 -0.04*** -2.59 -0.04*** -2.73 -0.02** -2.55 0.00 -0.08 -0.01 -1.25
Bavaria -0.04*** -2.63 -0.03** -2.49 -0.06*** -3.83 -0.03*** -3.97 -0.02 -1.25 -0.02*** -2.81Berlin (east) -0.25*** -7.33 -0.20*** -6.08 -0.21*** -5.38 -0.07*** -3.45 -0.11*** -3.71 -0.09*** -4.41Mecklenburg/Vorpommeren
-0.11*** -3.26 -0.02 -0.63 -0.02 -0.45 -0.03 -1.30 -0.02 -0.54 -0.02 -1.02
Brandenburg -0.12*** -4.47 -0.05** -1.84 -0.06** -2.01 -0.01 -0.62 -0.07*** -2.64 -0.04** -2.28Sachsen-Anhalt
-0.08*** -2.82 -0.02 -0.81 0.01 0.37 0.02 1.42 -0.01 -0.44 0.01 0.34
Thueringen -0.06** -2.00 -0.06** -2.20 -0.06* -1.71 -0.01 -0.31 -0.07*** -2.67 -0.04** -2.16Saxony -0.12*** -4.88 -0.03 -1.21 0.01 0.35 0.01 0.88 -0.04* -1.80 -0.01 -0.95
R squ 0.14 0.11 0.13 0.14 0.20 0.22SEE 0.24 0.23 0.27 0.14 0.21 0.14
(Source: own computations on GSOEP)
* significant at the 10% level
** significant at the 5% level
*** significant at the 1% level

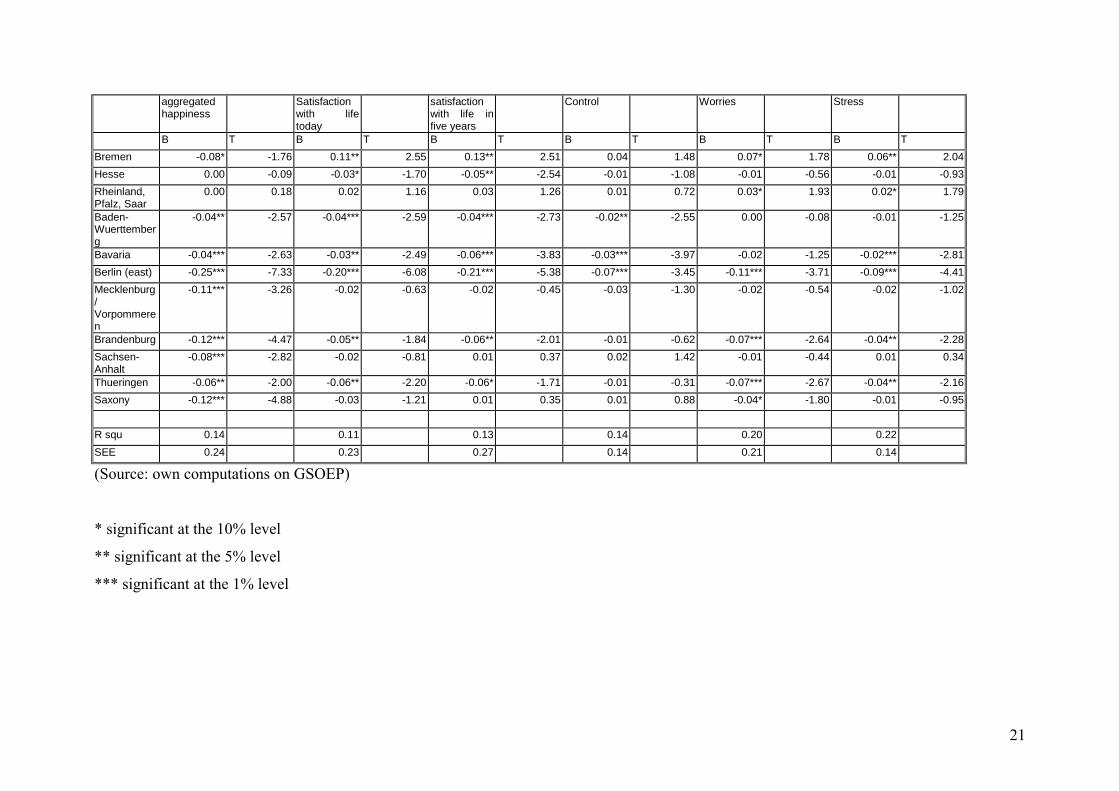
Table 3 shows significant negative effects of temporary work either part-time or full-
time on all five satisfaction or welfare measures. So: working with a temporary contract
seems to lead primarily to feelings of unhappiness and stress. The effects of working
permanently part-time is only significantly negative for the control of life-variable.
The effect of temporary work is particularly high on the amount of worries. This has to
do with the fact that in the worries-variable the amount of job-security determines to a large
extent the value. Females with a part-time contract are to a certain degree more satisfied and
less worried than full-time employees with a permanent contract. In addition, table 3 reports
negative effects of a low hourly wage. However, the effects of a low net household income
are not significant. It seems that deprivation has less effects on the welfare measures than the
hourly wage, which is related with the concept of job-quality. This is however an issue which
is beyond the range of this paper.
It is interesting to see whether the effects of temporary work and/or part-time are
different, because working part-time is highly gender-biased (see table 1), it is interesting to
see between male and female. Table 4 reports the estimates for the working-arrangement by
gender.
Table 4: regression on welfare measures by gender
Panel AAggregated satisfaction satisfaction with life todayMale female male female
B T B T B T B T(Constant) 1.18*** 7.07 1.98*** 9.66 1.44*** 9.16 1.41*** 7.08parttime andtemporary
-0.09 -1.33 0.01 0.22 -0.17** -2.55 0.03 0.70
parttime andpermanent
-0.02 -0.49 0.05*** 3.04 0.01 0.27 0.03** 1.96
fulltime andtemporary
-0.04 -1.38 -0.05 -1.37 -0.08*** -3.06 -0.01 -0.32
R squ. 0.11 0.21 0.17 0.16SEE 0.24 0.23 0.22 0.22
23
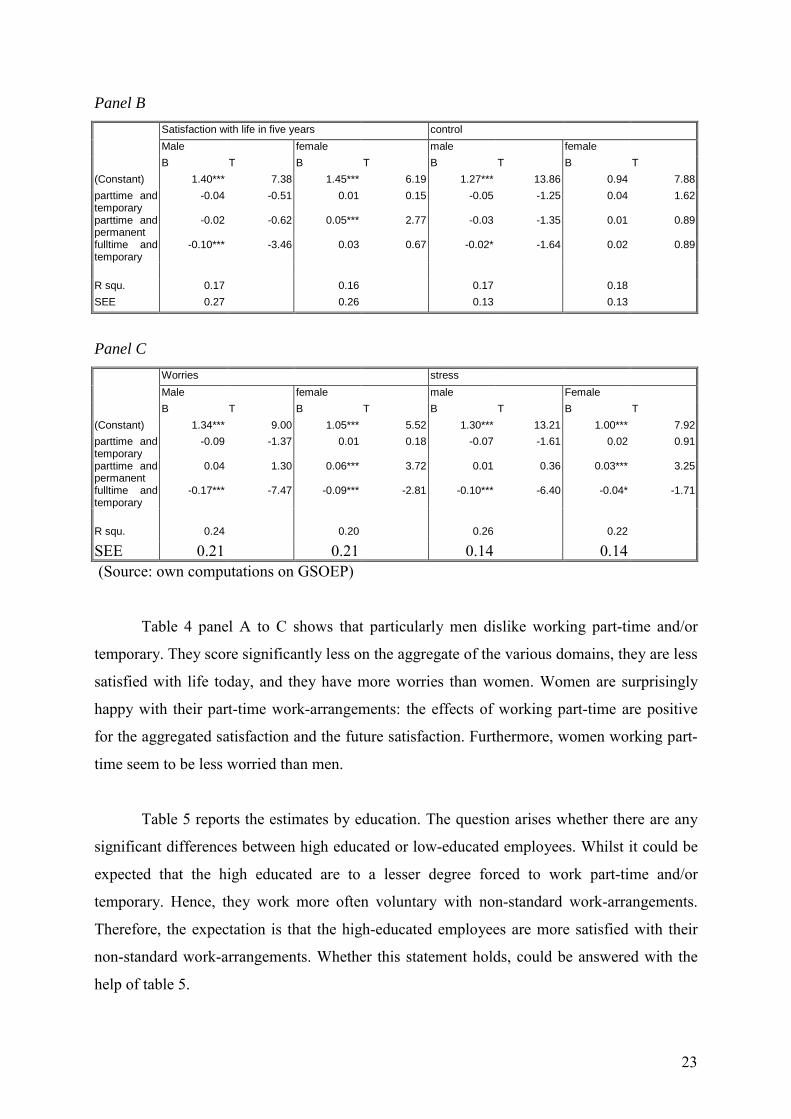
Panel BSatisfaction with life in five years controlMale female male femaleB T B T B T B T
(Constant) 1.40*** 7.38 1.45*** 6.19 1.27*** 13.86 0.94 7.88parttime andtemporary
-0.04 -0.51 0.01 0.15 -0.05 -1.25 0.04 1.62
parttime andpermanent
-0.02 -0.62 0.05*** 2.77 -0.03 -1.35 0.01 0.89
fulltime andtemporary
-0.10*** -3.46 0.03 0.67 -0.02* -1.64 0.02 0.89
R squ. 0.17 0.16 0.17 0.18SEE 0.27 0.26 0.13 0.13
Panel CWorries stressMale female male FemaleB T B T B T B T
(Constant) 1.34*** 9.00 1.05*** 5.52 1.30*** 13.21 1.00*** 7.92parttime andtemporary
-0.09 -1.37 0.01 0.18 -0.07 -1.61 0.02 0.91
parttime andpermanent
0.04 1.30 0.06*** 3.72 0.01 0.36 0.03*** 3.25
fulltime andtemporary
-0.17*** -7.47 -0.09*** -2.81 -0.10*** -6.40 -0.04* -1.71
R squ. 0.24 0.20 0.26 0.22
SEE 0.21 0.21 0.14 0.14 (Source: own computations on GSOEP)
Table 4 panel A to C shows that particularly men dislike working part-time and/or
temporary. They score significantly less on the aggregate of the various domains, they are less
satisfied with life today, and they have more worries than women. Women are surprisingly
happy with their part-time work-arrangements: the effects of working part-time are positive
for the aggregated satisfaction and the future satisfaction. Furthermore, women working part-
time seem to be less worried than men.
Table 5 reports the estimates by education. The question arises whether there are any
significant differences between high educated or low-educated employees. Whilst it could be
expected that the high educated are to a lesser degree forced to work part-time and/or
temporary. Hence, they work more often voluntary with non-standard work-arrangements.
Therefore, the expectation is that the high-educated employees are more satisfied with their
non-standard work-arrangements. Whether this statement holds, could be answered with the
help of table 5.
24
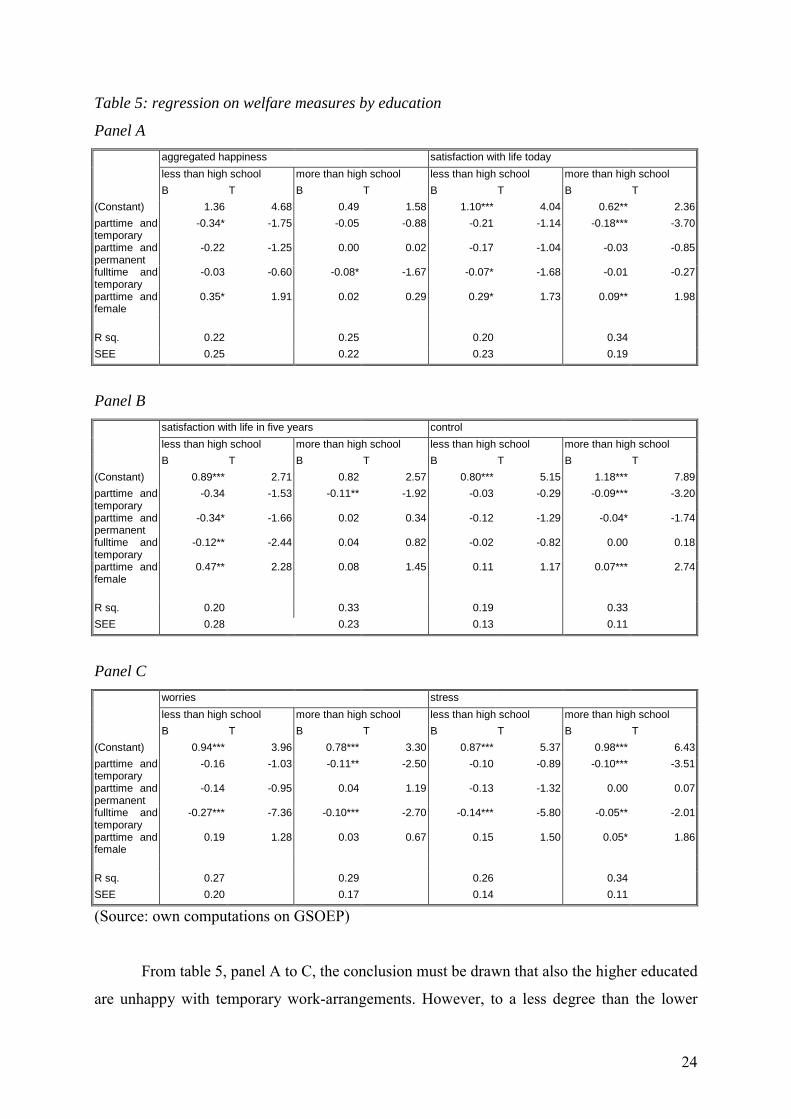
Table 5: regression on welfare measures by education
Panel Aaggregated happiness satisfaction with life todayless than high school more than high school less than high school more than high schoolB T B T B T B T
(Constant) 1.36 4.68 0.49 1.58 1.10*** 4.04 0.62** 2.36parttime andtemporary
-0.34* -1.75 -0.05 -0.88 -0.21 -1.14 -0.18*** -3.70
parttime andpermanent
-0.22 -1.25 0.00 0.02 -0.17 -1.04 -0.03 -0.85
fulltime andtemporary
-0.03 -0.60 -0.08* -1.67 -0.07* -1.68 -0.01 -0.27
parttime andfemale
0.35* 1.91 0.02 0.29 0.29* 1.73 0.09** 1.98
R sq. 0.22 0.25 0.20 0.34SEE 0.25 0.22 0.23 0.19
Panel Bsatisfaction with life in five years controlless than high school more than high school less than high school more than high schoolB T B T B T B T
(Constant) 0.89*** 2.71 0.82 2.57 0.80*** 5.15 1.18*** 7.89parttime andtemporary
-0.34 -1.53 -0.11** -1.92 -0.03 -0.29 -0.09*** -3.20
parttime andpermanent
-0.34* -1.66 0.02 0.34 -0.12 -1.29 -0.04* -1.74
fulltime andtemporary
-0.12** -2.44 0.04 0.82 -0.02 -0.82 0.00 0.18
parttime andfemale
0.47** 2.28 0.08 1.45 0.11 1.17 0.07*** 2.74
R sq. 0.20 0.33 0.19 0.33SEE 0.28 0.23 0.13 0.11
Panel Cworries stressless than high school more than high school less than high school more than high schoolB T B T B T B T
(Constant) 0.94*** 3.96 0.78*** 3.30 0.87*** 5.37 0.98*** 6.43parttime andtemporary
-0.16 -1.03 -0.11** -2.50 -0.10 -0.89 -0.10*** -3.51
parttime andpermanent
-0.14 -0.95 0.04 1.19 -0.13 -1.32 0.00 0.07
fulltime andtemporary
-0.27*** -7.36 -0.10*** -2.70 -0.14*** -5.80 -0.05** -2.01
parttime andfemale
0.19 1.28 0.03 0.67 0.15 1.50 0.05* 1.86
R sq. 0.27 0.29 0.26 0.34SEE 0.20 0.17 0.14 0.11
(Source: own computations on GSOEP)
From table 5, panel A to C, the conclusion must be drawn that also the higher educated
are unhappy with temporary work-arrangements. However, to a less degree than the lower
25
educated employees. This holds also for the amount of worries and stress. A temporary
contract seems to be less severe for the higher educated. Regarding part-time work, the results
are less significant. However the effects of the interaction-term part-time and female are large
and significant for the aggregated satisfaction and the expected welfare. Furthermore, low-
educated women seem to be happy with their part-time contracts.
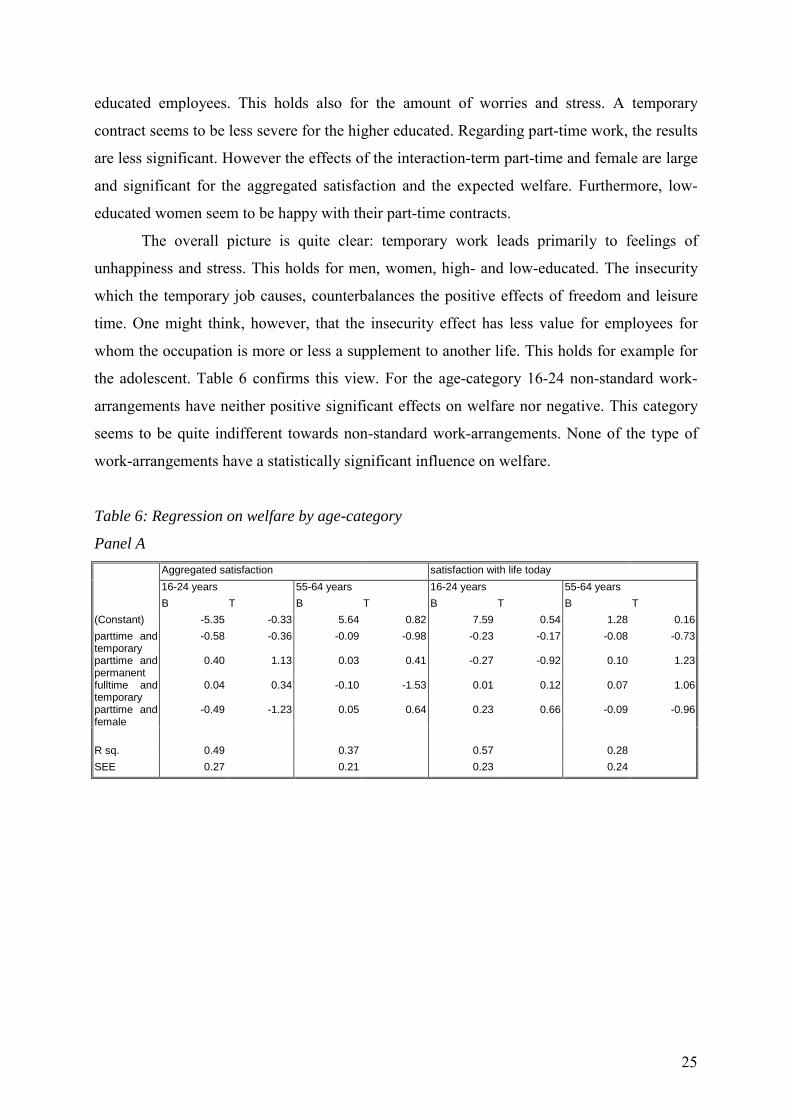
The overall picture is quite clear: temporary work leads primarily to feelings of
unhappiness and stress. This holds for men, women, high- and low-educated. The insecurity
which the temporary job causes, counterbalances the positive effects of freedom and leisure
time. One might think, however, that the insecurity effect has less value for employees for
whom the occupation is more or less a supplement to another life. This holds for example for
the adolescent. Table 6 confirms this view. For the age-category 16-24 non-standard work-
arrangements have neither positive significant effects on welfare nor negative. This category
seems to be quite indifferent towards non-standard work-arrangements. None of the type of
work-arrangements have a statistically significant influence on welfare.
Table 6: Regression on welfare by age-category
Panel AAggregated satisfaction satisfaction with life today16-24 years 55-64 years 16-24 years 55-64 yearsB T B T B T B T
(Constant) -5.35 -0.33 5.64 0.82 7.59 0.54 1.28 0.16parttime andtemporary
-0.58 -0.36 -0.09 -0.98 -0.23 -0.17 -0.08 -0.73
parttime andpermanent
0.40 1.13 0.03 0.41 -0.27 -0.92 0.10 1.23
fulltime andtemporary
0.04 0.34 -0.10 -1.53 0.01 0.12 0.07 1.06
parttime andfemale
-0.49 -1.23 0.05 0.64 0.23 0.66 -0.09 -0.96
R sq. 0.49 0.37 0.57 0.28SEE 0.27 0.21 0.23 0.24

26
Panel BSatisfaction with life in five years control16-24 years 55-64 years 16-24 years 55-64 yearsB T B T B T B T
(Constant) -10.46 -0.96 5.91 0.61 -6.89 -0.88 8.34** 1.95parttime andtemporary
0.91 0.85 -0.16 -1.16 -0.58 -0.74 -0.04 -0.71
parttime andpermanent
0.06 0.25 0.03 0.28 -0.01 -0.08 0.07 1.53
fulltime andtemporary
0.05 0.66 -0.10 -1.13 -0.02 -0.47 0.07* 1.93
parttime andfemale
-0.27 -0.98 -0.05 -0.39 -0.06 -0.32 -0.06 -1.20
R sq. 0.61 0.21 0.62 0.29SEE 0.18 0.29 0.13 0.13
Panel CWorries stress16-24 years 55-64 years 16-24 years 55-64 yearsB T B T B T B T
(Constant) 3.95 0.32 6.00 0.88 -1.47 -0.18 7.17 1.60parttime andtemporary
0.36 0.29 -0.17* -1.77 -0.11 -0.14 -0.11 -1.68
parttime andpermanent
-0.09 -0.35 -0.07 -0.94 -0.05 -0.30 0.00 0.02
fulltime andtemporary
-0.06 -0.74 -0.13** -2.10 -0.04 -0.79 -0.03 -0.67
parttime andfemale
0.06 0.20 0.13 1.53 0.00 0.00 0.03 0.59
R sq. 0.64 0.35 0.64 0.37SEE 0.21 0.21 0.14 0.14
(Source: own computations on GSOEP)
CONCLUSIONS
From the tables in this section, the conclusion must be drawn that the effects of temporary
work either on a full-time base or on a part-time base, are above all negative. Temporary work
leads primary to feelings of dissatisfaction and stress. This holds especially for men and for
low-educated employees. Regarding part-time work, one sees that the influence is in most
cases neither positive nor negative. However, women seem to appreciate working part-time
more than men do. This also holds for older employees.
The results on the control, stress- and worries measures are more ambiguous. Women
with a part-time contract seem to have more control and less stress than full-time employees.
Older employees either temporary or part-time score high on the control-variable.

27
Regarding the central question of this research paper, the conclusions of this section
are, that temporary work leads primarily to feelings of dissatisfaction and stress. The effects
of part-time work are ambiguous. However, particularly women seem to appreciate working
with a part-time contract. The next section explores the influence of non-standard work-
arrangements on the liberal account of life-quality.
VII RESULTS FOR THE LIBERAL ACCOUNT OF LIFE-QUALITY
In this section, the question will be addressed whether non-standard work-arrangements
decrease or increase the metric of primary goods or capabilities, mentioned in section V. The
same model as used in the latter section will also be used here. The following variables appear
as dependent variable: primary goods, primary goods + leisure, degree of social integration,
and capabilities. Table 7 reports the means by work-arrangement.
Table 7: means life-quality by work-arrangementStandardizedquantityprimarygoods
primarygoods +leisure
standardizeddegree ofsocialintegration
basic +socialfunctionings
Amount ofleisure time
basicfunctionings+ socialfunctionings+ leisure
parttime andtemporary
Mean 0.93 1.16 0.97 1.02 1.53 1.20
N 84.38 83.83 97.00 83.83 96.44 83.83Std.Deviation
0.64 0.50 0.20 0.17 0.92 0.39
parttime andpermanent
Mean 0.94 1.26 1.00 1.11 1.58 1.35
N 914.73 904.63 938.76 904.63 928.66 904.63Std.Deviation
0.56 0.53 0.17 0.19 0.92 0.55
fulltime andtemporary
Mean 0.79 0.84 0.97 0.93 0.89 0.90
N 219.03 217.27 227.47 217.27 225.71 217.27Std.Deviation
0.37 0.30 0.19 0.13 0.45 0.26
self-employed
Mean 1.25 1.07 1.04 0.99 0.88 0.93
N 568.81 563.48 594.10 563.48 588.78 563.48Std.Deviation
1.06 0.63 0.16 0.16 0.70 0.42
fulltime andpermanent
Mean 1.01 0.94 0.99 0.98 0.87 0.92
N 3667.65 3640.75 3861.45 3640.75 3831.73 3640.75Std.Deviation
0.73 0.42 0.17 0.12 0.46 0.26
Total Mean 1.01 1.00 1.00 1.00 1.00 1.00N 5454.60 5409.96 5718.78 5409.96 5671.32 5409.96Std.Deviation
0.74 0.48 0.17 0.15 0.65 0.38
(Source: own computations on GSOEP)

28
Temporary part-time employees score significantly lower on primary goods, degree of
social integration and on the combination basic and social functionings, compared to full-time
permanent employees. Due to having more leisure-time they score significantly higher on the
combinations primary goods + leisure, and capabilities (incl leisure-time). Part-time
employees with a permanent contract score also significantly lower on primary goods and on
the combination basic and social functionings. The difference concerning the degree of social
integration is not significant, and � not surprising � this category scores also higher on the
combinations primary goods with leisure and capabilities and leisure. Compared to employees
with permanent contracts, full-time temporary employees have significantly less primary
goods, less primary goods combined with leisure, and less capabilities. In this section, the
same model will be used as in section VI. Table 8 reports the results of this model.
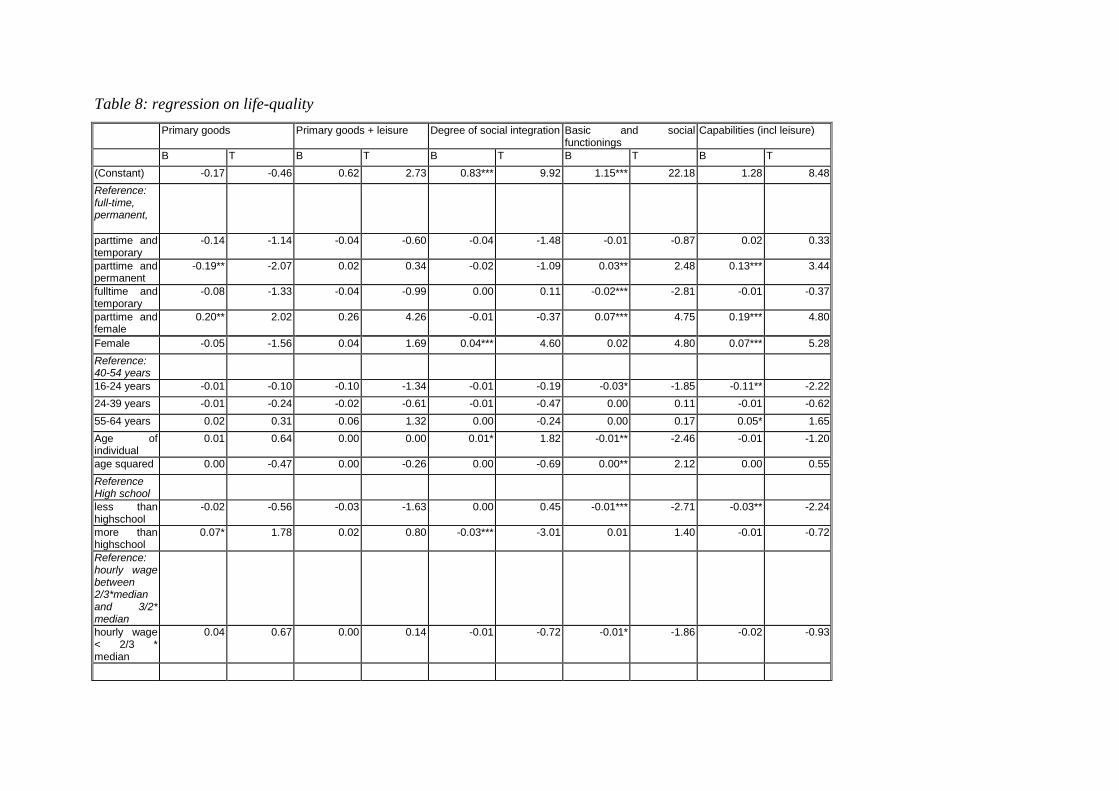
Table 8: regression on life-qualityPrimary goods Primary goods + leisure Degree of social integration Basic and social
functioningsCapabilities (incl leisure)
B T B T B T B T B T(Constant) -0.17 -0.46 0.62 2.73 0.83*** 9.92 1.15*** 22.18 1.28 8.48Reference:full-time,permanent,
parttime andtemporary
-0.14 -1.14 -0.04 -0.60 -0.04 -1.48 -0.01 -0.87 0.02 0.33
parttime andpermanent
-0.19** -2.07 0.02 0.34 -0.02 -1.09 0.03** 2.48 0.13*** 3.44
fulltime andtemporary
-0.08 -1.33 -0.04 -0.99 0.00 0.11 -0.02*** -2.81 -0.01 -0.37
parttime andfemale
0.20** 2.02 0.26 4.26 -0.01 -0.37 0.07*** 4.75 0.19*** 4.80
Female -0.05 -1.56 0.04 1.69 0.04*** 4.60 0.02 4.80 0.07*** 5.28Reference:40-54 years16-24 years -0.01 -0.10 -0.10 -1.34 -0.01 -0.19 -0.03* -1.85 -0.11** -2.2224-39 years -0.01 -0.24 -0.02 -0.61 -0.01 -0.47 0.00 0.11 -0.01 -0.6255-64 years 0.02 0.31 0.06 1.32 0.00 -0.24 0.00 0.17 0.05* 1.65Age ofindividual
0.01 0.64 0.00 0.00 0.01* 1.82 -0.01** -2.46 -0.01 -1.20
age squared 0.00 -0.47 0.00 -0.26 0.00 -0.69 0.00** 2.12 0.00 0.55ReferenceHigh schoolless thanhighschool
-0.02 -0.56 -0.03 -1.63 0.00 0.45 -0.01*** -2.71 -0.03** -2.24
more thanhighschool
0.07* 1.78 0.02 0.80 -0.03*** -3.01 0.01 1.40 -0.01 -0.72
Reference:hourly wagebetween2/3*medianand 3/2*medianhourly wage< 2/3 *median
0.04 0.67 0.00 0.14 -0.01 -0.72 -0.01* -1.86 -0.02 -0.93
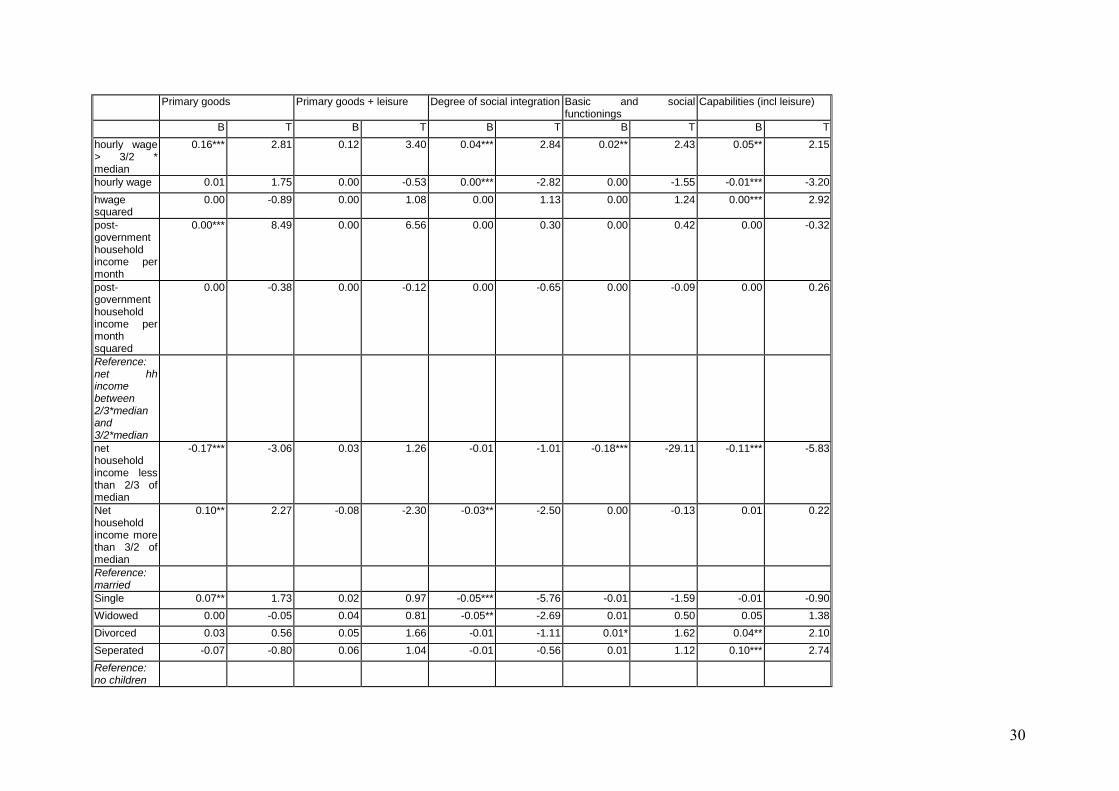
30
Primary goods Primary goods + leisure Degree of social integration Basic and socialfunctionings
Capabilities (incl leisure)
B T B T B T B T B Thourly wage> 3/2 *median
0.16*** 2.81 0.12 3.40 0.04*** 2.84 0.02** 2.43 0.05** 2.15
hourly wage 0.01 1.75 0.00 -0.53 0.00*** -2.82 0.00 -1.55 -0.01*** -3.20hwagesquared
0.00 -0.89 0.00 1.08 0.00 1.13 0.00 1.24 0.00*** 2.92
post-governmenthouseholdincome permonth
0.00*** 8.49 0.00 6.56 0.00 0.30 0.00 0.42 0.00 -0.32
post-governmenthouseholdincome permonthsquared
0.00 -0.38 0.00 -0.12 0.00 -0.65 0.00 -0.09 0.00 0.26
Reference:net hhincomebetween2/3*medianand3/2*mediannethouseholdincome lessthan 2/3 ofmedian
-0.17*** -3.06 0.03 1.26 -0.01 -1.01 -0.18*** -29.11 -0.11*** -5.83
Nethouseholdincome morethan 3/2 ofmedian
0.10** 2.27 -0.08 -2.30 -0.03** -2.50 0.00 -0.13 0.01 0.22
Reference:marriedSingle 0.07** 1.73 0.02 0.97 -0.05*** -5.76 -0.01 -1.59 -0.01 -0.90Widowed 0.00 -0.05 0.04 0.81 -0.05** -2.69 0.01 0.50 0.05 1.38Divorced 0.03 0.56 0.05 1.66 -0.01 -1.11 0.01* 1.62 0.04** 2.10Seperated -0.07 -0.80 0.06 1.04 -0.01 -0.56 0.01 1.12 0.10*** 2.74Reference:no children
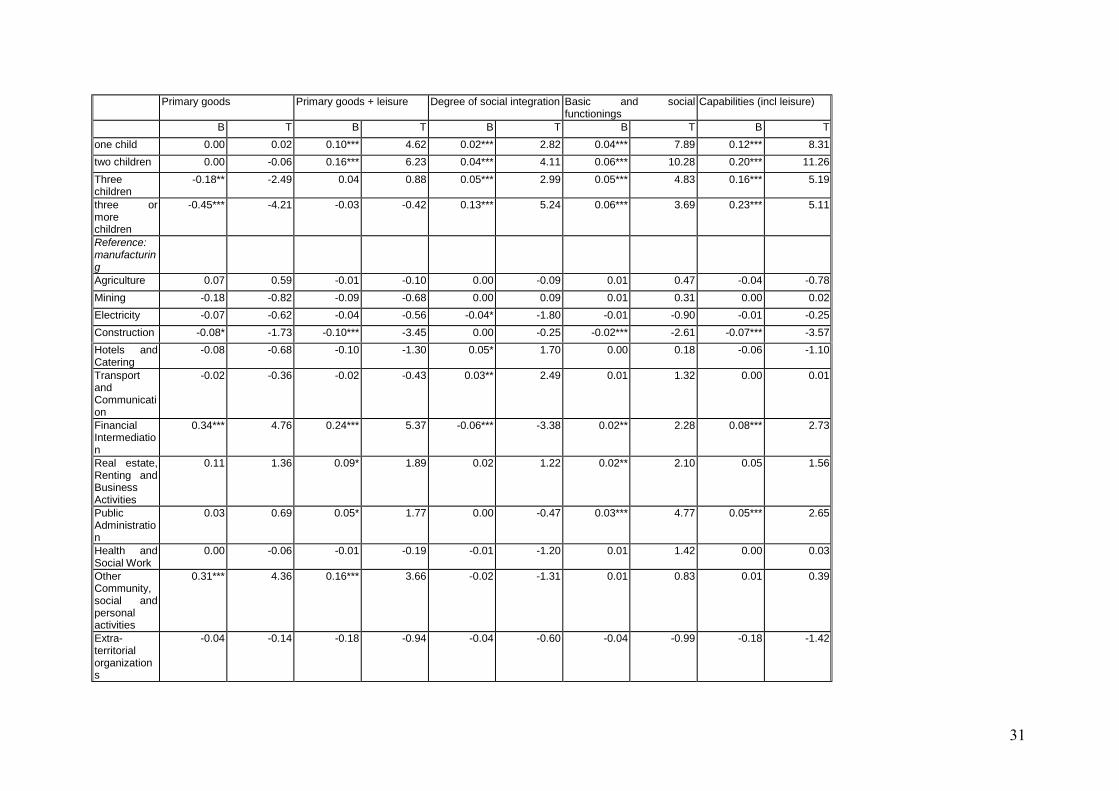
31
Primary goods Primary goods + leisure Degree of social integration Basic and socialfunctionings
Capabilities (incl leisure)
B T B T B T B T B Tone child 0.00 0.02 0.10*** 4.62 0.02*** 2.82 0.04*** 7.89 0.12*** 8.31two children 0.00 -0.06 0.16*** 6.23 0.04*** 4.11 0.06*** 10.28 0.20*** 11.26Threechildren
-0.18** -2.49 0.04 0.88 0.05*** 2.99 0.05*** 4.83 0.16*** 5.19
three ormorechildren
-0.45*** -4.21 -0.03 -0.42 0.13*** 5.24 0.06*** 3.69 0.23*** 5.11
Reference:manufacturingAgriculture 0.07 0.59 -0.01 -0.10 0.00 -0.09 0.01 0.47 -0.04 -0.78Mining -0.18 -0.82 -0.09 -0.68 0.00 0.09 0.01 0.31 0.00 0.02Electricity -0.07 -0.62 -0.04 -0.56 -0.04* -1.80 -0.01 -0.90 -0.01 -0.25Construction -0.08* -1.73 -0.10*** -3.45 0.00 -0.25 -0.02*** -2.61 -0.07*** -3.57Hotels andCatering
-0.08 -0.68 -0.10 -1.30 0.05* 1.70 0.00 0.18 -0.06 -1.10
TransportandCommunication
-0.02 -0.36 -0.02 -0.43 0.03** 2.49 0.01 1.32 0.00 0.01
FinancialIntermediation
0.34*** 4.76 0.24*** 5.37 -0.06*** -3.38 0.02** 2.28 0.08*** 2.73
Real estate,Renting andBusinessActivities
0.11 1.36 0.09* 1.89 0.02 1.22 0.02** 2.10 0.05 1.56
PublicAdministration
0.03 0.69 0.05* 1.77 0.00 -0.47 0.03*** 4.77 0.05*** 2.65
Health andSocial Work
0.00 -0.06 -0.01 -0.19 -0.01 -1.20 0.01 1.42 0.00 0.03
OtherCommunity,social andpersonalactivities
0.31*** 4.36 0.16*** 3.66 -0.02 -1.31 0.01 0.83 0.01 0.39
Extra-territorialorganizations
-0.04 -0.14 -0.18 -0.94 -0.04 -0.60 -0.04 -0.99 -0.18 -1.42

32
Primary goods Primary goods + leisure Degree of social integration Basic and socialfunctionings
Capabilities (incl leisure)
B T B T B T B T B TWholesale 0.01 0.15 -0.02 -0.41 -0.03 -1.46 0.00 0.41 -0.03 -0.74Retail andRepair
-0.01 -0.18 -0.04 -1.10 0.00 0.03 -0.02** -2.28 -0.04* -1.84
Reference:professionalsLegislators,seniorofficials andmanagers
0.29*** 4.04 0.08* 1.92 0.03* 1.81 -0.01 -1.02 -0.06** -2.18
Techniciansandassociateprofessionals
-0.08* -1.64 -0.03 -0.91 0.04*** 3.58 0.01** 2.06 0.02 0.97
Clerks 0.03 0.72 0.02 0.64 0.00 0.08 0.00 0.02 0.00 0.10Serviceworkers nadshop andmarket salesworkers
-0.02 -0.46 0.04 1.22 0.01 1.13 0.02** 2.44 0.06*** 2.81
Skilledagriculturaland fisheryworkers
-0.23 -0.64 -0.04 -0.17 0.01 0.18 0.01 0.29 0.08 0.57
Craft andrelated tradeworkers
0.02 0.41 0.03 1.16 0.03*** 3.15 0.00 0.41 0.02 1.33
Plant andmachineoperatorsandassemblers
-0.03 -0.43 0.00 0.07 0.06*** 4.31 0.00 -0.15 0.01 0.60
Elementaryoccupations
-0.08 -1.19 0.00 0.02 0.05*** 3.74 0.01 0.72 0.04 1.61
Reference:North-RhineWestphaliaberlin-west 0.00 0.04 -0.06 -1.51 -0.03** -2.12 -0.05*** -5.22 -0.09*** -3.22SchlesweigHolstein
0.04 0.65 0.02 0.56 -0.02 -0.97 0.01 1.30 0.01 0.28
Hamburg -0.10 -1.09 -0.11* -1.80 -0.08*** -3.67 -0.03* -1.93 -0.07* -1.73Lower-Saxony
-0.06 -1.18 -0.08*** -2.84 -0.01 -0.54 -0.02** -2.39 -0.06*** -3.27

33
Primary goods Primary goods + leisure Degree of social integration Basic and socialfunctionings
Capabilities (incl leisure)
B T B T B T B T B TBremen 0.02 0.11 -0.09 -1.12 -0.01 -0.27 -0.01 -0.80 -0.11** -1.97Hesse 0.07 1.42 0.04 1.19 -0.02* -1.80 -0.01 -1.22 0.00 -0.13Rheinland,Pfalz, Saar
0.23*** 4.32 0.09*** 2.61 0.00 0.39 -0.01 -0.66 -0.03 -1.41
Baden-Wuerttemberg
0.05 1.11 -0.02 -0.83 0.00 -0.53 -0.02*** -3.68 -0.05*** -3.24
Bavaria 0.06 1.46 0.01 0.40 0.00 0.12 -0.02*** -2.93 -0.03* -1.66Berlin (east) 0.05 0.47 -0.03 -0.54 0.02 0.90 -0.05*** -3.61 -0.08** -2.02Mecklenburg/Vorpommeren
0.00 -0.03 -0.07 -1.09 0.03 1.36 -0.03* -1.83 -0.08** -1.92
Brandenburg -0.01 -0.12 -0.04 -0.78 0.06*** 3.01 -0.02 -1.36 -0.04 -1.26Sachsen-Anhalt
0.11 1.33 0.00 -0.09 0.05** 2.30 -0.01 -1.16 -0.07** -1.95
Thueringen 0.03 0.35 0.00 -0.02 0.05** 2.34 -0.01 -1.11 -0.02 -0.65Saxony 0.01 0.19 -0.06 -1.45 0.04*** 2.76 -0.02** -2.36 -0.08*** -2.82
R sq. 0.29 0.26 0.21 0.54 0.31SEE 0.67 0.42 0.15 0.09 0.28
(Source: own computations on GSOEP)

From table 8, the conclusion must be drawn that temporary work has also negative
effects on life-quality in the liberal sense. The sign of the effect of being female with a part-
time contract is significantly positive for the primary goods-metric and the capabilities-index.
Again, it is striking that particularly for women, part-time work seems to enhance the quality
of life. So: working part-time makes women not only more satisfied, but it offers them also
more opportunities to develop and fulfil life-plans. In addition, in table 4 we saw that
particularly men disliked working with a non-standard contract. The next table shows whether
this also holds for the liberal accounts of life-quality: whether working part-time and/or
temporary is also negative for the primary goods or capabilities necessary to form and pursue
the freely chosen conceptions of the good life.
Table 9: Regression on life-quality by gender
Panel APrimary goods Primary goods + leisuremale female male femaleB T B T B T B T
(Constant) 0.19 0.39 -0.18 -0.33 0.72 2.46 1.05*** 2.77parttime andtemporary
-0.20 -0.98 0.14 1.35 0.00 0.01 0.13 1.75
parttime andpermanent
-0.08 -0.78 0.03 0.61 0.01 0.17 0.22*** 6.86
fulltime andtemporary
-0.08 -1.04 -0.08 -0.86 -0.03 -0.74 -0.06 -0.89
R sq. 0.37 0.26 0.30 0.31SEE 0.69 0.60 0.41 0.41
Panel BDegree of social integration Basic + social functioningsmale female male Female
B T B T B T B T(Constant) 0.72 6.50 0.83 6.01 1.13 18.83 1.22*** 12.53parttime andtemporary
-0.09 -1.93 -0.03 -1.25 0.00 -0.15 0.02 1.07
parttime andpermanent
-0.03 -1.28 -0.02 -1.96 0.01 1.08 0.08*** 9.50
fulltime andtemporary
-0.02 -1.03 0.03 1.11 -0.03 -3.48 -0.01 -0.56
R sq. 0.23 0.23 0.55 0.58SEE 0.15 0.15 0.08 0.11

35
Panel CCapabilities (incl. Leisure)male female
B T B T(Constant) 1.19*** 7.13 1.76*** 5.95parttime andtemporary
0.10 1.44 0.07 1.18
parttime andpermanent
0.06* 1.66 0.24*** 9.85
fulltime andtemporary
-0.01 -0.36 -0.02 -0.45
R sq. 0.15 0.41SEE 0.23 0.32
(Source: own computations on GSOEP)
Table 9, panel A to C, shows hardly any significant effects for men. Only working
full-time and temporary and working part-time and temporary has significant negative effects
for respectively the vector of basic and social functionings and degree of social integration.
However, these effects are counterbalanced by taking leisure into account. Panel C does not
show a significant negative effect of neither working full-time temporary nor part-time
temporary. So, full-time temporary employees seem to have an equal amount of capabilities
as their counterparts with permanent contracts.
The effects of the type of work-arrangement for women are more significant:
especially working part-time either on a temporary or on a permanent base, has a positive
influence on the primary goods and capabilities-metrics. Apparently, women with a part-time
contract seem to have more capabilities to increase life-quality than men with part-time or
full-time contracts.
In the former section, we saw that low-educated were less satisfied with their non-
standard contract than the higher-educated. The next table shows the results for the liberal
accounts of life-quality.

36
Table 10: regressions on life –quality by education
Panel APrimary goods Primary Goods + leisureless than high school more than high school Less than high school more than high schoolB T B T B T B T
(Constant) 0.64 0.96 -1.61 -1.39 0.97 2.24 -0.56 -0.87parttime andtemporary
-0.27 -0.62 0.07 0.30 -0.41 -1.44 0.17 1.39
parttime andpermanent
-0.35 -0.89 0.04 0.23 -0.27 -1.06 0.18 2.01
fulltime andtemporary
-0.12 -1.20 0.05 0.26 -0.11* -1.67 0.08 0.79
parttime andfemale
0.40 1.01 0.10 0.47 0.49 1.88 0.16 1.40
R sq. 0.31 0.47 0.29 0.44SEE 0.54 0.83 0.36 0.46
Panel BDegree of social integration Basic + social functioningsless than high school more than high school Less than high school more than high schoolB T B T B T B T
(Constant) 1.03*** 5.79 0.44*** 2.09 1.01*** 9.17 0.85*** 7.32parttime andtemporary
0.18 1.56 -0.10** -2.55 -0.10 -1.37 -0.01 -0.36
parttime andpermanent
0.11 1.01 -0.04 -1.31 -0.06 -0.95 0.05*** 3.21
fulltime andtemporary
0.04 1.52 -0.02 -0.64 -0.06*** -3.56 0.00 -0.01
parttime andfemale
-0.12 -1.16 0.02 0.57 0.13** 2.00 0.06*** 2.98
R sq. 0.30 0.29 0.59 0.53SEE 0.15 0.15 0.09 0.08
Panel CCapabilitiesless than high school more than high schoolB T B T
(Constant) 1.16*** 3.69 0.67** 1.99parttime andtemporary
-0.32 -1.58 0.14** 2.11
parttime andpermanent
-0.13 -0.70 0.19*** 4.06
fulltime andtemporary
-0.08* -1.67 0.06 1.08
parttime andfemale
0.35 1.88 0.14** 2.43
R sq. 0.30 0.37SEE 0.25 0.24
(Source: own computations on GSOEP)
37
All non-standard work-arrangements have a positive impact on the capabilities for
high-educated employees. The scores of the low-educated employees on the capabilities-
metric is mostly negative. These results may suggest that non-standard work-arrangements
offer especially high-educated employees more opportunities to combine work with other
activities. Again, part-time work-arrangements have a positive impact on life-quality for
women. Temporary arrangements have a negative effect for low-educated regarding the
capabilities-index and primary goods-index.
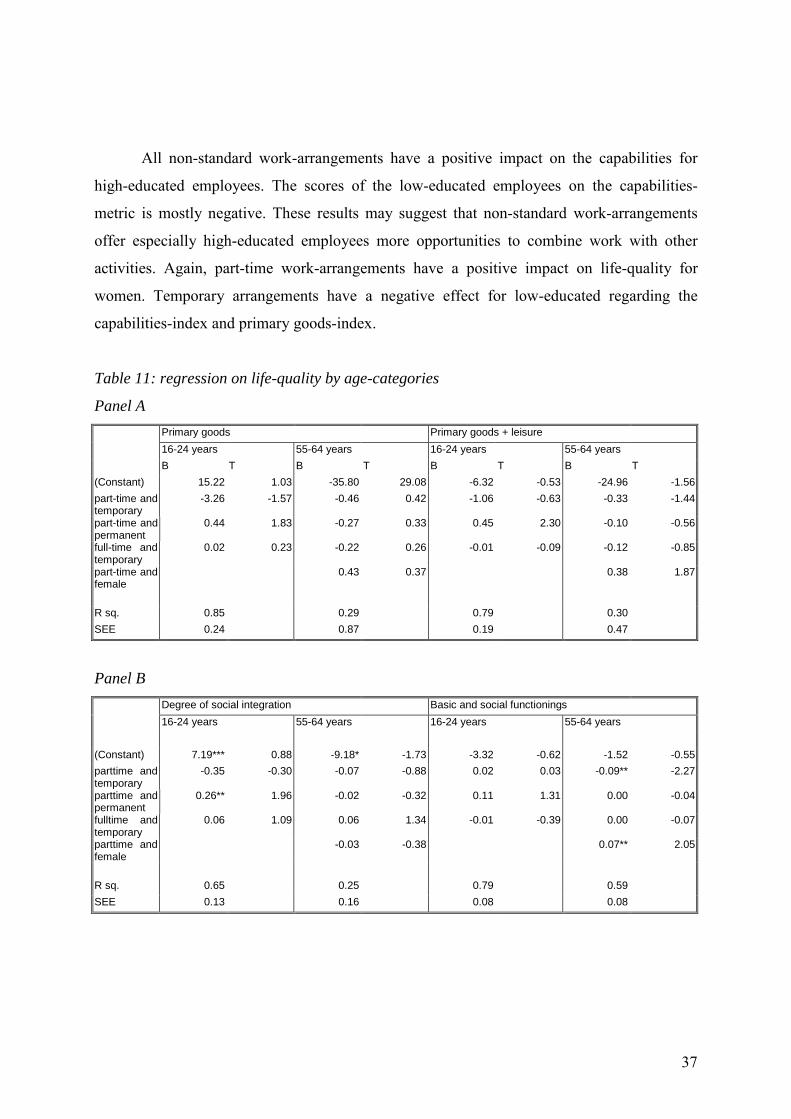
Table 11: regression on life-quality by age-categories
Panel APrimary goods Primary goods + leisure16-24 years 55-64 years 16-24 years 55-64 yearsB T B T B T B T
(Constant) 15.22 1.03 -35.80 29.08 -6.32 -0.53 -24.96 -1.56part-time andtemporary
-3.26 -1.57 -0.46 0.42 -1.06 -0.63 -0.33 -1.44
part-time andpermanent
0.44 1.83 -0.27 0.33 0.45 2.30 -0.10 -0.56
full-time andtemporary
0.02 0.23 -0.22 0.26 -0.01 -0.09 -0.12 -0.85
part-time andfemale
0.43 0.37 0.38 1.87
R sq. 0.85 0.29 0.79 0.30SEE 0.24 0.87 0.19 0.47
Panel BDegree of social integration Basic and social functionings16-24 years 55-64 years 16-24 years 55-64 years
(Constant) 7.19*** 0.88 -9.18* -1.73 -3.32 -0.62 -1.52 -0.55parttime andtemporary
-0.35 -0.30 -0.07 -0.88 0.02 0.03 -0.09** -2.27
parttime andpermanent
0.26** 1.96 -0.02 -0.32 0.11 1.31 0.00 -0.04
fulltime andtemporary
0.06 1.09 0.06 1.34 -0.01 -0.39 0.00 -0.07
parttime andfemale
-0.03 -0.38 0.07** 2.05
R sq. 0.65 0.25 0.79 0.59SEE 0.13 0.16 0.08 0.08

38
Panel CCapabilities (incl. Leisure)16-24 years 55-64 years
(Constant) -15.59 -1.31 -7.82 -1.00parttime andtemporary
0.58 0.35 -0.14 -1.28
parttime andpermanent
0.28 1.47 0.03 0.40
fulltime andtemporary
-0.03 -0.32 -0.02 -0.23
parttime andfemale
0.20** 2.04
R sq. 0.67 0.38SEE 0.18 0.23
(Source: own computations on GSOEP)
Table 11 shows the positive impact of part-time permanent work-arrangements on the
quality of life of young employees. This in contrast to table 6 which showed that the welfare
of the adolescent was more or less indifferent towards work-arrangements.
Furthermore, panel A and C show that part-time contracts offer women older than
fifty-five more opportunities to pursue a conception of the good life. Elderly male employees
are somehow indifferent towards part-time work-arrangements: the coefficients are very small
and is for none of the dependent variables statistically significant.
Conclusions
From this section the conclusion must be drawn that, the impact of temporary work-
arrangements are less severe than the impact of those work-arrangements on the welfare
metrics. The effect is only significantly negative for the capabilities of the low-educated
employees. Part-time permanent work-arrangements seem to enhance the opportunities for
independently pursuing a conception of the good life. This holds especially for women, the
higher-educated and the older employees.
VIII CONCLUSIONS
This paper has addressed the question whether working part-time and/or temporary has
implications for the quality of life of the employees involved. For answering this question one
should assess what determines life-quality. I distinguished an utilitarian account and a liberal
one. In the utilitarian account life-quality depends on the feelings of satisfaction or stress. The
balance of enjoyment over dissatisfaction determines the life-quality. In the present paper, this

39
is measured by the GSOEP-variables which measure satisfaction and stress. In the liberal
account, the quality of life depends on the extent to which one is capable of autonomous
�forming, revising and pursuing� a conception of the good life. The liberal account focuses on
the opportunities one needs instead of the extent to which one forms, revises and pursues a
conception of the good life. According to Rawls, these opportunities or primary goods are the
basic liberties, income and wealth and the bases of self-respect. Sen has a broader view of
these opportunities. He focuses on functionings: whether someone has the opportunities /
capabilities to be adequately nourished, sheltered etc and whether one has the capabilities to
attend to social events or has the time to develop any hobbies.
Besides assessing what determines life-quality, one should for answering the question
control for gender, industry, age, income etc, since non-standard work-arrangements are
primary located in the low-skilled, low paid and low-status jobs and is highly gender-biased.
Especially temporary work-arrangements have negative effects on life-satisfaction
either part-time or full-time. Women with a part-time contract seem to appreciate their work-
arrangements. In almost all tables the effect of being female with a part-time contract for life-
satisfaction is significantly positive. Part-time contracts do not only enhance the life-
satisfaction of women, it offers them also more opportunities/primary goods/ capabilities for
independently forming and pursuing a conception of the good life.
Furthermore, temporary work seems to have a less negative impact on the liberal account of
life-quality than on the utilitarian one. Part-time permanent work-arrangements seem to
enhance the opportunities for independently pursuing a conception of the good life. This holds
especially for women, the high-educated and the older employees.
The results mentioned above should be interpreted with care. More research is needed
on the measurement-problems of abstract notions on for instance the quality of life.
Nevertheless, the present research gives some indication of that the effects of non-standard
work-arrangements and how they depend on a range of personal characteristics, and the vision
one has on what is important in life. In some cases the effects are opposing whether one
measures life-quality in terms of life-satisfaction or in terms of freedom or autonomy.
40
Literature
Clark, Andrew E. and Andrew J. Oswald (1994) �Unhappiness and Unemployment�. In:
The Economic Journal, vol. 104, issue 424, pp. 648-659.
Dworkin, R (1981) �What is Equality? Part I: Equality of Welfare. In: Philosophy and
Public Affairs vol. 10 issue 3, pp. 185-246.
Kalleberg, Arne L. (2000) �Nonstandard Employment Relations: Part-time, Temporary and
Contract Work�. In: Annual Review of Sociology, vol. 26 pp. 341-365.
Kymlicka, Will. �Contemporary Political Philosophy. An Introduction’. Clarendon Press,
Oxford, 1995.
Nolan, Brian, Wiemer Salverda, Bertrand Maitre and Peter Mühlau (2001) ‘An Analysis of
wages and Job Quality in the European Union’. Benchmarking Low-Wage and High-Wage
Employment in Europe and the United States. A Study of New European Datasets and
National Data. World Wide Web: http://www.uva.nl/aias
Praag, van B.M.S, P. Frijters and A. Ferrer-i-Carbonell (2000) �A Structural Model of Well-
being. In: Tinbergen Institute Discussion Paper 053/3.
Rachels, James (1993) ‘The Elements of Moral Philosophy
Rawls, John (1971) �A Theory of Justice’. Oxford University Press, London.
Rawls, John (1993) �Political Liberalism’, Colombia University Press, New York
Reilly, Peter A. (1998) �Balancing Flexibility � Meeting the Interests of Employer and
Employee�. In: European Journal of work and Organizational Psychology, vol. 7, issue 1, pp.
7-22.
Sen, Amartya (1993) �Capability and Well-being�. In: Martha C. Nussbaum and Amartya Sen
(ed.) �The Quality of Life’. Clarendon Press, Oxford.
Smith, Vicki (1997) �New Forms of Work Organization�. In: Annual Review of Sociology,
vol. 23, pp. 315-339.
Theodossiou, I. (1998) �The Effects of low-pay and unemployment on psychological well-
being: a logistic approach. In: Journal of Health Economics, vol. 17 pp. 85-104.

41
APPENDIX
Table A1
Selection sample
Total sample 16023Minus unemployed 8712Minus individuals below the age of 16 andabove 64
56
Minus the individuals who not work now 681Work-sample 6547