Embed Size (px)
Citation preview

What Our Prospects Are Thinking Right Now!
Michael J. StarkeVice President of ResearchV ce es de o esea c
April 7, 2009
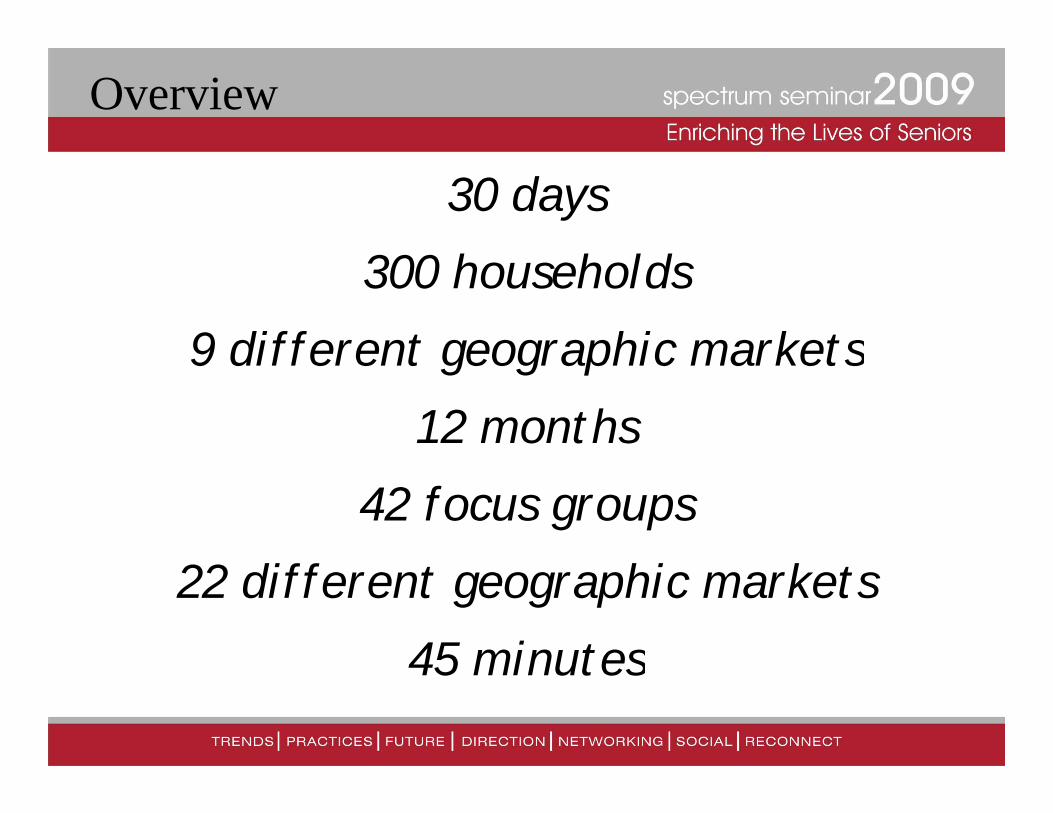
Overview
30 days
h h ld300 households
9 different geographic markets9 different geographic markets
12 months
42 focus groups
22 different geographic markets
45 minutes45 minutes
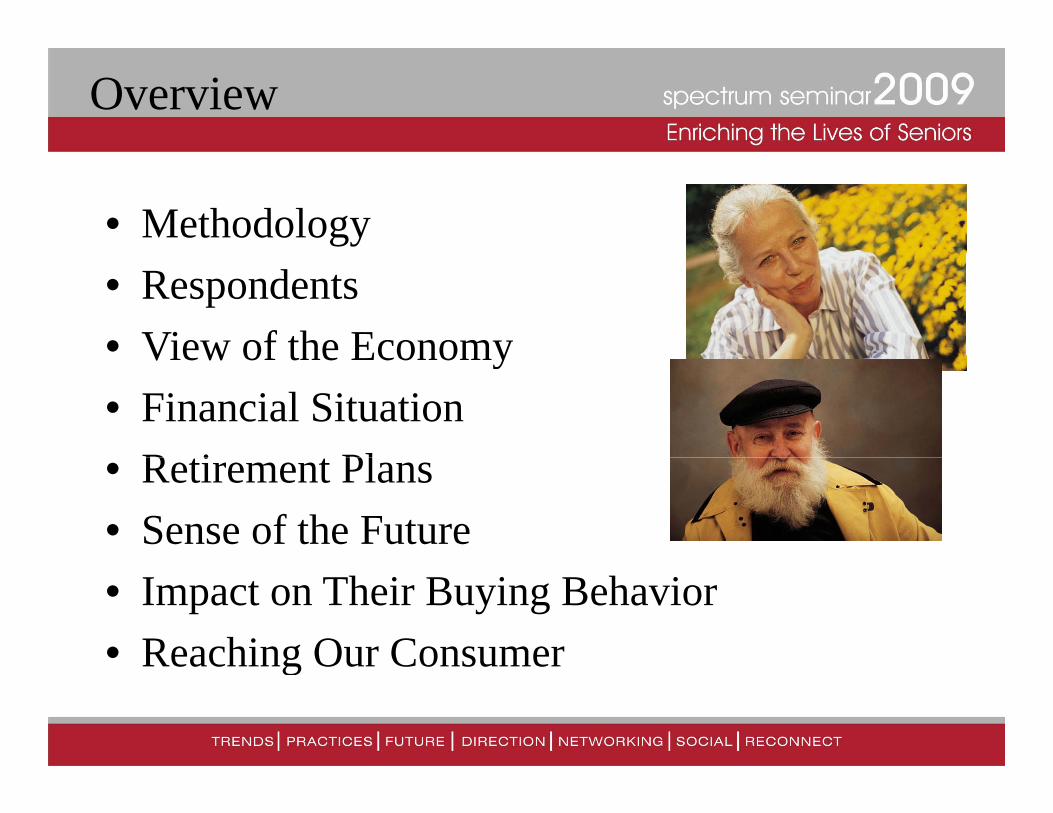
Overview
• Methodology• Respondents• View of the EconomyView of the Economy• Financial Situation
R ti t Pl• Retirement Plans• Sense of the Future• Impact on Their Buying Behavior• Reaching Our ConsumerReaching Our Consumer
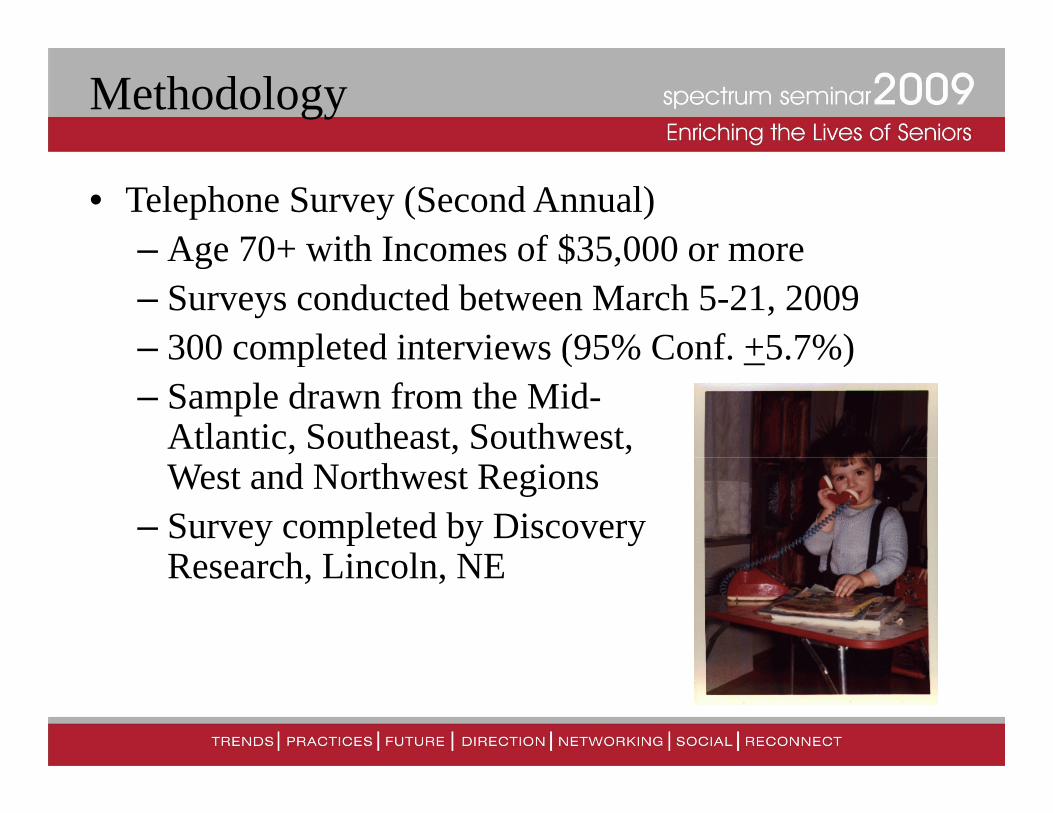
Methodology
• Telephone Survey (Second Annual)– Age 70+ with Incomes of $35 000 or moreAge 70+ with Incomes of $35,000 or more– Surveys conducted between March 5-21, 2009– 300 completed interviews (95% Conf +5 7%)300 completed interviews (95% Conf. +5.7%)– Sample drawn from the Mid-
Atlantic, Southeast, Southwest,West and Northwest Regions
– Survey completed by DiscoveryR h Li l NEResearch, Lincoln, NE
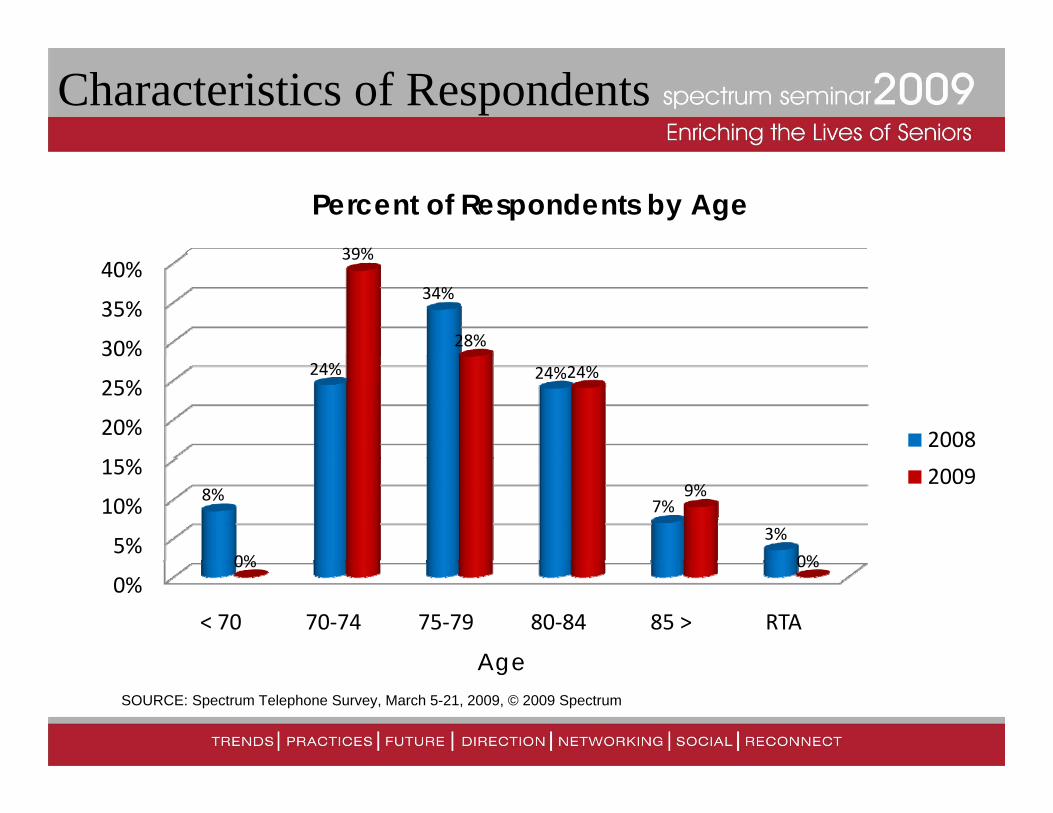
Characteristics of Respondents
39%
Percent of Respondents by Age
30%
35%
40%34%
39%
28%
20%
25%
30%24% 24%24%
2008
5%
10%
15%8%
7%
3%
0%
9%
0%
2009
0%
< 70 70‐74 75‐79 80‐84 85 > RTA
0% 0%
AgeAgeSOURCE: Spectrum Telephone Survey, March 5-21, 2009, © 2009 Spectrum
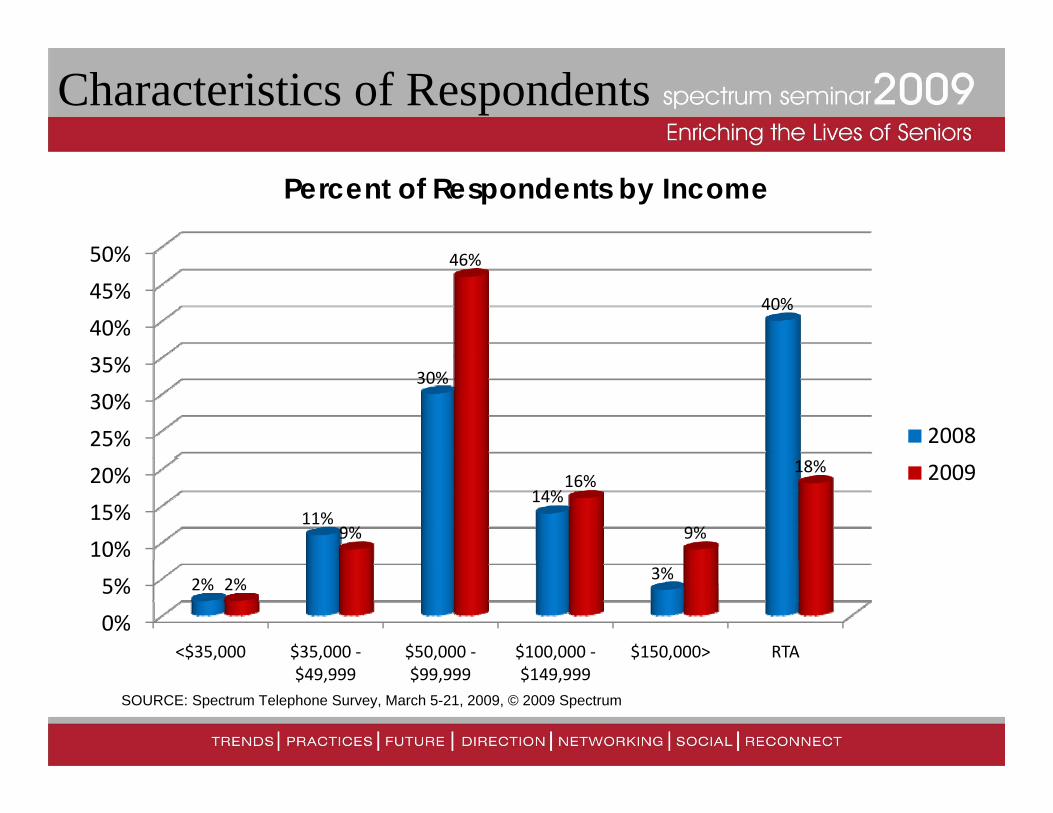
Characteristics of Respondents
50%
Percent of Respondents by Income
40%
45%
50%
40%
46%
25%
30%
35%30%
2008
10%
15%
20%
11%14%
9%
16%
9%
18% 2009
0%
5%
<$35,000 $35,000 ‐ $50,000 ‐ $100,000 ‐ $150,000> RTA
2%3%
2%
$49,999 $99,999 $149,999SOURCE: Spectrum Telephone Survey, March 5-21, 2009, © 2009 Spectrum
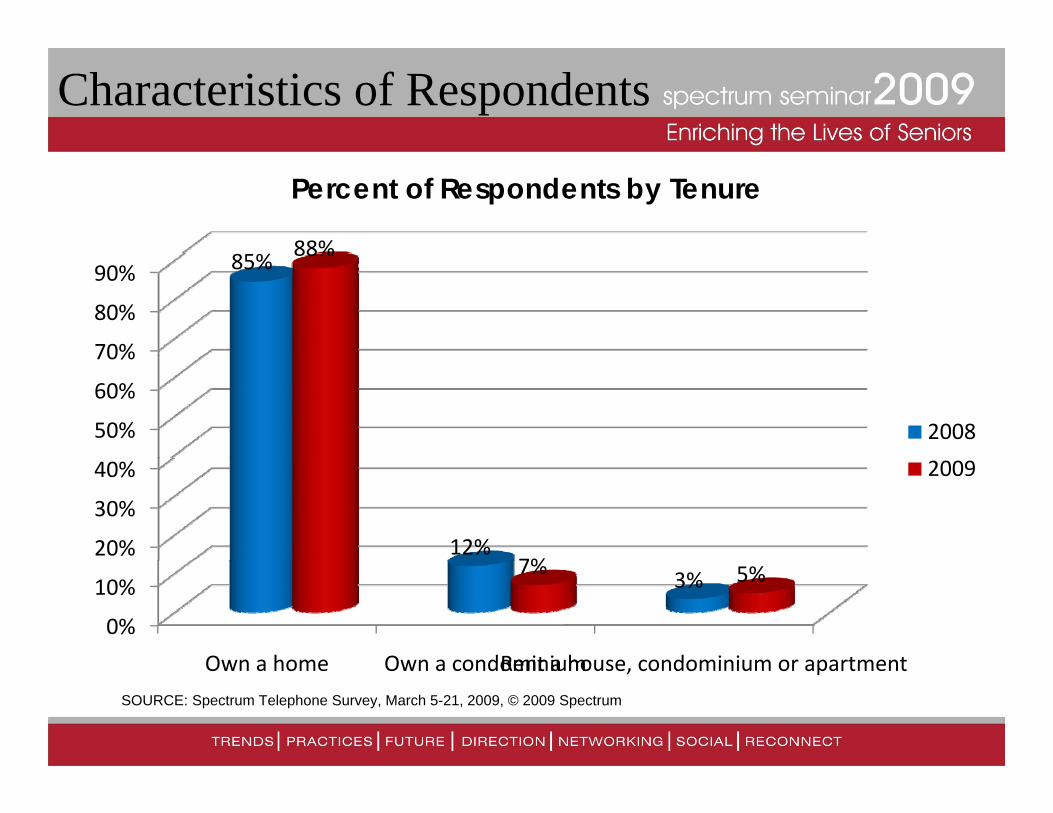
Characteristics of Respondents
88%
Percent of Respondents by Tenure
70%
80%
90% 85% 88%
50%
60%
70%
2008
20%
30%
40%
12%7%
2009
0%
10%
Own a home Own a condominiumRent a house condominium or apartment
3%7% 5%
Own a home Own a condominiumRent a house, condominium or apartment
SOURCE: Spectrum Telephone Survey, March 5-21, 2009, © 2009 Spectrum
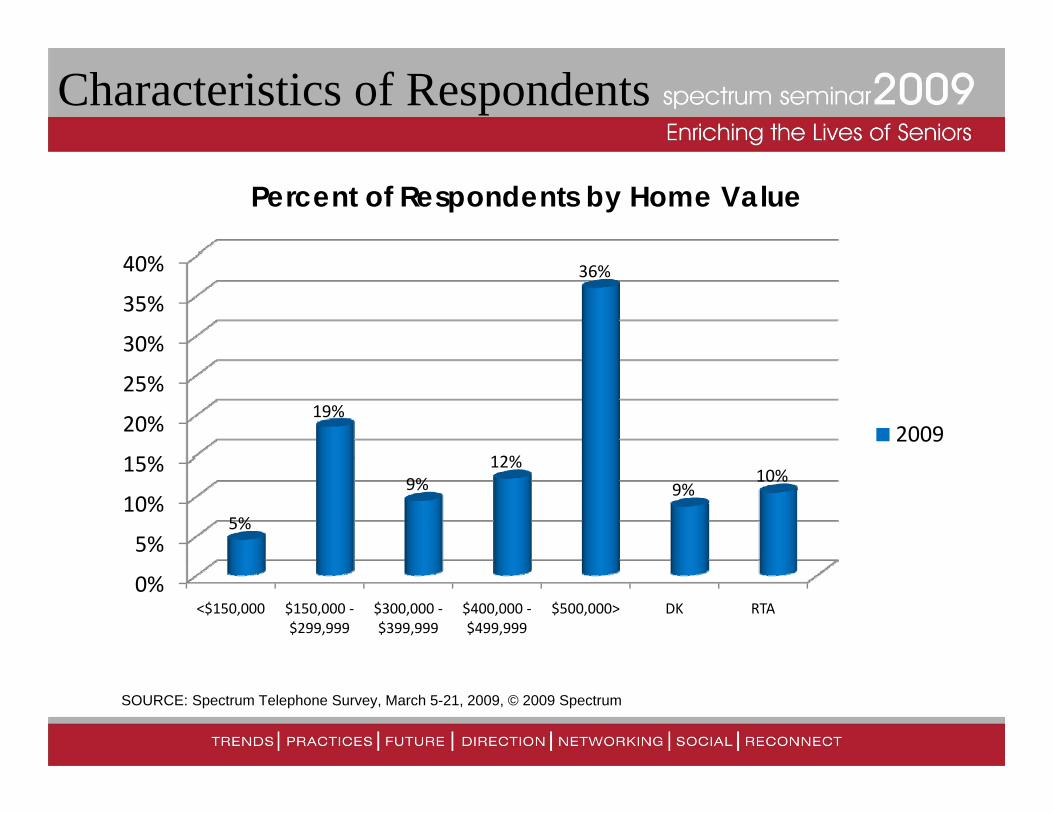
Characteristics of Respondents
Percent of Respondents by Home Value
30%
35%
40% 36%
15%
20%
25%19%
12%2009
5%
10%
15%
5%
9%12%
9%10%
0%<$150,000 $150,000 ‐
$299,999$300,000 ‐$399,999
$400,000 ‐$499,999
$500,000> DK RTA
SOURCE: Spectrum Telephone Survey, March 5-21, 2009, © 2009 Spectrum
Characteristics of Respondents
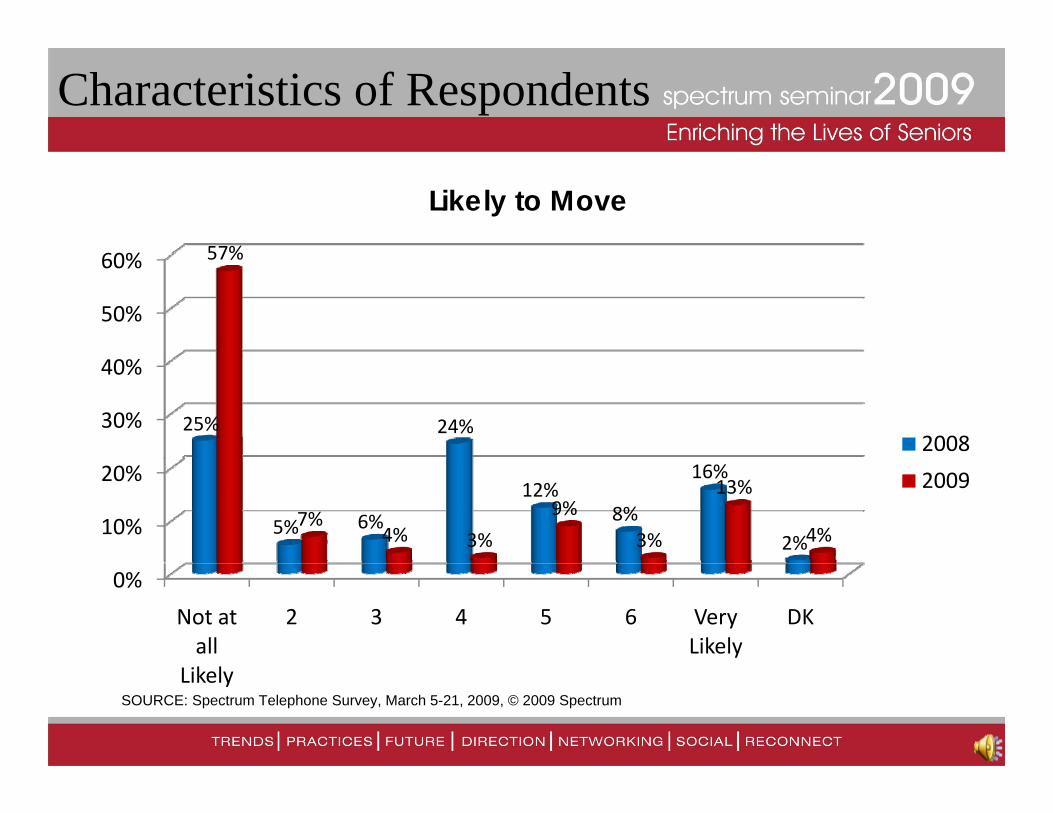
60% 57%
Likely to Move
50%
60% 57%
30%
40%
25% 24%2008
10%
20%
5% 6%
12%8%
16%
2%7%
4% 3%
9%
3%
13%
4%
2009
0%
Not at all
2 3 4 5 6 Very Likely
DK
LikelySOURCE: Spectrum Telephone Survey, March 5-21, 2009, © 2009 Spectrum
Characteristics of Respondents
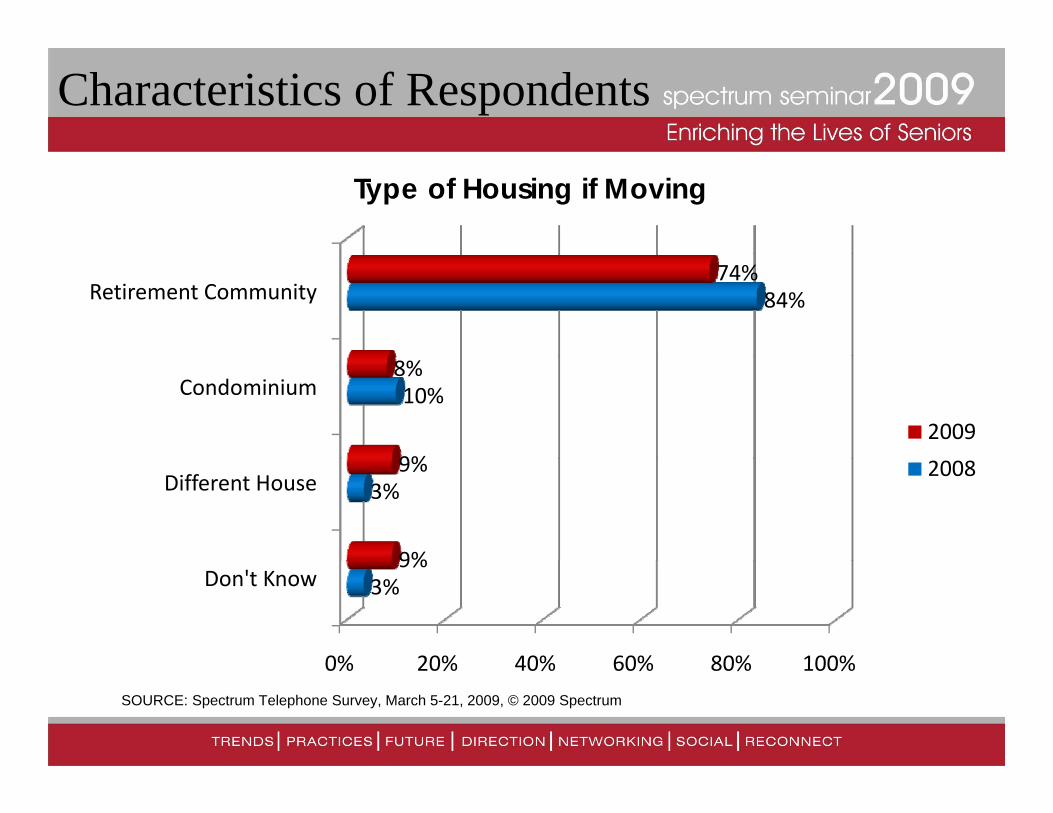
Type of Housing if Moving
Retirement Community 84%74%
Condominium 10%
9%
8%
2009
Different House 3%
9%
9% 2008
0% 20% 40% 60% 80% 100%
Don't Know 3%9%
0% 20% 40% 60% 80% 100%
SOURCE: Spectrum Telephone Survey, March 5-21, 2009, © 2009 Spectrum
Current View of the Economy
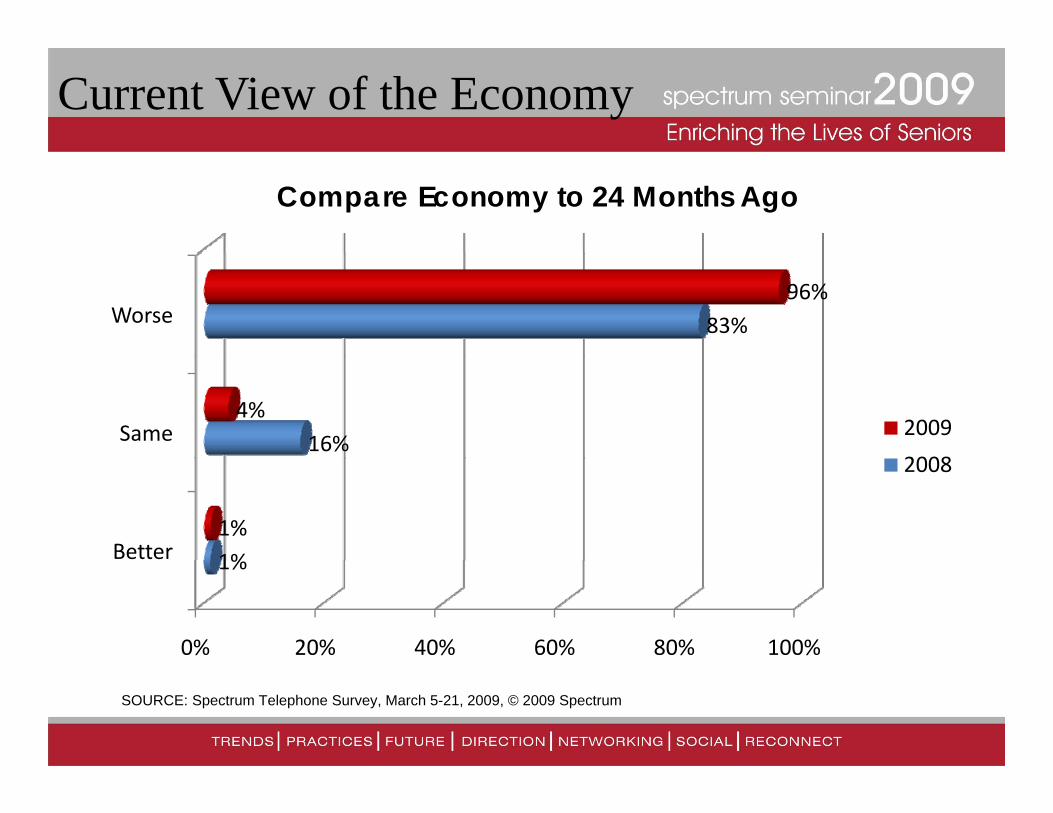
Compare Economy to 24 Months Ago
Worse 83%96%
Same 16%4%
2009
2008
Better 1%1%
2008
0% 20% 40% 60% 80% 100%
1%
SOURCE: Spectrum Telephone Survey, March 5-21, 2009, © 2009 Spectrum
Impact on Financial Situation
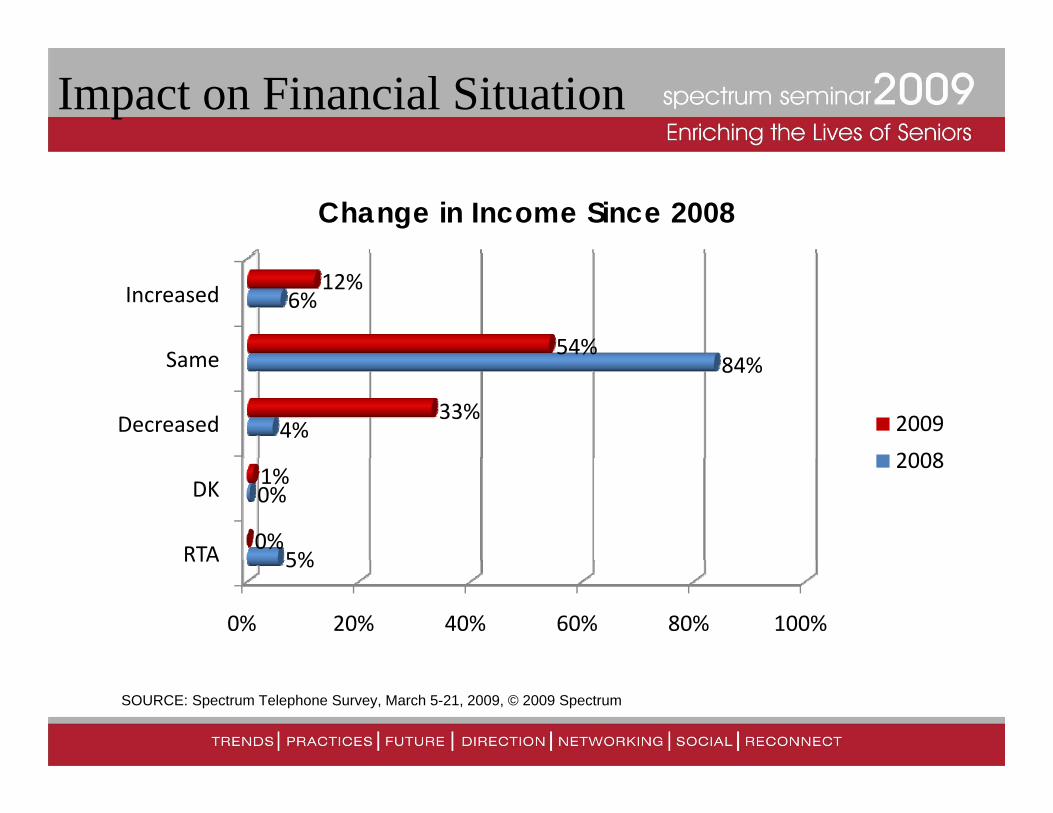
Change in Income Since 2008
S
Increased 6%
54%
12%
Decreased
Same
4%
84%
33% 2009
2008
RTA
DK
5%
0%
0%
1%2008
0% 20% 40% 60% 80% 100%
RTA 5%
SOURCE: Spectrum Telephone Survey, March 5-21, 2009, © 2009 Spectrum
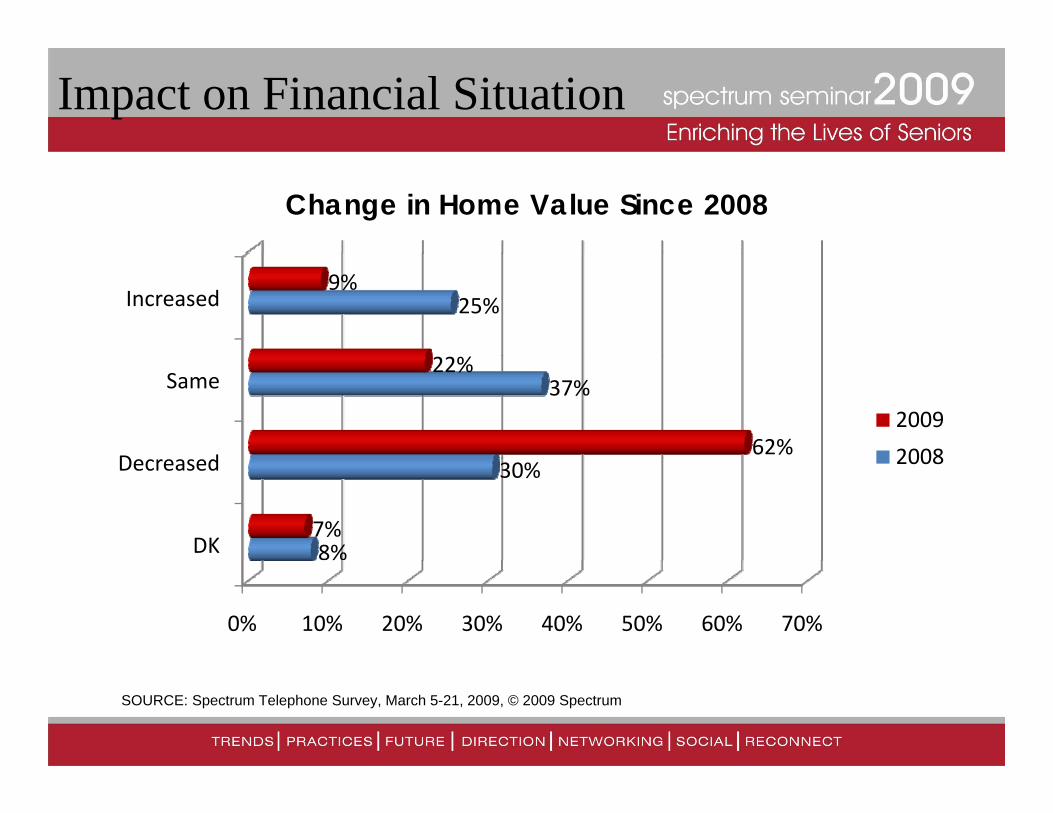
Impact on Financial Situation
Change in Home Value Since 2008
Increased 25%9%
D d
Same 37%
62%
22%
2009
2008
DK
Decreased
8%
30%
7%
2008
0% 10% 20% 30% 40% 50% 60% 70%
SOURCE: Spectrum Telephone Survey, March 5-21, 2009, © 2009 Spectrum
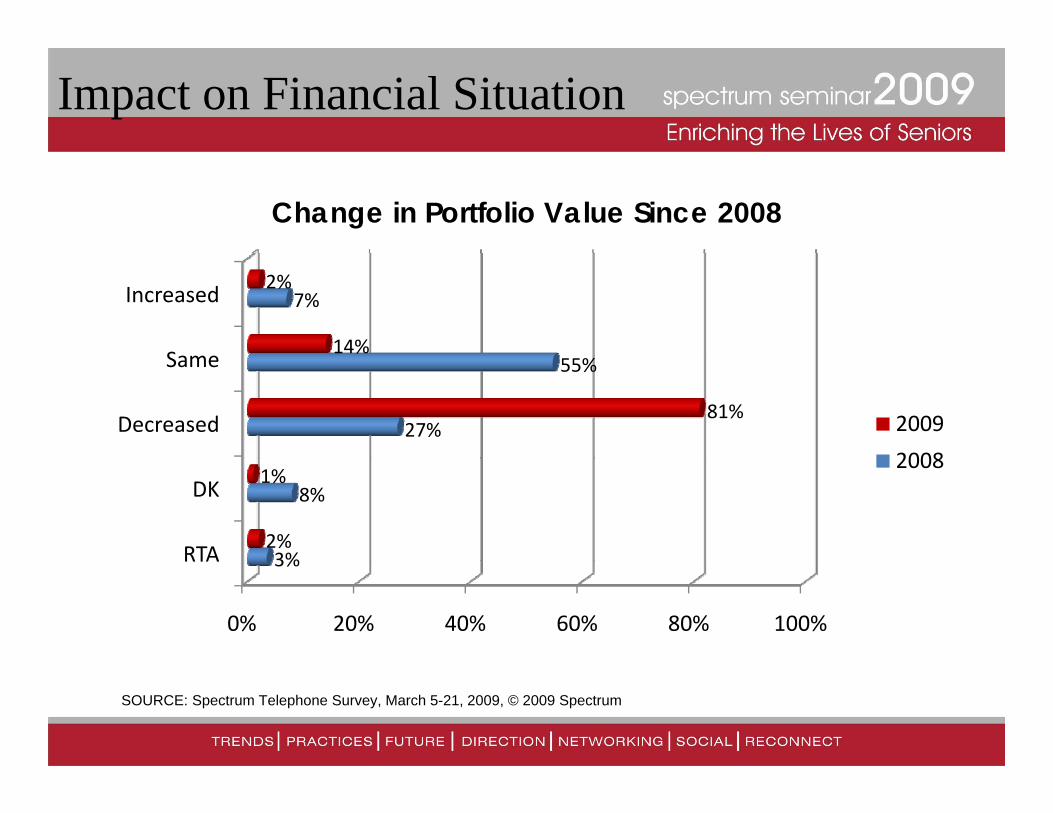
Impact on Financial Situation
Change in Portfolio Value Since 2008
S
Increased 7%
14%
2%
Decreased
Same
27%
55%
81% 2009
2008
RTA
DK
3%
8%
2%
1%2008
0% 20% 40% 60% 80% 100%
RTA 3%
SOURCE: Spectrum Telephone Survey, March 5-21, 2009, © 2009 Spectrum
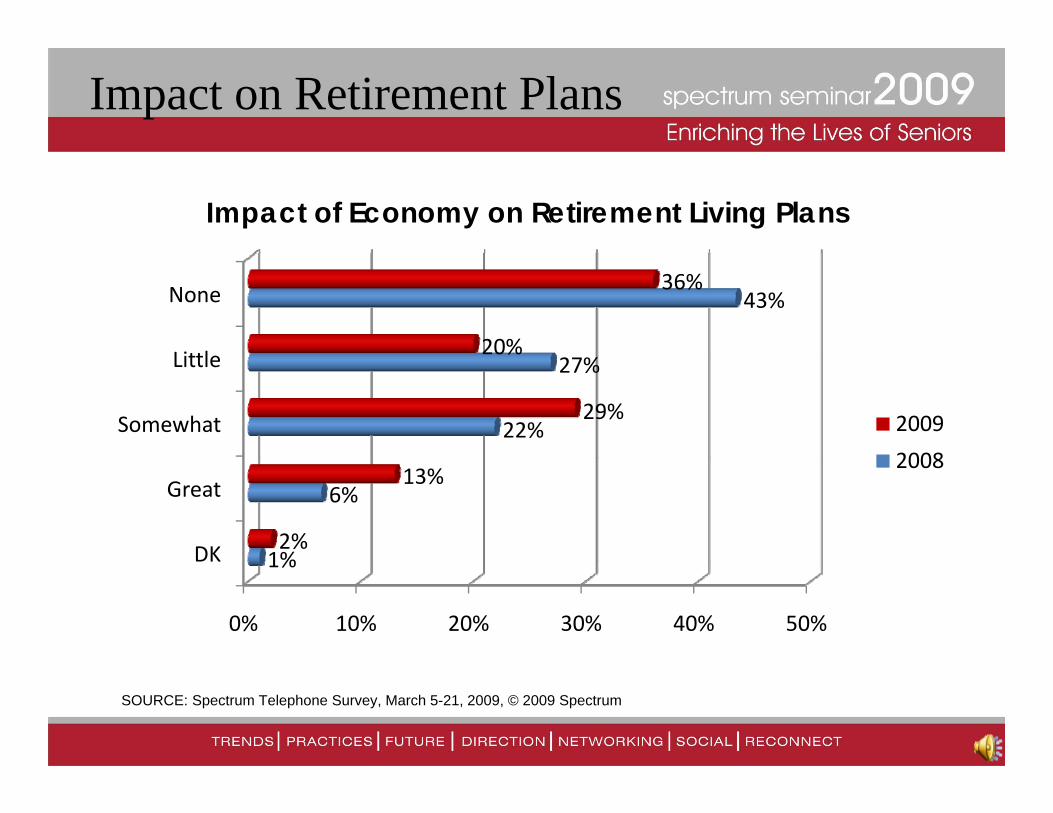
Impact on Retirement Plans
Impact of Economy on Retirement Living Plans
Littl
None 43%
20%
36%
Somewhat
Little
22%
27%
29% 2009
2008
DK
Great
1%
6%
2%
13%2008
0% 10% 20% 30% 40% 50%
DK 1%
SOURCE: Spectrum Telephone Survey, March 5-21, 2009, © 2009 Spectrum
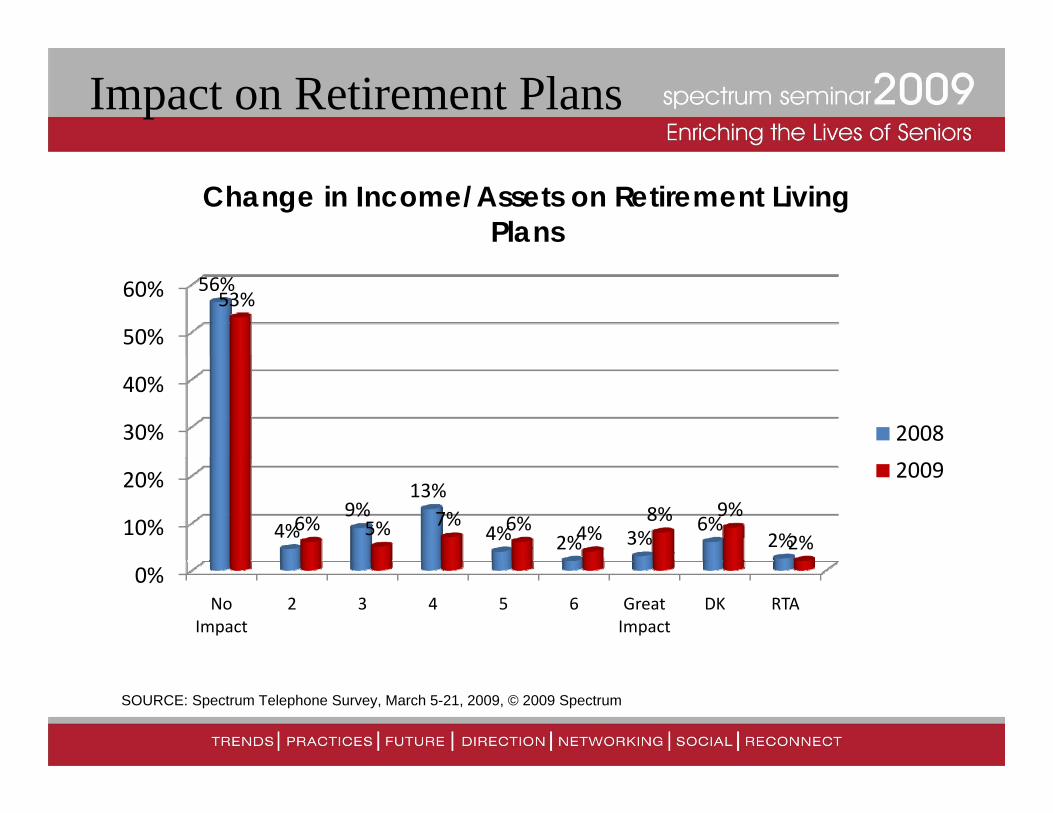
Impact on Retirement Plans
Change in Income/Assets on Retirement Living Plans
50%
60% 56%53%
30%
40%
2008
10%
20%
4%9%
13%
4% 2% 3%6%
2%6% 5% 7% 6% 4%
8% 9%
2%
2009
0%No
Impact2 3 4 5 6 Great
ImpactDK RTA
SOURCE: Spectrum Telephone Survey, March 5-21, 2009, © 2009 Spectrum
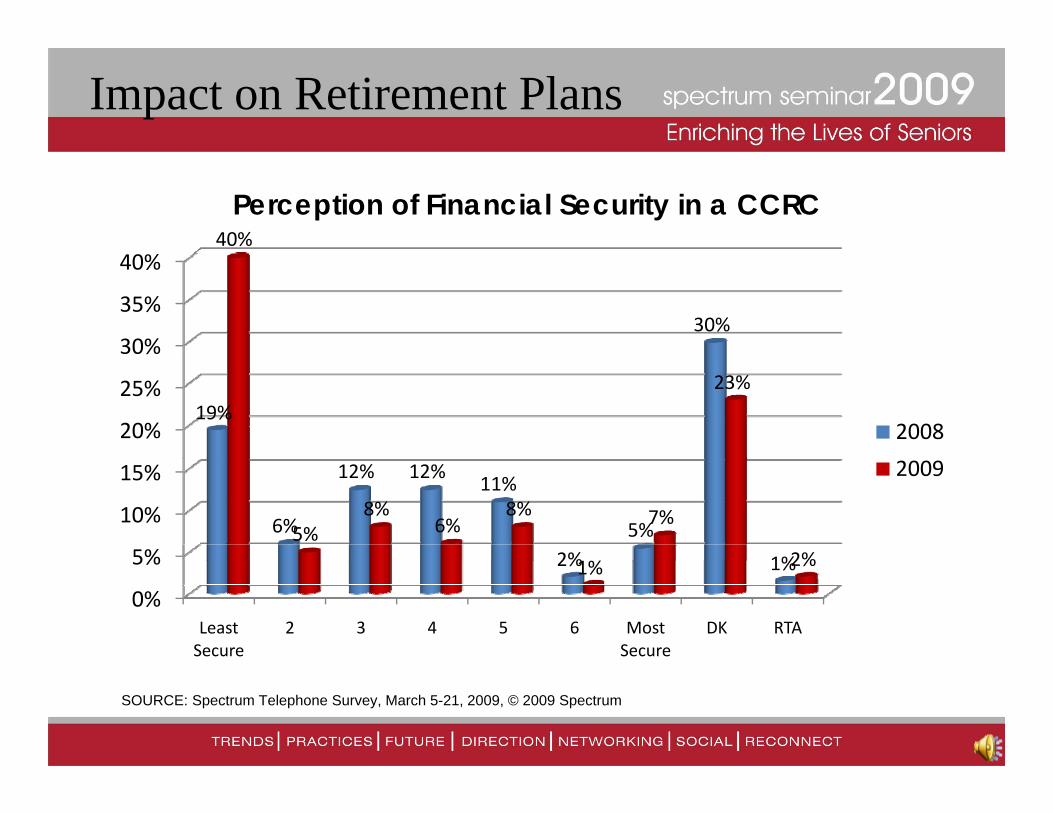
Impact on Retirement Plans
40%
Perception of Financial Security in a CCRC
30%
35%
40%
30%
20%
25%19%
23%
2008
5%
10%
15%
6%
12% 12%11%
2%5%
1%5%
8%6%
8%
%
7%
2%
2009
0%
5%
Least Secure
2 3 4 5 6 Most Secure
DK RTA
2% 1%1% 2%
SOURCE: Spectrum Telephone Survey, March 5-21, 2009, © 2009 Spectrum
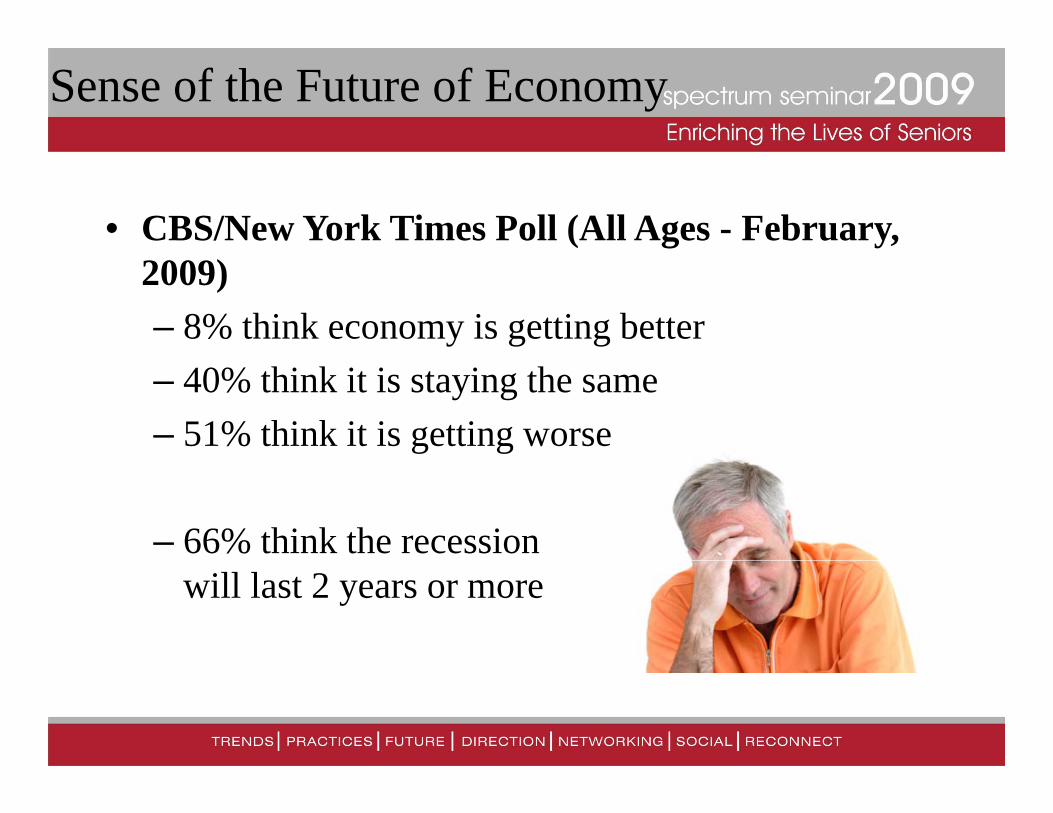
Sense of the Future of Economy
• CBS/New York Times Poll (All Ages - February, 2009)– 8% think economy is getting better– 40% think it is staying the same– 51% think it is getting worse
– 66% think the recession will last 2 years or more
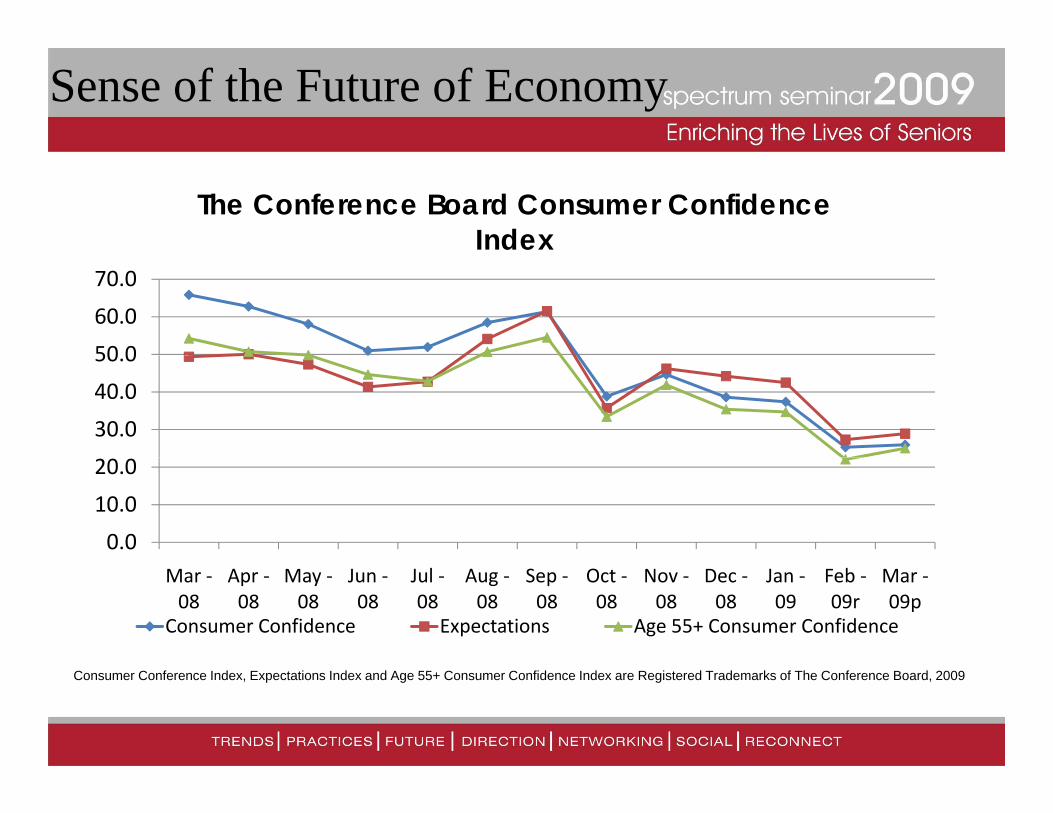
Sense of the Future of Economy
The Conference Board Consumer Confidence Index
50 0
60.0
70.0
30.0
40.0
50.0
0.0
10.0
20.0
Mar ‐08
Apr ‐08
May ‐08
Jun ‐08
Jul ‐08
Aug ‐08
Sep ‐08
Oct ‐08
Nov ‐08
Dec ‐08
Jan ‐09
Feb ‐09r
Mar ‐09p
Consumer Confidence Expectations Age 55+ Consumer Confidence
Consumer Conference Index, Expectations Index and Age 55+ Consumer Confidence Index are Registered Trademarks of The Conference Board, 2009
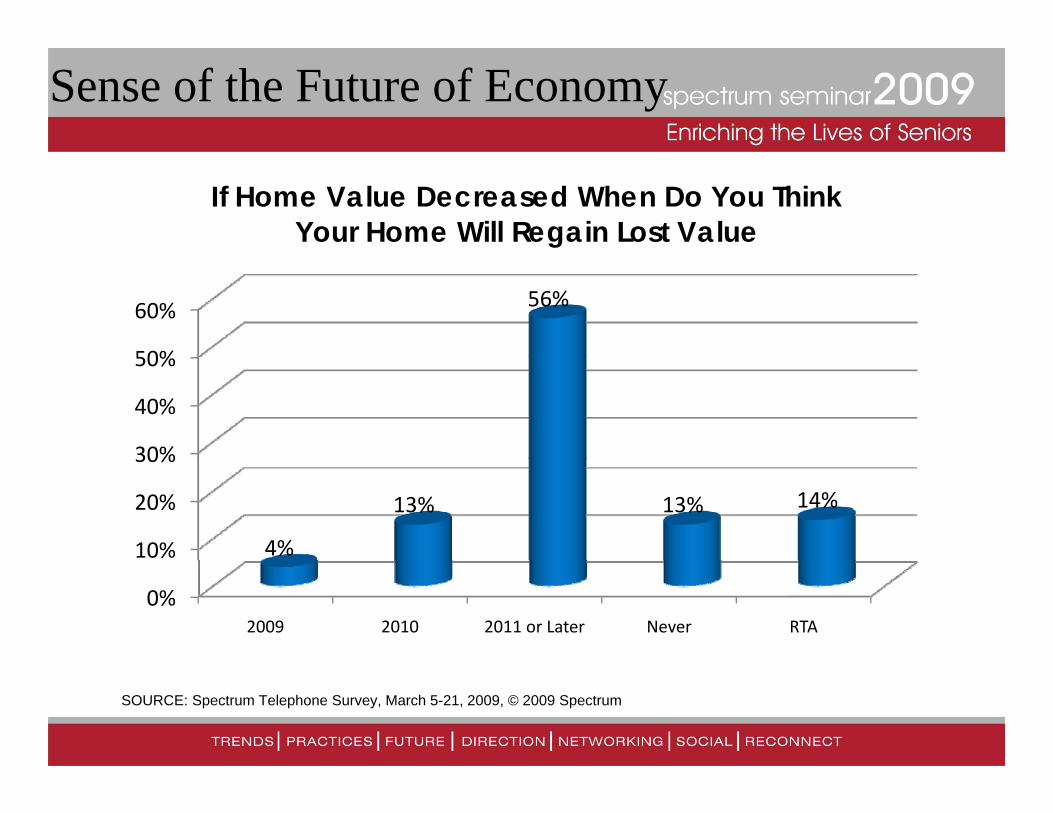
Sense of the Future of Economy
If Home Value Decreased When Do You Think Your Home Will Regain Lost Value
50%
60% 56%
30%
40%
50%
10%
20%
30%
4%
13% 13% 14%
0%2009 2010 2011 or Later Never RTA
SOURCE: Spectrum Telephone Survey, March 5-21, 2009, © 2009 Spectrum
Sense of the Future of Economy
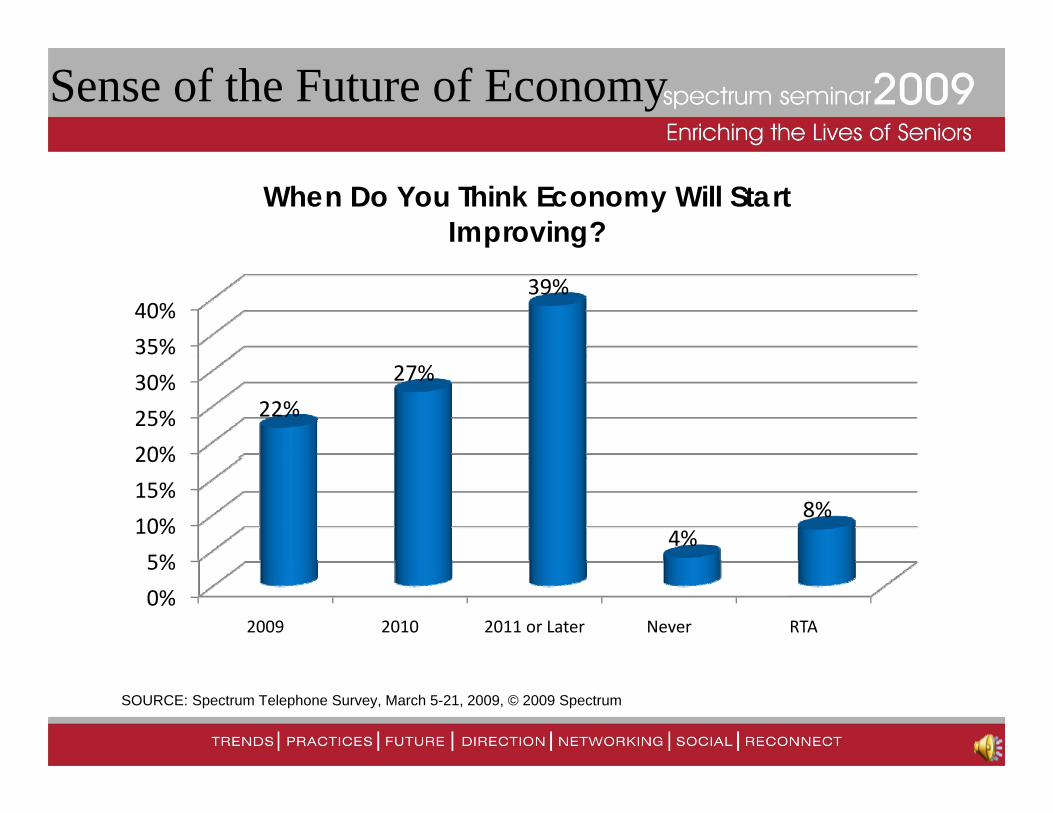
When Do You Think Economy Will Start Improving?
35%
40%39%
20%
25%
30%22%
27%
5%
10%
15%
20%
4%8%
0%
5%
2009 2010 2011 or Later Never RTA
SOURCE: Spectrum Telephone Survey, March 5-21, 2009, © 2009 Spectrum
Impact on Buying Behavior
• In 2008 (+6 9%) of respondents reported that• In 2008 - ____ (+6.9%) of respondents reported that they were not going to move because of the economy
SOURCE: Spectrum Telephone Survey, March 5-21, 2009, © 2009 Spectrum
Impact on Buying Behavior
• In 2008 2 3% (+6 9%) of respondents reported that• In 2008 - 2.3% (+6.9%) of respondents reported that they were not going to move because of the economy
SOURCE: Spectrum Telephone Survey, March 5-21, 2009, © 2009 Spectrum
Impact on Buying Behavior
• In 2008 2 3% (+6 9%) of respondents reported that• In 2008 - 2.3% (+6.9%) of respondents reported that they were not going to move because of the economy
• In 2009 - 27.0% (+5.7%) ofrespondents reported that theyp p ywere not going to movebecause of the economy
SOURCE: Spectrum Telephone Survey, March 5-21, 2009, © 2009 Spectrum
Impact on Buying Behavior
• In 2008 - ____ (+6.9%) of respondents reported they were going to delay their move because of thewere going to delay their move because of the economy
SOURCE: Spectrum Telephone Survey, March 5-21, 2009, © 2009 Spectrum
Impact on Buying Behavior
• In 2008 - 6.3% (+6.9%) of respondents reported they were going to delay their move because of thewere going to delay their move because of the economy
SOURCE: Spectrum Telephone Survey, March 5-21, 2009, © 2009 Spectrum

Impact on Buying Behavior
• In 2008 - 6.3% (+6.9%) of respondents reported they were going to delay their move because of thewere going to delay their move because of the economy
• In 2009 - 47 3% (+5 7%) of respondents reported theyIn 2009 47.3% (+5.7%) of respondents reported they were going to delay their move because of the economy
SOURCE: Spectrum Telephone Survey, March 5-21, 2009, © 2009 Spectrum
Impact on Buying Behavior
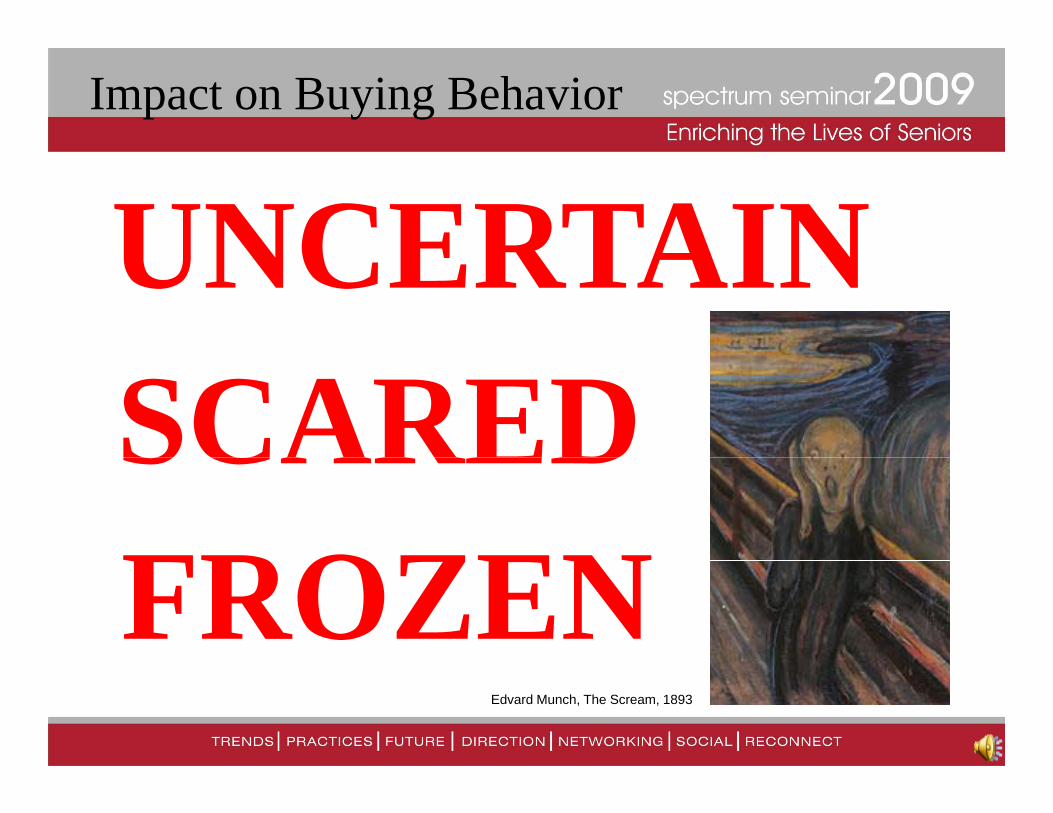
UNCERTAINUNCERTAINSCAREDSCAREDFROZENFROZEN
Edvard Munch, The Scream, 1893
Reaching Our Consumer
Denial & Isolation&
Reaching Our Consumer
Denial & IsolationCommunity&C y
Reaching Our Consumer
Angerg

Reaching Our Consumer
AngerListeningg g
Reaching Our Consumer
BargainingBargaining

Reaching Our Consumer
BargainingPeer SupportBargaining Peer Support
Reaching Our Consumer
DepressionDepression

Reaching Our Consumer
DepressionCommunityDepressionof Peers

Reaching Our Consumer
Acceptancep
Q estions/CommentsQuestions/Comments