Embed Size (px)
Citation preview

What pricereputation?Corporate Reputation Value Drivers: A Global Report by AMO
AMO is the leading global partnership of strategic advisory and communications consultancies. We provide our clients around the world with thoughtful counsel producing better business results.Founded in 2001, we have a unique structure, pairing deep local market expertise with broad global perspective and integrated project management.
Foreword
Methodology
Main findings
The economic impact of reputation
Country focus
Industry focus
Reputation drivers
The AMO network
About the author
2
4
6
8
10
12
14
18
20
Contents—
1 What price reputation?
Foreword—
In a world of growing complexity and rapid-fire stock market volatility, investors are increasingly sensitive to company reputations.
When times get tough, it is the companies with stronger, more balanced corporate reputations that will ride the storm most effectively, protect value and come out on top. Which means, of course, that understanding the elements that work hardest to protect and enhance the value of their company’s reputation is crucial to managers of any listed company.
But this has remained hard to examine, difficult to pinpoint and impossible to measure in any comprehensive way, until now.
2 What price reputation?
The 2019 AMO Global Reputation Value Drivers report reveals for the first time the individual components of corporate reputation that are creating most value for the world’s leading blue-chip companies and is essential insight for all concerned with the management of the critical assets that are corporate reputations.
Angus Maitland, Co-Chairman of AMO Founder of Maitland/AMO
James Abernathy, Co-Chairman of AMO Founder of Abernathy MacGregor/AMO
3 What price reputation?
Methodology—
Drawing on research by Reputation Dividend, the AMO report spells out how reputation contributes to the stock market valuations of over 1,000 of the world’s largest companies in 15 leading national indices.
Reputation value analysis is founded on the understanding that no single method of valuing companies can fully explain market capitalisation with any consistency.
Each company’s reputation value is measured by calculating the extent to which its actual stock market capitalisation differs from the value implied by standard financial metrics alone, such as earnings multiples, discounted cash flows, or free cash flow yields.
The regression-based approach uses an array of data combining financial metrics and non-financial factors including research-sourced measures of corporate reputation to derive a “general model of investor behaviour”. This, calibrated on an annual basis, explains close to 95% of companies’ market cap with a high degree of statistical significance.
The reputation-driven element of any individual company’s market capitalisation is determined by applying the “general model” to the precise circumstances of that company’s performance. This reveals the degree to which its shares trade at a premium or discount to the value implied by the financials alone – the supra-normal (or sub-normal) value resulting from corporate reputation.
4 What price reputation?
The research used data from Bloomberg and Morningstar to determine the financial metrics for 1,073 companies in the 15 national blue-chip indices. This universe comprises 67% of the companies in the indices with 77% of the gross market capitalisation. Companies with incomplete data histories were excluded from the analysis, resulting in 538 being removed from the overall total of 1,611. Findings on the 1,073 were then extrapolated to the full universe.
For our analysis of the impact of the corporate reputation indicators, we applied the nine categories used in Fortune magazine’s annual “Most Admired Companies” survey.
This report provides broad-based data findings by market and by industry. For details of individual companies’ reputation contribution data, please contact your local AMO office.
5 What price reputation?
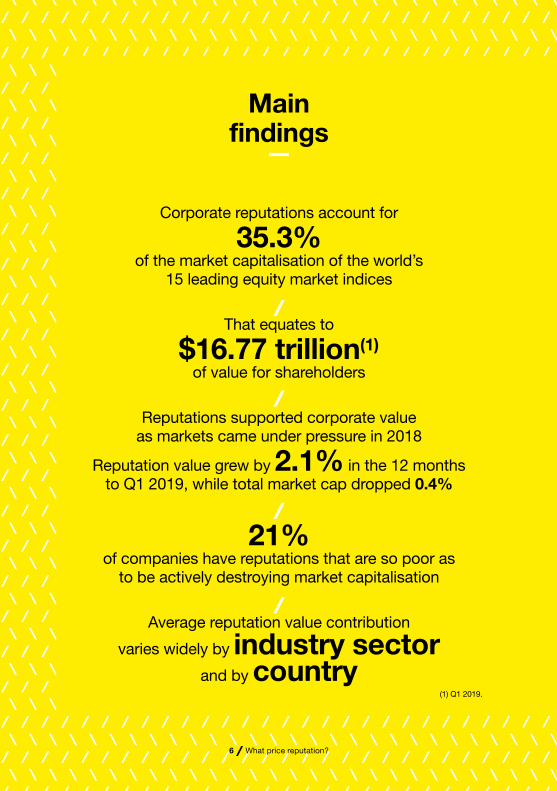
Corporate reputations account for
35.3%of the market capitalisation of the world’s
15 leading equity market indices
That equates to
$16.77 trillion(1)
of value for shareholders
Reputations supported corporate valueas markets came under pressure in 2018
Reputation value grew by 2.1% in the 12 months to Q1 2019, while total market cap dropped 0.4%
21%of companies have reputations that are so poor as
to be actively destroying market capitalisation
Average reputation value contribution
varies widely by industry sector
and by country
Mainfindings
—
6 What price reputation?
(1) Q1 2019.
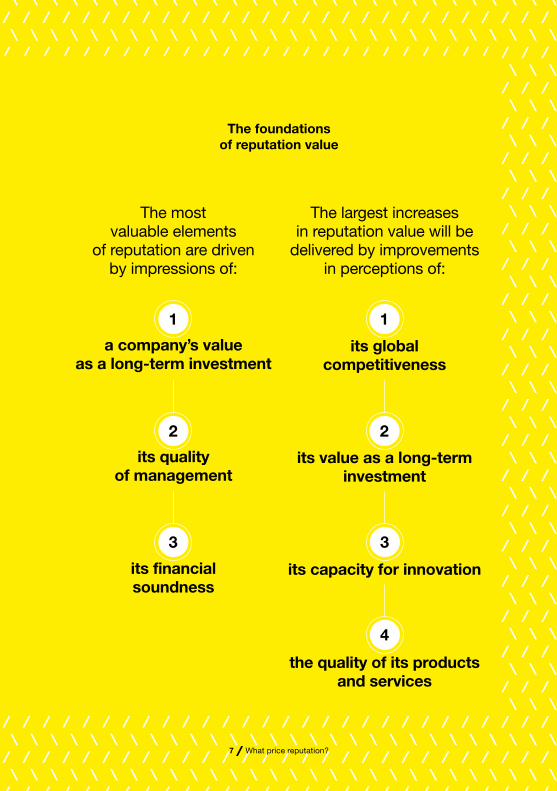
its global competitiveness
its value as a long-term investment
its capacity for innovation
the quality of its products and services
The most valuable elements
of reputation are driven by impressions of:
The largest increases in reputation value will be
delivered by improvements in perceptions of:
a company’s valueas a long-term investment
its qualityof management
its financialsoundness
1 1
2 2
3 3
4
The foundations of reputation value
7 What price reputation?
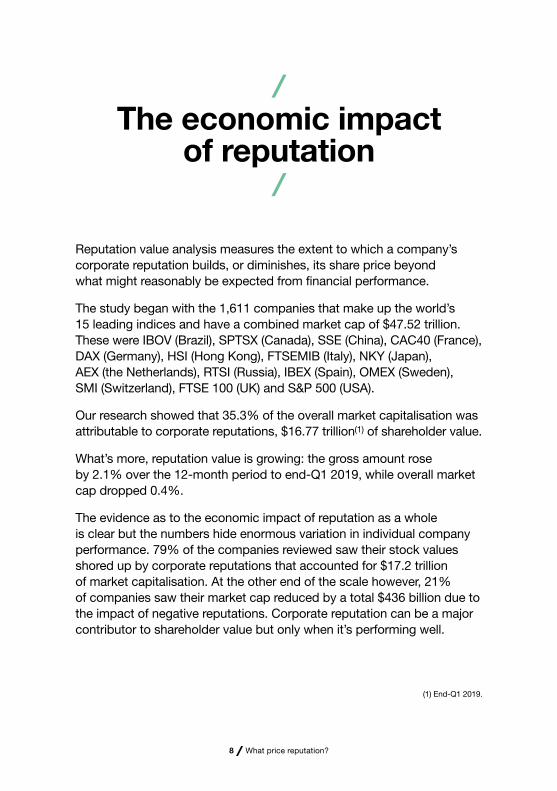
Reputation value analysis measures the extent to which a company’s corporate reputation builds, or diminishes, its share price beyond what might reasonably be expected from financial performance.
The study began with the 1,611 companies that make up the world’s 15 leading indices and have a combined market cap of $47.52 trillion. These were IBOV (Brazil), SPTSX (Canada), SSE (China), CAC40 (France), DAX (Germany), HSI (Hong Kong), FTSEMIB (Italy), NKY (Japan), AEX (the Netherlands), RTSI (Russia), IBEX (Spain), OMEX (Sweden), SMI (Switzerland), FTSE 100 (UK) and S&P 500 (USA).
Our research showed that 35.3% of the overall market capitalisation was attributable to corporate reputations, $16.77 trillion(1) of shareholder value.
What’s more, reputation value is growing: the gross amount rose by 2.1% over the 12-month period to end-Q1 2019, while overall market cap dropped 0.4%.
The evidence as to the economic impact of reputation as a whole is clear but the numbers hide enormous variation in individual company performance. 79% of the companies reviewed saw their stock values shored up by corporate reputations that accounted for $17.2 trillion of market capitalisation. At the other end of the scale however, 21% of companies saw their market cap reduced by a total $436 billion due to the impact of negative reputations. Corporate reputation can be a major contributor to shareholder value but only when it’s performing well.
The economic impact of reputation
8 What price reputation?
(1) End-Q1 2019.

9 What price reputation?
60 —
40 —
20 —
0 —
–20 —
–40 —
–60 —
21% of companies destroying $436(1) billion of shareholder value
Reputation contributions across the 15 leading equity markets
% o
f m
arke
t ca
p a
ttri
but
able
to
rep
utat
ion
79% of companies creating
$17,205(1) billion of shareholder value
9 What price reputation?

Reputation impact is by no means uniformly distributed and individual company reputations contribute value to very different degrees in different geographies. The mix of company profiles, the number of companies in the index and domestic conditions result in a wide spread of reputation contributions to stock market valuations around the world.
These ranged from an average of 47% across the UK’s FTSE 100, down to 14% in the Russian market’s RTSI index. Corporate visibility, global operations and familiarity are breeding higher degrees of banked reputational goodwill compared with companies in regions where the support provided by effective corporate reputations continues to be trumped by a need for harder evidence.
Other national indices with higher than average reputation contributions included the Dutch AEX, Switzerland’s SMI, Germany’s DAX, the US S&P, France’s CAC, Sweden’s OMEX and Hong Kong’s HSI.
Indices with lower than average reputation contributions were Spain’s IBEX, Japan’s Nikkei, Canada’s SPTSX, China’s SSE, Brazil’s IBOV and Italy’s MIB.
Reputation performance by market reveals that while the average contribution varies substantially, high performance is less spread out. Whereas average contributions range 33 percentage points (from 47% down to 14%), “top performance” ranges just 17 percentage points (from 56% down to 39%). While country difference is driven in part by the number of constituents in the index – with the larger indices including proportionately more smaller companies, often with lower contributions – it is clear from the scale of the spread that there is considerable value growth to be had by companies deploying appropriate reputation stewardship.
Countryfocus
10 What price reputation?

UK
(FTS
E10
0)
Th
e N
eth
erla
nd
s (A
EX
)
Sw
itze
rlan
d (S
MI)
Ger
man
y (D
AX
)
US
A (S
&P
500
)
Fra
nce
(CA
C)
Sw
eden
(OM
EX
)
Ho
ng
Ko
ng
(HS
I)
Sp
ain
(IB
EX
)
Can
ada
(SP
TSX
)
Bra
zil (
IBO
V)
Jap
an (N
KY
)
Ch
ina
(SS
E)
Ital
y (F
TSE
MIB
)
Ru
ssia
(RTS
I)
Average
60 —
40 —
20 —
0 —
–20 —
–40 —
–60 —
% o
f m
arke
t ca
p a
ttri
but
able
to
rep
utat
ion
Reputation contribution range by equity market Highest, lowest and average
11 What price reputation?

The average contribution of corporate reputation to market cap varies widely across industry sectors, with “new economy” companies displaying the greatest value in their good names.
The study shows that corporate reputations are contributing more value to companies in “high future-potential” sectors such as technology, telecom and healthcare, compared to more immediately predictable sectors like oil & gas, basic materials, industrials or utilities.
Technology companies enjoyed an average reputation of 43% over the value implied by financial metrics alone. Other sectors with a reputation contribution above average were telecommunications (39%), healthcare (39%), consumer goods (38%) and consumer services (36%).
At the other end of the scale, utilities saw their stock market capitalisations boosted just 25% on average by reputations operating well below the 35.3% average. Other sectors below the overall average were oil & gas (32%), basic materials (29%) and industrials (28%).
These industry averages provide an important benchmark for the analysis of individual companies’ reputations. By comparing a company’s reputation contribution to its industry average, executives at lower-ranked companies can now assess the realistic value growth opportunities to be had by improving their group’s reputation to the broader industry standard or, indeed, beyond.
Conversely, for those companies which today enjoy a reputation contribution above the industry norm, it highlights the value at risk if it were to come under pressure or slip.
Industryfocus
12 What price reputation?

43.0% Technology
Average
35.3%
Tech
no
log
y
Tele
com
mu
nic
atio
ns
Hea
lth
car
e
Co
nsu
mer
go
od
s
Co
nsu
mer
ser
vice
s
Fin
anci
als
Oil
& g
as
Bas
ic m
ater
ials
Ind
ust
rial
s
Uti
litie
s25
.2%
43.0
%
45 —
40 —
35 —
30 —
25 —
20 —
15 —
10 —
5 —
0 —
% o
f g
ross
mar
ket
cap
Average reputation contribution (market cap weighted)
13 What price reputation?

14 What price reputation?
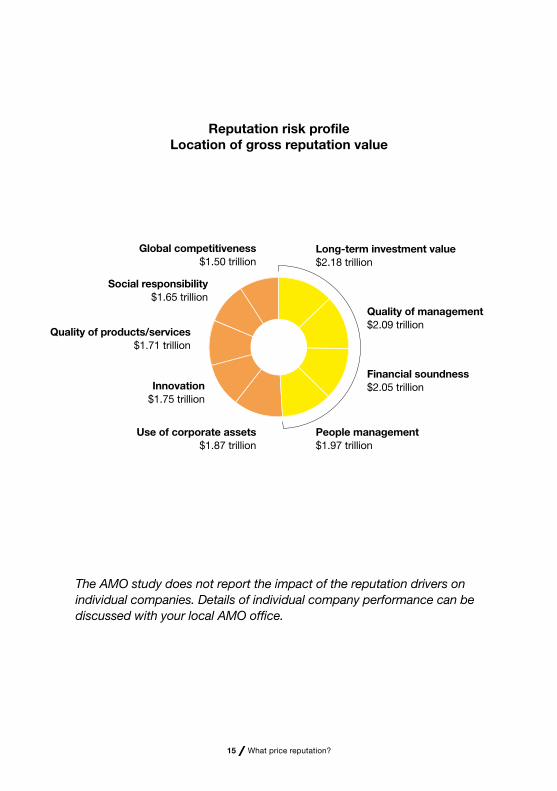
Reputation value, calculated as the extent to which a company’s corporate reputation builds, or diminishes, its share price beyond what might reasonably be expected from financial performance, is driven by impressions of different reputational factors.
To assess their impact, the AMO study applied the nine criteria found in Fortune magazine’s annual “Most Admired Companies” survey to calculate their economic contribution. From there we compiled the overall reputation risk profile by analysing the perceptions of the 324 companies in the Fortune list which appear in the 15 national blue-chip equity indices. Those companies had a combined market cap of $20.53 trillion, 43% (by value) of the 1,611 companies included in the review.
The results of the reputation risk profile were extrapolated across the full universe to show two things:
• the reputation driver contribution – the stock market value delivered by each separate headline component of reputation across the universe of companies reviewed;
• the reputation leverage – the extent to which improvements in perceptions of the separate reputation drivers deliver increases in market cap.
Reputationdrivers
15 What price reputation?
Innovation$1.75 trillion
Use of corporate assets$1.87 trillion
Quality of management$2.09 trillion
Financial soundness$2.05 trillion
People management$1.97 trillion
Long-term investment value$2.18 trillion
Quality of products/services$1.71 trillion
Social responsibility$1.65 trillion
Global competitiveness$1.50 trillion
The AMO study does not report the impact of the reputation drivers on individual companies. Details of individual company performance can be discussed with your local AMO office.
Reputation risk profileLocation of gross reputation value

16 What price reputation?
Leveraging corporate reputation for value growth
The greatest opportunities for the most effective reputation value management are to be found in aligning the sources of highest reputation contribution extant with the factors that can leverage the largest gains in value tomorrow.
Companies can achieve disproportionate impact by changing perceptions in just a small number of reputation drivers, obtaining higher returns on communications investment. The “average” company displaying an average reputation value driver profile needs to balance communications to support reputation value already created – high current value contributors – with the most productive sources of growth – high value potential. Top of the list is enhancing perceptions related to “long-term investment potential”. This is the driver which ranks highest as a value contributor and also offers significant leverage potential. Beyond that, the “average” company would need to ensure that strengths in impressions of management prowess, people management and financial soundness are maintained while tapping into the opportunities presented by improving perceptions of global competitiveness and innovation. Conversely, while seemingly unproductive factors such as CSR characteristics currently rank as low contributors with limited leverage potential, they can undoubtedly have sufficient impact to make their presence in corporate communications and messaging highly opportune.

Reputation value driver impact(all company average)
Innovation
High current value contributors
13% —
12% —
11% —
10% —
9% —
8% —
7% —
% o
f mar
ket
cap
att
rib
utab
le t
o re
put
atio
n
People management
Quality of management
Financial soundness
Use ofcorporate
assets
Social responsibility
Long-term investment value
Global competitiveness
Quality of product/services
0.3% 0.4% 0.5% 0.6% 0.7% 0.8% 0.9%
Factor Leverage – growth potential(1)
(1) Market cap growth corresponding to a 5% rise in factor perceptions.
High growth potential
17 What price reputation?
Local expertise, global reach
AMO is the leading international network of strategic advisory and communications consultancies, providing best-in-class financial communications advice for corporations and institutions in the most important markets around the globe.
We provide thoughtful counsel to corporate boards and executives. Our mission is to help them achieve critical business goals through our powerful influence in local markets, our deep sector expertise, our broad global perspective and our ability to collectively provide seamless project management to our clients around the world, particularly in the key financial centres of Europe, Asia and the Americas.Our best-in-class approach brings together local-market leaders with unrivalled knowledge of stakeholder perceptions, financial markets and transformative company events, ranging from cross-border transactions, large-scale crises, activist situations, and regulatory matters to bankruptcy and restructuring situations.
AMO is unique among international networks because it is founded on the strength of a partnership between national local agencies, each best-in-class in their markets, that has produced meaningful results for its clients since AMO was founded in 2001. The AMO network has consistently featured at the top of the global M&A advisory rankings over the last fifteen years. In 2018, AMO agencies advised on almost 300 M&A deals worth approximately €240 billion.
AMO is backed by Havas, one of the world’s largest global communications groups, founded in 1835 in Paris.
The AMO network
—
18 What price reputation?
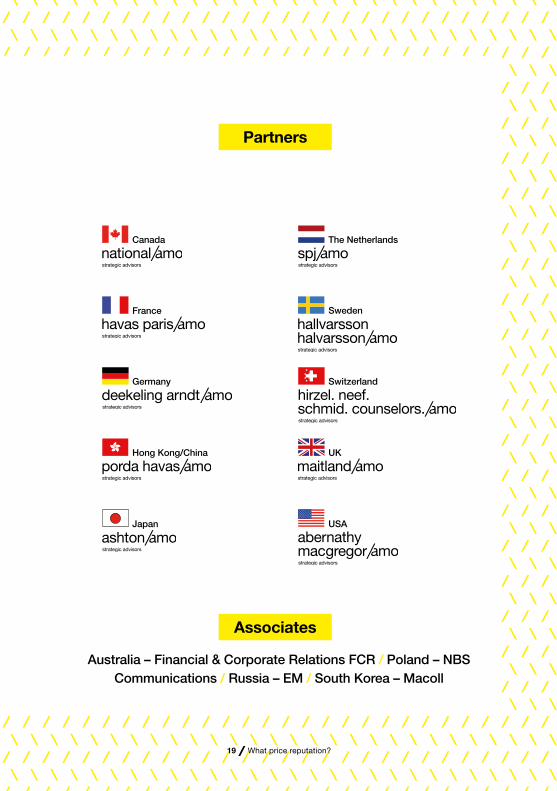
Australia – Financial & Corporate Relations FCR / Poland – NBS Communications / Russia – EM / South Korea – Macoll
Associates
Partners
19 What price reputation?
Canada
France
Germany
Hong Kong/China
Japan
The Netherlands
Sweden
Switzerland
USA
UK

20 What price reputation?
Simon Cole is the founder and director of Reputation Dividend, an independent corporate reputation and brand research
consultancy specialising in economic reputation analytics.
After training as a mathematician and economist, Simon spent nearly thirty years in brand, advertising and communications consultancy. In the course of that time, he has worked
for many of the world’s leading brand owners in the UK, Europe,
and the Americas.
His specialisation in corporate brand planning and analytics led him
to develop Reputation Dividend in 2009 to better serve the increasing needs for greater objectivity in reputation
management and connectivity with wider brand management.
Aboutthe author
—

Contacts
Charles Fleming Chief Marketing Officer AMO [email protected] +33 6 14 45 05 22
Simon Cole Founding PartnerReputation [email protected]