Embed Size (px)
Citation preview

WGBH template – Arial 40Month Day, Year – Arial 24
Strictly Confidential
Sample transition slide – arial 32
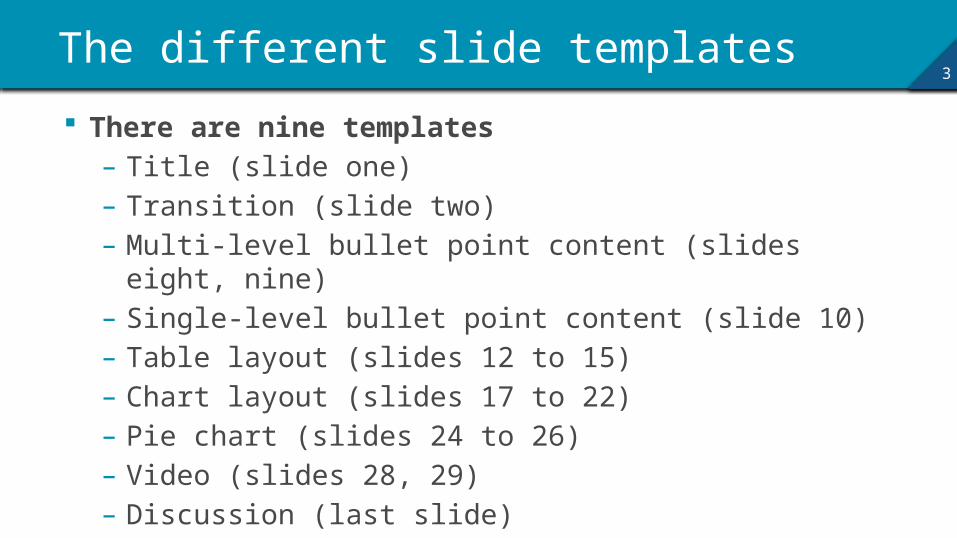
3The different slide templates
There are nine templates– Title (slide one)– Transition (slide two)– Multi-level bullet point content (slides eight, nine)– Single-level bullet point content (slide 10)– Table layout (slides 12 to 15)– Chart layout (slides 17 to 22)– Pie chart (slides 24 to 26)– Video (slides 28, 29)– Discussion (last slide)
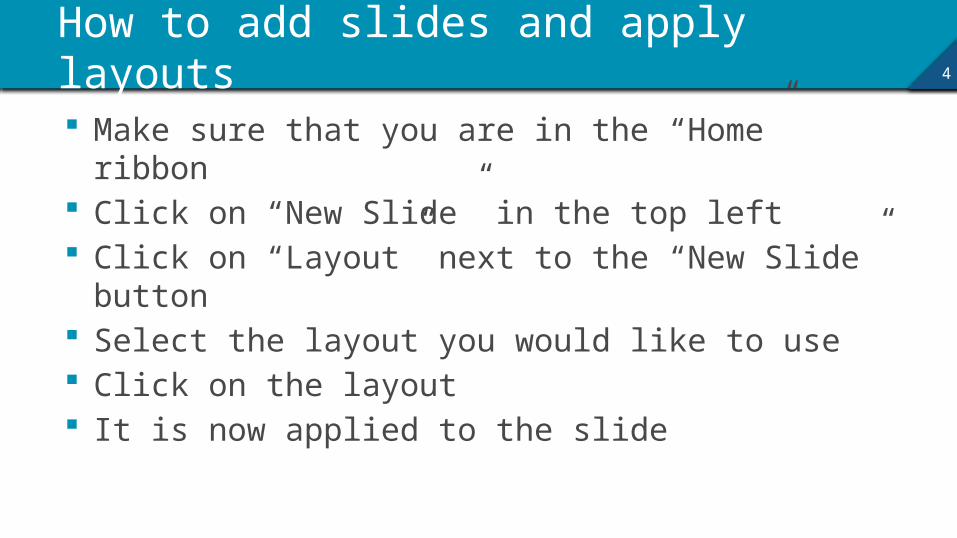
4How to add slides and apply layouts
Make sure that you are in the “Home” ribbon Click on “New Slide” in the top left Click on “Layout” next to the “New Slide” button Select the layout you would like to use Click on the layout It is now applied to the slide

Agenda example
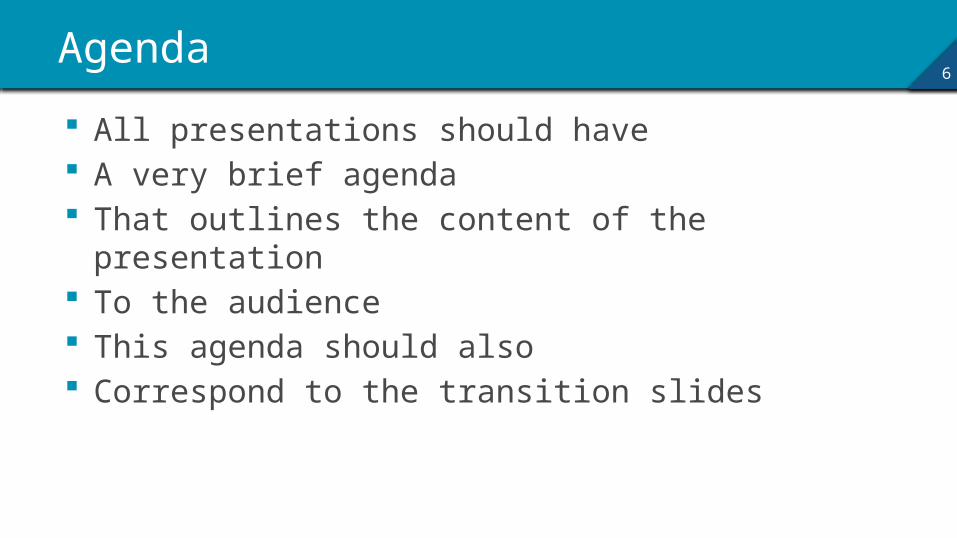
6Agenda
All presentations should have A very brief agenda That outlines the content of the presentation To the audience This agenda should also Correspond to the transition slides

Text and bullet points
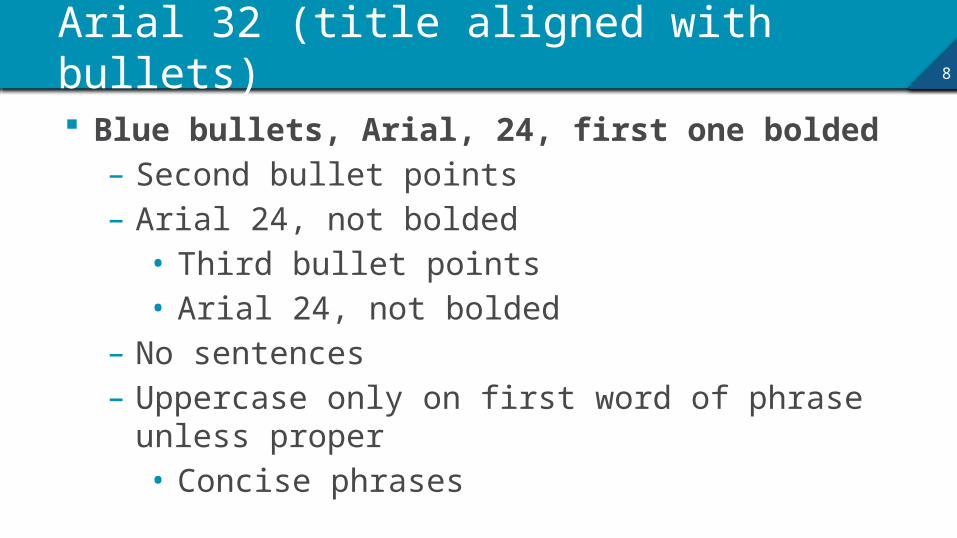
8Arial 32 (title aligned with bullets)
Blue bullets, Arial, 24, first one bolded– Second bullet points– Arial 24, not bolded
• Third bullet points• Arial 24, not bolded
– No sentences– Uppercase only on first word of phrase unless proper
• Concise phrases
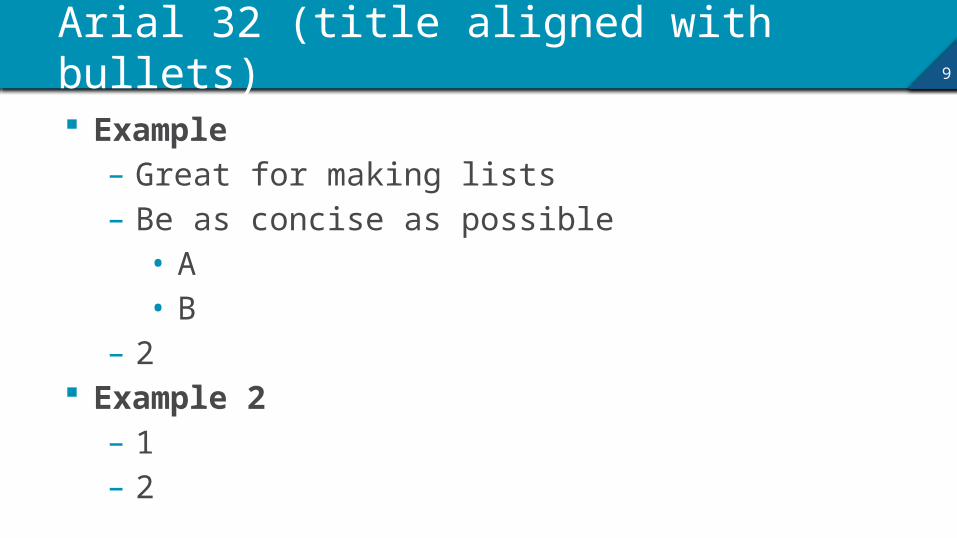
9Arial 32 (title aligned with bullets)
Example– Great for making lists– Be as concise as possible
• A• B
– 2 Example 2
– 1– 2
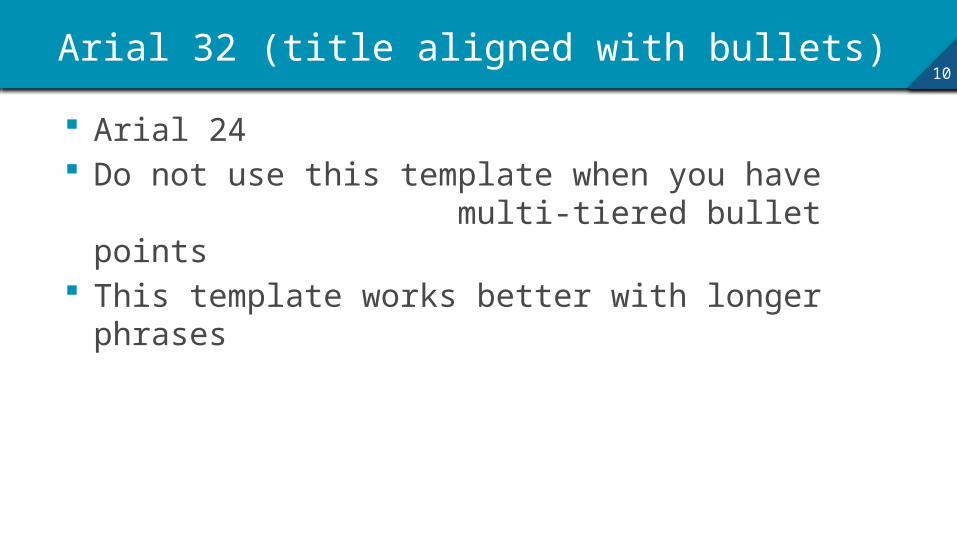
10Arial 32 (title aligned with bullets)
Arial 24 Do not use this template when you have
multi-tiered bullet points This template works better with longer phrases
Tables
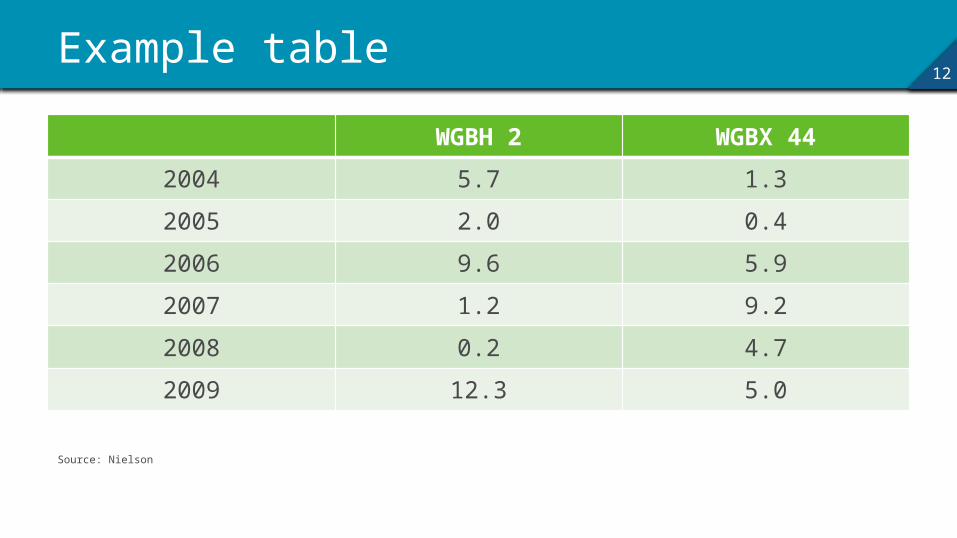
12Example table
WGBH 2 WGBX 44
2004 5.7 1.3
2005 2.0 0.4
2006 9.6 5.9
2007 1.2 9.2
2008 0.2 4.7
2009 12.3 5.0
Source: Nielson
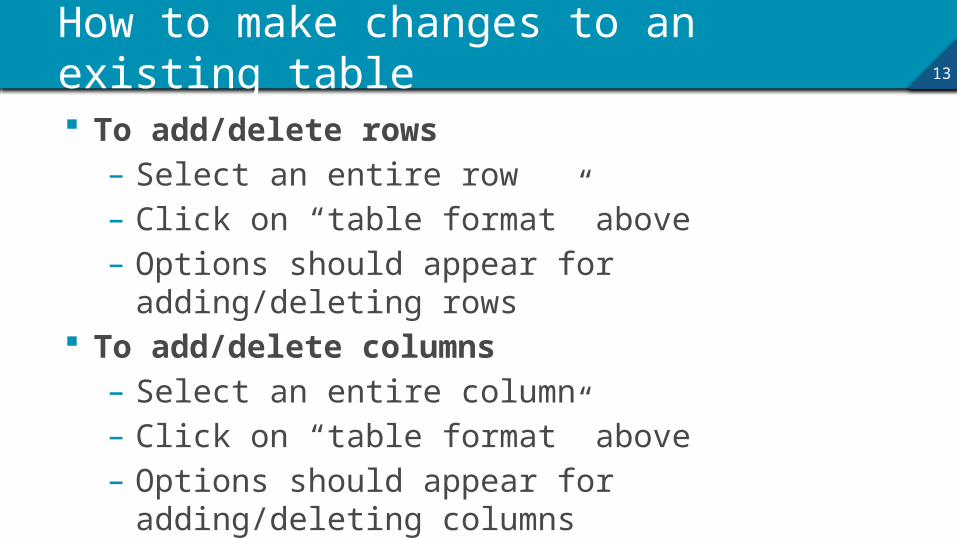
13How to make changes to an existing table
To add/delete rows– Select an entire row– Click on “table format” above– Options should appear for adding/deleting rows
To add/delete columns– Select an entire column– Click on “table format” above– Options should appear for adding/deleting columns
14If you want to create a table from scratch
Source: this is where you add the source for the table. Arial 8.
15Adding a table from scratch
Click on icon to get started Select how many rows and columns you need Input your data If you need to adjust the amount of rows and
columns, follow slide 13 For all tables, use the green table style located
on slide 12

Graphs: lines and bars
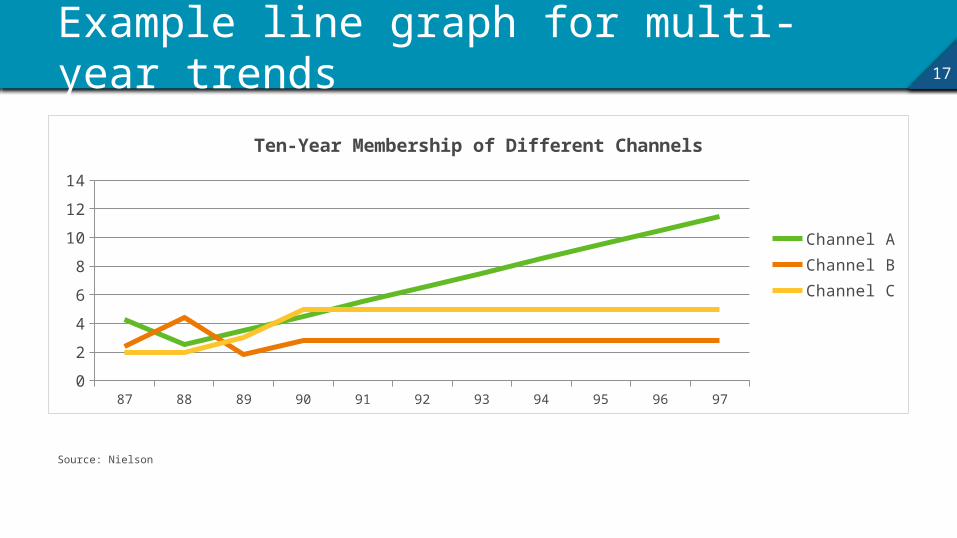
17Example line graph for multi-year trends
Source: Nielson
87 88 89 90 91 92 93 94 95 96 970
2
4
6
8
10
12
14
Ten-Year Membership of Different Channels
Channel AChannel BChannel C
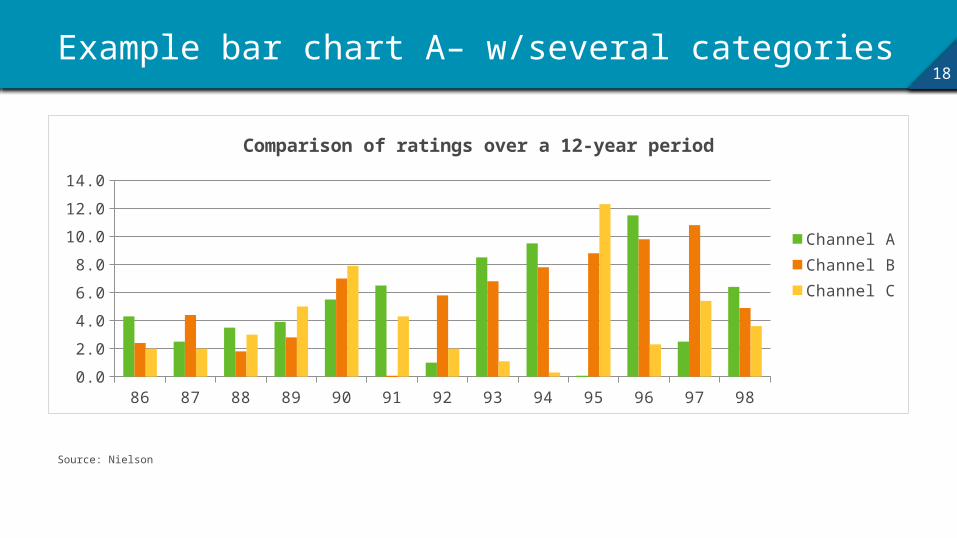
18Example bar chart A– w/several categories
Source: Nielson
86 87 88 89 90 91 92 93 94 95 96 97 980.0
2.0
4.0
6.0
8.0
10.0
12.0
14.0
Comparison of ratings over a 12-year period
Channel AChannel BChannel C
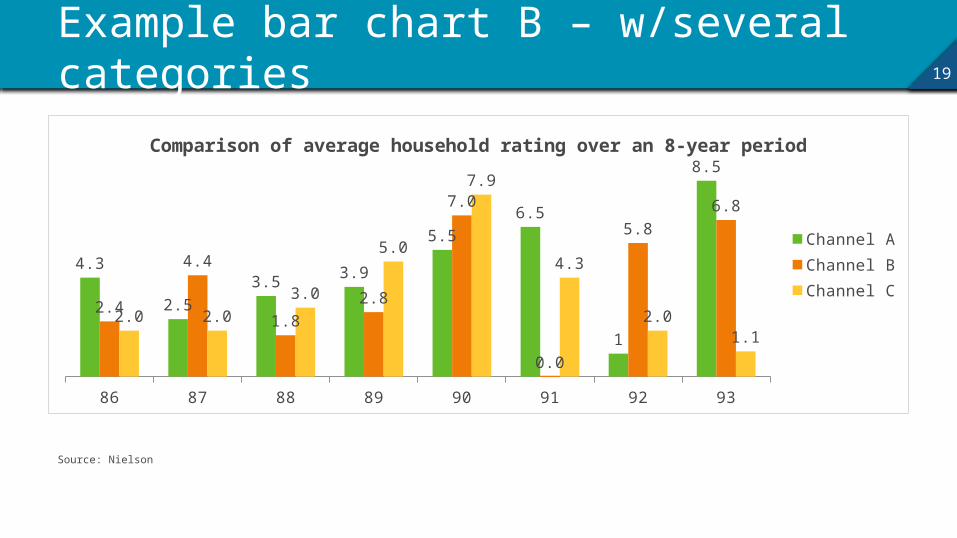
19Example bar chart B – w/several categories
Source: Nielson
86 87 88 89 90 91 92 93
4.3
2.5
3.53.9
5.5
6.5
1
8.5
2.4
4.4
1.8
2.8
7.0
0.0
5.8
6.8
2.0 2.0
3.0
5.0
7.9
4.3
2.01.1
Comparison of average household rating over an 8-year period
Channel AChannel BChannel C
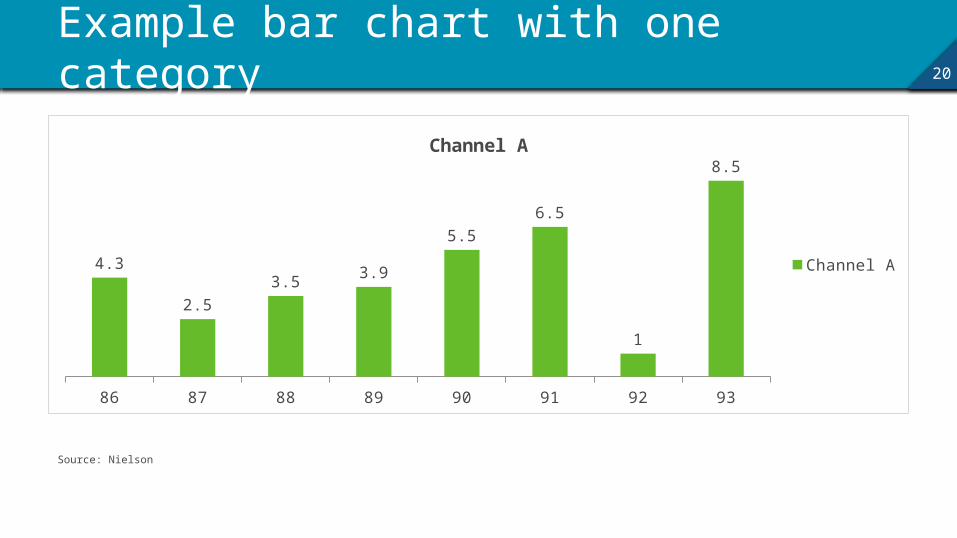
20Example bar chart with one category
Source: Nielson
86 87 88 89 90 91 92 93
4.3
2.5
3.53.9
5.5
6.5
1
8.5Channel A
Channel A
21To add a chart from scratch
Source: Arial 8.
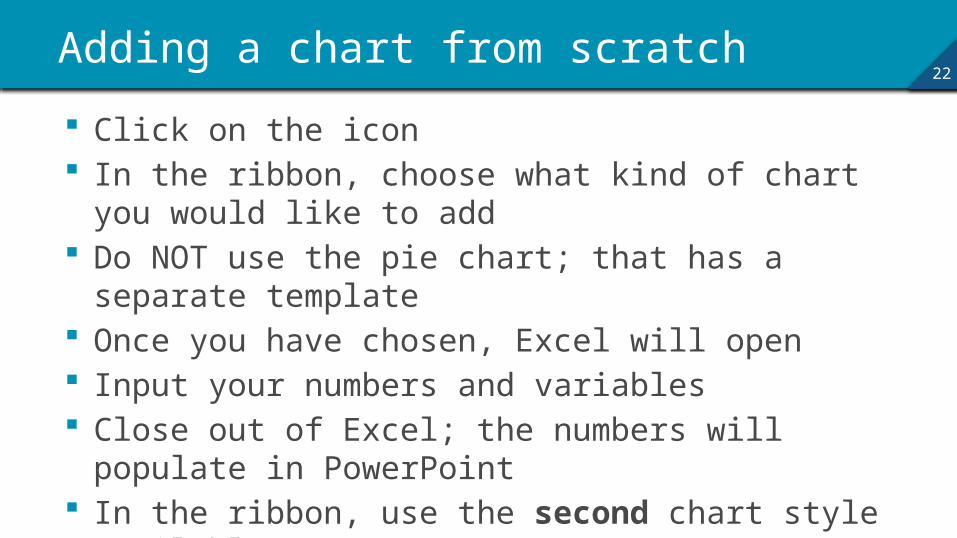
22Adding a chart from scratch
Click on the icon In the ribbon, choose what kind of chart you would like to
add Do NOT use the pie chart; that has a separate template Once you have chosen, Excel will open Input your numbers and variables Close out of Excel; the numbers will populate in
PowerPoint In the ribbon, use the second chart style available

Pie Charts
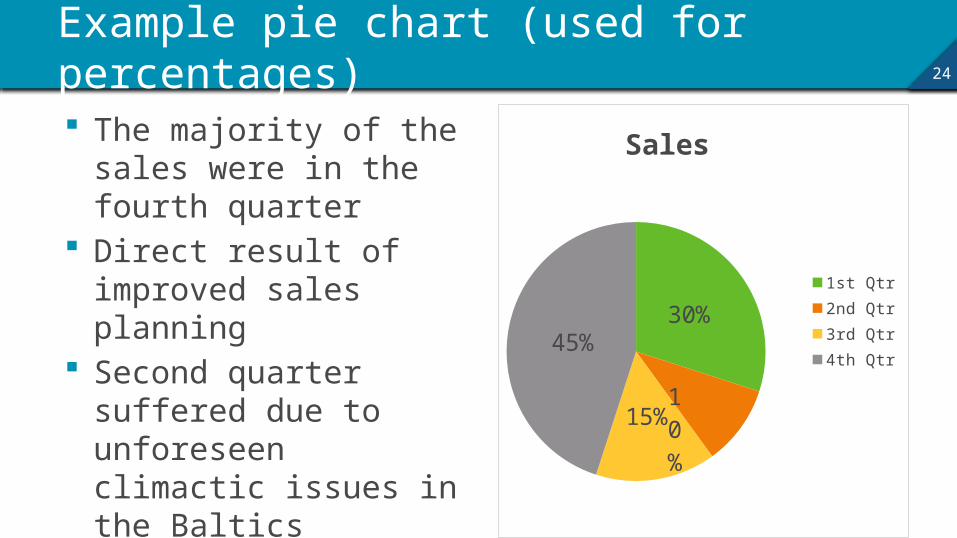
24Example pie chart (used for percentages)
The majority of the sales were in the fourth quarter
Direct result of improved sales planning
Second quarter suffered due to unforeseen climactic issues in the Baltics
30%
10%
15%
45%
Sales
1st Qtr2nd Qtr3rd Qtr4th Qtr
25If you want to add your own pie chart
26How to add your own pie chart
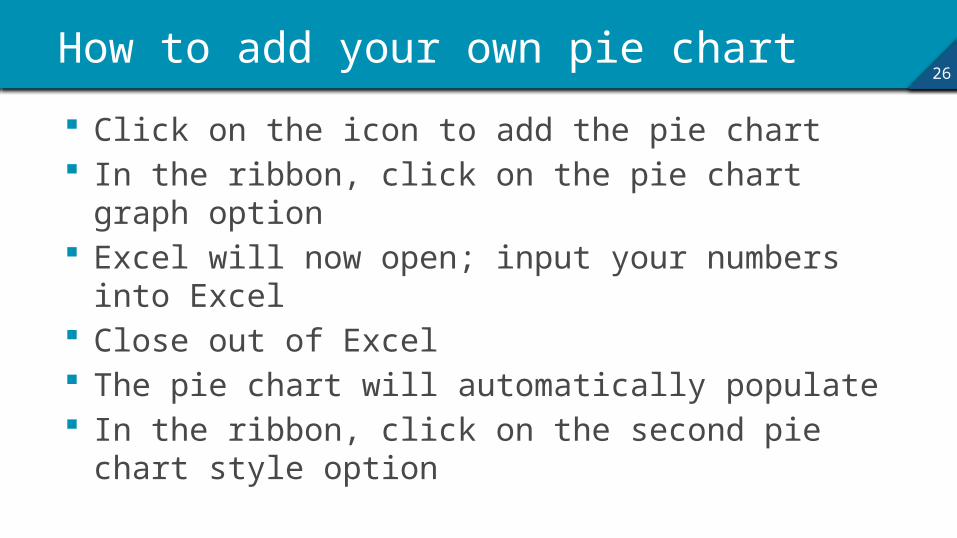
Click on the icon to add the pie chart In the ribbon, click on the pie chart graph option Excel will now open; input your numbers into Excel Close out of Excel The pie chart will automatically populate In the ribbon, click on the second pie chart style option

Embedded Videos
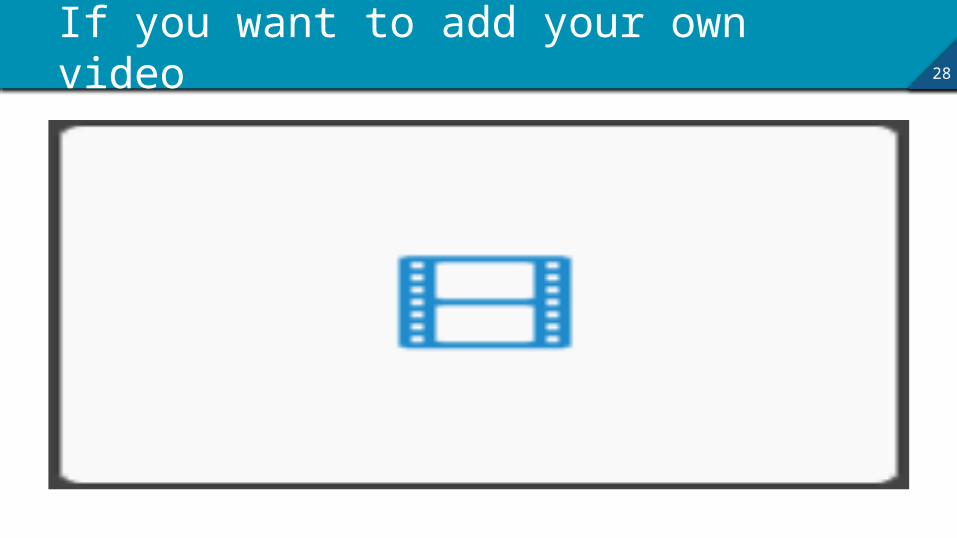
28If you want to add your own video
29How to add your own video
Click on the icon Find and select the video you want to embed It will automatically populate in the slide One note: Make sure that the video remains in the same
location. Otherwise, PowerPoint will not be able to find it, and you will not be able to play your video.

Discussion