Embed Size (px)
Citation preview
WG2: Evaluation of the Current Trends of Agroclimatic Indices and Simulation Model
Outputs describing Agricultural Impacts and Hazard Levels
Summary of the WG2 questionnaire
Vesselin Alexandrov
Larissa, 2008
WG2 REPORT STRUCTURE
1. COST 734 WG2: TASKS, RESPONSIBILITIES, ACTIVITIES AND DELIVERABLES
Key deliverables of WG2 • a collection of climatic data for several European
regions according to agroclimatic indices, simulation models and hazards;
• verification of data and solving of problems arising from missing, non-homogeneous and erroneous data;
• assessment of required resolution for practical agroclimatological applications as a function of variables, areas and agricultural aspects;
• definition of statistical protocols to analyse the climatic series, in order to evaluate mean and variability patterns;
• determination of current trend of agroclimatic indices, simulation model outputs and hazards;
• determination of interannual variability of agroclimatic conditions
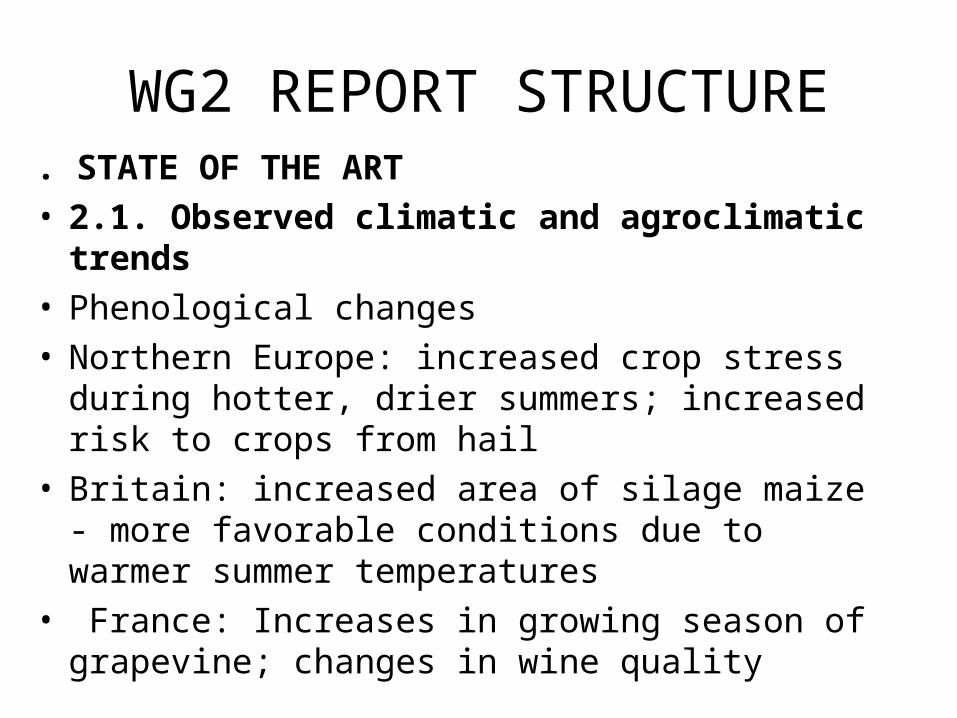
WG2 REPORT STRUCTURE. STATE OF THE ART• 2.1. Observed climatic and agroclimatic trends • Phenological changes• Northern Europe: increased crop stress during
hotter, drier summers; increased risk to crops from hail
• Britain: increased area of silage maize - more favorable conditions due to warmer summer temperatures
• France: Increases in growing season of grapevine; changes in wine quality
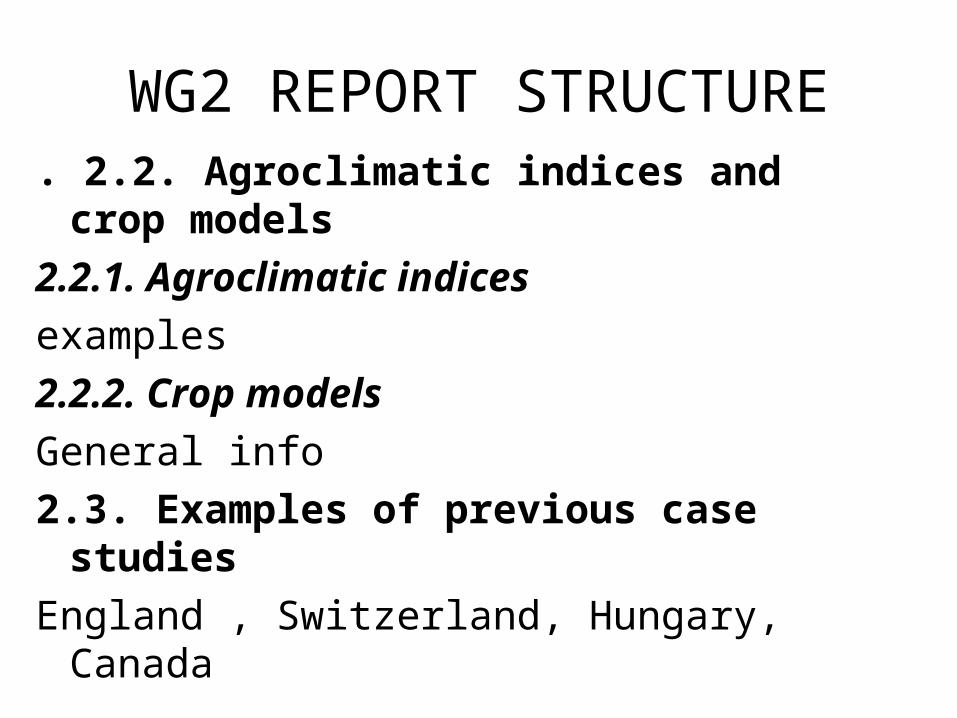
WG2 REPORT STRUCTURE. 2.2. Agroclimatic indices and crop
models
2.2.1. Agroclimatic indices
examples
2.2.2. Crop models
General info
2.3. Examples of previous case studies
England , Switzerland, Hungary, Canada

WG2 REPORT STRUCTURE3. GOAL: A QUESTIONNAIRE
WG2 Trends in Agroclimatic Indices and Model Outputs
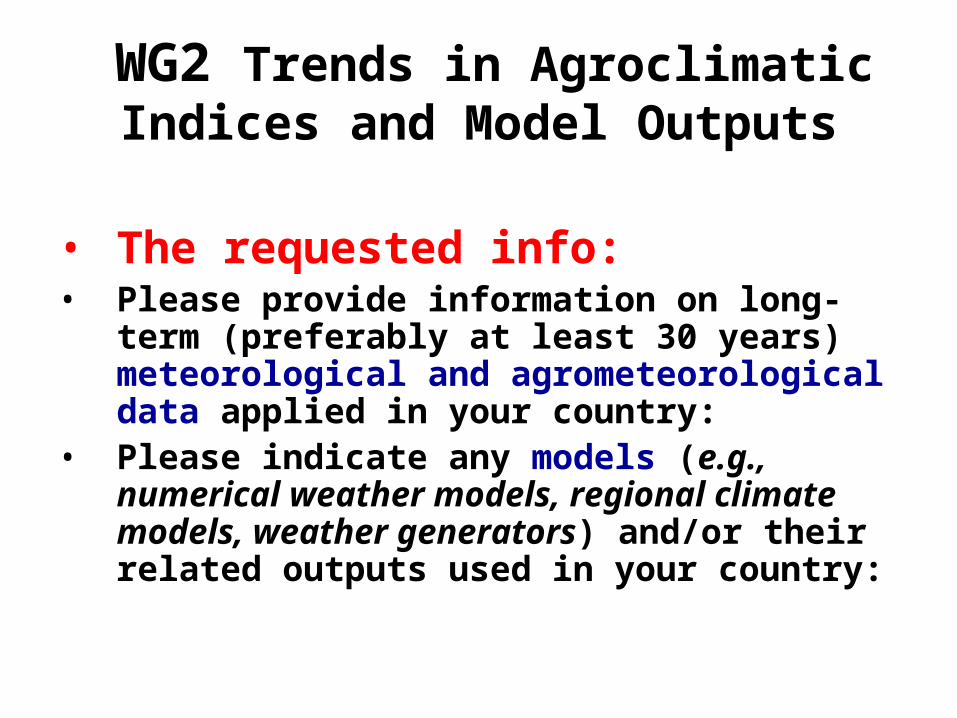
• The requested info:• Please provide information on long-term
(preferably at least 30 years) meteorological and agrometeorological data applied in your country:
• Please indicate any models (e.g., numerical weather models, regional climate models, weather generators) and/or their related outputs used in your country:
WG2 Trends in Agroclimatic Indices and Model Outputs
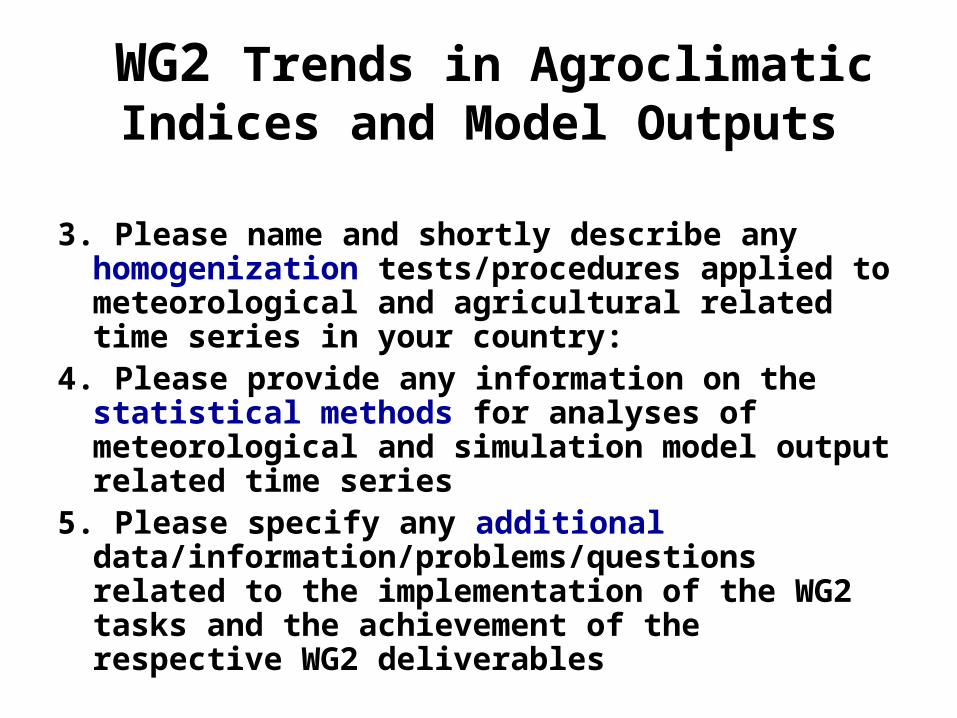
3. Please name and shortly describe any homogenization tests/procedures applied to meteorological and agricultural related time series in your country:
4. Please provide any information on the statistical methods for analyses of meteorological and simulation model output related time series
5. Please specify any additional data/information/problems/questions related to the implementation of the WG2 tasks and the achievement of the respective WG2 deliverables
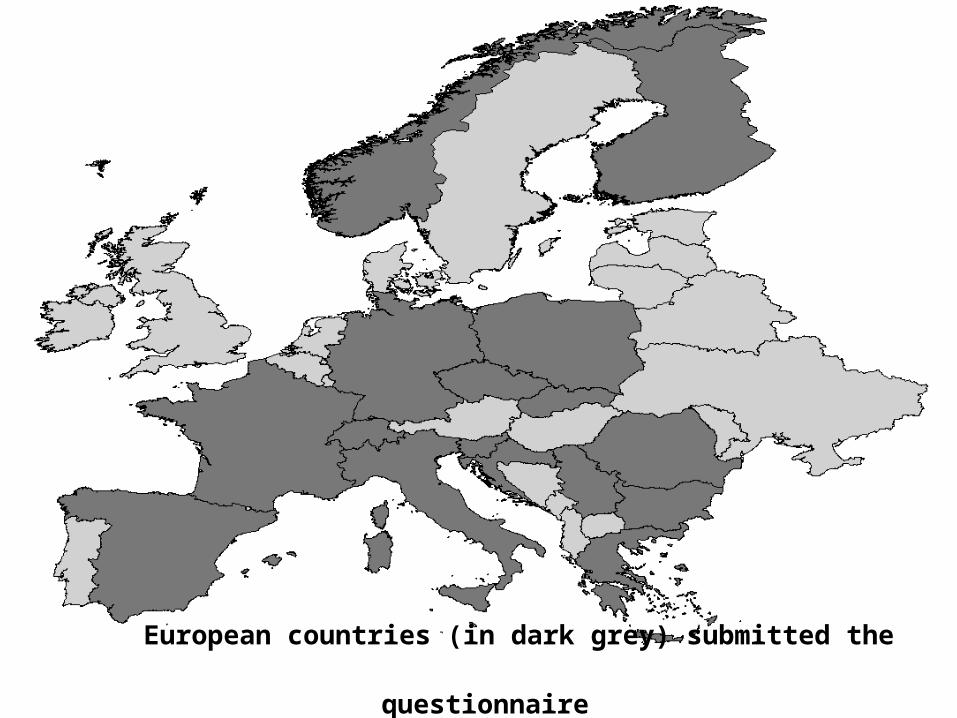
European countries (in dark grey) submitted the questionnaire
WG2 REPORT STRUCTURE• 4. SUMMARIZING THE QUESTIONNAIRE
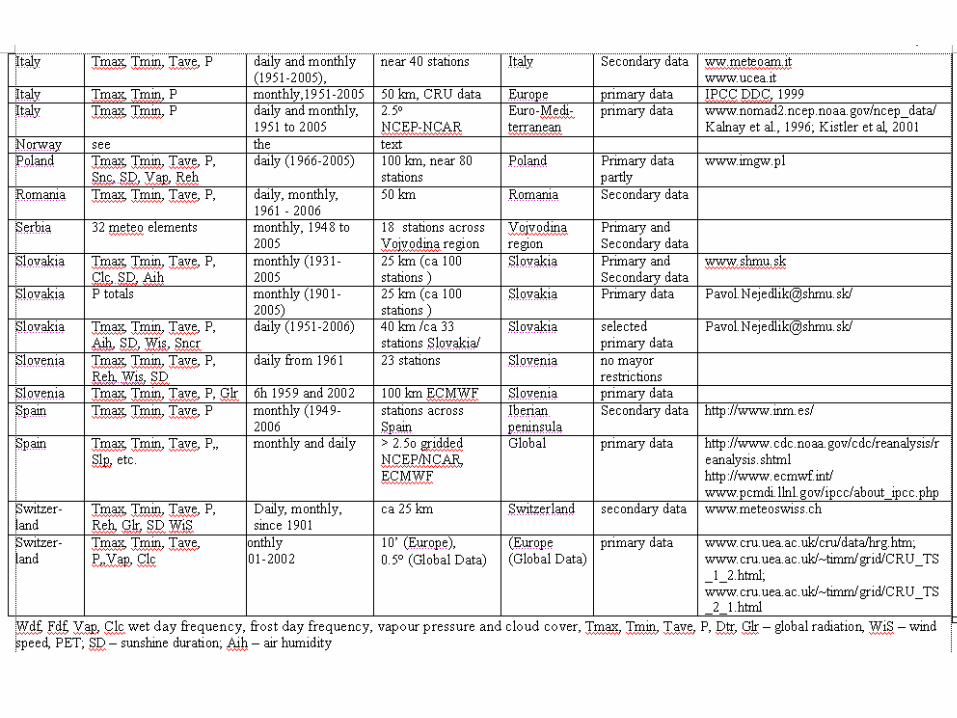
• 4.1. Long-term meteorological and agrometeorological data
• 4.1.1. Long-term meteorological data
• 4.1.1.1. An example from Norway
• 4.1.2. Long-term agrometeorological data
WG2 REPORT STRUCTURE• 4.2. Numerical weather models, regional
climate models, weather generators
• 4.2.1. Numerical weather models
• 4.2.2 Climate models
• 4.2.3. Weather generators
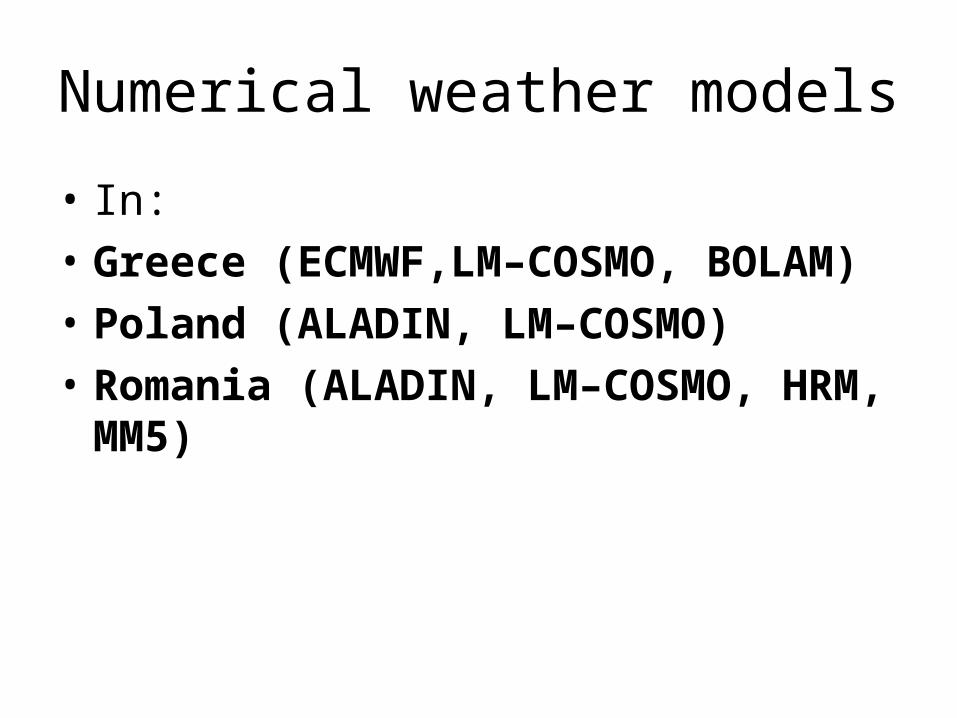
Numerical weather models
• In:
• Greece (ECMWF,LM–COSMO, BOLAM)
• Poland (ALADIN, LM–COSMO)
• Romania (ALADIN, LM–COSMO, HRM, MM5)
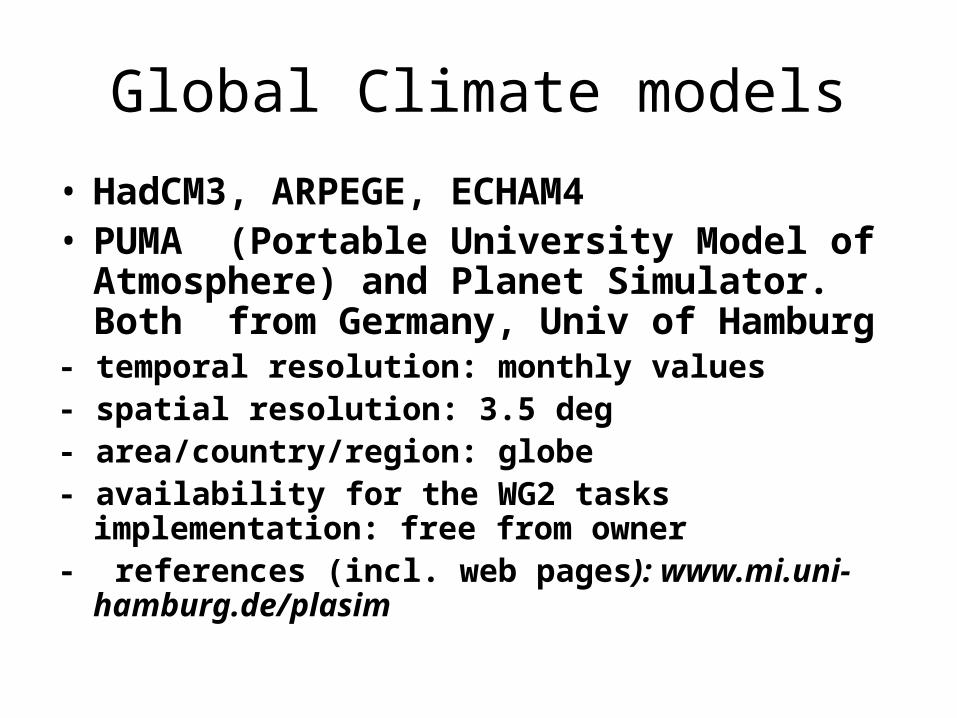
Global Climate models
• HadCM3, ARPEGE, ECHAM4• PUMA (Portable University Model of
Atmosphere) and Planet Simulator. Both from Germany, Univ of Hamburg
- temporal resolution: monthly values- spatial resolution: 3.5 deg - area/country/region: globe- availability for the WG2 tasks implementation: free
from owner- references (incl. web pages): www.mi.uni-
hamburg.de/plasim
Regional climate models
• RegCM3
• MM5
• ALADIN
• PRECIS
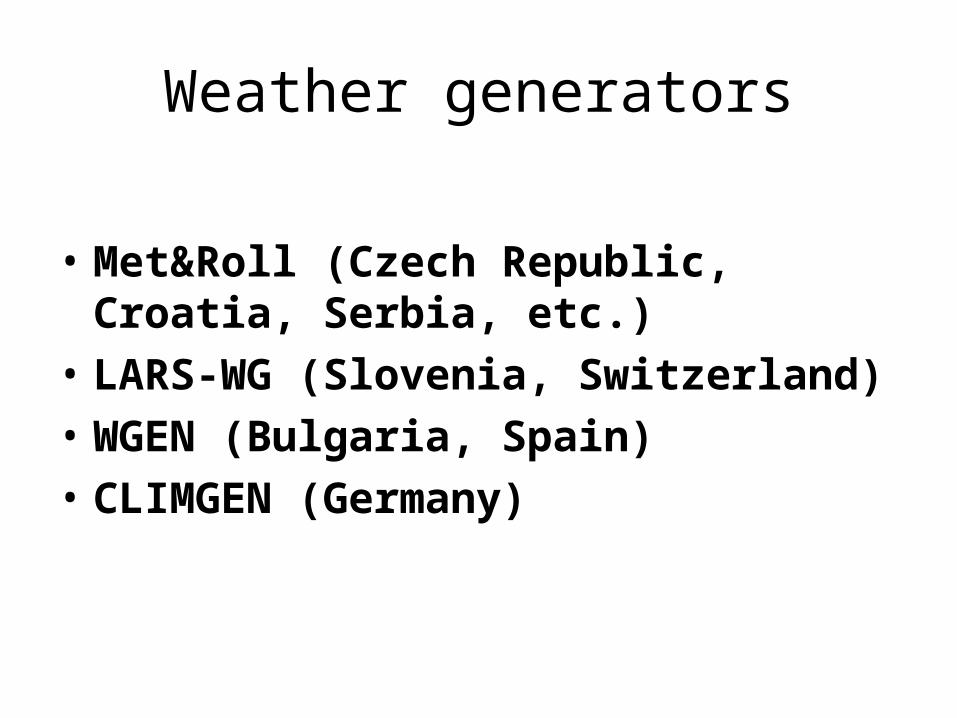
Weather generators
• Met&Roll (Czech Republic, Croatia, Serbia, etc.)
• LARS-WG (Slovenia, Switzerland)
• WGEN (Bulgaria, Spain)
• CLIMGEN (Germany)
WG2 REPORT STRUCTURE• 4.3. Homogenization tests/procedures
homogenization tests/procedures
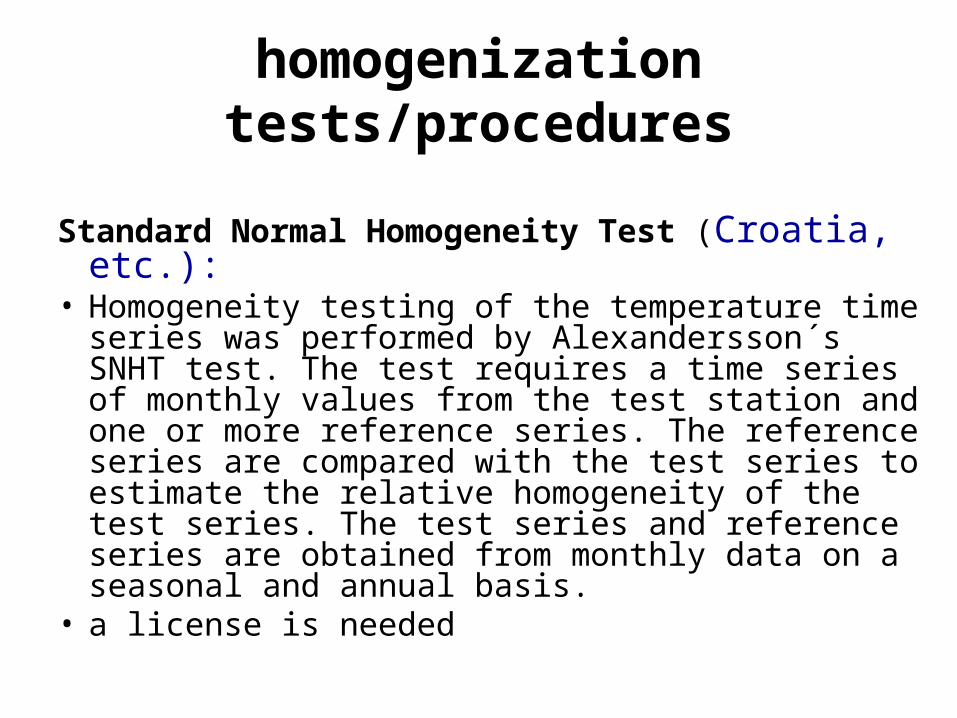
Standard Normal Homogeneity Test (Croatia, etc.):
• Homogeneity testing of the temperature time series was performed by Alexandersson´s SNHT test. The test requires a time series of monthly values from the test station and one or more reference series. The reference series are compared with the test series to estimate the relative homogeneity of the test series. The test series and reference series are obtained from monthly data on a seasonal and annual basis.
• a license is needed
homogenization tests/procedures
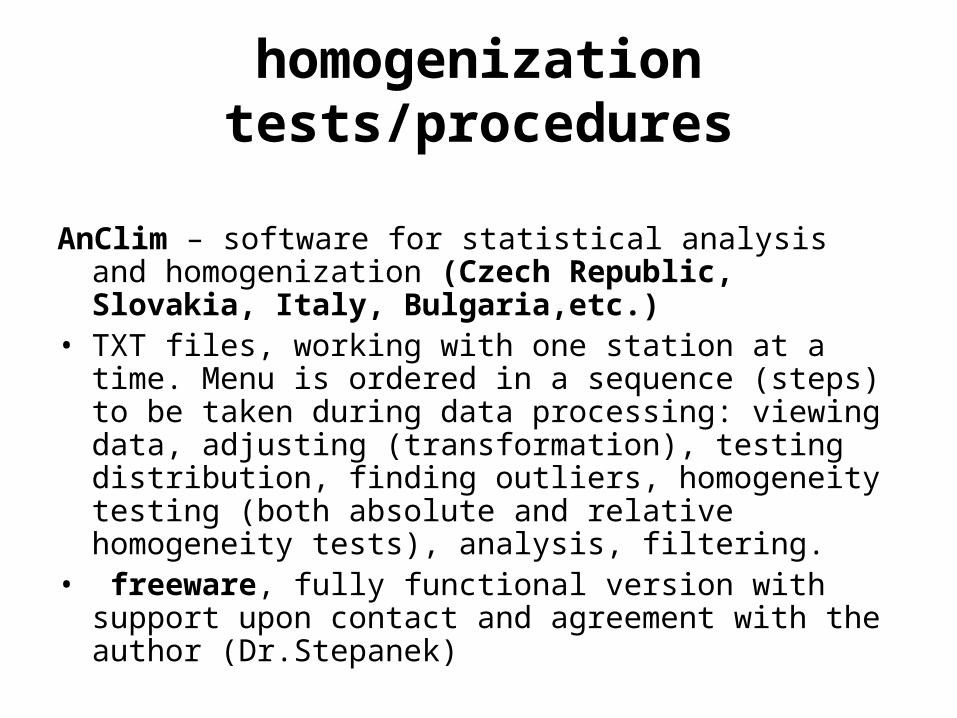
AnClim – software for statistical analysis and homogenization (Czech Republic, Slovakia, Italy, Bulgaria,etc.)
• TXT files, working with one station at a time. Menu is ordered in a sequence (steps) to be taken during data processing: viewing data, adjusting (transformation), testing distribution, finding outliers, homogeneity testing (both absolute and relative homogeneity tests), analysis, filtering.
• freeware, fully functional version with support upon contact and agreement with the author (Dr.Stepanek)
homogenization tests/procedures
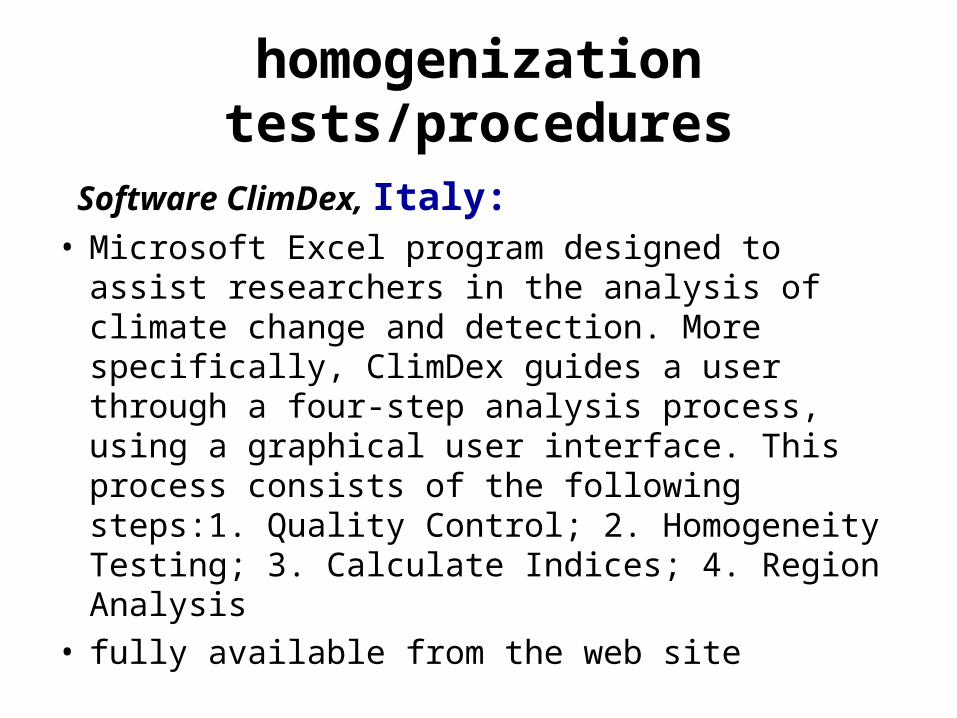
Software ClimDex, Italy:• Microsoft Excel program designed to assist
researchers in the analysis of climate change and detection. More specifically, ClimDex guides a user through a four-step analysis process, using a graphical user interface. This process consists of the following steps:1. Quality Control; 2. Homogeneity Testing; 3. Calculate Indices; 4. Region Analysis
• fully available from the web site
homogenization tests/procedures
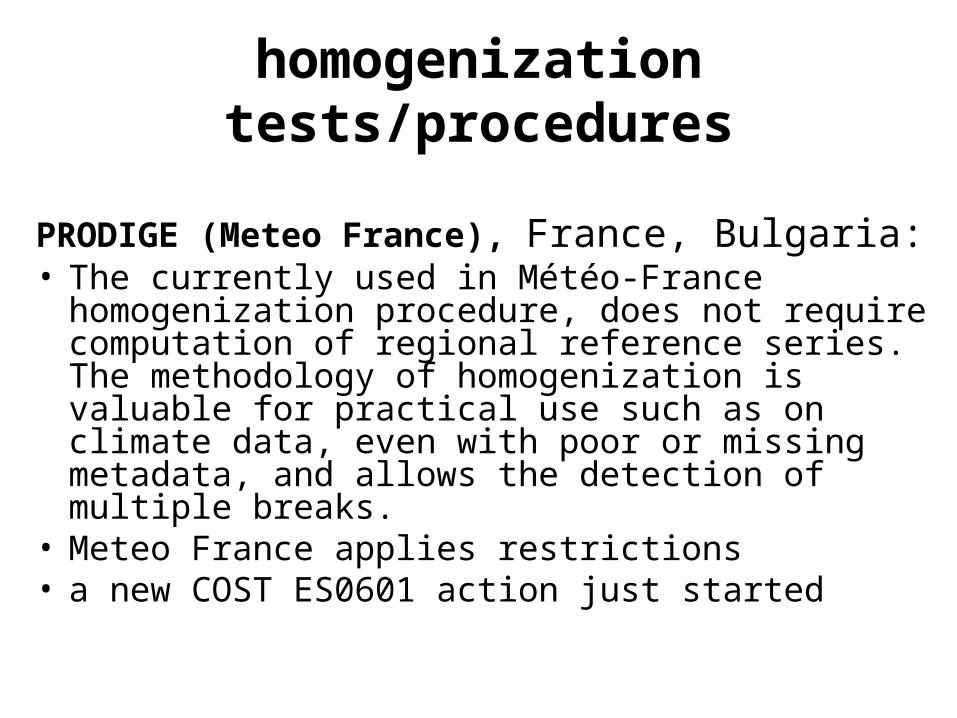
PRODIGE (Meteo France), France, Bulgaria:• Тhe currently used in Météo-France
homogenization procedure, does not require computation of regional reference series. The methodology of homogenization is valuable for practical use such as on climate data, even with poor or missing metadata, and allows the detection of multiple breaks.
• Meteo France applies restrictions • a new COST ES0601 action just started
WG2 REPORT STRUCTURE• 4.4. Statistical methods for analyses of
meteorological and simulation model output related time series
• 4.4.1. Country examples
statistical methods for analyses of time series
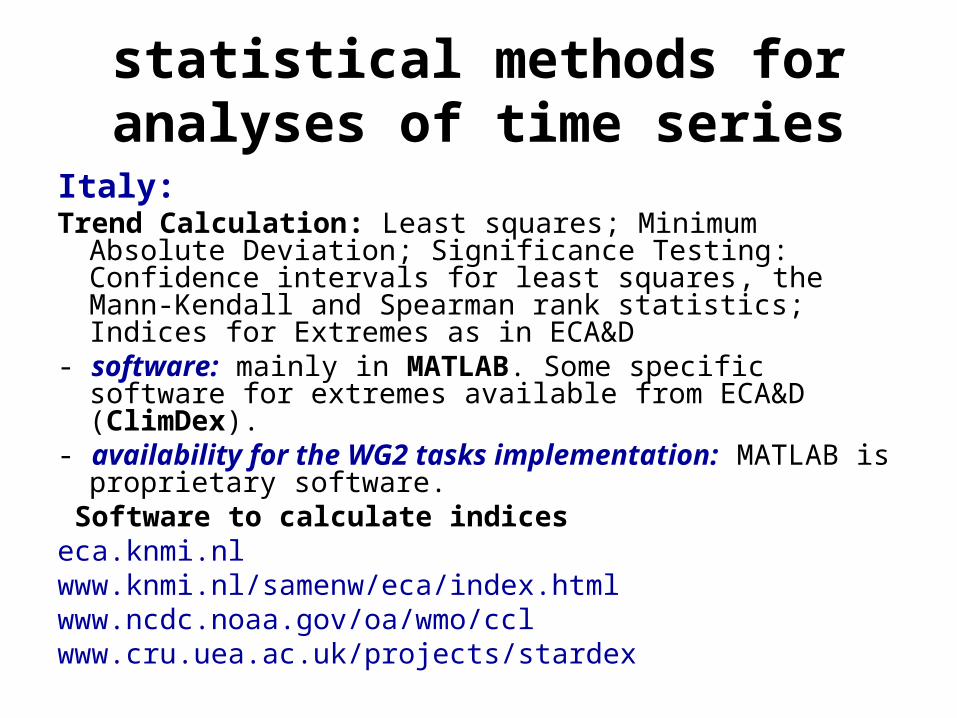
Italy:Trend Calculation: Least squares; Minimum Absolute
Deviation; Significance Testing: Confidence intervals for least squares, the Mann-Kendall and Spearman rank statistics; Indices for Extremes as in ECA&D
- software: mainly in MATLAB. Some specific software for extremes available from ECA&D (ClimDex).
- availability for the WG2 tasks implementation: MATLAB is proprietary software.
Software to calculate indiceseca.knmi.nlwww.knmi.nl/samenw/eca/index.htmlwww.ncdc.noaa.gov/oa/wmo/cclwww.cru.uea.ac.uk/projects/stardex
statistical methods for analyses of time series
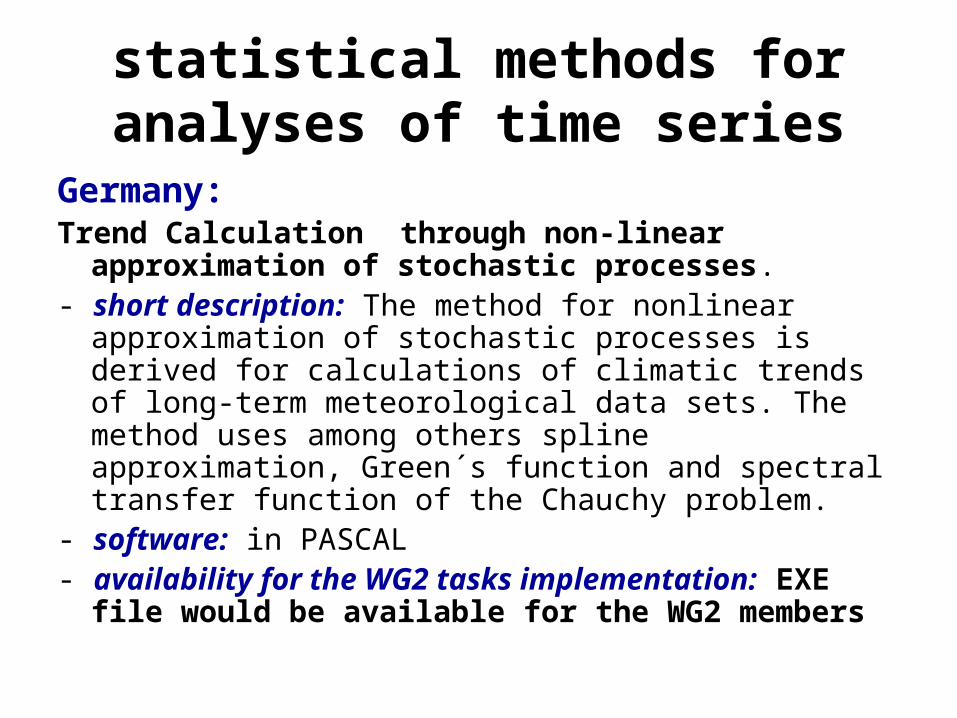
Germany:Trend Calculation through non-linear approximation of
stochastic processes.- short description: The method for nonlinear
approximation of stochastic processes is derived for calculations of climatic trends of long-term meteorological data sets. The method uses among others spline approximation, Green´s function and spectral transfer function of the Chauchy problem.
- software: in PASCAL- availability for the WG2 tasks implementation: EXE
file would be available for the WG2 members
statistical methods for analyses of time series
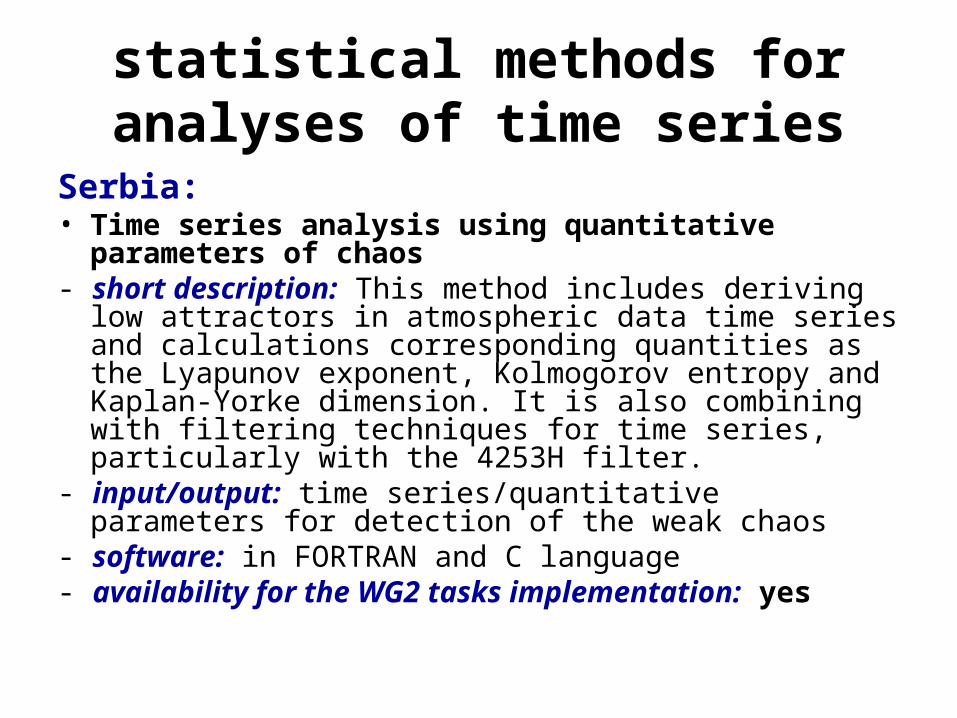
Serbia:• Time series analysis using quantitative parameters
of chaos - short description: This method includes deriving low
attractors in atmospheric data time series and calculations corresponding quantities as the Lyapunov exponent, Kolmogorov entropy and Kaplan-Yorke dimension. It is also combining with filtering techniques for time series, particularly with the 4253H filter.
- input/output: time series/quantitative parameters for detection of the weak chaos
- software: in FORTRAN and C language- availability for the WG2 tasks implementation: yes
statistical methods for analyses of time series
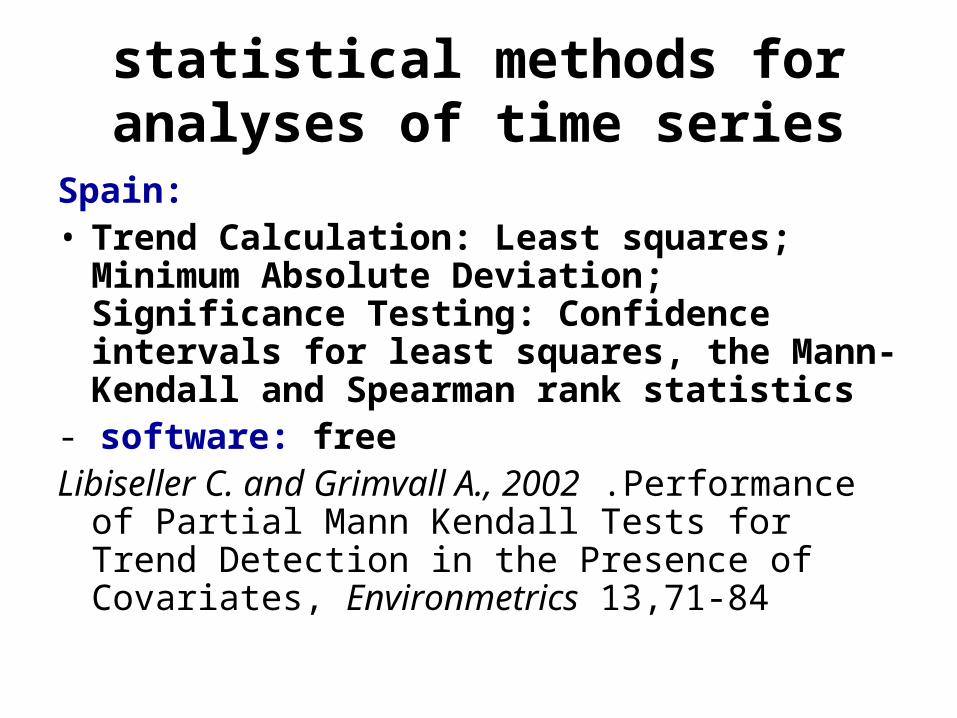
Spain:• Trend Calculation: Least squares; Minimum
Absolute Deviation; Significance Testing: Confidence intervals for least squares, the Mann-Kendall and Spearman rank statistics
- software: freeLibiseller C. and Grimvall A., 2002 .Performance of
Partial Mann Kendall Tests for Trend Detection in the Presence of Covariates, Environmetrics 13,71-84
statistical methods for analyses of time series
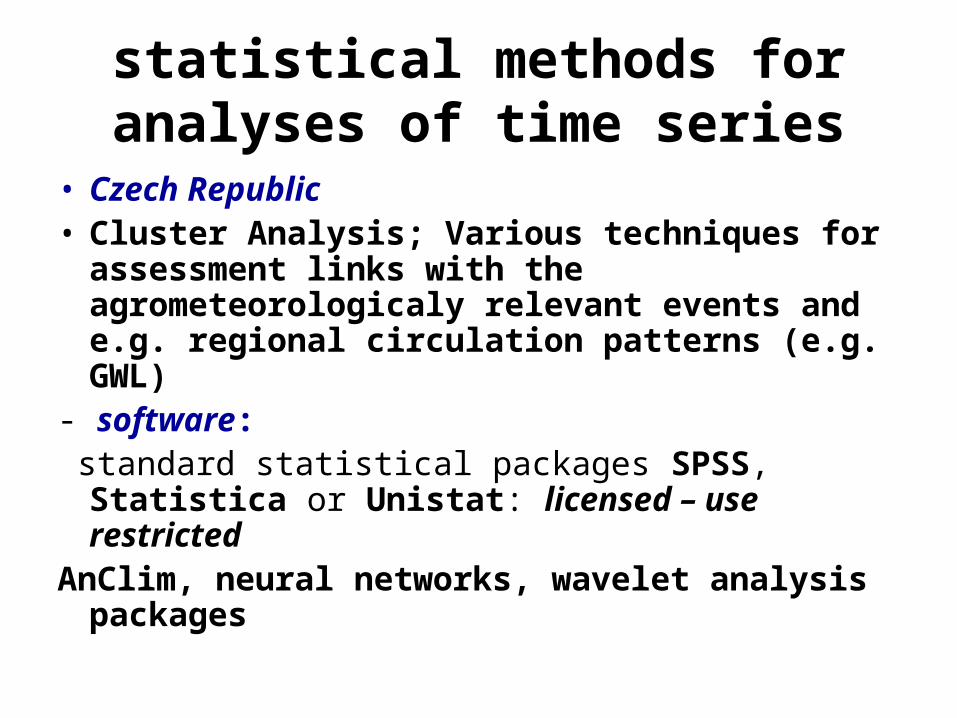
• Czech Republic• Cluster Analysis; Various techniques for
assessment links with the agrometeorologicaly relevant events and e.g. regional circulation patterns (e.g. GWL)
- software: standard statistical packages SPSS, Statistica or
Unistat: licensed – use restrictedAnClim, neural networks, wavelet analysis
packages
statistical methods for analyses of time series
Croatia, Poland, etc.
• software:STATISTICA
- availability for the WG2 tasks implementation: a license is needed
statistical methods for analyses of time series
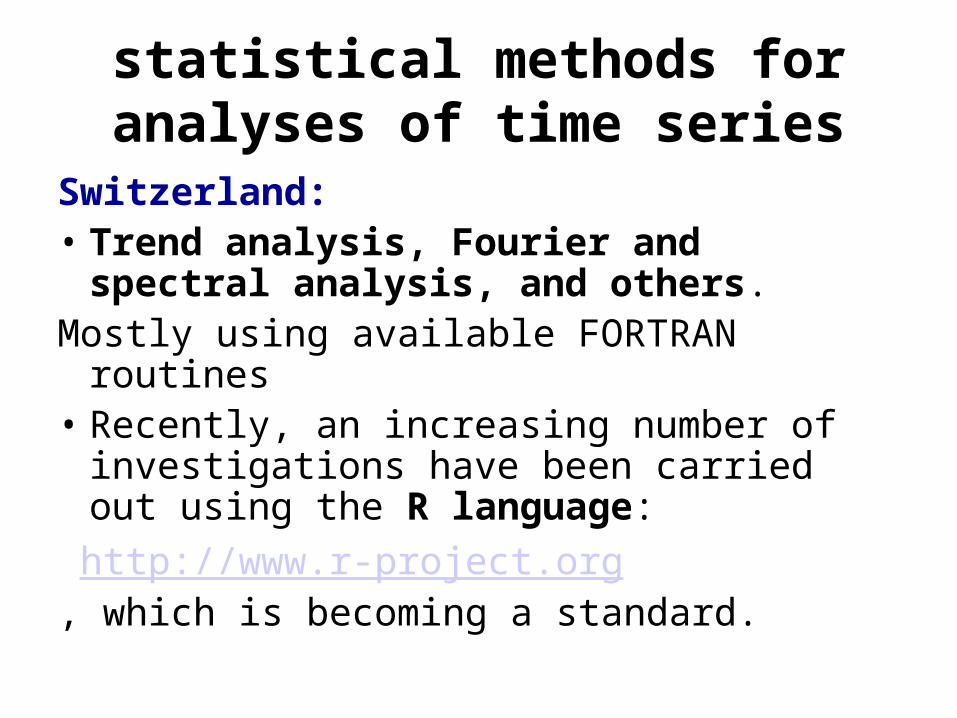
Switzerland:• Trend analysis, Fourier and spectral
analysis, and others.Mostly using available FORTRAN routines• Recently, an increasing number of
investigations have been carried out using the R language:
http://www.r-project.org, which is becoming a standard.
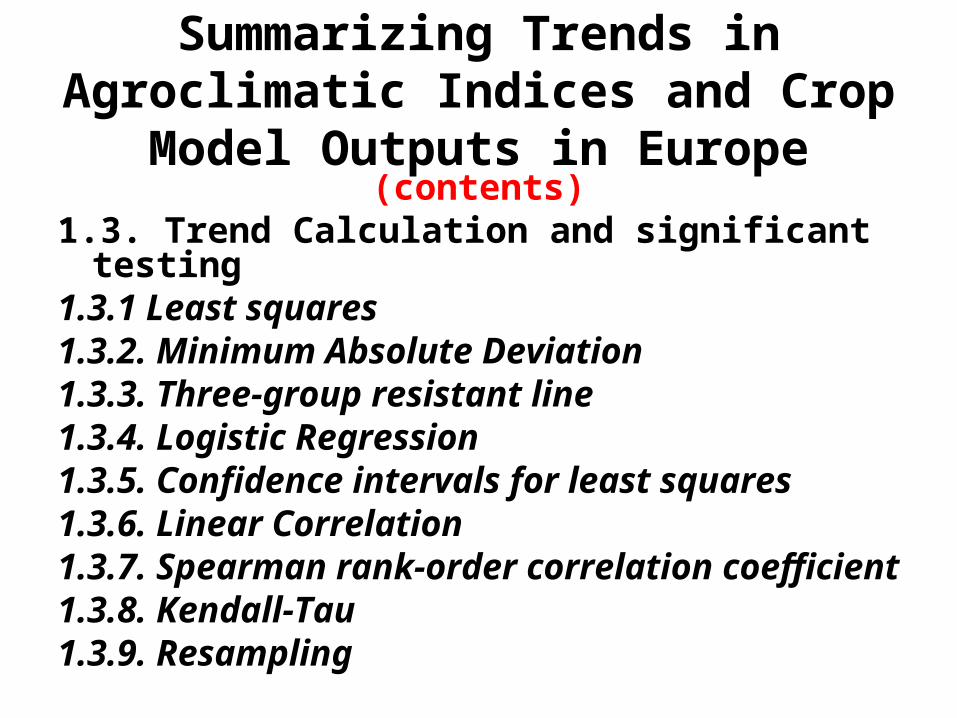
Summarizing Trends in Agroclimatic Indices and Crop Model Outputs in
Europe(contents)
1.3. Trend Calculation and significant testing1.3.1 Least squares 1.3.2. Minimum Absolute Deviation1.3.3. Three-group resistant line 1.3.4. Logistic Regression1.3.5. Confidence intervals for least squares1.3.6. Linear Correlation1.3.7. Spearman rank-order correlation
coefficient1.3.8. Kendall-Tau1.3.9. Resampling
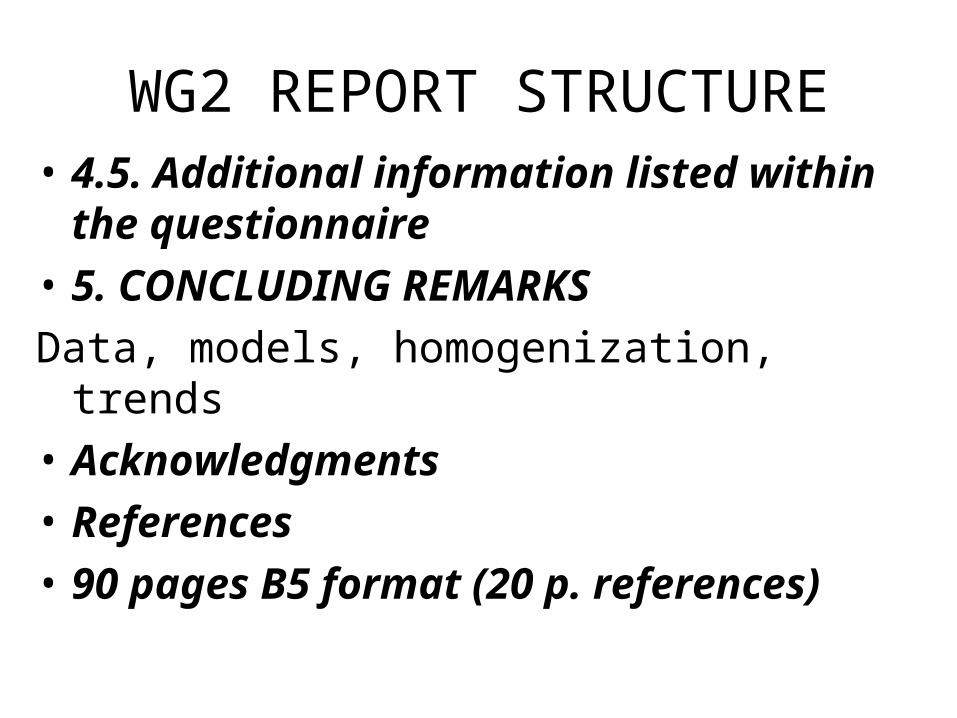
WG2 REPORT STRUCTURE• 4.5. Additional information listed within
the questionnaire
• 5. CONCLUDING REMARKS
Data, models, homogenization, trends
• Acknowledgments
• References
• 90 pages B5 format (20 p. references)
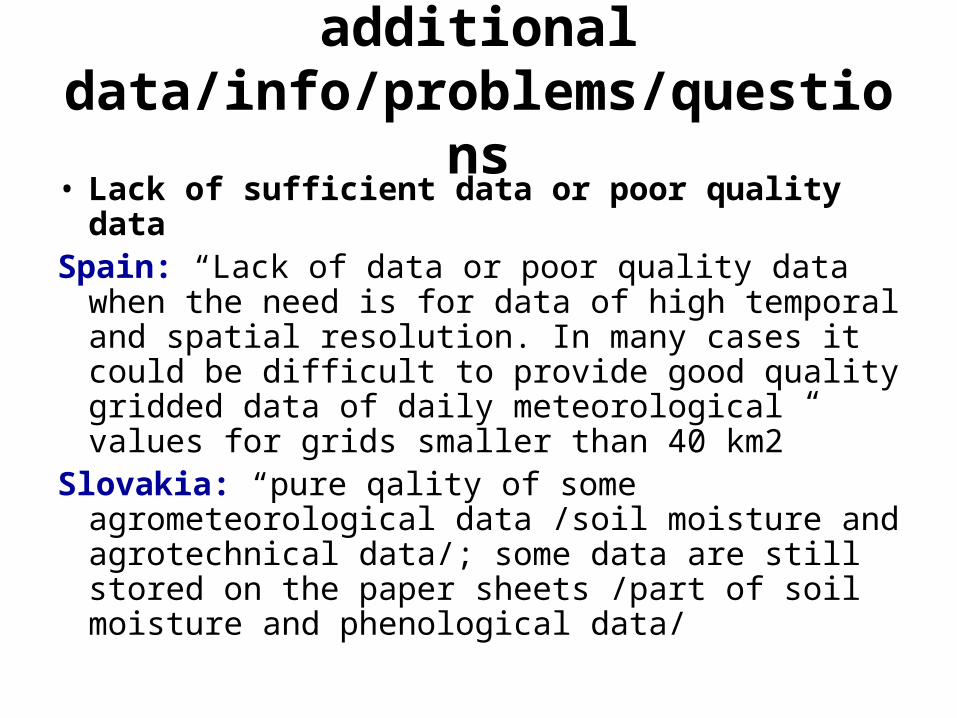
additional data/info/problems/questions
• Lack of sufficient data or poor quality data Spain: “Lack of data or poor quality data when the
need is for data of high temporal and spatial resolution. In many cases it could be difficult to provide good quality gridded data of daily meteorological values for grids smaller than 40 km2”
Slovakia: “pure qality of some agrometeorological data /soil moisture and agrotechnical data/; some data are still stored on the paper sheets /part of soil moisture and phenological data/

WG2 REPORT STRUCTURE• 4.5. Additional information listed within
the questionnaire
• 5. CONCLUDING REMARKS
Data, models, homogenization, trends
• Acknowledgments
• References
• 90 pages B5 format (20 p. references)

![A/FCTC/WG2/3 5 - World Health Organizationapps.who.int/gb/fctc/PDF/wg2/cf23.pdf · a/fctc/wg2/3 10 a/fctc/wg2/4 4. d. 1. 1 / 2 2. [ ] 3. (a) (b) a/fctc/wg2/4 4. e. a/fctc/wg1/7 22](https://img.pdfslide.us/doc/110x75/5ab59c147f8b9a156d8d100d/afctcwg23-5-world-health-10-afctcwg24-4-d-1-1-2-2-3-a-b-afctcwg24.jpg)


![Esdep Lecture Note [Wg2]](https://img.pdfslide.us/doc/110x75/546da25cb4af9fe51b8b4e97/esdep-lecture-note-wg2-558456d30e2b1.jpg)
