Embed Size (px)
Citation preview
Alberta Saskatchewan Manitoba Agriculture, Agriculture & Food Agriculture & Food Food and Rural Initiative
WFTEST:
The Western Forage Testing System
Report 2011
Agriculture and Canadian Agri-Food Canada Seed Trade Association
* Please Note * Some trials in this report have been tested for shorter periods of time than others. It is advised not to use either average yield figures and/or percent of check values to make cultivar comparisons for single-year data. Only after a minimum of three years of testing should data be considered as 90% reliable. In some cases, data may not be reported due to extreme variations that cannot be accounted for in the statistical design. Statistical information for this report was generated through an Analysis of Variation (ANOVA). Least significant difference (LSD) values are presented at the bottom of each table. If the difference in treatment values is less than the LSD value, the treatments are not considered to be significantly different.
Disclaimer Reference to commercial products or trade names is made with the understanding that no discrimination is intended and no endorsement is implied.
Table of Contents Page No.
Western Forage Testing System Guidelines ………………………………………………….. i Species and Origin of Entries in WFTesting System ………………………………………….. vi Alfalfa 2009 Alberta Lethbridge ..................................1 Fort Kent ....................................2 Saskatchewan Swift Current ..............................3 Saskatoon ...................................4 Melfort .......................................5 Outlook ......................................6 Manitoba Arborg ........................................7 Carberry .....................................8 Kelburn ......................................9 Orchardgrass 2009 Alberta Lethbridge ................................10 Fort Kent ..................................10 Saskatchewan Saskatoon .................................11 Melfort .....................................11 Outlook ....................................12 Manitoba Arborg ......................................13 Carberry ...................................13 Rosebank ..................................14 Kelburn ....................................14 Red Clover 2009 Alberta Lethbridge ................................15 Fort Kent ..................................15 Saskatchewan Swift Current ............................16 Saskatoon .................................16 Melfort .....................................17 Outlook ....................................17 Manitoba Arborg ......................................18 Carberry ...................................18 Rosebank ..................................19 Kelburn ....................................19 Sainfoin 2009 Alberta Lethbridge ................................20 Fort Kent ..................................20 Saskatchewan Swift Current ............................21 Saskatoon .................................21 Outlook ....................................22 Manitoba Arborg ......................................23 Carberry ...................................23 Rosebank ..................................24 Kelburn ....................................24
Summary Tables: Alfalfa 2009 Alberta..................................................... 26-27 Saskatchewan .......................................... 28-29 Manitoba ................................................. 30-31 Orchardgrass 2009 Alberta..................................................... 32-33 Saskatchewan .......................................... 34-35 Manitoba ................................................. 36-37 Red Clover 2009 Alberta...........................................................38 Saskatchewan ................................................39 Manitoba .......................................................40 Sainfoin 2009 Alberta..................................................... 42-43 Saskatchewan .......................................... 44-45 Manitoba ................................................. 46-47 Appendix 3- Application Form ................................................................................................ 48-49
2011 WFT Report i
WFTEST: The Western Forage Testing System
1. Introduction
The Western Forage Testing System (WFTEST) was developed in 1994 to coordinate the testing for registration and performance of forage cultivars across Alberta, Saskatchewan and Manitoba.
The goals of this system are:
. To streamline and coordinate the registration and performance evaluation process. The tests
will provide sufficient data for simultaneous consideration for registration and/or performance listings in Alberta, Saskatchewan and Manitoba.
. To share the responsibility for forage testing among provinces, the federal government and the
seed trade. . To encourage as much data collection as possible and to ensure that the tests are uniform and
the sites are inspected. 2. Procedure for Entering Cultivars
2.1 Number of Cultivars
The maximum number of entries to be tested per species per year is 25, including check varieties. If there are too many entries in a given year, only three entries per applicant will be accepted.
2.2 Deadline for Application
The WFTest Coordinator must receive application forms by February 15 of the seeding year. Two kilograms of seed for each entry are required and must be received by March 15. Invoices will be sent once the test has been finalized. The WFTest Coordinator contact information can be found on page 5.
2.3 Application Form
An application form is attached in the appendix.
2.4 Fees
The fee for all 12 sites is $900/entry/year ($75/entry/location). Companies will be invoiced annually for each year of the test (establishment year plus three harvest years). If reseeding is required at any site, companies will not be invoiced for those sites in the year of reseeding. There will be flexibility in the core sites to accommodate species adaptability – for example, red clover or timothy would not necessarily by tested at sites in Area 1 (brown) or Area 2 (dark brown) agro-climatic zones and fees would be adjusted accordingly.
2011 WFT Report ii
3. General Information
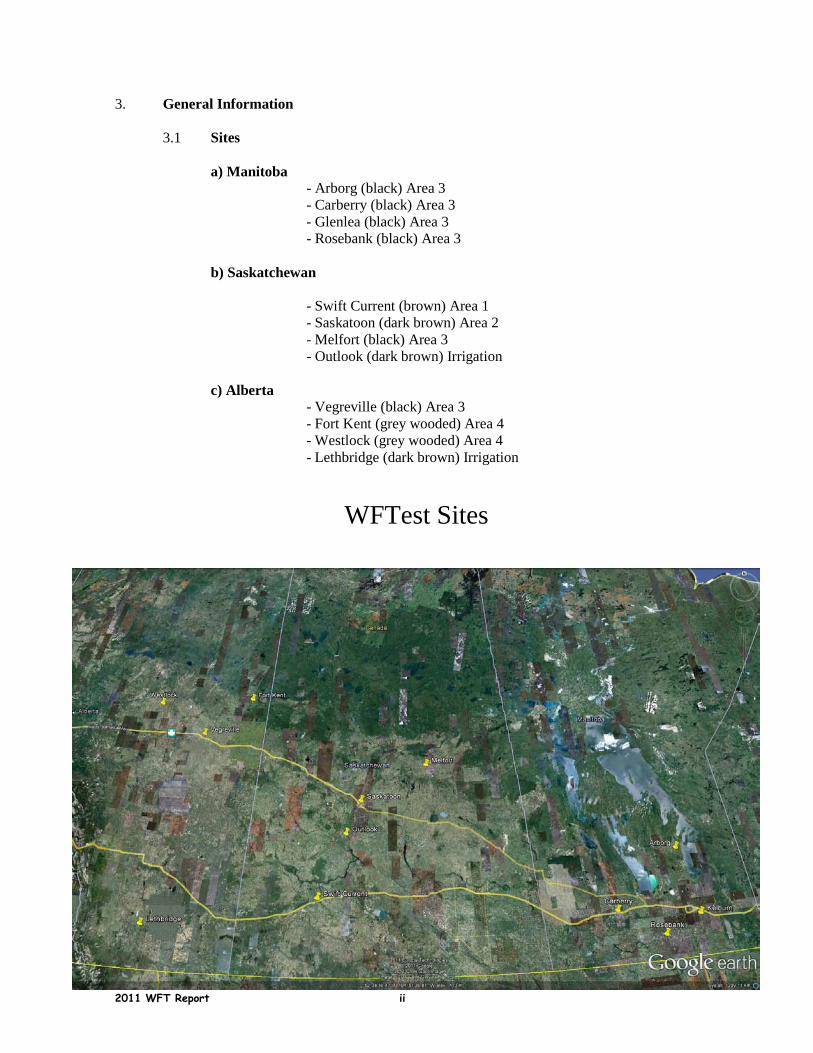
3.1 Sites
a) Manitoba - Arborg (black) Area 3 - Carberry (black) Area 3 - Glenlea (black) Area 3 - Rosebank (black) Area 3
b) Saskatchewan - Swift Current (brown) Area 1 - Saskatoon (dark brown) Area 2 - Melfort (black) Area 3 - Outlook (dark brown) Irrigation
c) Alberta
- Vegreville (black) Area 3 - Fort Kent (grey wooded) Area 4 - Westlock (grey wooded) Area 4 - Lethbridge (dark brown) Irrigation
WFTest Sites
2011 WFT Report iii
3.2 Seeding Schedules
Species trials will be seeded annually if sufficient entries are received. Tests that fail to establish will be reseeded in the following year. Annual and Italian ryegrasses will undergo two successive seedings.
3.3 Experimental Design and Plot Management
Tests will be seeded in a randomized complete block design with a minimum of four replicates, a suggested minimum plot size of 6 m x 1 m and a suggested minimum harvest area of 5 sq. m. Sites will be managed according to the recommended practices for forage management in the region. The seeding rates will be based on provincial recommendations and will be calculated on a pure live seeds/meter of row.
3.4 Check Varieties
The following list is subject to approval by provincial forage testing committees:
Alfalfa: Beaver, AC Blue J, Rambler, Rangelander Birdsfoot trefoil: Leo Cicer milkvetch: Oxley Alsike clover: Aurora Red clover: Altaswede Sainfoin: Nova Yellow Sweetclover: Norgold White clover: California Ladino Smooth bromegrass: Carlton Meadow bromegrass: Fleet Creeping red fescue: Boreal Meadow fescue: Mimer Tall fescue: Courtenay Kentucky bluegrass: Troy Orchard grass: Kay Altai wildrye: Prairieland Russian wildrye: Swift Timothy: Climax Crested wheatgrass: Kirk Intermediate/Pubescent wheatgrass: Chief Northern wheatgrass: Elbee Slender wheatgrass: Revenue Streambank wheatgrass: Sodar Tall wheatgrass: Orbit Western wheatgrass: Walsh Perennial ryegrass: Norlea Westerwolds annual ryegrass: Aubade Italian ryegrass: Maris Ledger
The committee will update check varieties as necessary. However, data for a given entry will be compared to the same check throughout its evaluation.
2011 WFT Report iv
4. Site Inspection
Members of the provincial forage cultivar registration subcommittees will visit all sites before the first harvest each year. Visits will be organized by WFTest members in each province and information reported immediately to the WFTest coordinator. Tests will be rated as: a) accepted, b) conditionally accepted (e.g. certain plots or replicates may not be harvested), or c) rejected.
5. Data Collection
Forage harvests will be made for legumes at the beginning of bloom and for grasses at full heading. Forage yield data will be reported on a dry matter basis in kg/ha. The number of harvests will be determined by growth conditions at the test location. No harvests will be taken during a fall rest period, the dates of which will correspond to local climatic conditions.
Perennial species will be harvested for a minimum of three successive years, annual and biennial species will be harvested for a minimum of two successive years. All trial data will be reported.
6. Data Management
Each province will be responsible for their trial data management and statistical analysis. Provincial representatives will annually forward trial data for entries eligible for registration to industry participants before provincial advisory committee meetings. Summarized data will be forwarded to the WFTest coordinator. Committee members and industry participants will receive a compiled annual report.
7. Provincial Contacts
For information on varietal data contact the respective provincial representative:
Alberta Manitoba Doug Friebel Glen Friesen Agriculture and Agri-Food Canada Manitoba Agriculture, Food and 5403 – 1st Avenue South Rural P.O. Box 3000 Main Intitiative Lethbridge, AB T1J 4B1 Box 1149 Phone: (403) 317-2151 ext. 4227 Carmen, Manitoba R0G 0J0 Fax: (403) 382-3156 Phone: (204) 745-5672 E-mail: [email protected] Fax: (204) 745-5690 E-mail: [email protected]
Saskatchewan Tim Nelson Agriculture and Agri-Food Canada Saskatoon Research Centre 107 Science Place Saskatoon, SK S7N 0X2 Phone: (306) 956-7233 Fax: (306) 956-7247
E-mail: [email protected]
2011 WFT Report v
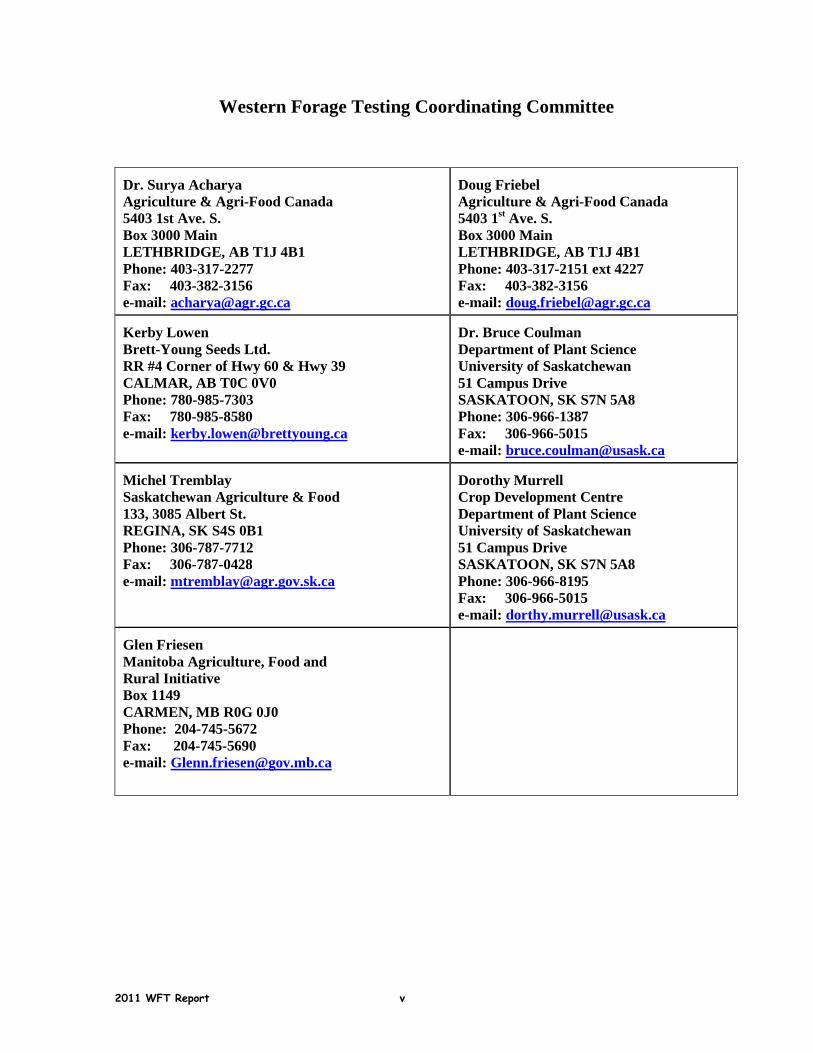
Western Forage Testing Coordinating Committee
Dr. Surya Acharya Agriculture & Agri-Food Canada 5403 1st Ave. S. Box 3000 Main LETHBRIDGE, AB T1J 4B1 Phone: 403-317-2277 Fax: 403-382-3156 e-mail: [email protected]
Doug Friebel Agriculture & Agri-Food Canada 5403 1st Ave. S. Box 3000 Main LETHBRIDGE, AB T1J 4B1 Phone: 403-317-2151 ext 4227 Fax: 403-382-3156 e-mail: [email protected]
Kerby Lowen Brett-Young Seeds Ltd. RR #4 Corner of Hwy 60 & Hwy 39 CALMAR, AB T0C 0V0 Phone: 780-985-7303 Fax: 780-985-8580 e-mail: [email protected]
Dr. Bruce Coulman Department of Plant Science University of Saskatchewan 51 Campus Drive SASKATOON, SK S7N 5A8 Phone: 306-966-1387 Fax: 306-966-5015 e-mail: [email protected]
Michel Tremblay Saskatchewan Agriculture & Food 133, 3085 Albert St. REGINA, SK S4S 0B1 Phone: 306-787-7712 Fax: 306-787-0428 e-mail: [email protected]
Dorothy Murrell Crop Development Centre Department of Plant Science University of Saskatchewan 51 Campus Drive SASKATOON, SK S7N 5A8 Phone: 306-966-8195 Fax: 306-966-5015 e-mail: [email protected]
Glen Friesen Manitoba Agriculture, Food and Rural Initiative Box 1149 CARMEN, MB R0G 0J0 Phone: 204-745-5672 Fax: 204-745-5690 e-mail: [email protected]
2011 WFT Report vi
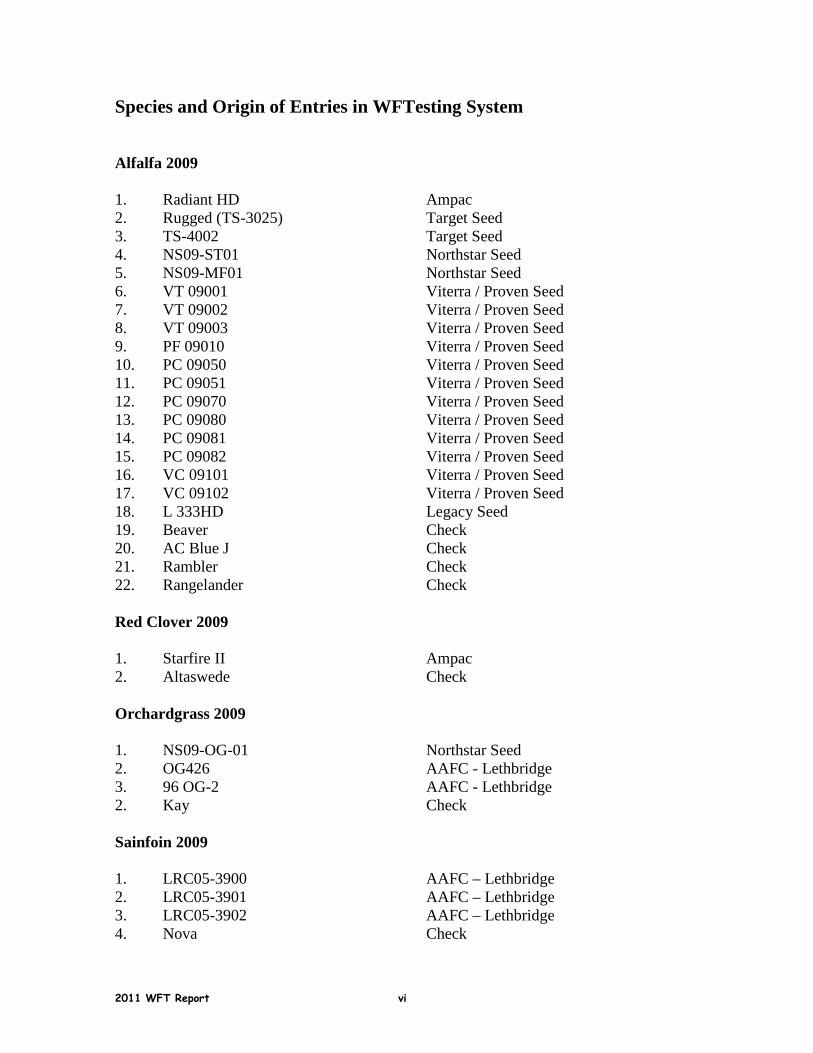
Species and Origin of Entries in WFTesting System Alfalfa 2009 1. Radiant HD Ampac 2. Rugged (TS-3025) Target Seed 3. TS-4002 Target Seed 4. NS09-ST01 Northstar Seed 5. NS09-MF01 Northstar Seed 6. VT 09001 Viterra / Proven Seed 7. VT 09002 Viterra / Proven Seed 8. VT 09003 Viterra / Proven Seed 9. PF 09010 Viterra / Proven Seed 10. PC 09050 Viterra / Proven Seed 11. PC 09051 Viterra / Proven Seed 12. PC 09070 Viterra / Proven Seed 13. PC 09080 Viterra / Proven Seed 14. PC 09081 Viterra / Proven Seed 15. PC 09082 Viterra / Proven Seed 16. VC 09101 Viterra / Proven Seed 17. VC 09102 Viterra / Proven Seed 18. L 333HD Legacy Seed 19. Beaver Check 20. AC Blue J Check 21. Rambler Check 22. Rangelander Check Red Clover 2009 1. Starfire II Ampac 2. Altaswede Check Orchardgrass 2009 1. NS09-OG-01 Northstar Seed 2. OG426 AAFC - Lethbridge 3. 96 OG-2 AAFC - Lethbridge 2. Kay Check Sainfoin 2009 1. LRC05-3900 AAFC – Lethbridge 2. LRC05-3901 AAFC – Lethbridge 3. LRC05-3902 AAFC – Lethbridge 4. Nova Check
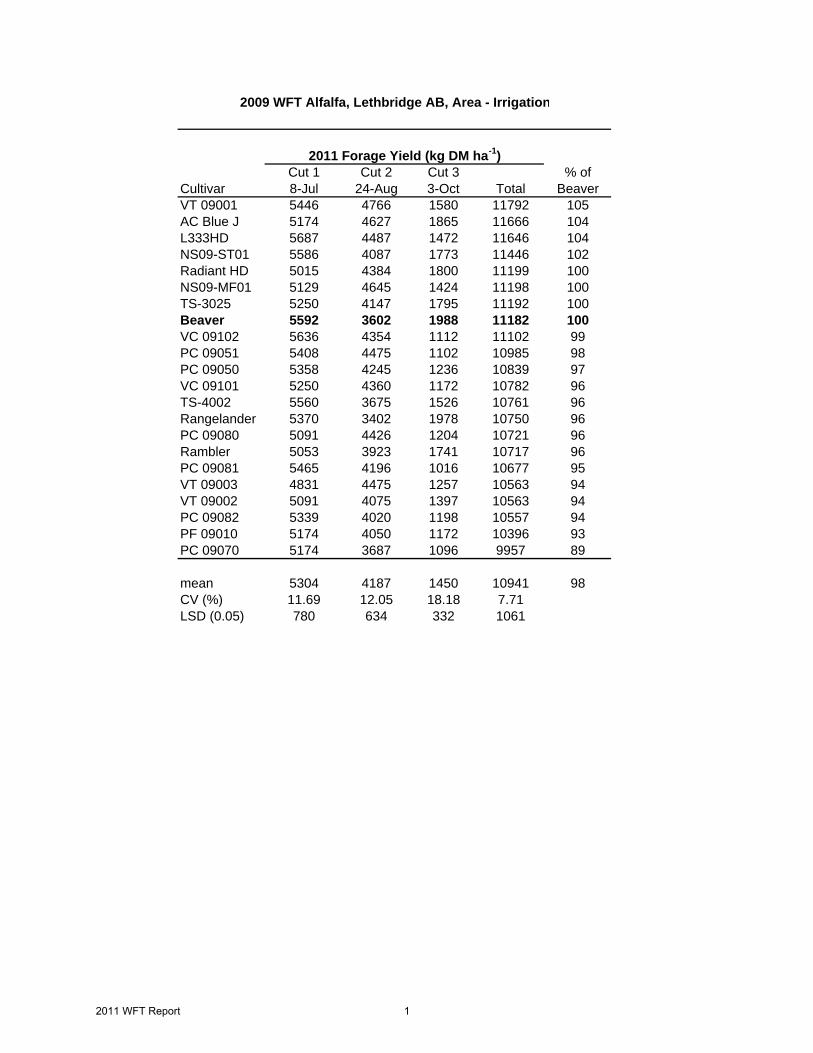
Cut 1 Cut 2 Cut 3 % ofCultivar 8-Jul 24-Aug 3-Oct Total BeaverVT 09001 5446 4766 1580 11792 105AC Blue J 5174 4627 1865 11666 104L333HD 5687 4487 1472 11646 104NS09-ST01 5586 4087 1773 11446 102Radiant HD 5015 4384 1800 11199 100NS09-MF01 5129 4645 1424 11198 100TS-3025 5250 4147 1795 11192 100Beaver 5592 3602 1988 11182 100VC 09102 5636 4354 1112 11102 99PC 09051 5408 4475 1102 10985 98PC 09050 5358 4245 1236 10839 97VC 09101 5250 4360 1172 10782 96TS-4002 5560 3675 1526 10761 96Rangelander 5370 3402 1978 10750 96PC 09080 5091 4426 1204 10721 96Rambler 5053 3923 1741 10717 96PC 09081 5465 4196 1016 10677 95VT 09003 4831 4475 1257 10563 94VT 09002 5091 4075 1397 10563 94PC 09082 5339 4020 1198 10557 94PF 09010 5174 4050 1172 10396 93PC 09070 5174 3687 1096 9957 89
mean 5304 4187 1450 10941 98CV (%) 11.69 12.05 18.18 7.71LSD (0.05) 780 634 332 1061
2009 WFT Alfalfa, Lethbridge AB, Area - Irrigation
2011 Forage Yield (kg DM ha-1)
2011 WFT Report 1
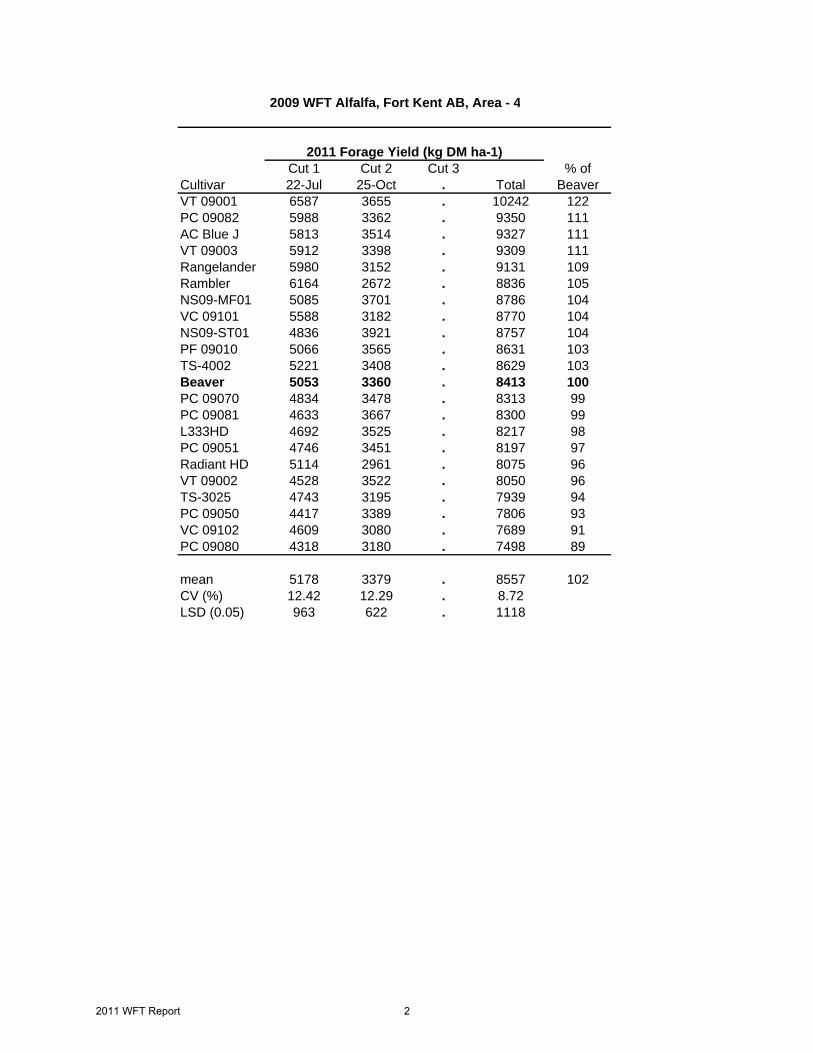
Cut 1 Cut 2 Cut 3 % ofCultivar 22-Jul 25-Oct . Total BeaverVT 09001 6587 3655 . 10242 122PC 09082 5988 3362 . 9350 111AC Blue J 5813 3514 . 9327 111VT 09003 5912 3398 . 9309 111Rangelander 5980 3152 . 9131 109Rambler 6164 2672 . 8836 105NS09-MF01 5085 3701 . 8786 104VC 09101 5588 3182 . 8770 104NS09-ST01 4836 3921 . 8757 104PF 09010 5066 3565 . 8631 103TS-4002 5221 3408 . 8629 103Beaver 5053 3360 . 8413 100PC 09070 4834 3478 . 8313 99PC 09081 4633 3667 . 8300 99L333HD 4692 3525 . 8217 98PC 09051 4746 3451 . 8197 97Radiant HD 5114 2961 . 8075 96VT 09002 4528 3522 . 8050 96TS-3025 4743 3195 . 7939 94PC 09050 4417 3389 . 7806 93VC 09102 4609 3080 . 7689 91PC 09080 4318 3180 . 7498 89
mean 5178 3379 . 8557 102CV (%) 12.42 12.29 . 8.72LSD (0.05) 963 622 . 1118
2009 WFT Alfalfa, Fort Kent AB, Area - 4
2011 Forage Yield (kg DM ha-1)
2011 WFT Report 2
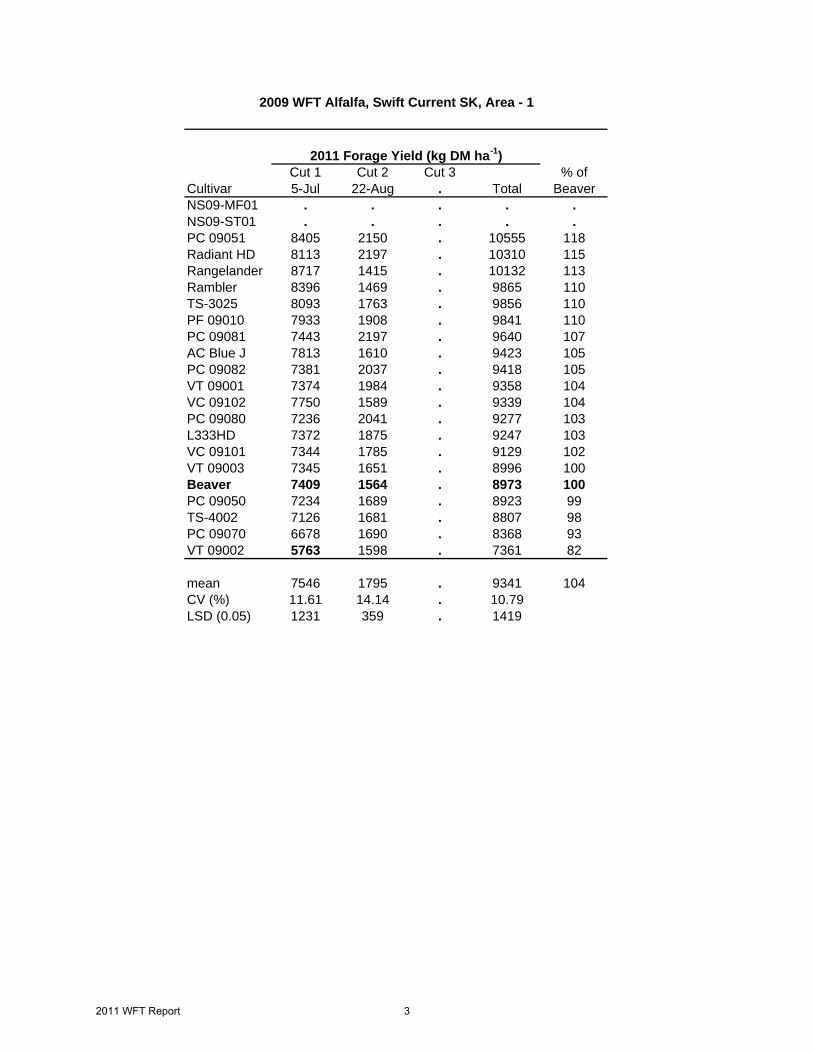
Cut 1 Cut 2 Cut 3 % ofCultivar 5-Jul 22-Aug . Total BeaverNS09-MF01 . . . . .NS09-ST01 . . . . .PC 09051 8405 2150 . 10555 118Radiant HD 8113 2197 . 10310 115Rangelander 8717 1415 . 10132 113Rambler 8396 1469 . 9865 110TS-3025 8093 1763 . 9856 110PF 09010 7933 1908 . 9841 110PC 09081 7443 2197 . 9640 107AC Blue J 7813 1610 . 9423 105PC 09082 7381 2037 . 9418 105VT 09001 7374 1984 . 9358 104VC 09102 7750 1589 . 9339 104PC 09080 7236 2041 . 9277 103L333HD 7372 1875 . 9247 103VC 09101 7344 1785 . 9129 102VT 09003 7345 1651 . 8996 100Beaver 7409 1564 . 8973 100PC 09050 7234 1689 . 8923 99TS-4002 7126 1681 . 8807 98PC 09070 6678 1690 . 8368 93VT 09002 5763 1598 . 7361 82
mean 7546 1795 . 9341 104CV (%) 11.61 14.14 . 10.79LSD (0.05) 1231 359 . 1419
2009 WFT Alfalfa, Swift Current SK, Area - 1
2011 Forage Yield (kg DM ha-1)
2011 WFT Report 3
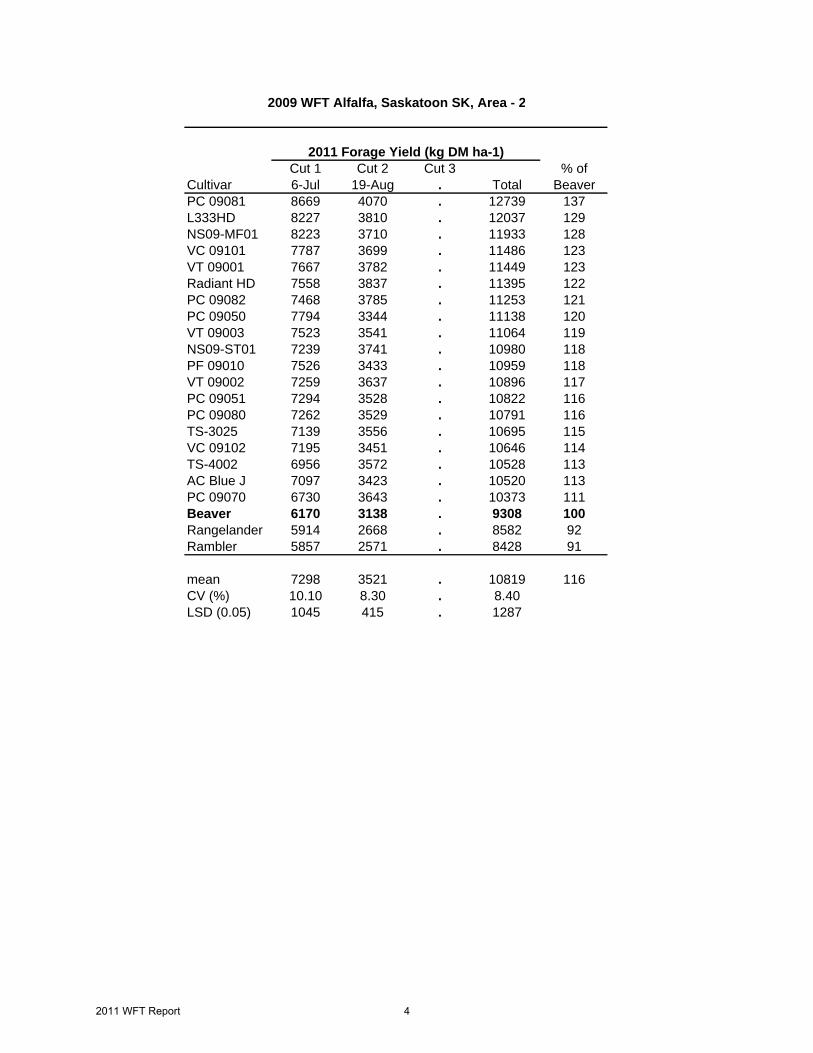
Cut 1 Cut 2 Cut 3 % ofCultivar 6-Jul 19-Aug . Total BeaverPC 09081 8669 4070 . 12739 137L333HD 8227 3810 . 12037 129NS09-MF01 8223 3710 . 11933 128VC 09101 7787 3699 . 11486 123VT 09001 7667 3782 . 11449 123Radiant HD 7558 3837 . 11395 122PC 09082 7468 3785 . 11253 121PC 09050 7794 3344 . 11138 120VT 09003 7523 3541 . 11064 119NS09-ST01 7239 3741 . 10980 118PF 09010 7526 3433 . 10959 118VT 09002 7259 3637 . 10896 117PC 09051 7294 3528 . 10822 116PC 09080 7262 3529 . 10791 116TS-3025 7139 3556 . 10695 115VC 09102 7195 3451 . 10646 114TS-4002 6956 3572 . 10528 113AC Blue J 7097 3423 . 10520 113PC 09070 6730 3643 . 10373 111Beaver 6170 3138 . 9308 100Rangelander 5914 2668 . 8582 92Rambler 5857 2571 . 8428 91
mean 7298 3521 . 10819 116CV (%) 10.10 8.30 . 8.40LSD (0.05) 1045 415 . 1287
2011 Forage Yield (kg DM ha-1)
2009 WFT Alfalfa, Saskatoon SK, Area - 2
2011 WFT Report 4
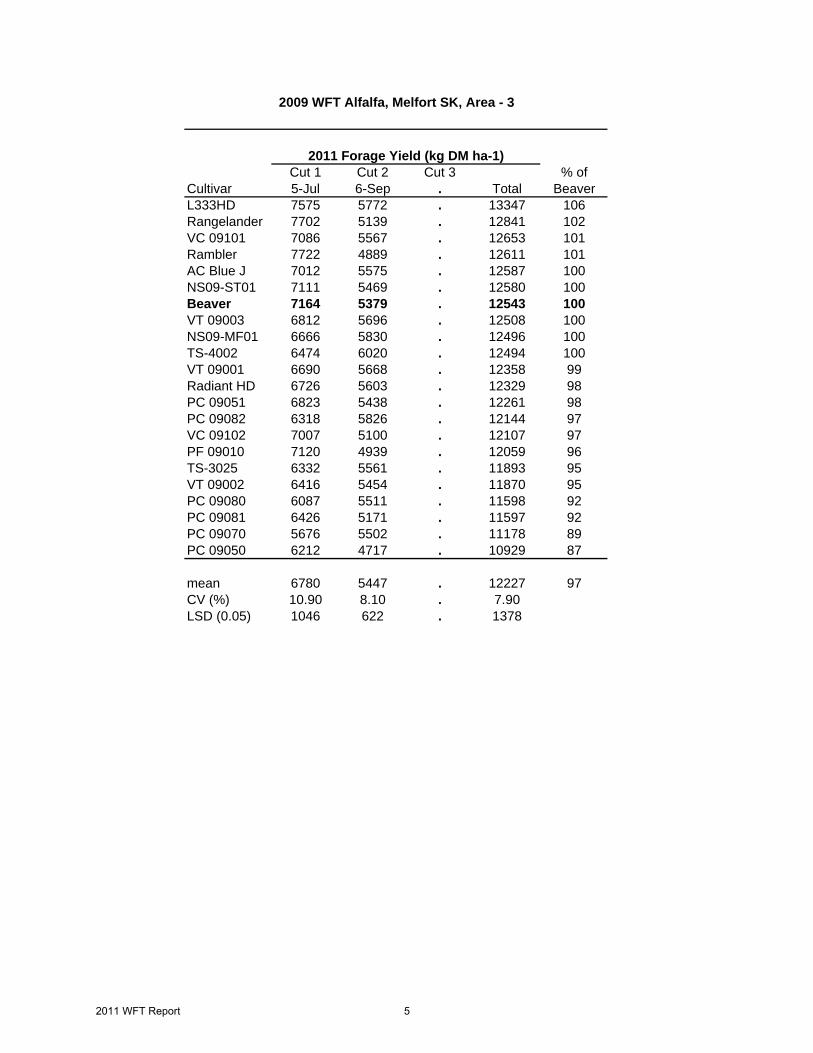
Cut 1 Cut 2 Cut 3 % ofCultivar 5-Jul 6-Sep . Total BeaverL333HD 7575 5772 . 13347 106Rangelander 7702 5139 . 12841 102VC 09101 7086 5567 . 12653 101Rambler 7722 4889 . 12611 101AC Blue J 7012 5575 . 12587 100NS09-ST01 7111 5469 . 12580 100Beaver 7164 5379 . 12543 100VT 09003 6812 5696 . 12508 100NS09-MF01 6666 5830 . 12496 100TS-4002 6474 6020 . 12494 100VT 09001 6690 5668 . 12358 99Radiant HD 6726 5603 . 12329 98PC 09051 6823 5438 . 12261 98PC 09082 6318 5826 . 12144 97VC 09102 7007 5100 . 12107 97PF 09010 7120 4939 . 12059 96TS-3025 6332 5561 . 11893 95VT 09002 6416 5454 . 11870 95PC 09080 6087 5511 . 11598 92PC 09081 6426 5171 . 11597 92PC 09070 5676 5502 . 11178 89PC 09050 6212 4717 . 10929 87
mean 6780 5447 . 12227 97CV (%) 10.90 8.10 . 7.90LSD (0.05) 1046 622 . 1378
2011 Forage Yield (kg DM ha-1)
2009 WFT Alfalfa, Melfort SK, Area - 3
2011 WFT Report 5
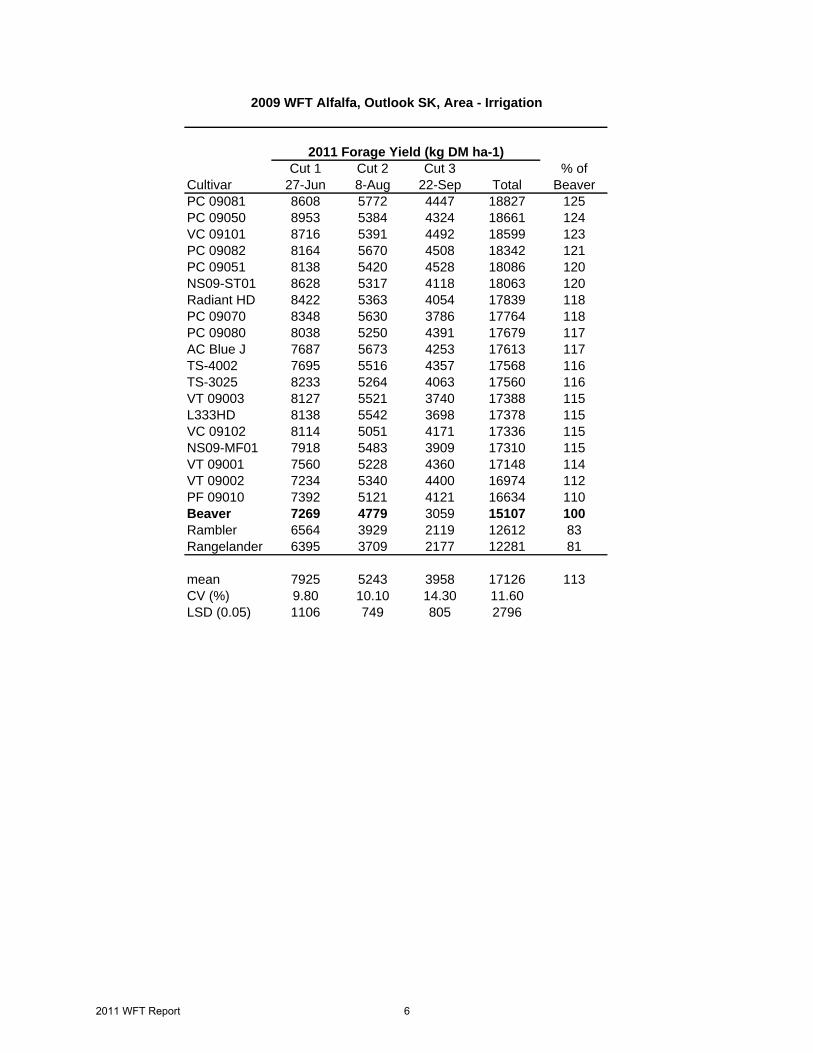
Cut 1 Cut 2 Cut 3 % ofCultivar 27-Jun 8-Aug 22-Sep Total BeaverPC 09081 8608 5772 4447 18827 125PC 09050 8953 5384 4324 18661 124VC 09101 8716 5391 4492 18599 123PC 09082 8164 5670 4508 18342 121PC 09051 8138 5420 4528 18086 120NS09-ST01 8628 5317 4118 18063 120Radiant HD 8422 5363 4054 17839 118PC 09070 8348 5630 3786 17764 118PC 09080 8038 5250 4391 17679 117AC Blue J 7687 5673 4253 17613 117TS-4002 7695 5516 4357 17568 116TS-3025 8233 5264 4063 17560 116VT 09003 8127 5521 3740 17388 115L333HD 8138 5542 3698 17378 115VC 09102 8114 5051 4171 17336 115NS09-MF01 7918 5483 3909 17310 115VT 09001 7560 5228 4360 17148 114VT 09002 7234 5340 4400 16974 112PF 09010 7392 5121 4121 16634 110Beaver 7269 4779 3059 15107 100Rambler 6564 3929 2119 12612 83Rangelander 6395 3709 2177 12281 81
mean 7925 5243 3958 17126 113CV (%) 9.80 10.10 14.30 11.60LSD (0.05) 1106 749 805 2796
2009 WFT Alfalfa, Outlook SK, Area - Irrigation
2011 Forage Yield (kg DM ha-1)
2011 WFT Report 6

Cut 1 Cut 2 Cut 3 % ofCultivar 6-Jul 11-Aug . Total BeaverRadiant HD 6465 3189 . 9654 106NS09-MF01 6546 3036 . 9582 105PC 09082 6346 3149 . 9495 104VT 09001 6302 3179 . 9481 104TS-3025 6561 2865 . 9426 103PC 09051 6171 3182 . 9353 103AC Blue J 6202 3115 . 9317 102PF 09010 6327 2941 . 9268 102VC 09101 6246 3008 . 9254 101NS09-ST01 5993 3191 . 9184 101PC 09081 6062 3103 . 9165 100PC 09050 6199 2959 . 9158 100PC 09080 6030 3127 . 9157 100Beaver 6002 3118 . 9120 100VT 09002 6030 2966 . 8996 99L333HD 6028 2868 . 8896 98VT 09003 5987 2859 . 8846 97TS-4002 6099 2737 . 8836 97PC 09070 6193 2621 . 8814 97VC 09102 5827 2874 . 8701 95Rambler 6190 2505 . 8695 95Rangelander 5890 2697 . 8587 94
mean 6168 2968 . 9136 100CV (%) 7.74 9.34 . 6.30LSD (0.05) 675 390 . 812
2009 WFT Alfalfa, Arborg MB, Area - 3
2011 Forage Yield (kg DM ha-1)
2011 WFT Report 7
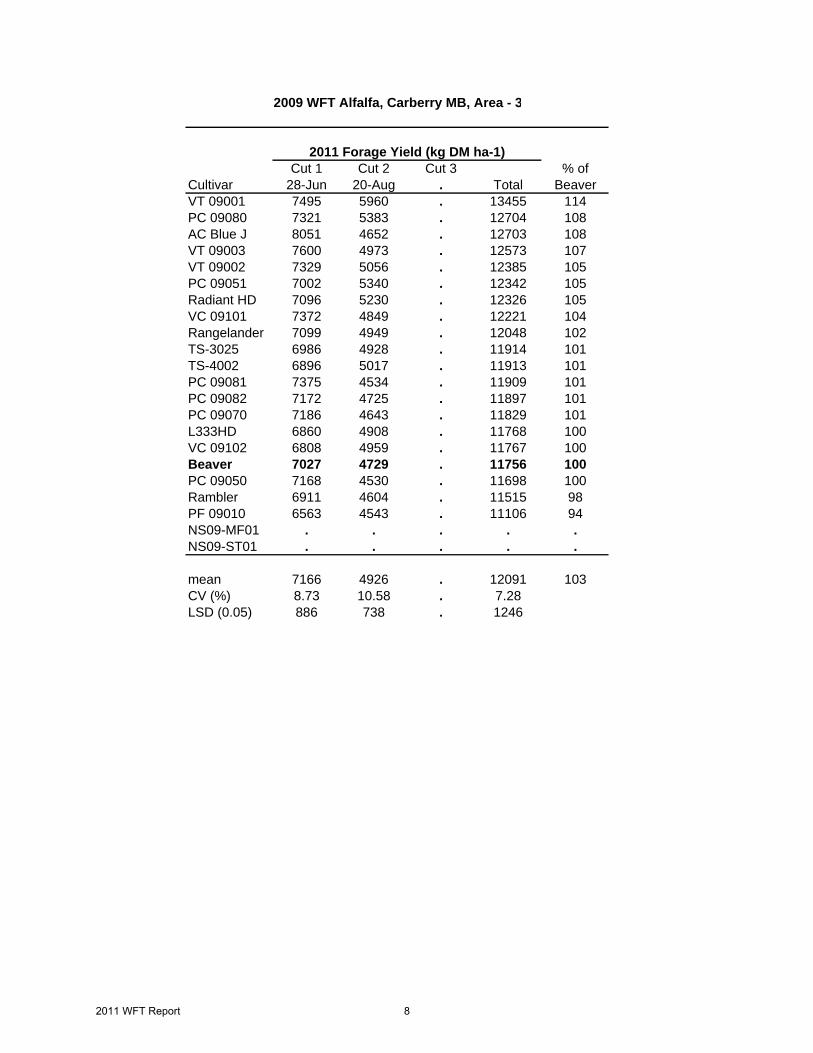
Cut 1 Cut 2 Cut 3 % ofCultivar 28-Jun 20-Aug . Total BeaverVT 09001 7495 5960 . 13455 114PC 09080 7321 5383 . 12704 108AC Blue J 8051 4652 . 12703 108VT 09003 7600 4973 . 12573 107VT 09002 7329 5056 . 12385 105PC 09051 7002 5340 . 12342 105Radiant HD 7096 5230 . 12326 105VC 09101 7372 4849 . 12221 104Rangelander 7099 4949 . 12048 102TS-3025 6986 4928 . 11914 101TS-4002 6896 5017 . 11913 101PC 09081 7375 4534 . 11909 101PC 09082 7172 4725 . 11897 101PC 09070 7186 4643 . 11829 101L333HD 6860 4908 . 11768 100VC 09102 6808 4959 . 11767 100Beaver 7027 4729 . 11756 100PC 09050 7168 4530 . 11698 100Rambler 6911 4604 . 11515 98PF 09010 6563 4543 . 11106 94NS09-MF01 . . . . .NS09-ST01 . . . . .
mean 7166 4926 . 12091 103CV (%) 8.73 10.58 . 7.28LSD (0.05) 886 738 . 1246
2009 WFT Alfalfa, Carberry MB, Area - 3
2011 Forage Yield (kg DM ha-1)
2011 WFT Report 8
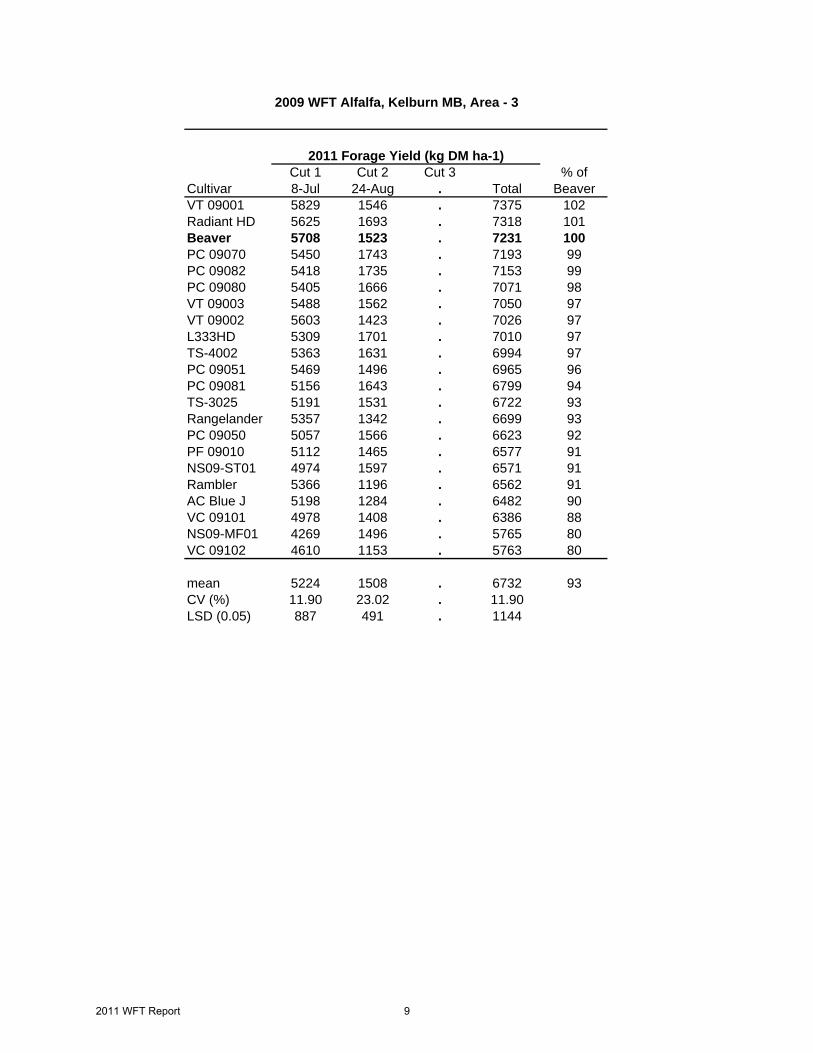
Cut 1 Cut 2 Cut 3 % ofCultivar 8-Jul 24-Aug . Total BeaverVT 09001 5829 1546 . 7375 102Radiant HD 5625 1693 . 7318 101Beaver 5708 1523 . 7231 100PC 09070 5450 1743 . 7193 99PC 09082 5418 1735 . 7153 99PC 09080 5405 1666 . 7071 98VT 09003 5488 1562 . 7050 97VT 09002 5603 1423 . 7026 97L333HD 5309 1701 . 7010 97TS-4002 5363 1631 . 6994 97PC 09051 5469 1496 . 6965 96PC 09081 5156 1643 . 6799 94TS-3025 5191 1531 . 6722 93Rangelander 5357 1342 . 6699 93PC 09050 5057 1566 . 6623 92PF 09010 5112 1465 . 6577 91NS09-ST01 4974 1597 . 6571 91Rambler 5366 1196 . 6562 91AC Blue J 5198 1284 . 6482 90VC 09101 4978 1408 . 6386 88NS09-MF01 4269 1496 . 5765 80VC 09102 4610 1153 . 5763 80
mean 5224 1508 . 6732 93CV (%) 11.90 23.02 . 11.90LSD (0.05) 887 491 . 1144
2009 WFT Alfalfa, Kelburn MB, Area - 3
2011 Forage Yield (kg DM ha-1)
2011 WFT Report 9
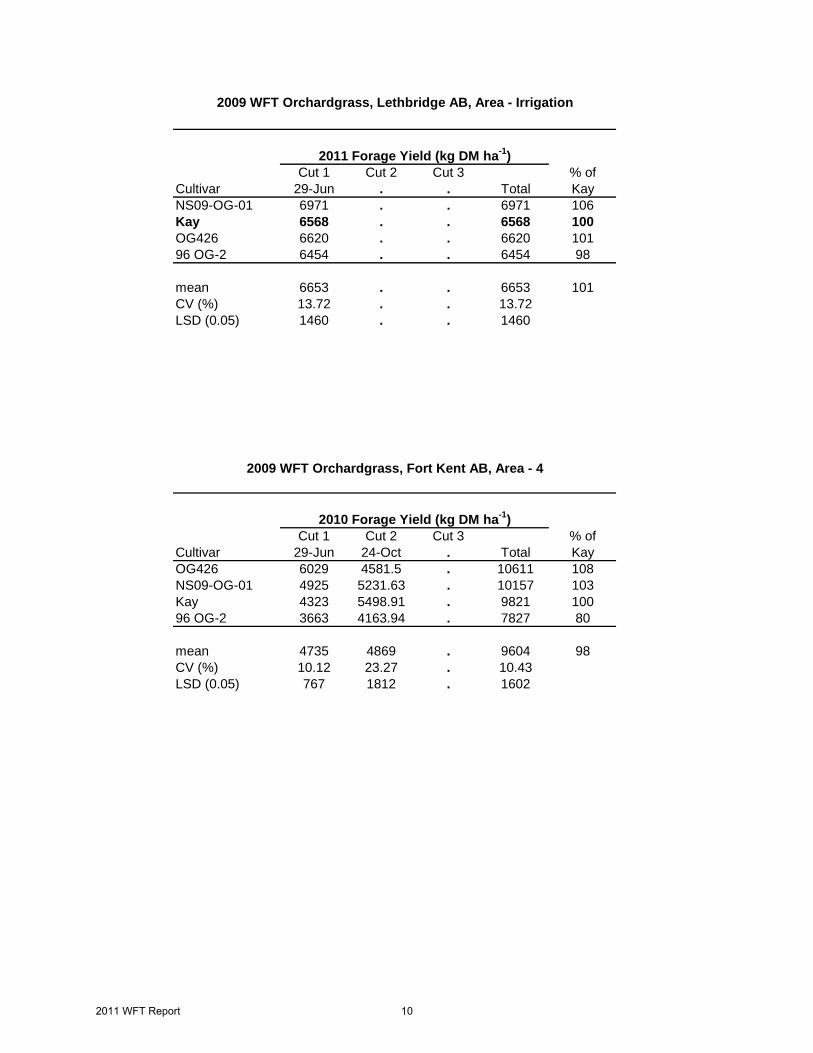
Cut 1 Cut 2 Cut 3 % ofCultivar 29-Jun . . Total KayNS09-OG-01 6971 . . 6971 106Kay 6568 . . 6568 100OG426 6620 . . 6620 10196 OG-2 6454 . . 6454 98
mean 6653 . . 6653 101CV (%) 13.72 . . 13.72LSD (0.05) 1460 . . 1460
Cut 1 Cut 2 Cut 3 % ofCultivar 29-Jun 24-Oct . Total KayOG426 6029 4581.5 . 10611 108NS09-OG-01 4925 5231 63 10157 103
2009 WFT Orchardgrass, Fort Kent AB, Area - 4
2010 Forage Yield (kg DM ha-1)
2011 Forage Yield (kg DM ha-1)
2009 WFT Orchardgrass, Lethbridge AB, Area - Irrigation
NS09-OG-01 4925 5231.63 . 10157 103Kay 4323 5498.91 . 9821 10096 OG-2 3663 4163.94 . 7827 80
mean 4735 4869 . 9604 98CV (%) 10.12 23.27 . 10.43LSD (0.05) 767 1812 . 1602
2011 WFT Report 10
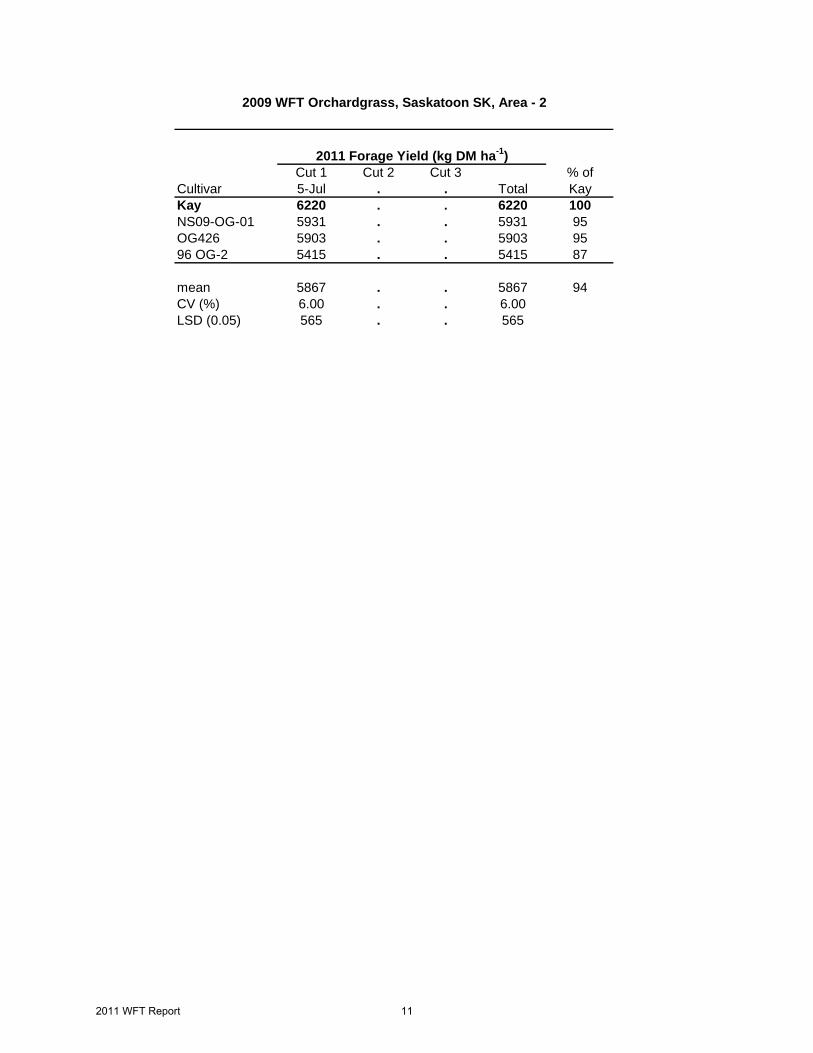
Cut 1 Cut 2 Cut 3 % ofCultivar 5-Jul . . Total KayKay 6220 . . 6220 100NS09-OG-01 5931 . . 5931 95OG426 5903 . . 5903 9596 OG-2 5415 . . 5415 87
mean 5867 . . 5867 94CV (%) 6.00 . . 6.00LSD (0.05) 565 . . 565
2009 WFT Orchardgrass, Saskatoon SK, Area - 2
2011 Forage Yield (kg DM ha-1)
2011 WFT Report 11
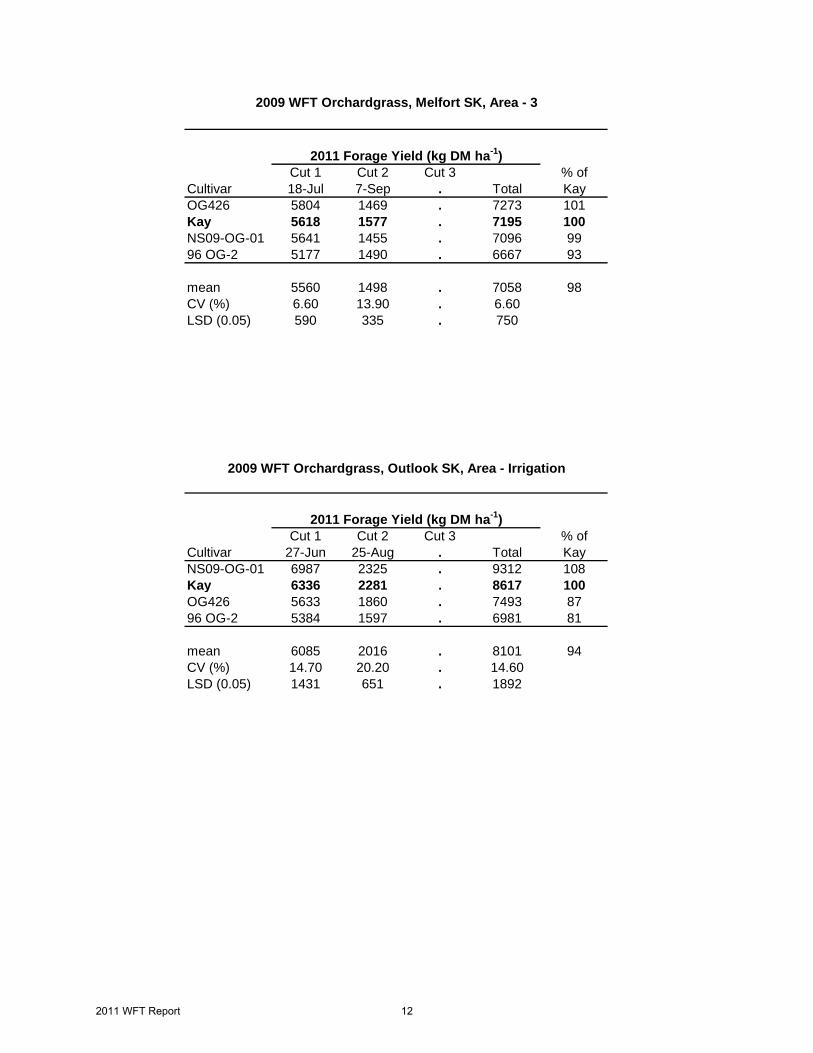
Cut 1 Cut 2 Cut 3 % ofCultivar 18-Jul 7-Sep . Total KayOG426 5804 1469 . 7273 101Kay 5618 1577 . 7195 100NS09-OG-01 5641 1455 . 7096 9996 OG-2 5177 1490 . 6667 93
mean 5560 1498 . 7058 98CV (%) 6.60 13.90 . 6.60LSD (0.05) 590 335 . 750
Cut 1 Cut 2 Cut 3 % ofCultivar 27-Jun 25-Aug . Total KayNS09-OG-01 6987 2325 . 9312 108Kay 6336 2281 8617 100
2009 WFT Orchardgrass, Outlook SK, Area - Irrigation
2011 Forage Yield (kg DM ha-1)
2011 Forage Yield (kg DM ha-1)
2009 WFT Orchardgrass, Melfort SK, Area - 3
Kay 6336 2281 . 8617 100OG426 5633 1860 . 7493 8796 OG-2 5384 1597 . 6981 81
mean 6085 2016 . 8101 94CV (%) 14.70 20.20 . 14.60LSD (0.05) 1431 651 . 1892
2011 WFT Report 12
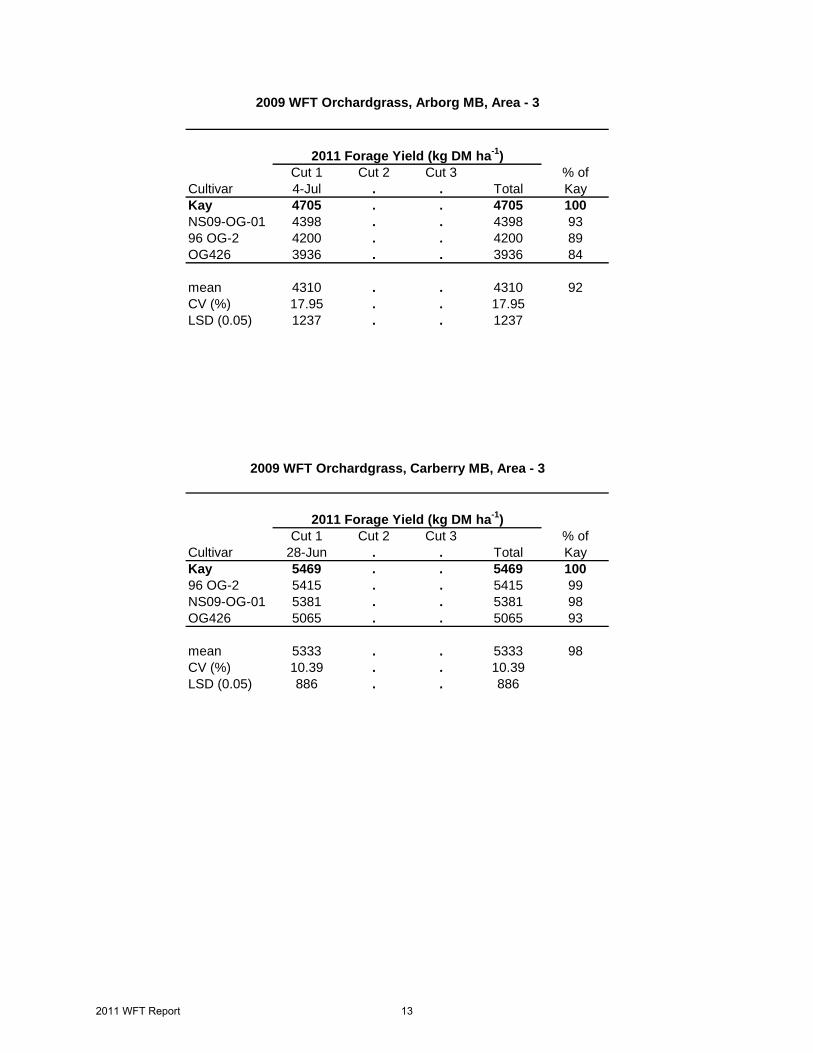
Cut 1 Cut 2 Cut 3 % ofCultivar 4-Jul . . Total KayKay 4705 . . 4705 100NS09-OG-01 4398 . . 4398 9396 OG-2 4200 . . 4200 89OG426 3936 . . 3936 84
mean 4310 . . 4310 92CV (%) 17.95 . . 17.95LSD (0.05) 1237 . . 1237
Cut 1 Cut 2 Cut 3 % ofCultivar 28-Jun . . Total KayKay 5469 . . 5469 10096 OG-2 5415 5415 99
2009 WFT Orchardgrass, Arborg MB, Area - 3
2011 Forage Yield (kg DM ha-1)
2009 WFT Orchardgrass, Carberry MB, Area - 3
2011 Forage Yield (kg DM ha-1)
96 OG-2 5415 . . 5415 99NS09-OG-01 5381 . . 5381 98OG426 5065 . . 5065 93
mean 5333 . . 5333 98CV (%) 10.39 . . 10.39LSD (0.05) 886 . . 886
2011 WFT Report 13

Cut 1 Cut 2 Cut 3 % ofCultivar 7-Jul . . Total KayNS09-OG-01 7176 . . 7176 106OG426 7030 . . 7030 104Kay 6762 . . 6762 10096 OG-2 6587 . . 6587 97
mean 6889 . . 6889 102CV (%) 20.78 . . 20.78LSD (0.05) 2290 . . 2290
Cut 1 Cut 2 Cut 3 % ofCultivar 13-Jul . . Total Kay96 OG-2 1727 . . 1727 120NS09-OG-01 1560 1560 108
2011 Forage Yield (kg DM ha-1)
2009 WFT Orchardgrass, Kelburn MB, Area - 3
2011 Forage Yield (kg DM ha-1)
2009 WFT Orchardgrass, Rosebank MB, Area - 3
NS09-OG-01 1560 . . 1560 108Kay 1438 . . 1438 100OG426 1292 . . 1292 90
mean 1504 . . 1504 105CV (%) 22.48 . . 22.48LSD (0.05) 541 . . 541
2011 WFT Report 14
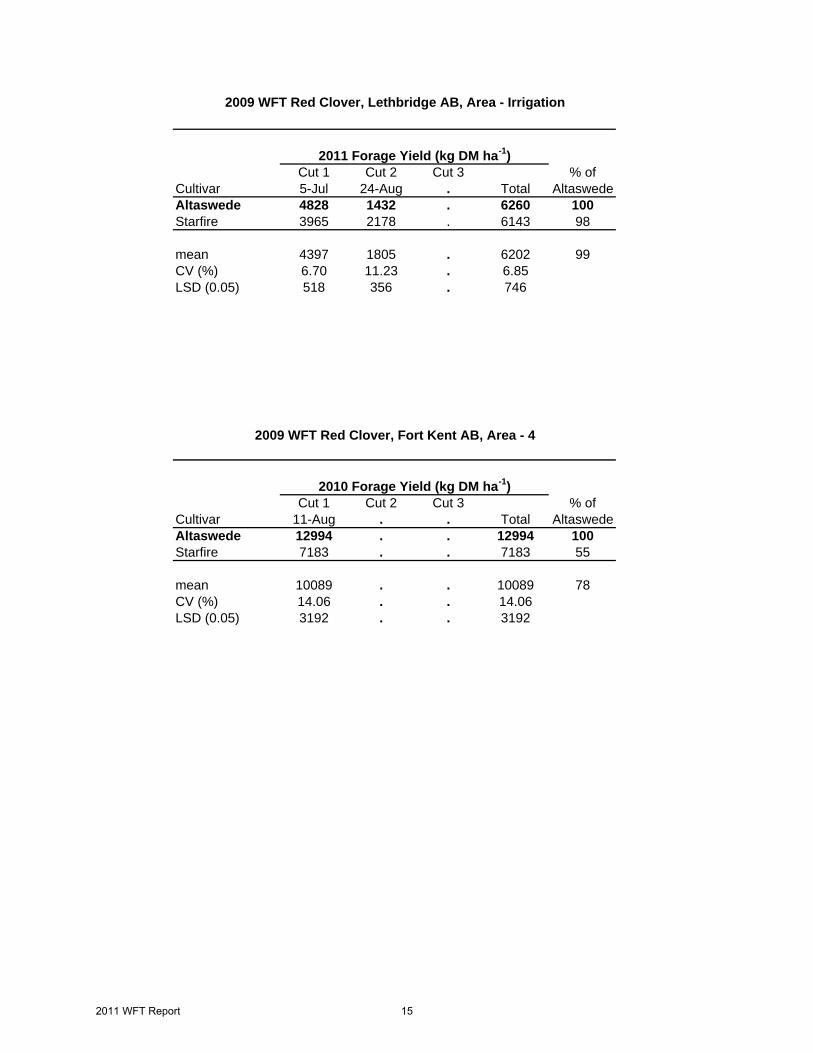
Cut 1 Cut 2 Cut 3 % ofCultivar 5-Jul 24-Aug . Total AltaswedeAltaswede 4828 1432 . 6260 100Starfire 3965 2178 . 6143 98
mean 4397 1805 . 6202 99CV (%) 6.70 11.23 . 6.85LSD (0.05) 518 356 . 746
Cut 1 Cut 2 Cut 3 % ofCultivar 11-Aug . . Total AltaswedeAltaswede 12994 . . 12994 100Starfire 7183 . . 7183 55
mean 10089 . . 10089 78CV (%) 14.06 . . 14.06LSD (0.05) 3192 . . 3192
2011 Forage Yield (kg DM ha-1)
2009 WFT Red Clover, Lethbridge AB, Area - Irrigation
2010 Forage Yield (kg DM ha-1)
2009 WFT Red Clover, Fort Kent AB, Area - 4
2011 WFT Report 15
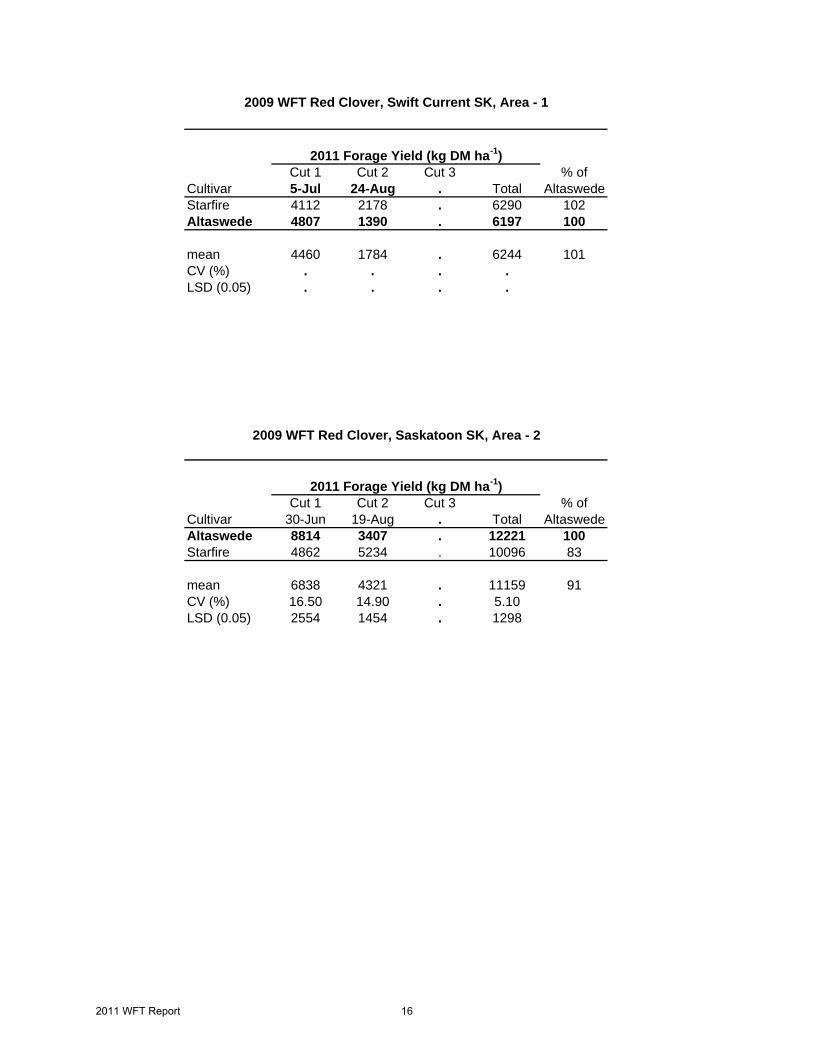
Cut 1 Cut 2 Cut 3 % ofCultivar 5-Jul 24-Aug . Total AltaswedeStarfire 4112 2178 . 6290 102Altaswede 4807 1390 . 6197 100
mean 4460 1784 . 6244 101CV (%) . . . .LSD (0.05) . . . .
Cut 1 Cut 2 Cut 3 % ofCultivar 30-Jun 19-Aug . Total AltaswedeAltaswede 8814 3407 . 12221 100Starfire 4862 5234 . 10096 83
mean 6838 4321 . 11159 91CV (%) 16.50 14.90 . 5.10LSD (0.05) 2554 1454 . 1298
2009 WFT Red Clover, Swift Current SK, Area - 1
2011 Forage Yield (kg DM ha-1)
2009 WFT Red Clover, Saskatoon SK, Area - 2
2011 Forage Yield (kg DM ha-1)
2011 WFT Report 16
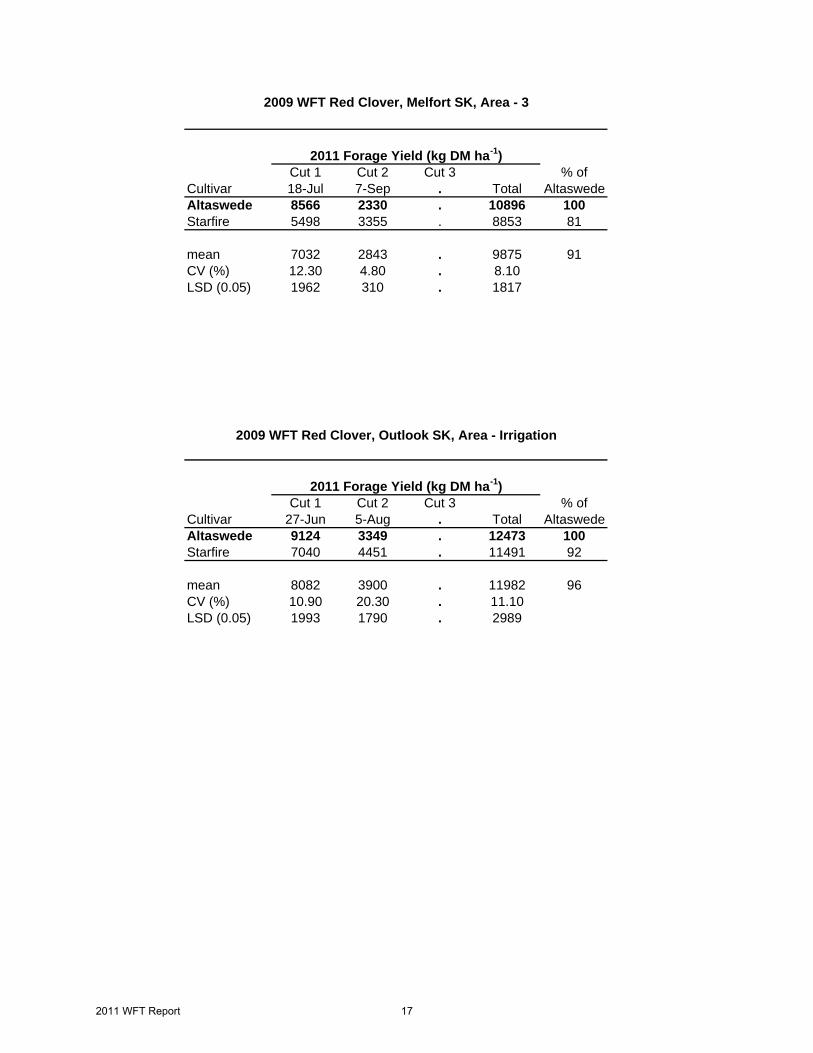
Cut 1 Cut 2 Cut 3 % ofCultivar 18-Jul 7-Sep . Total AltaswedeAltaswede 8566 2330 . 10896 100Starfire 5498 3355 . 8853 81
mean 7032 2843 . 9875 91CV (%) 12.30 4.80 . 8.10LSD (0.05) 1962 310 . 1817
Cut 1 Cut 2 Cut 3 % ofCultivar 27-Jun 5-Aug . Total AltaswedeAltaswede 9124 3349 . 12473 100Starfire 7040 4451 . 11491 92
mean 8082 3900 . 11982 96CV (%) 10.90 20.30 . 11.10LSD (0.05) 1993 1790 . 2989
2009 WFT Red Clover, Melfort SK, Area - 3
2011 Forage Yield (kg DM ha-1)
2009 WFT Red Clover, Outlook SK, Area - Irrigation
2011 Forage Yield (kg DM ha-1)
2011 WFT Report 17
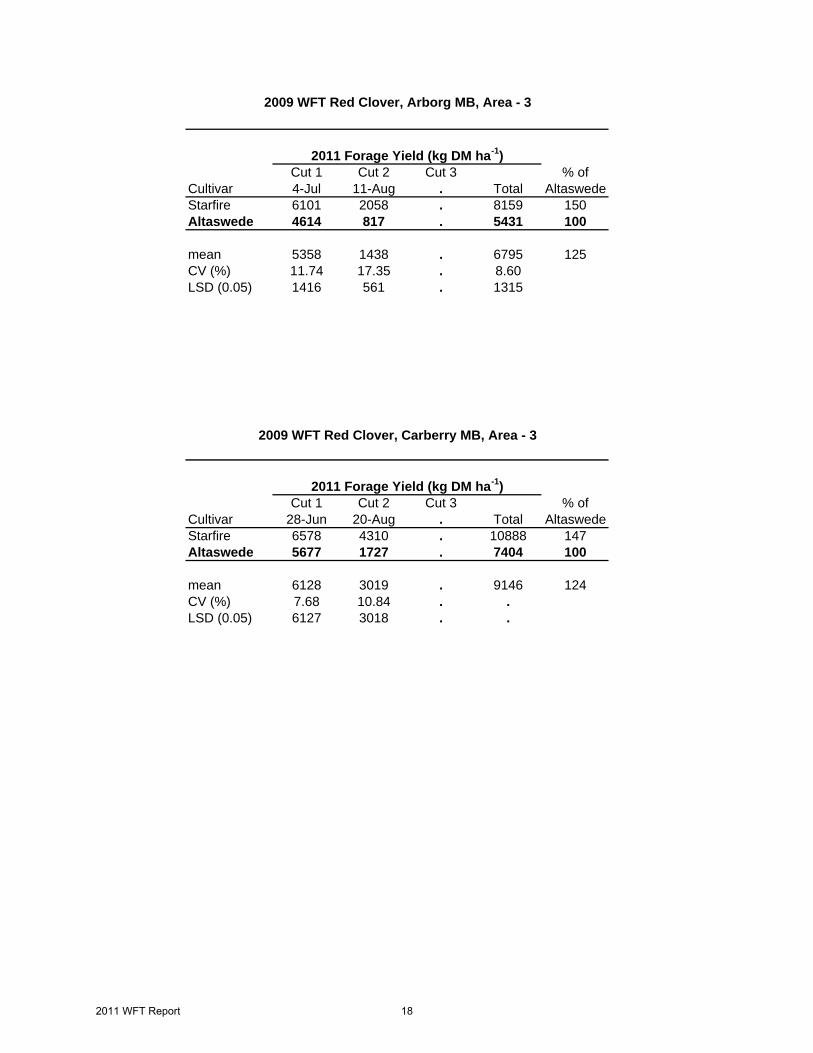
Cut 1 Cut 2 Cut 3 % ofCultivar 4-Jul 11-Aug . Total AltaswedeStarfire 6101 2058 . 8159 150Altaswede 4614 817 . 5431 100
mean 5358 1438 . 6795 125CV (%) 11.74 17.35 . 8.60LSD (0.05) 1416 561 . 1315
Cut 1 Cut 2 Cut 3 % ofCultivar 28-Jun 20-Aug . Total AltaswedeStarfire 6578 4310 . 10888 147Altaswede 5677 1727 . 7404 100
mean 6128 3019 . 9146 124CV (%) 7.68 10.84 . .LSD (0.05) 6127 3018 . .
2009 WFT Red Clover, Arborg MB, Area - 3
2011 Forage Yield (kg DM ha-1)
2009 WFT Red Clover, Carberry MB, Area - 3
2011 Forage Yield (kg DM ha-1)
2011 WFT Report 18
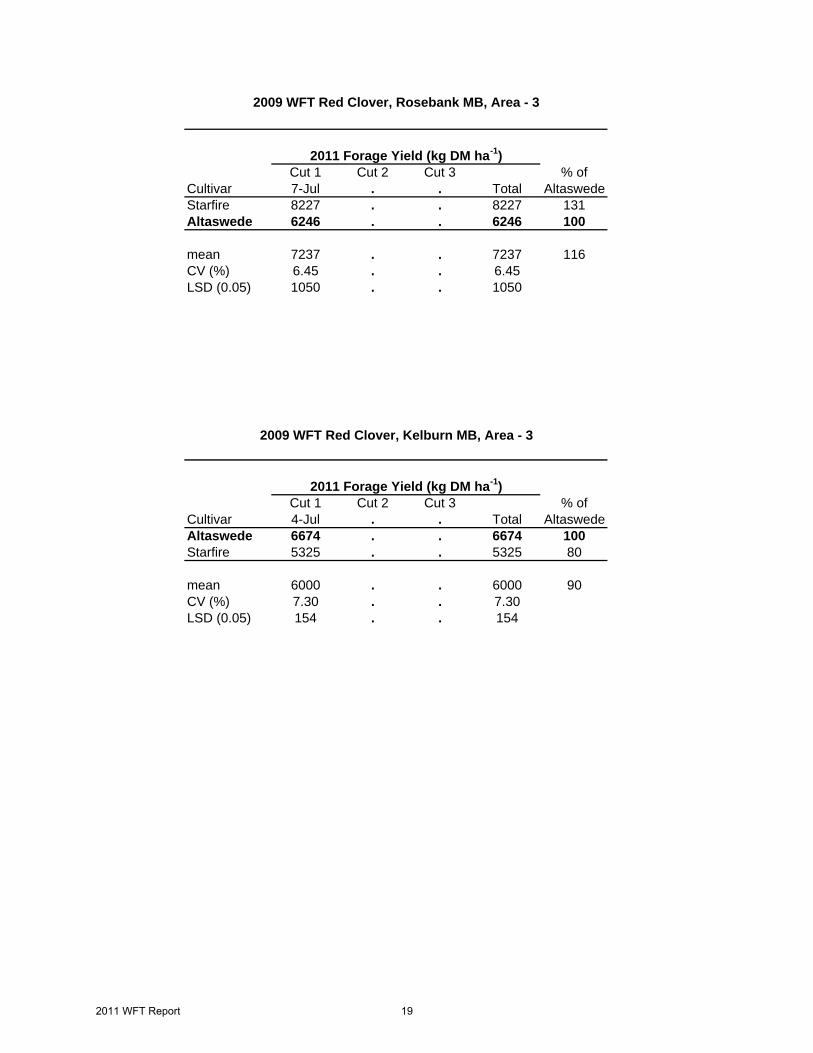
Cut 1 Cut 2 Cut 3 % ofCultivar 7-Jul . . Total AltaswedeStarfire 8227 . . 8227 131Altaswede 6246 . . 6246 100
mean 7237 . . 7237 116CV (%) 6.45 . . 6.45LSD (0.05) 1050 . . 1050
Cut 1 Cut 2 Cut 3 % ofCultivar 4-Jul . . Total AltaswedeAltaswede 6674 . . 6674 100Starfire 5325 . . 5325 80
mean 6000 . . 6000 90CV (%) 7.30 . . 7.30LSD (0.05) 154 . . 154
2009 WFT Red Clover, Kelburn MB, Area - 3
2011 Forage Yield (kg DM ha-1)
2009 WFT Red Clover, Rosebank MB, Area - 3
2011 Forage Yield (kg DM ha-1)
2011 WFT Report 19
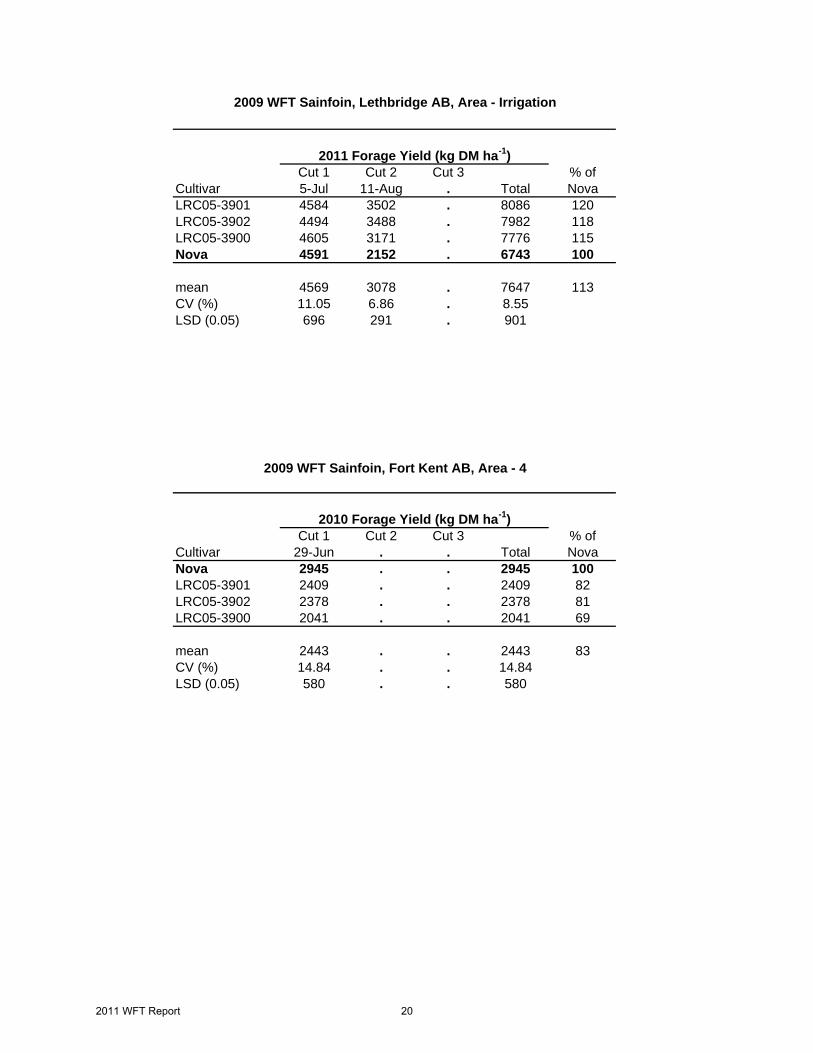
Cut 1 Cut 2 Cut 3 % ofCultivar 5-Jul 11-Aug . Total NovaLRC05-3901 4584 3502 . 8086 120LRC05-3902 4494 3488 . 7982 118LRC05-3900 4605 3171 . 7776 115Nova 4591 2152 . 6743 100
mean 4569 3078 . 7647 113CV (%) 11.05 6.86 . 8.55LSD (0.05) 696 291 . 901
Cut 1 Cut 2 Cut 3 % ofCultivar 29-Jun . . Total NovaNova 2945 . . 2945 100LRC05-3901 2409 . . 2409 82LRC05-3902 2378 . . 2378 81LRC05-3900 2041 . . 2041 69
mean 2443 . . 2443 83CV (%) 14.84 . . 14.84LSD (0.05) 580 . . 580
2011 Forage Yield (kg DM ha-1)
2009 WFT Sainfoin, Lethbridge AB, Area - Irrigation
2010 Forage Yield (kg DM ha-1)
2009 WFT Sainfoin, Fort Kent AB, Area - 4
2011 WFT Report 20
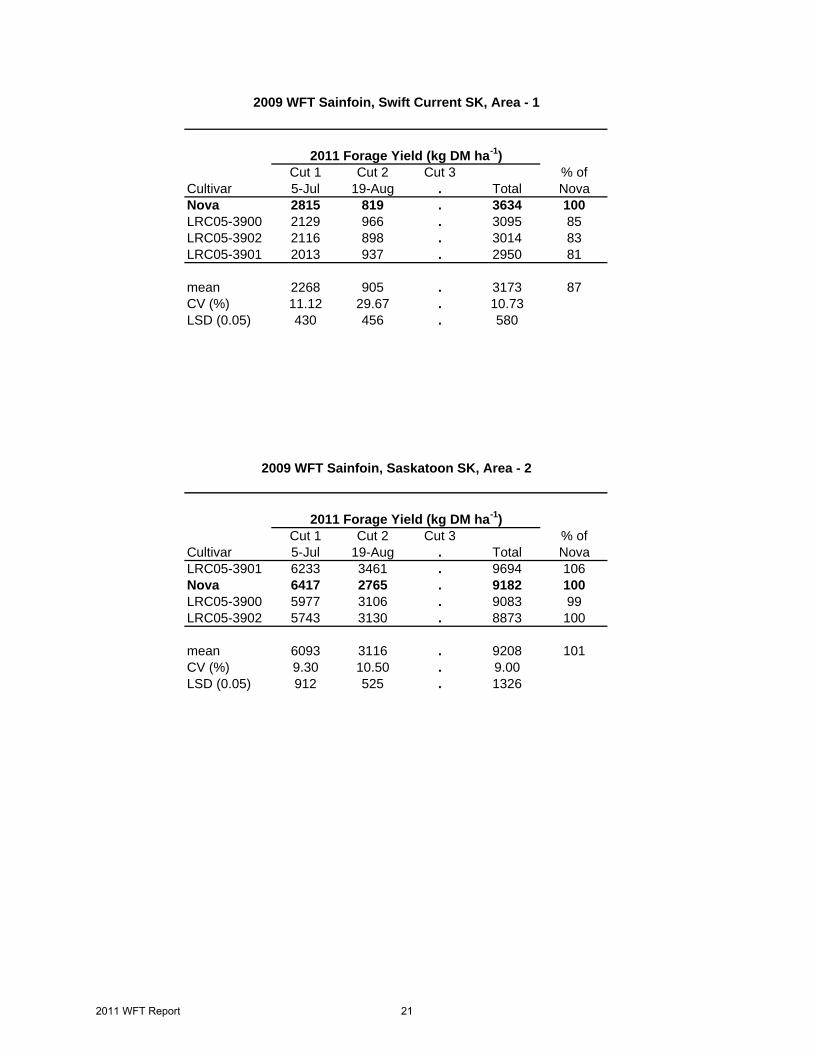
Cut 1 Cut 2 Cut 3 % ofCultivar 5-Jul 19-Aug . Total NovaNova 2815 819 . 3634 100LRC05-3900 2129 966 . 3095 85LRC05-3902 2116 898 . 3014 83LRC05-3901 2013 937 . 2950 81
mean 2268 905 . 3173 87CV (%) 11.12 29.67 . 10.73LSD (0.05) 430 456 . 580
Cut 1 Cut 2 Cut 3 % ofCultivar 5-Jul 19-Aug . Total NovaLRC05-3901 6233 3461 . 9694 106Nova 6417 2765 . 9182 100LRC05-3900 5977 3106 . 9083 99LRC05-3902 5743 3130 . 8873 100
mean 6093 3116 . 9208 101CV (%) 9.30 10.50 . 9.00LSD (0.05) 912 525 . 1326
2009 WFT Sainfoin, Saskatoon SK, Area - 2
2011 Forage Yield (kg DM ha-1)
2009 WFT Sainfoin, Swift Current SK, Area - 1
2011 Forage Yield (kg DM ha-1)
2011 WFT Report 21
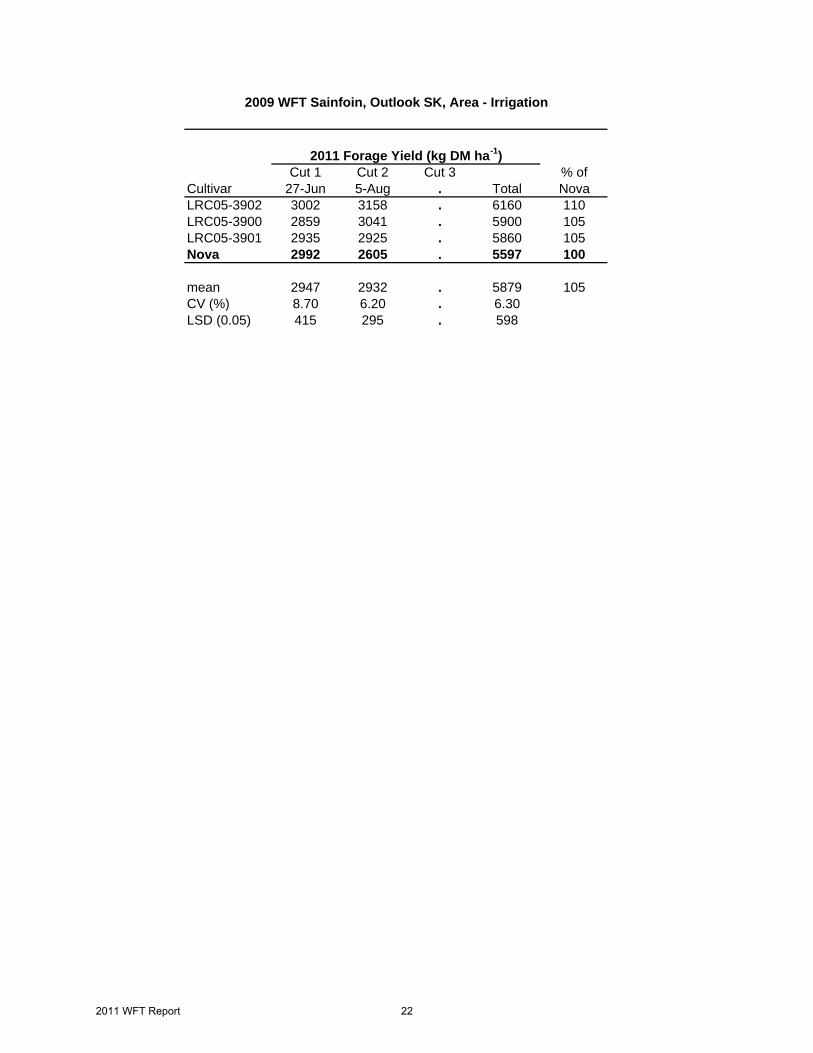
Cut 1 Cut 2 Cut 3 % ofCultivar 27-Jun 5-Aug . Total NovaLRC05-3902 3002 3158 . 6160 110LRC05-3900 2859 3041 . 5900 105LRC05-3901 2935 2925 . 5860 105Nova 2992 2605 . 5597 100
mean 2947 2932 . 5879 105CV (%) 8.70 6.20 . 6.30LSD (0.05) 415 295 . 598
2009 WFT Sainfoin, Outlook SK, Area - Irrigation
2011 Forage Yield (kg DM ha-1)
2011 WFT Report 22
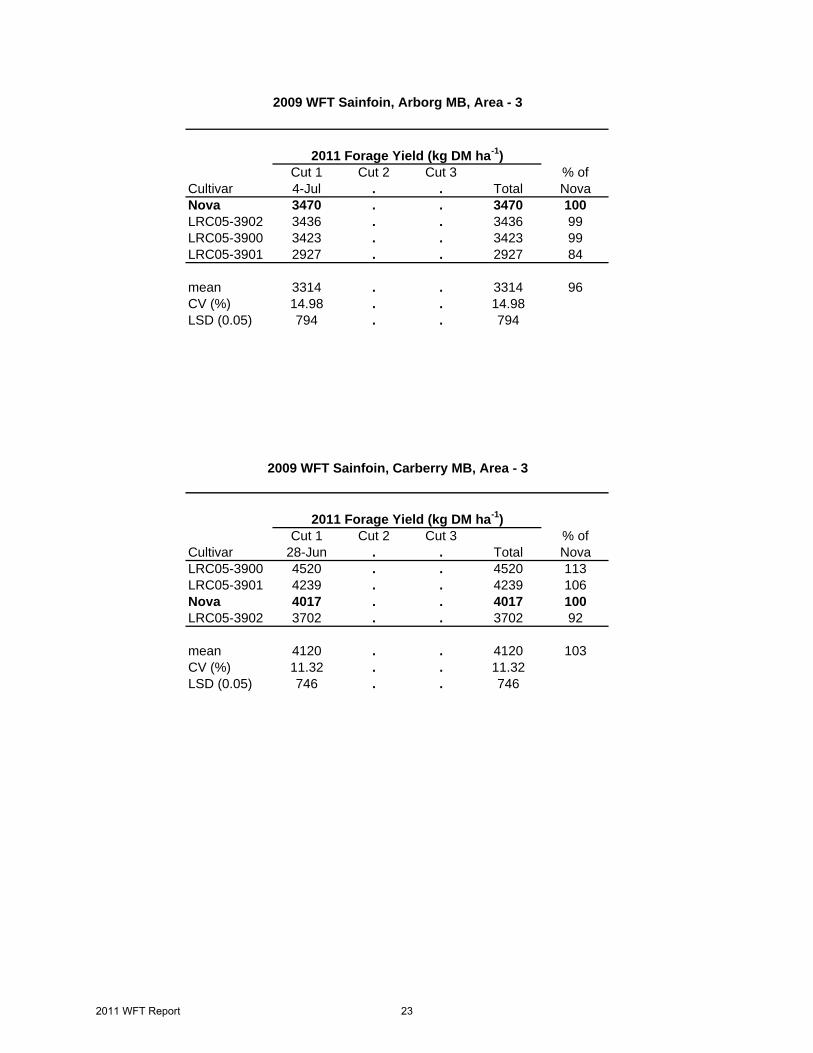
Cut 1 Cut 2 Cut 3 % ofCultivar 4-Jul . . Total NovaNova 3470 . . 3470 100LRC05-3902 3436 . . 3436 99LRC05-3900 3423 . . 3423 99LRC05-3901 2927 . . 2927 84
mean 3314 . . 3314 96CV (%) 14.98 . . 14.98LSD (0.05) 794 . . 794
Cut 1 Cut 2 Cut 3 % ofCultivar 28-Jun . . Total NovaLRC05-3900 4520 . . 4520 113LRC05-3901 4239 . . 4239 106Nova 4017 . . 4017 100LRC05-3902 3702 . . 3702 92
mean 4120 . . 4120 103CV (%) 11.32 . . 11.32LSD (0.05) 746 . . 746
2009 WFT Sainfoin, Carberry MB, Area - 3
2011 Forage Yield (kg DM ha-1)
2009 WFT Sainfoin, Arborg MB, Area - 3
2011 Forage Yield (kg DM ha-1)
2011 WFT Report 23

Cut 1 Cut 2 Cut 3 % ofCultivar 7-Jul . . Total NovaLRC05-3901 3374 . . 3374 101Nova 3335 . . 3335 100LRC05-3900 2511 . . 2511 75LRC05-3902 2439 . . 2439 73
mean 2915 . . 2915 87CV (%) 42.43 . . 42.43LSD (0.05) 2471 . . 2471
Cut 1 Cut 2 Cut 3 % ofCultivar 13-Jul . . Total NovaNova 3023 . . 3023 100LRC05-3902 2827 . . 2827 94LRC05-3900 2364 . . 2364 78LRC05-3901 1906 . . 1906 63
mean 2530 . . 2530 84CV (%) 24.37 . . 24.37LSD (0.05) 1232 . . 1232
2009 WFT Sainfoin, Kelburn MB, Area - 3
2011 Forage Yield (kg DM ha-1)
2009 WFT Sainfoin, Rosebank MB, Area - 3
2011 Forage Yield (kg DM ha-1)
2011 WFT Report 24

2011 WFT Report 25
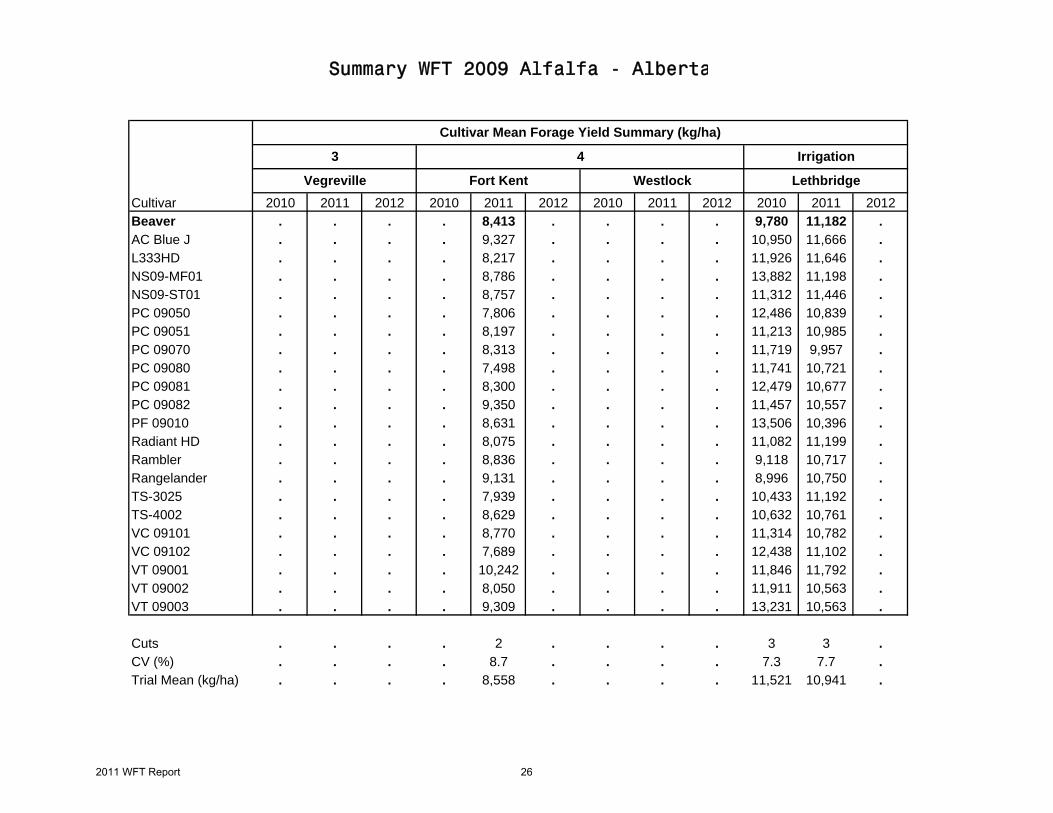
Cultivar 2010 2011 2012 2010 2011 2012 2010 2011 2012 2010 2011 2012Beaver . . . . 8,413 . . . . 9,780 11,182 .AC Blue J . . . . 9,327 . . . . 10,950 11,666 .L333HD . . . . 8,217 . . . . 11,926 11,646 .NS09-MF01 . . . . 8,786 . . . . 13,882 11,198 .NS09-ST01 . . . . 8,757 . . . . 11,312 11,446 .PC 09050 . . . . 7,806 . . . . 12,486 10,839 .PC 09051 . . . . 8,197 . . . . 11,213 10,985 .PC 09070 . . . . 8,313 . . . . 11,719 9,957 .PC 09080 . . . . 7,498 . . . . 11,741 10,721 .PC 09081 . . . . 8,300 . . . . 12,479 10,677 .PC 09082 . . . . 9,350 . . . . 11,457 10,557 .PF 09010 . . . . 8,631 . . . . 13,506 10,396 .Radiant HD . . . . 8,075 . . . . 11,082 11,199 .Rambler . . . . 8,836 . . . . 9,118 10,717 .Rangelander . . . . 9,131 . . . . 8,996 10,750 .TS-3025 . . . . 7,939 . . . . 10,433 11,192 .TS-4002 . . . . 8,629 . . . . 10,632 10,761 .VC 09101 . . . . 8,770 . . . . 11,314 10,782 .VC 09102 . . . . 7,689 . . . . 12,438 11,102 .VT 09001 . . . . 10,242 . . . . 11,846 11,792 .VT 09002 . . . . 8,050 . . . . 11,911 10,563 .VT 09003 . . . . 9,309 . . . . 13,231 10,563 .
Cuts . . . . 2 . . . . 3 3 .CV (%) . . . . 8.7 . . . . 7.3 7.7 .Trial Mean (kg/ha) . . . . 8,558 . . . . 11,521 10,941 .
Summary WFT 2009 Alfalfa - Alberta
Fort KentVegreville LethbridgeWestlock
Cultivar Mean Forage Yield Summary (kg/ha)
Irrigation3 4
2011 WFT Report 26
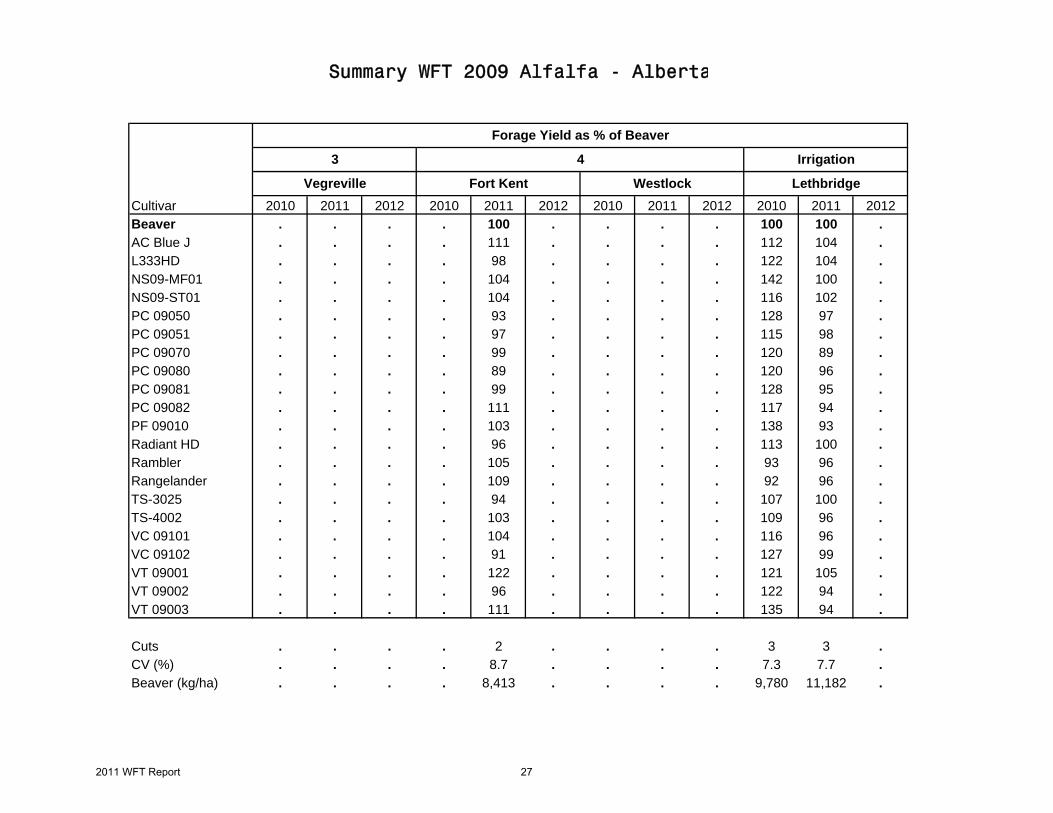
Cultivar 2010 2011 2012 2010 2011 2012 2010 2011 2012 2010 2011 2012Beaver . . . . 100 . . . . 100 100 .AC Blue J . . . . 111 . . . . 112 104 .L333HD . . . . 98 . . . . 122 104 .NS09-MF01 . . . . 104 . . . . 142 100 .NS09-ST01 . . . . 104 . . . . 116 102 .PC 09050 . . . . 93 . . . . 128 97 .PC 09051 . . . . 97 . . . . 115 98 .PC 09070 . . . . 99 . . . . 120 89 .PC 09080 . . . . 89 . . . . 120 96 .PC 09081 . . . . 99 . . . . 128 95 .PC 09082 . . . . 111 . . . . 117 94 .PF 09010 . . . . 103 . . . . 138 93 .Radiant HD . . . . 96 . . . . 113 100 .Rambler . . . . 105 . . . . 93 96 .Rangelander . . . . 109 . . . . 92 96 .TS-3025 . . . . 94 . . . . 107 100 .TS-4002 . . . . 103 . . . . 109 96 .VC 09101 . . . . 104 . . . . 116 96 .VC 09102 . . . . 91 . . . . 127 99 .VT 09001 . . . . 122 . . . . 121 105 .VT 09002 . . . . 96 . . . . 122 94 .VT 09003 . . . . 111 . . . . 135 94 .
Cuts . . . . 2 . . . . 3 3 .CV (%) . . . . 8.7 . . . . 7.3 7.7 .Beaver (kg/ha) . . . . 8,413 . . . . 9,780 11,182 .
Forage Yield as % of Beaver
Summary WFT 2009 Alfalfa - Alberta
Lethbridge
Irrigation
Vegreville Fort Kent Westlock
3 4
2011 WFT Report 27
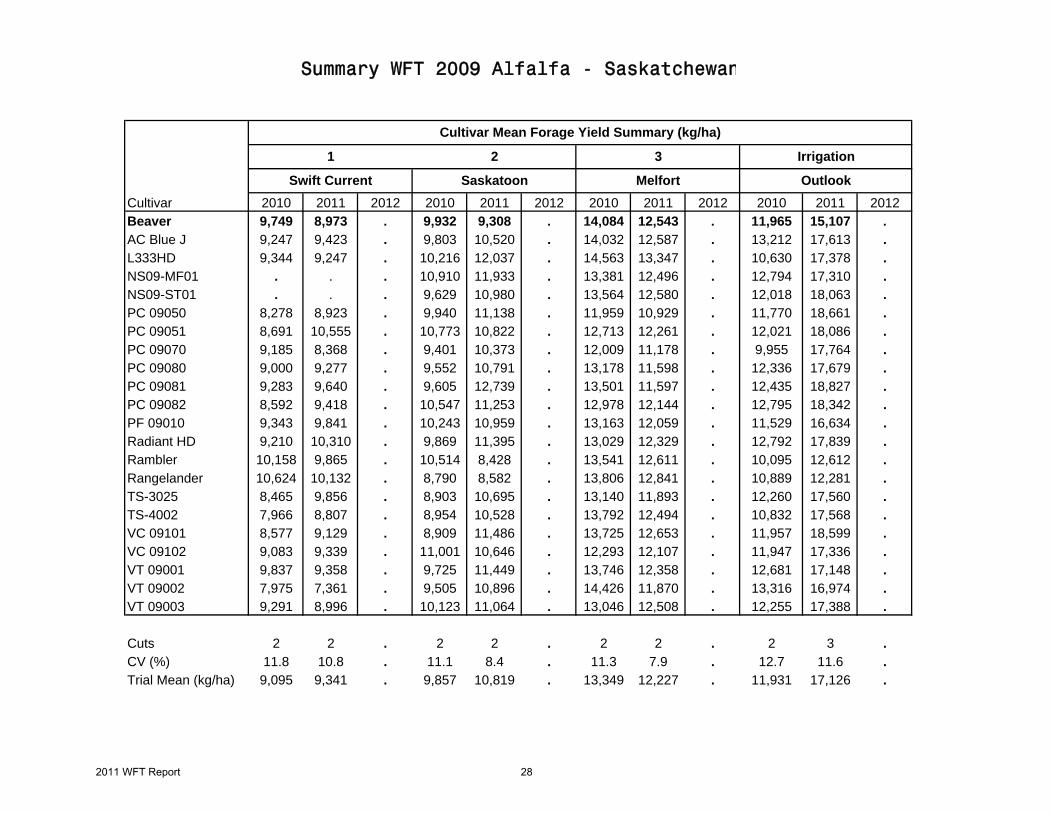
Cultivar 2010 2011 2012 2010 2011 2012 2010 2011 2012 2010 2011 2012Beaver 9,749 8,973 . 9,932 9,308 . 14,084 12,543 . 11,965 15,107 .AC Blue J 9,247 9,423 . 9,803 10,520 . 14,032 12,587 . 13,212 17,613 .L333HD 9,344 9,247 . 10,216 12,037 . 14,563 13,347 . 10,630 17,378 .NS09-MF01 . . . 10,910 11,933 . 13,381 12,496 . 12,794 17,310 .NS09-ST01 . . . 9,629 10,980 . 13,564 12,580 . 12,018 18,063 .PC 09050 8,278 8,923 . 9,940 11,138 . 11,959 10,929 . 11,770 18,661 .PC 09051 8,691 10,555 . 10,773 10,822 . 12,713 12,261 . 12,021 18,086 .PC 09070 9,185 8,368 . 9,401 10,373 . 12,009 11,178 . 9,955 17,764 .PC 09080 9,000 9,277 . 9,552 10,791 . 13,178 11,598 . 12,336 17,679 .PC 09081 9,283 9,640 . 9,605 12,739 . 13,501 11,597 . 12,435 18,827 .PC 09082 8,592 9,418 . 10,547 11,253 . 12,978 12,144 . 12,795 18,342 .PF 09010 9,343 9,841 . 10,243 10,959 . 13,163 12,059 . 11,529 16,634 .Radiant HD 9,210 10,310 . 9,869 11,395 . 13,029 12,329 . 12,792 17,839 .Rambler 10,158 9,865 . 10,514 8,428 . 13,541 12,611 . 10,095 12,612 .Rangelander 10,624 10,132 . 8,790 8,582 . 13,806 12,841 . 10,889 12,281 .TS-3025 8,465 9,856 . 8,903 10,695 . 13,140 11,893 . 12,260 17,560 .TS-4002 7,966 8,807 . 8,954 10,528 . 13,792 12,494 . 10,832 17,568 .VC 09101 8,577 9,129 . 8,909 11,486 . 13,725 12,653 . 11,957 18,599 .VC 09102 9,083 9,339 . 11,001 10,646 . 12,293 12,107 . 11,947 17,336 .VT 09001 9,837 9,358 . 9,725 11,449 . 13,746 12,358 . 12,681 17,148 .VT 09002 7,975 7,361 . 9,505 10,896 . 14,426 11,870 . 13,316 16,974 .VT 09003 9,291 8,996 . 10,123 11,064 . 13,046 12,508 . 12,255 17,388 .
Cuts 2 2 . 2 2 . 2 2 . 2 3 .CV (%) 11.8 10.8 . 11.1 8.4 . 11.3 7.9 . 12.7 11.6 .Trial Mean (kg/ha) 9,095 9,341 . 9,857 10,819 . 13,349 12,227 . 11,931 17,126 .
Saskatoon Melfort OutlookSwift Current
Summary WFT 2009 Alfalfa - Saskatchewan
31 2
Cultivar Mean Forage Yield Summary (kg/ha)
Irrigation
2011 WFT Report 28
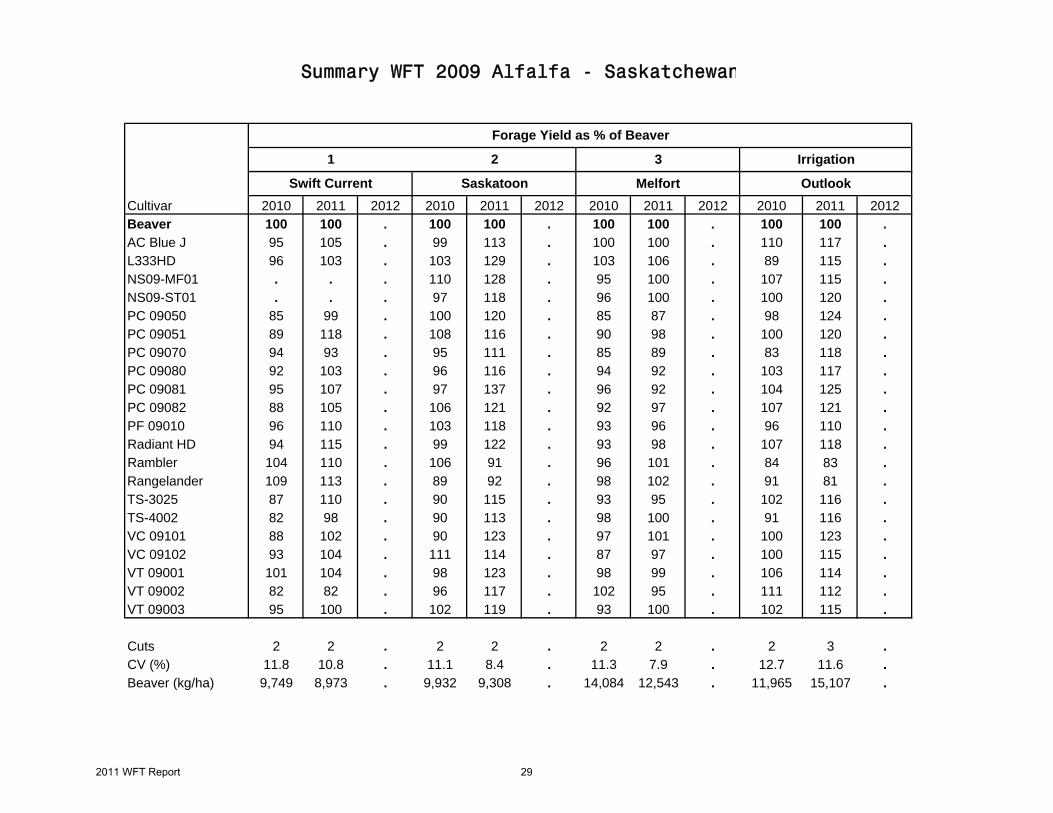
Cultivar 2010 2011 2012 2010 2011 2012 2010 2011 2012 2010 2011 2012Beaver 100 100 . 100 100 . 100 100 . 100 100 .AC Blue J 95 105 . 99 113 . 100 100 . 110 117 .L333HD 96 103 . 103 129 . 103 106 . 89 115 .NS09-MF01 . . . 110 128 . 95 100 . 107 115 .NS09-ST01 . . . 97 118 . 96 100 . 100 120 .PC 09050 85 99 . 100 120 . 85 87 . 98 124 .PC 09051 89 118 . 108 116 . 90 98 . 100 120 .PC 09070 94 93 . 95 111 . 85 89 . 83 118 .PC 09080 92 103 . 96 116 . 94 92 . 103 117 .PC 09081 95 107 . 97 137 . 96 92 . 104 125 .PC 09082 88 105 . 106 121 . 92 97 . 107 121 .PF 09010 96 110 . 103 118 . 93 96 . 96 110 .Radiant HD 94 115 . 99 122 . 93 98 . 107 118 .Rambler 104 110 . 106 91 . 96 101 . 84 83 .Rangelander 109 113 . 89 92 . 98 102 . 91 81 .TS-3025 87 110 . 90 115 . 93 95 . 102 116 .TS-4002 82 98 . 90 113 . 98 100 . 91 116 .VC 09101 88 102 . 90 123 . 97 101 . 100 123 .VC 09102 93 104 . 111 114 . 87 97 . 100 115 .VT 09001 101 104 . 98 123 . 98 99 . 106 114 .VT 09002 82 82 . 96 117 . 102 95 . 111 112 .VT 09003 95 100 . 102 119 . 93 100 . 102 115 .
Cuts 2 2 . 2 2 . 2 2 . 2 3 .CV (%) 11.8 10.8 . 11.1 8.4 . 11.3 7.9 . 12.7 11.6 .Beaver (kg/ha) 9,749 8,973 . 9,932 9,308 . 14,084 12,543 . 11,965 15,107 .
Swift Current Saskatoon
21
Forage Yield as % of Beaver
Summary WFT 2009 Alfalfa - Saskatchewan
3
Melfort
Irrigation
Outlook
2011 WFT Report 29
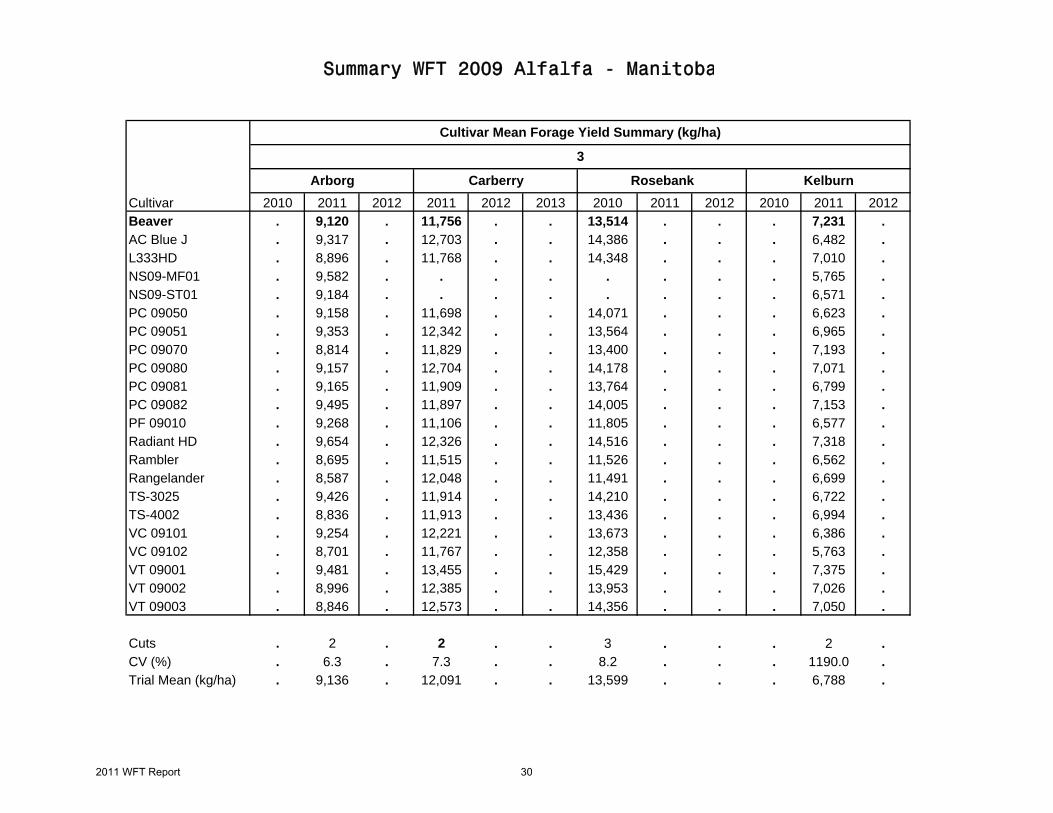
Cultivar 2010 2011 2012 2011 2012 2013 2010 2011 2012 2010 2011 2012Beaver . 9,120 . 11,756 . . 13,514 . . . 7,231 .AC Blue J . 9,317 . 12,703 . . 14,386 . . . 6,482 .L333HD . 8,896 . 11,768 . . 14,348 . . . 7,010 .NS09-MF01 . 9,582 . . . . . . . . 5,765 .NS09-ST01 . 9,184 . . . . . . . . 6,571 .PC 09050 . 9,158 . 11,698 . . 14,071 . . . 6,623 .PC 09051 . 9,353 . 12,342 . . 13,564 . . . 6,965 .PC 09070 . 8,814 . 11,829 . . 13,400 . . . 7,193 .PC 09080 . 9,157 . 12,704 . . 14,178 . . . 7,071 .PC 09081 . 9,165 . 11,909 . . 13,764 . . . 6,799 .PC 09082 . 9,495 . 11,897 . . 14,005 . . . 7,153 .PF 09010 . 9,268 . 11,106 . . 11,805 . . . 6,577 .Radiant HD . 9,654 . 12,326 . . 14,516 . . . 7,318 .Rambler . 8,695 . 11,515 . . 11,526 . . . 6,562 .Rangelander . 8,587 . 12,048 . . 11,491 . . . 6,699 .TS-3025 . 9,426 . 11,914 . . 14,210 . . . 6,722 .TS-4002 . 8,836 . 11,913 . . 13,436 . . . 6,994 .VC 09101 . 9,254 . 12,221 . . 13,673 . . . 6,386 .VC 09102 . 8,701 . 11,767 . . 12,358 . . . 5,763 .VT 09001 . 9,481 . 13,455 . . 15,429 . . . 7,375 .VT 09002 . 8,996 . 12,385 . . 13,953 . . . 7,026 .VT 09003 . 8,846 . 12,573 . . 14,356 . . . 7,050 .
Cuts . 2 . 2 . . 3 . . . 2 .CV (%) . 6.3 . 7.3 . . 8.2 . . . 1190.0 .Trial Mean (kg/ha) . 9,136 . 12,091 . . 13,599 . . . 6,788 .
Arborg Rosebank KelburnCarberry
3
Cultivar Mean Forage Yield Summary (kg/ha)
Summary WFT 2009 Alfalfa - Manitoba
2011 WFT Report 30
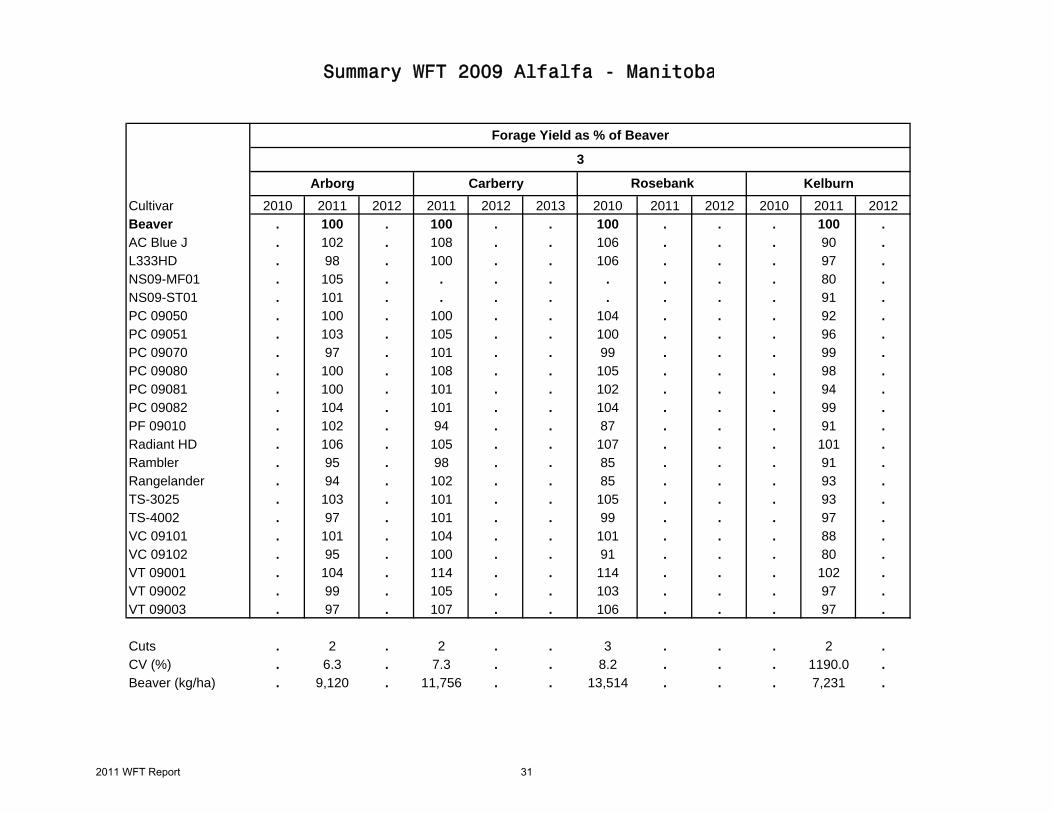
Cultivar 2010 2011 2012 2011 2012 2013 2010 2011 2012 2010 2011 2012Beaver . 100 . 100 . . 100 . . . 100 .AC Blue J . 102 . 108 . . 106 . . . 90 .L333HD . 98 . 100 . . 106 . . . 97 .NS09-MF01 . 105 . . . . . . . . 80 .NS09-ST01 . 101 . . . . . . . . 91 .PC 09050 . 100 . 100 . . 104 . . . 92 .PC 09051 . 103 . 105 . . 100 . . . 96 .PC 09070 . 97 . 101 . . 99 . . . 99 .PC 09080 . 100 . 108 . . 105 . . . 98 .PC 09081 . 100 . 101 . . 102 . . . 94 .PC 09082 . 104 . 101 . . 104 . . . 99 .PF 09010 . 102 . 94 . . 87 . . . 91 .Radiant HD . 106 . 105 . . 107 . . . 101 .Rambler . 95 . 98 . . 85 . . . 91 .Rangelander . 94 . 102 . . 85 . . . 93 .TS-3025 . 103 . 101 . . 105 . . . 93 .TS-4002 . 97 . 101 . . 99 . . . 97 .VC 09101 . 101 . 104 . . 101 . . . 88 .VC 09102 . 95 . 100 . . 91 . . . 80 .VT 09001 . 104 . 114 . . 114 . . . 102 .VT 09002 . 99 . 105 . . 103 . . . 97 .VT 09003 . 97 . 107 . . 106 . . . 97 .
Cuts . 2 . 2 . . 3 . . . 2 .CV (%) . 6.3 . 7.3 . . 8.2 . . . 1190.0 .Beaver (kg/ha) . 9,120 . 11,756 . . 13,514 . . . 7,231 .
Rosebank KelburnArborg
3
Carberry
Forage Yield as % of Beaver
Summary WFT 2009 Alfalfa - Manitoba
2011 WFT Report 31
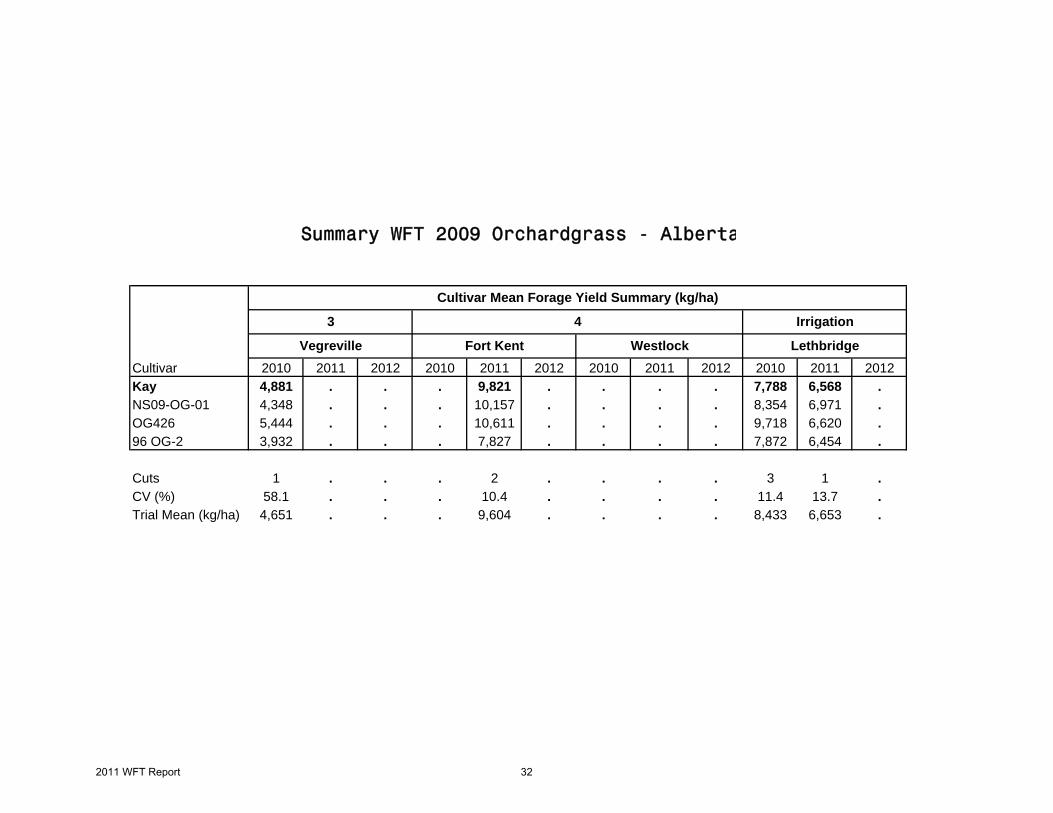
Cultivar 2010 2011 2012 2010 2011 2012 2010 2011 2012 2010 2011 2012Kay 4,881 . . . 9,821 . . . . 7,788 6,568 .NS09-OG-01 4,348 . . . 10,157 . . . . 8,354 6,971 .OG426 5,444 . . . 10,611 . . . . 9,718 6,620 .96 OG-2 3,932 . . . 7,827 . . . . 7,872 6,454 .
Cuts 1 . . . 2 . . . . 3 1 .CV (%) 58.1 . . . 10.4 . . . . 11.4 13.7 .Trial Mean (kg/ha) 4,651 . . . 9,604 . . . . 8,433 6,653 .
3 4 Irrigation
Summary WFT 2009 Orchardgrass - Alberta
Fort KentVegreville LethbridgeWestlock
Cultivar Mean Forage Yield Summary (kg/ha)
2011 WFT Report 32
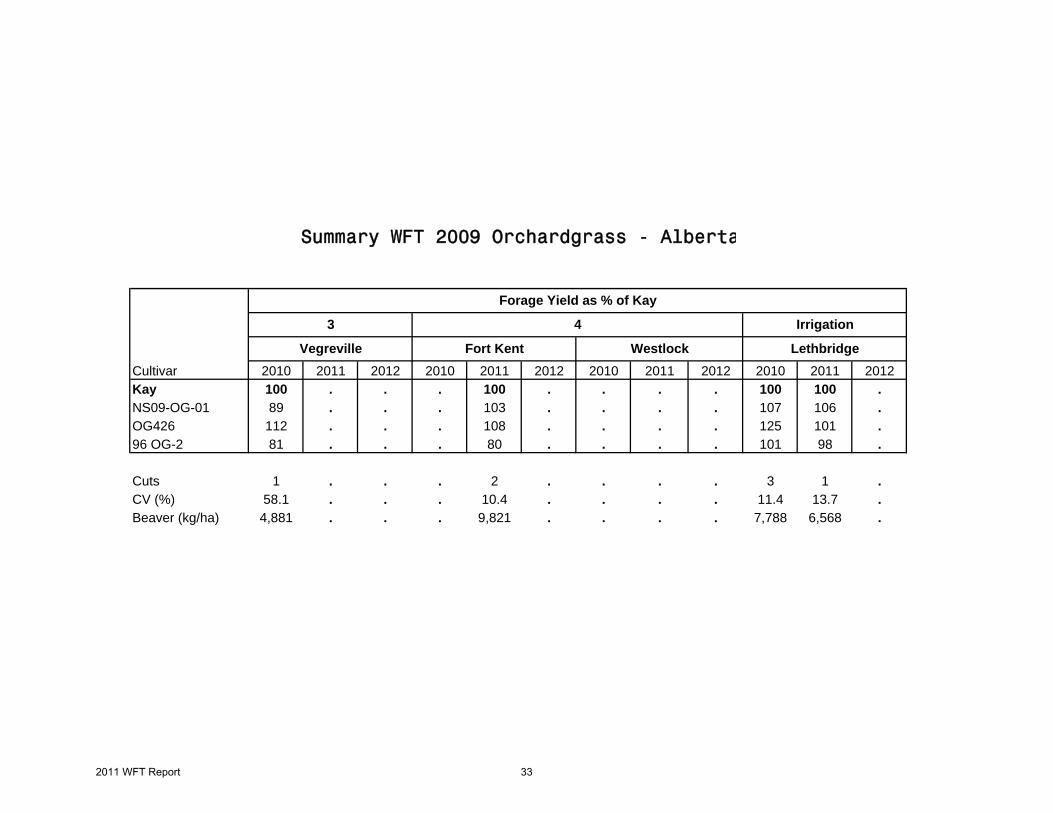
Cultivar 2010 2011 2012 2010 2011 2012 2010 2011 2012 2010 2011 2012Kay 100 . . . 100 . . . . 100 100 .NS09-OG-01 89 . . . 103 . . . . 107 106 .OG426 112 . . . 108 . . . . 125 101 .96 OG-2 81 . . . 80 . . . . 101 98 .
Cuts 1 . . . 2 . . . . 3 1 .CV (%) 58.1 . . . 10.4 . . . . 11.4 13.7 .Beaver (kg/ha) 4,881 . . . 9,821 . . . . 7,788 6,568 .
Vegreville Fort Kent Westlock
3 4
Lethbridge
Irrigation
Forage Yield as % of Kay
Summary WFT 2009 Orchardgrass - Alberta
2011 WFT Report 33
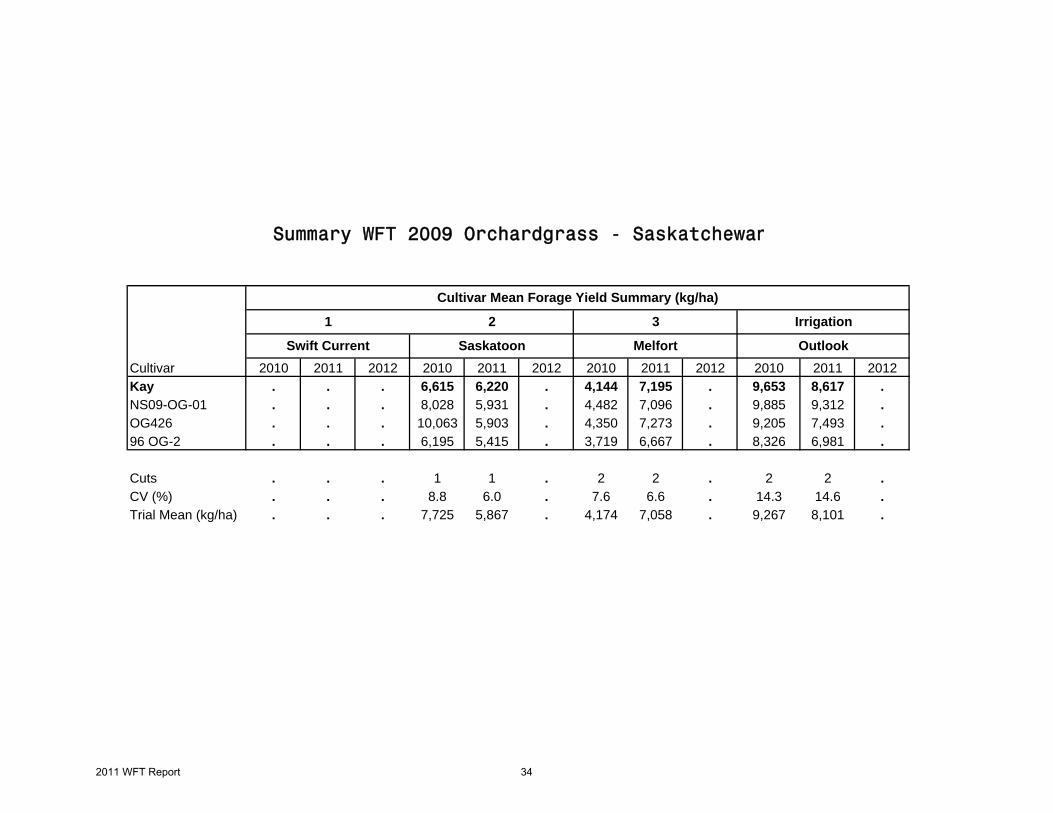
Cultivar 2010 2011 2012 2010 2011 2012 2010 2011 2012 2010 2011 2012Kay . . . 6,615 6,220 . 4,144 7,195 . 9,653 8,617 .NS09-OG-01 . . . 8,028 5,931 . 4,482 7,096 . 9,885 9,312 .OG426 . . . 10,063 5,903 . 4,350 7,273 . 9,205 7,493 .96 OG-2 . . . 6,195 5,415 . 3,719 6,667 . 8,326 6,981 .
Cuts . . . 1 1 . 2 2 . 2 2 .CV (%) . . . 8.8 6.0 . 7.6 6.6 . 14.3 14.6 .Trial Mean (kg/ha) . . . 7,725 5,867 . 4,174 7,058 . 9,267 8,101 .
Summary WFT 2009 Orchardgrass - Saskatchewan
31 2
Cultivar Mean Forage Yield Summary (kg/ha)
Irrigation
Saskatoon Melfort OutlookSwift Current
2011 WFT Report 34
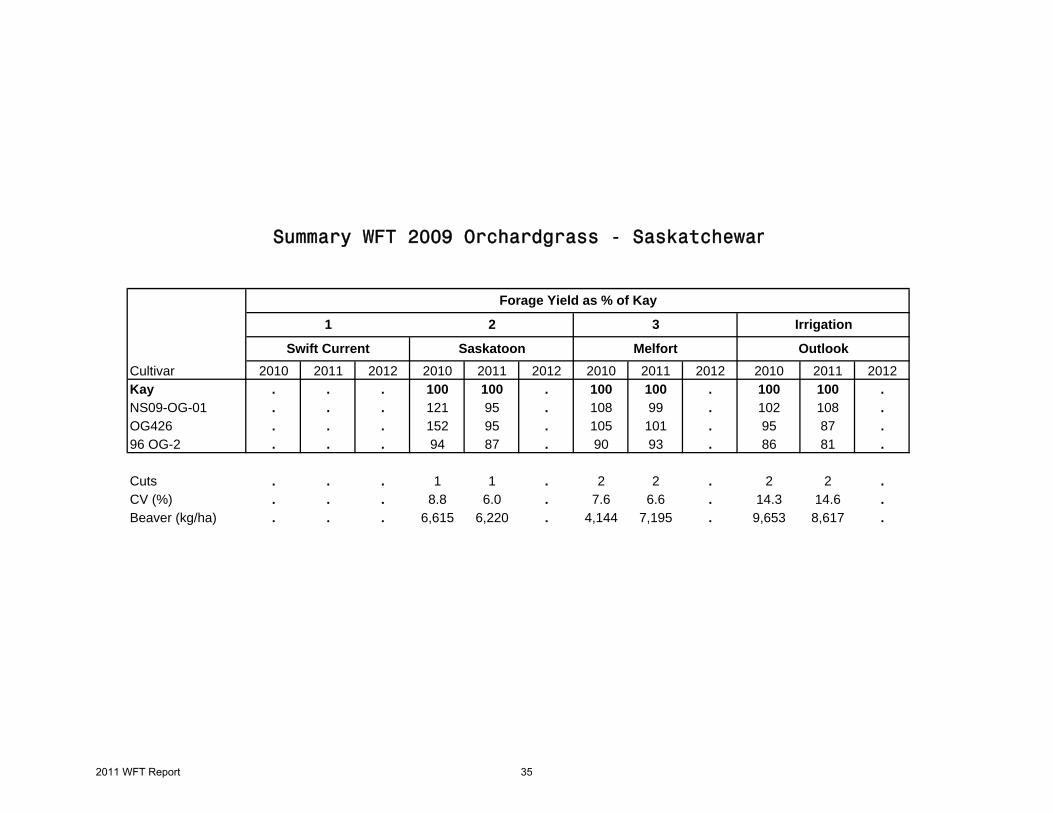
Cultivar 2010 2011 2012 2010 2011 2012 2010 2011 2012 2010 2011 2012Kay . . . 100 100 . 100 100 . 100 100 .NS09-OG-01 . . . 121 95 . 108 99 . 102 108 .OG426 . . . 152 95 . 105 101 . 95 87 .96 OG-2 . . . 94 87 . 90 93 . 86 81 .
Cuts . . . 1 1 . 2 2 . 2 2 .CV (%) . . . 8.8 6.0 . 7.6 6.6 . 14.3 14.6 .Beaver (kg/ha) . . . 6,615 6,220 . 4,144 7,195 . 9,653 8,617 .
3
Melfort
Irrigation
OutlookSwift Current Saskatoon
21
Forage Yield as % of Kay
Summary WFT 2009 Orchardgrass - Saskatchewan
2011 WFT Report 35
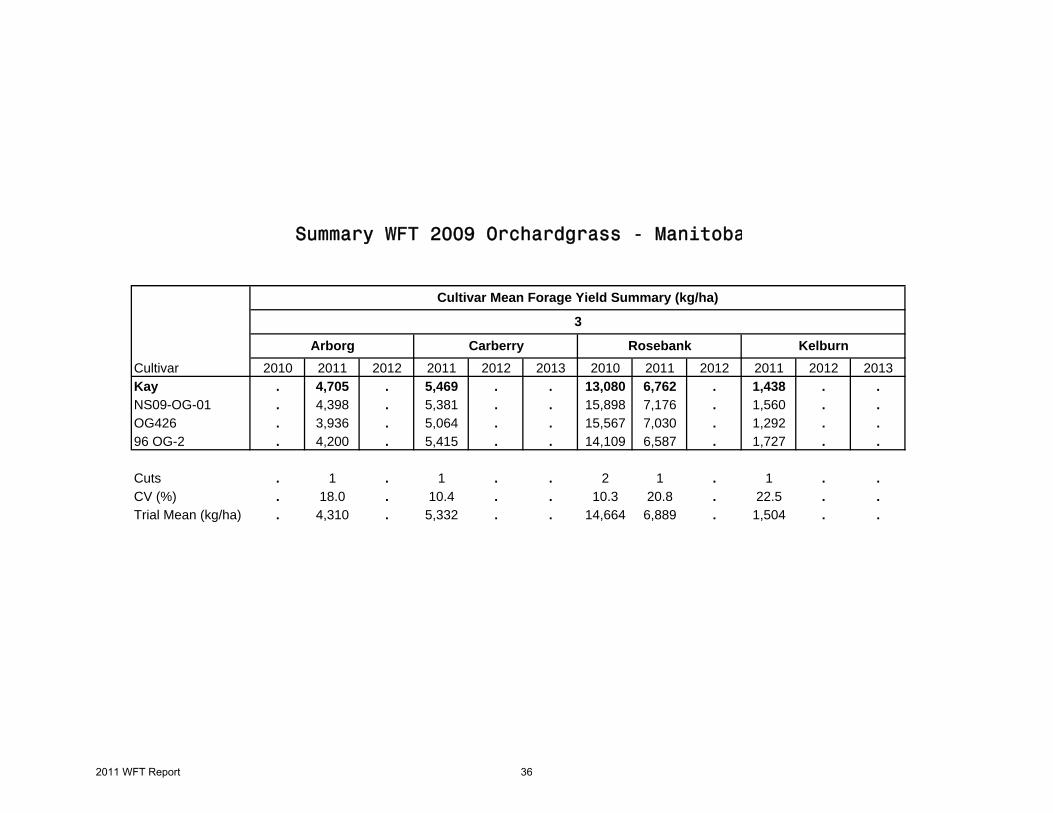
Cultivar 2010 2011 2012 2011 2012 2013 2010 2011 2012 2011 2012 2013Kay . 4,705 . 5,469 . . 13,080 6,762 . 1,438 . .NS09-OG-01 . 4,398 . 5,381 . . 15,898 7,176 . 1,560 . .OG426 . 3,936 . 5,064 . . 15,567 7,030 . 1,292 . .96 OG-2 . 4,200 . 5,415 . . 14,109 6,587 . 1,727 . .
Cuts . 1 . 1 . . 2 1 . 1 . .CV (%) . 18.0 . 10.4 . . 10.3 20.8 . 22.5 . .Trial Mean (kg/ha) . 4,310 . 5,332 . . 14,664 6,889 . 1,504 . .
3
Cultivar Mean Forage Yield Summary (kg/ha)
Summary WFT 2009 Orchardgrass - Manitoba
Arborg Rosebank KelburnCarberry
2011 WFT Report 36
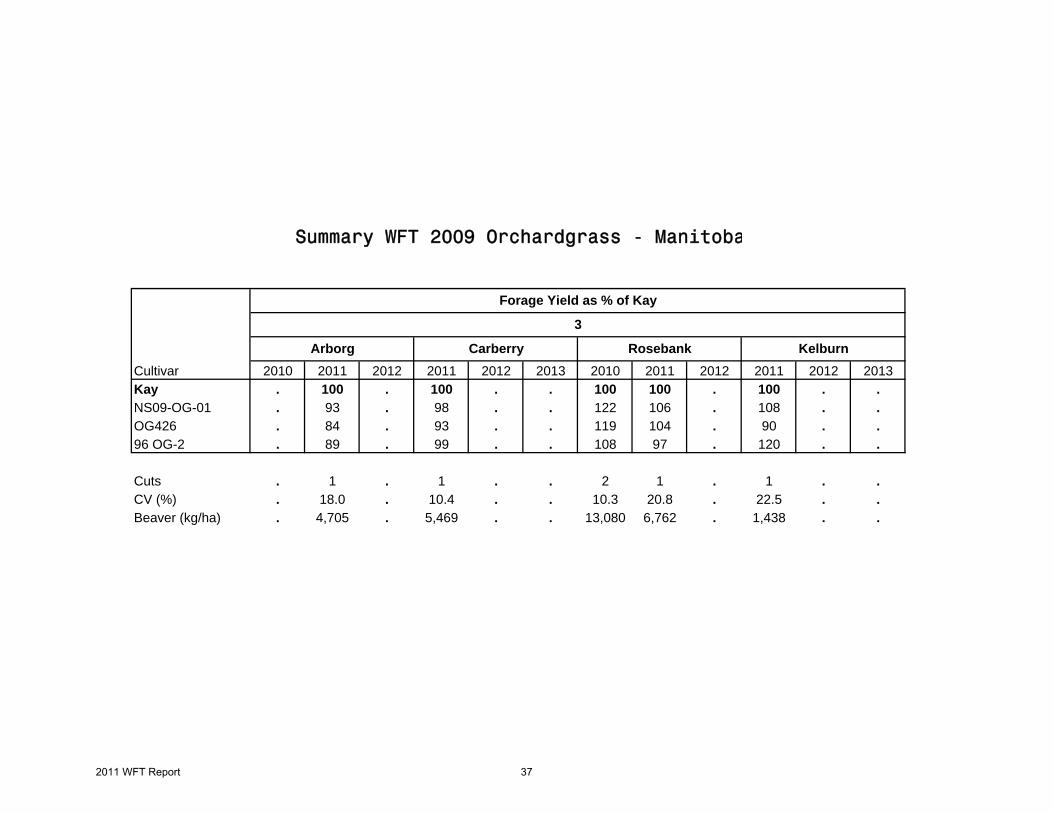
Cultivar 2010 2011 2012 2011 2012 2013 2010 2011 2012 2011 2012 2013Kay . 100 . 100 . . 100 100 . 100 . .NS09-OG-01 . 93 . 98 . . 122 106 . 108 . .OG426 . 84 . 93 . . 119 104 . 90 . .96 OG-2 . 89 . 99 . . 108 97 . 120 . .
Cuts . 1 . 1 . . 2 1 . 1 . .CV (%) . 18.0 . 10.4 . . 10.3 20.8 . 22.5 . .Beaver (kg/ha) . 4,705 . 5,469 . . 13,080 6,762 . 1,438 . .
Forage Yield as % of Kay
Summary WFT 2009 Orchardgrass - Manitoba
Rosebank KelburnArborg
3
Carberry
2011 WFT Report 37
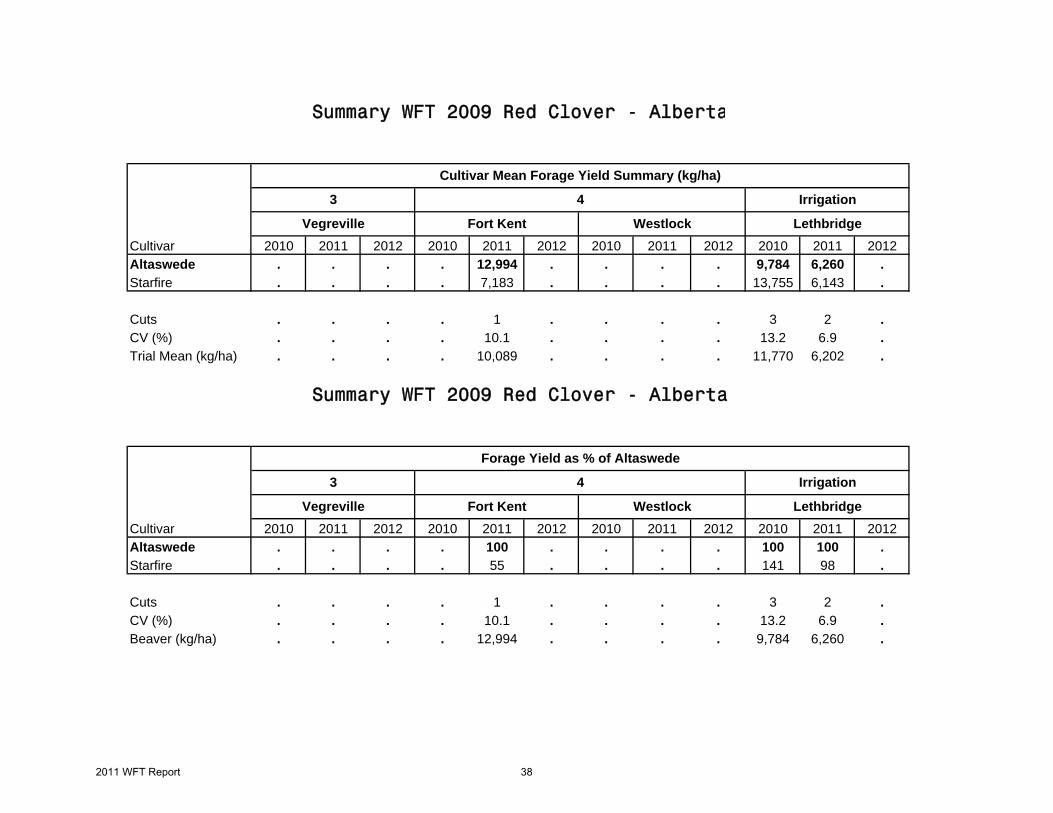
Cultivar 2010 2011 2012 2010 2011 2012 2010 2011 2012 2010 2011 2012Altaswede . . . . 12,994 . . . . 9,784 6,260 .Starfire . . . . 7,183 . . . . 13,755 6,143 .
Cuts . . . . 1 . . . . 3 2 .CV (%) . . . . 10.1 . . . . 13.2 6.9 .Trial Mean (kg/ha) . . . . 10,089 . . . . 11,770 6,202 .
Cultivar 2010 2011 2012 2010 2011 2012 2010 2011 2012 2010 2011 2012Altaswede . . . . 100 . . . . 100 100 .Starfire . . . . 55 . . . . 141 98 .
Cuts . . . . 1 . . . . 3 2 .CV (%) . . . . 10.1 . . . . 13.2 6.9 .Beaver (kg/ha) . . . . 12,994 . . . . 9,784 6,260 .
Summary WFT 2009 Red Clover - Alberta
Forage Yield as % of Altaswede
Summary WFT 2009 Red Clover - Alberta
Fort KentVegreville LethbridgeWestlock
Cultivar Mean Forage Yield Summary (kg/ha)
Irrigation
Lethbridge
Irrigation
Vegreville Fort Kent Westlock
3
3 4
4
2011 WFT Report 38
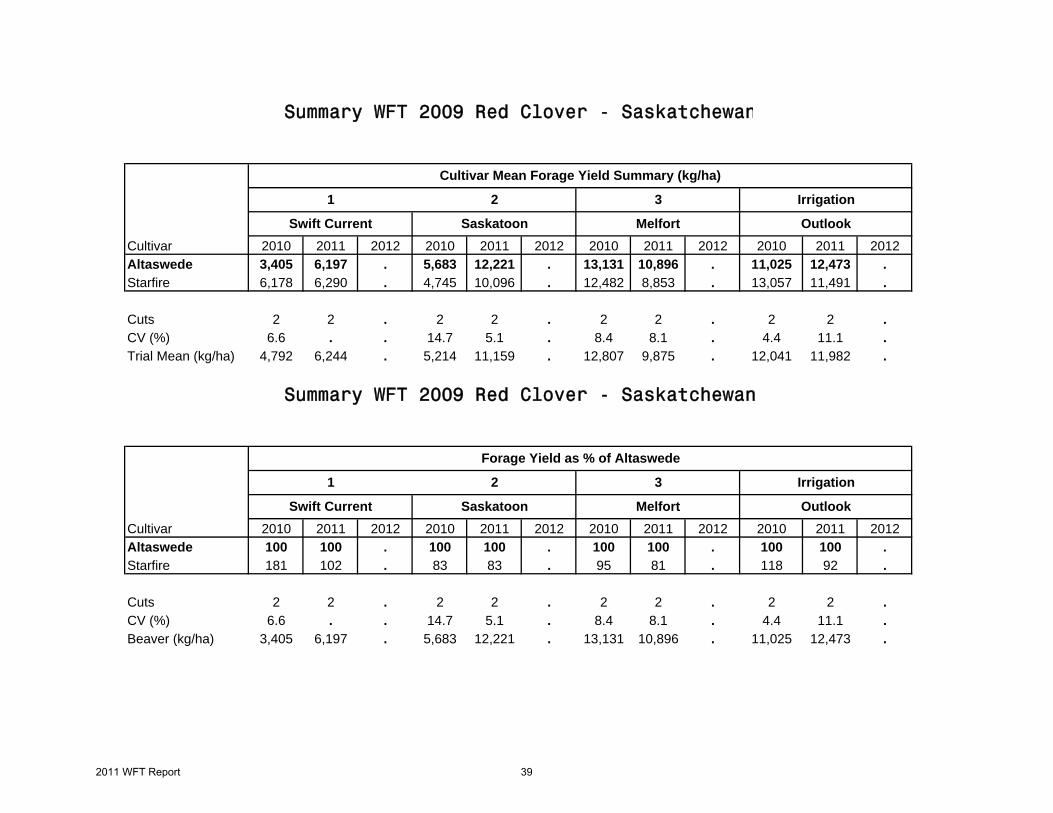
Cultivar 2010 2011 2012 2010 2011 2012 2010 2011 2012 2010 2011 2012Altaswede 3,405 6,197 . 5,683 12,221 . 13,131 10,896 . 11,025 12,473 .Starfire 6,178 6,290 . 4,745 10,096 . 12,482 8,853 . 13,057 11,491 .
Cuts 2 2 . 2 2 . 2 2 . 2 2 .CV (%) 6.6 . . 14.7 5.1 . 8.4 8.1 . 4.4 11.1 .Trial Mean (kg/ha) 4,792 6,244 . 5,214 11,159 . 12,807 9,875 . 12,041 11,982 .
Cultivar 2010 2011 2012 2010 2011 2012 2010 2011 2012 2010 2011 2012Altaswede 100 100 . 100 100 . 100 100 . 100 100 .Starfire 181 102 . 83 83 . 95 81 . 118 92 .
Cuts 2 2 . 2 2 . 2 2 . 2 2 .CV (%) 6.6 . . 14.7 5.1 . 8.4 8.1 . 4.4 11.1 .Beaver (kg/ha) 3,405 6,197 . 5,683 12,221 . 13,131 10,896 . 11,025 12,473 .
Swift Current Saskatoon
21
Saskatoon
Forage Yield as % of Altaswede
Summary WFT 2009 Red Clover - Saskatchewan
Melfort OutlookSwift Current
3
Melfort
Irrigation
Outlook
Summary WFT 2009 Red Clover - Saskatchewan
31 2
Cultivar Mean Forage Yield Summary (kg/ha)
Irrigation
2011 WFT Report 39
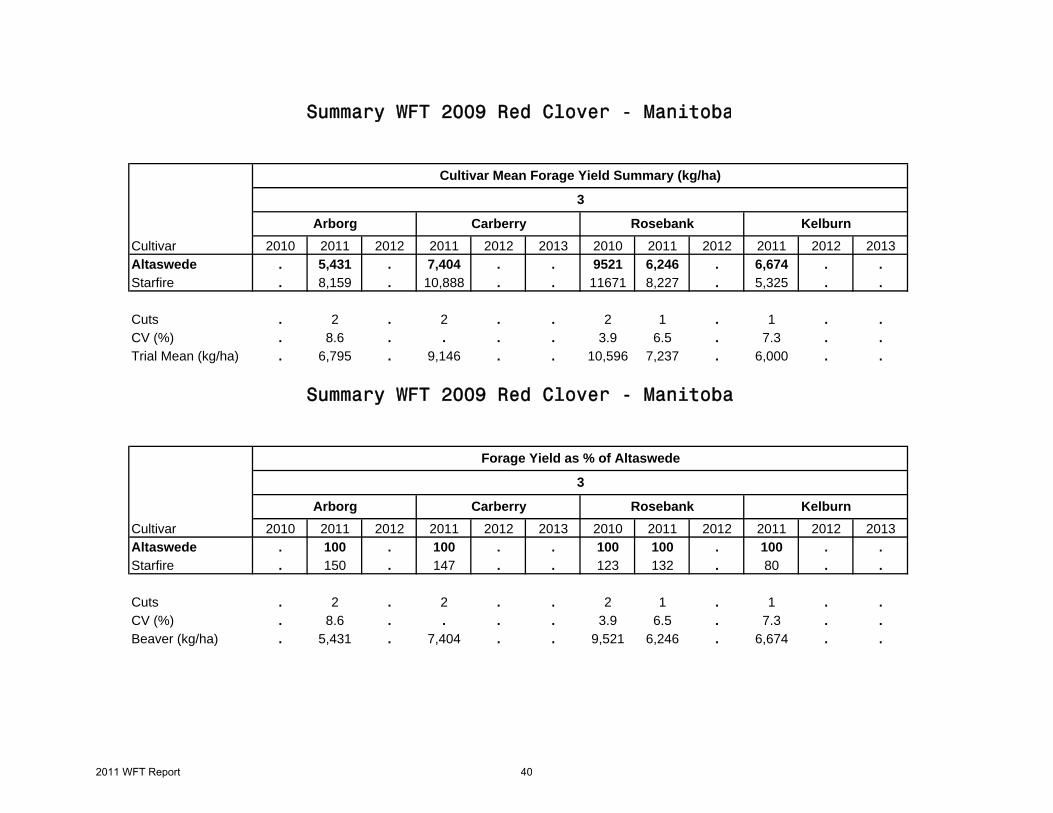
Cultivar 2010 2011 2012 2011 2012 2013 2010 2011 2012 2011 2012 2013Altaswede . 5,431 . 7,404 . . 9521 6,246 . 6,674 . .Starfire . 8,159 . 10,888 . . 11671 8,227 . 5,325 . .
Cuts . 2 . 2 . . 2 1 . 1 . .CV (%) . 8.6 . . . . 3.9 6.5 . 7.3 . .Trial Mean (kg/ha) . 6,795 . 9,146 . . 10,596 7,237 . 6,000 . .
Cultivar 2010 2011 2012 2011 2012 2013 2010 2011 2012 2011 2012 2013Altaswede . 100 . 100 . . 100 100 . 100 . .Starfire . 150 . 147 . . 123 132 . 80 . .
Cuts . 2 . 2 . . 2 1 . 1 . .CV (%) . 8.6 . . . . 3.9 6.5 . 7.3 . .Beaver (kg/ha) . 5,431 . 7,404 . . 9,521 6,246 . 6,674 . .
Rosebank KelburnArborg
3
Carberry
Forage Yield as % of Altaswede
Arborg Rosebank Kelburn
Summary WFT 2009 Red Clover - Manitoba
Carberry
3
Cultivar Mean Forage Yield Summary (kg/ha)
Summary WFT 2009 Red Clover - Manitoba
2011 WFT Report 40

2011 WFT Report 41
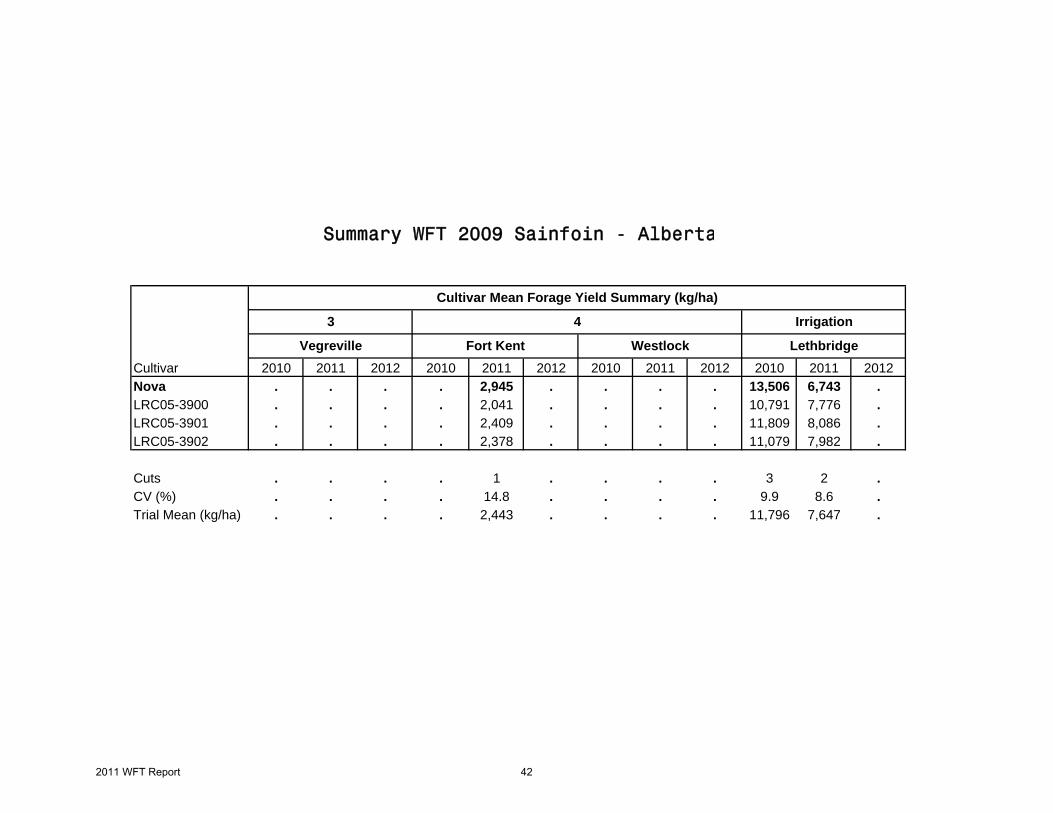
Cultivar 2010 2011 2012 2010 2011 2012 2010 2011 2012 2010 2011 2012Nova . . . . 2,945 . . . . 13,506 6,743 .LRC05-3900 . . . . 2,041 . . . . 10,791 7,776 .LRC05-3901 . . . . 2,409 . . . . 11,809 8,086 .LRC05-3902 . . . . 2,378 . . . . 11,079 7,982 .
Cuts . . . . 1 . . . . 3 2 .CV (%) . . . . 14.8 . . . . 9.9 8.6 .Trial Mean (kg/ha) . . . . 2,443 . . . . 11,796 7,647 .
Summary WFT 2009 Sainfoin - Alberta
Fort KentVegreville LethbridgeWestlock
Cultivar Mean Forage Yield Summary (kg/ha)
Irrigation3 4
2011 WFT Report 42
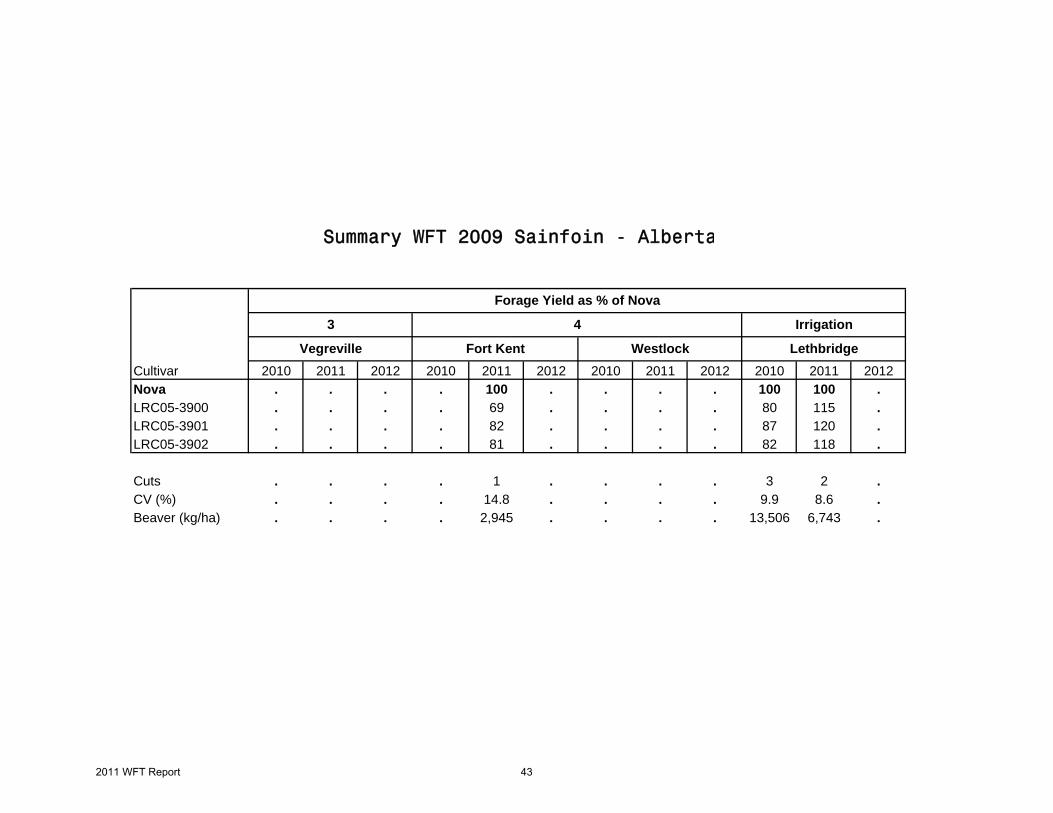
Cultivar 2010 2011 2012 2010 2011 2012 2010 2011 2012 2010 2011 2012Nova . . . . 100 . . . . 100 100 .LRC05-3900 . . . . 69 . . . . 80 115 .LRC05-3901 . . . . 82 . . . . 87 120 .LRC05-3902 . . . . 81 . . . . 82 118 .
Cuts . . . . 1 . . . . 3 2 .CV (%) . . . . 14.8 . . . . 9.9 8.6 .Beaver (kg/ha) . . . . 2,945 . . . . 13,506 6,743 .
Forage Yield as % of Nova
Summary WFT 2009 Sainfoin - Alberta
Lethbridge
Irrigation
Vegreville Fort Kent Westlock
3 4
2011 WFT Report 43
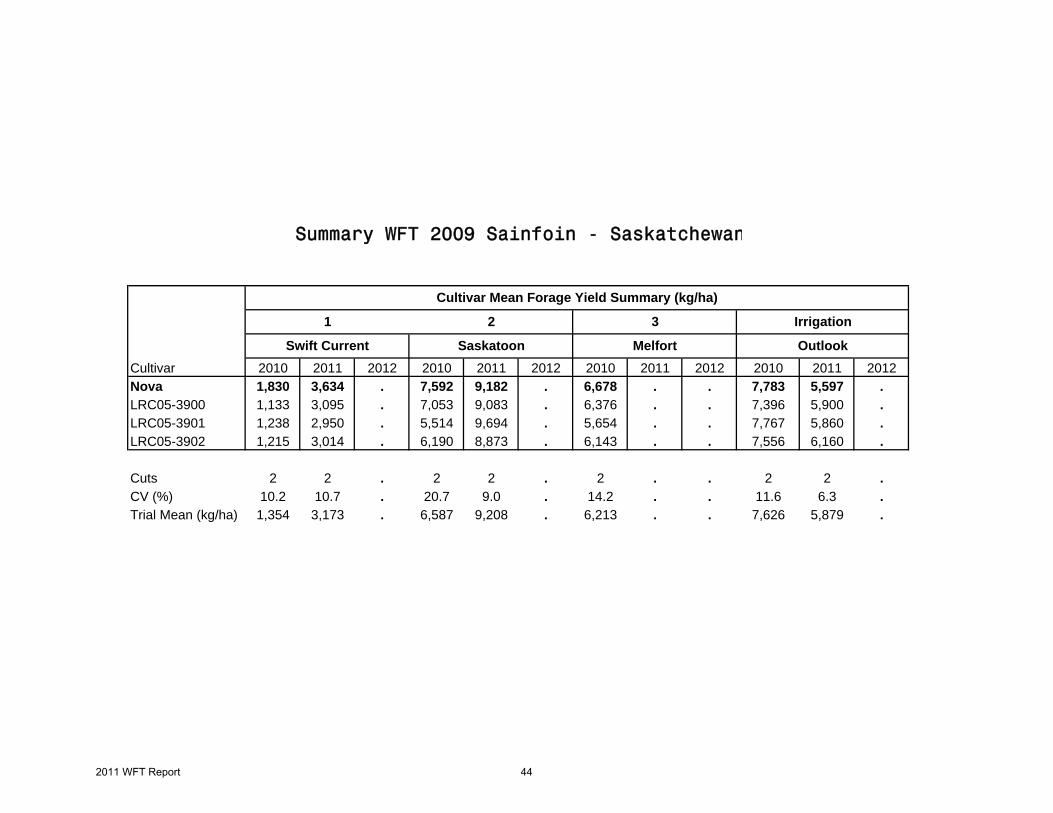
Cultivar 2010 2011 2012 2010 2011 2012 2010 2011 2012 2010 2011 2012Nova 1,830 3,634 . 7,592 9,182 . 6,678 . . 7,783 5,597 .LRC05-3900 1,133 3,095 . 7,053 9,083 . 6,376 . . 7,396 5,900 .LRC05-3901 1,238 2,950 . 5,514 9,694 . 5,654 . . 7,767 5,860 .LRC05-3902 1,215 3,014 . 6,190 8,873 . 6,143 . . 7,556 6,160 .
Cuts 2 2 . 2 2 . 2 . . 2 2 .CV (%) 10.2 10.7 . 20.7 9.0 . 14.2 . . 11.6 6.3 .Trial Mean (kg/ha) 1,354 3,173 . 6,587 9,208 . 6,213 . . 7,626 5,879 .
Saskatoon Melfort OutlookSwift Current
Summary WFT 2009 Sainfoin - Saskatchewan
31 2
Cultivar Mean Forage Yield Summary (kg/ha)
Irrigation
2011 WFT Report 44
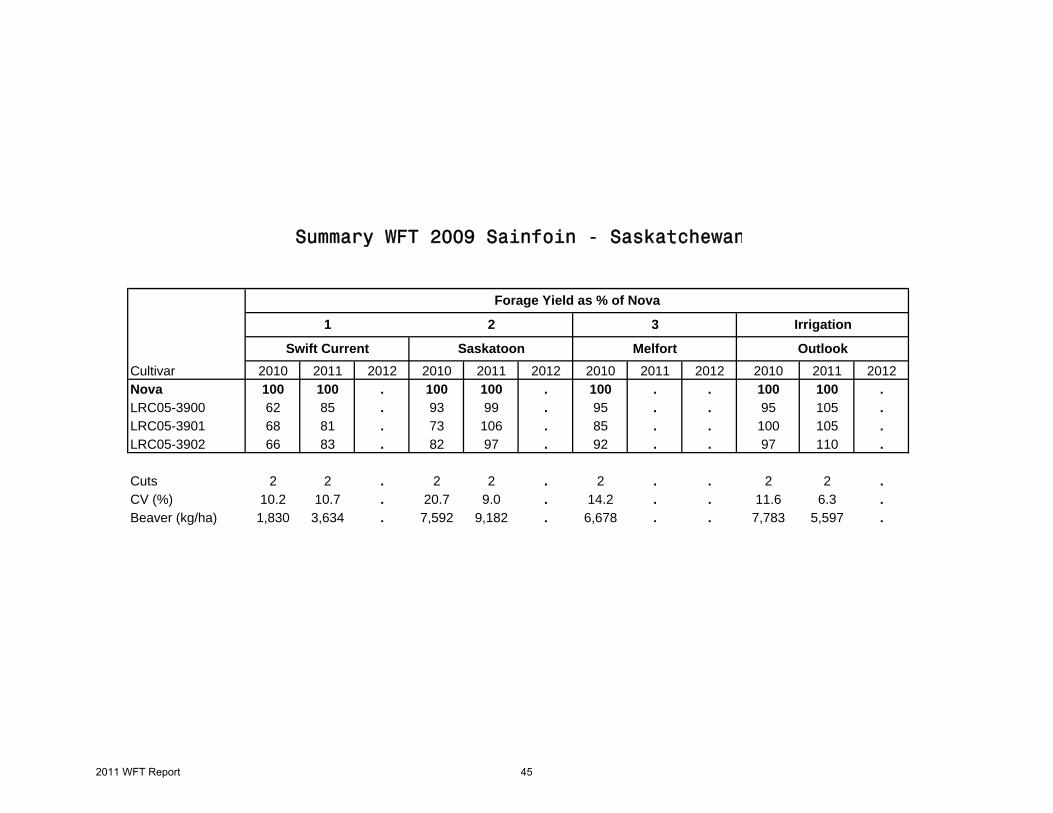
Cultivar 2010 2011 2012 2010 2011 2012 2010 2011 2012 2010 2011 2012Nova 100 100 . 100 100 . 100 . . 100 100 .LRC05-3900 62 85 . 93 99 . 95 . . 95 105 .LRC05-3901 68 81 . 73 106 . 85 . . 100 105 .LRC05-3902 66 83 . 82 97 . 92 . . 97 110 .
Cuts 2 2 . 2 2 . 2 . . 2 2 .CV (%) 10.2 10.7 . 20.7 9.0 . 14.2 . . 11.6 6.3 .Beaver (kg/ha) 1,830 3,634 . 7,592 9,182 . 6,678 . . 7,783 5,597 .
Swift Current Saskatoon
21
Forage Yield as % of Nova
Summary WFT 2009 Sainfoin - Saskatchewan
3
Melfort
Irrigation
Outlook
2011 WFT Report 45
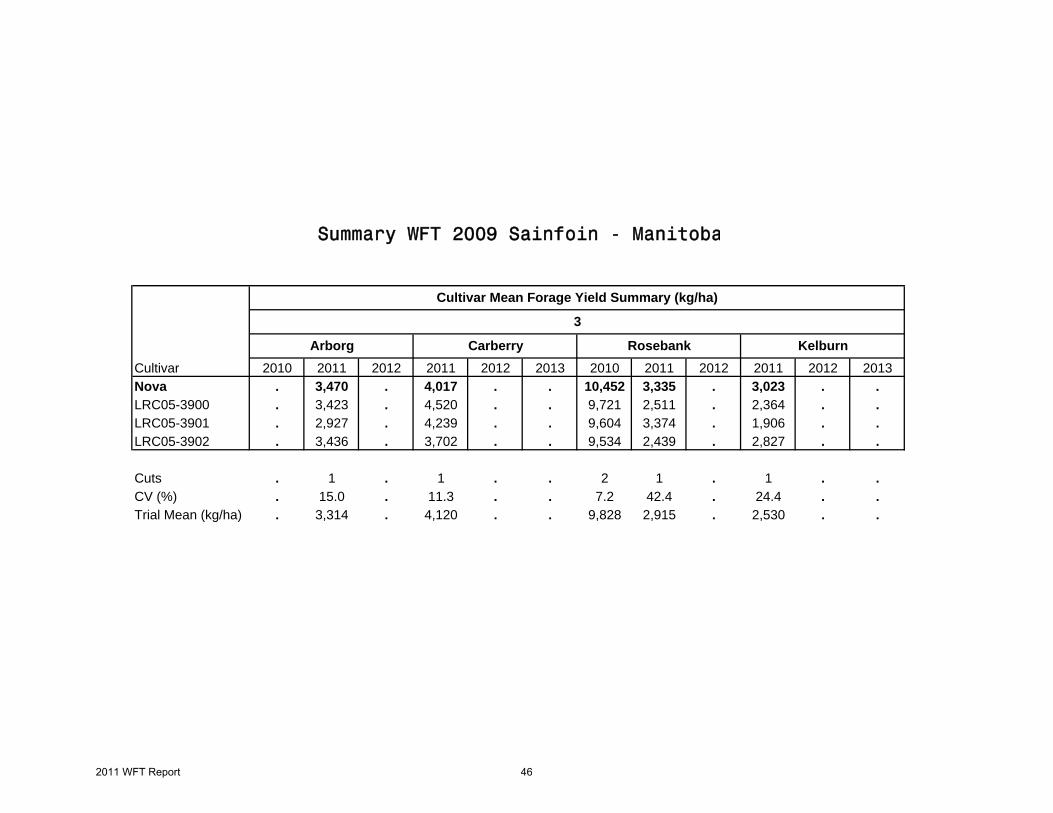
Cultivar 2010 2011 2012 2011 2012 2013 2010 2011 2012 2011 2012 2013Nova . 3,470 . 4,017 . . 10,452 3,335 . 3,023 . .LRC05-3900 . 3,423 . 4,520 . . 9,721 2,511 . 2,364 . .LRC05-3901 . 2,927 . 4,239 . . 9,604 3,374 . 1,906 . .LRC05-3902 . 3,436 . 3,702 . . 9,534 2,439 . 2,827 . .
Cuts . 1 . 1 . . 2 1 . 1 . .CV (%) . 15.0 . 11.3 . . 7.2 42.4 . 24.4 . .Trial Mean (kg/ha) . 3,314 . 4,120 . . 9,828 2,915 . 2,530 . .
Arborg Rosebank KelburnCarberry
3
Cultivar Mean Forage Yield Summary (kg/ha)
Summary WFT 2009 Sainfoin - Manitoba
2011 WFT Report 46
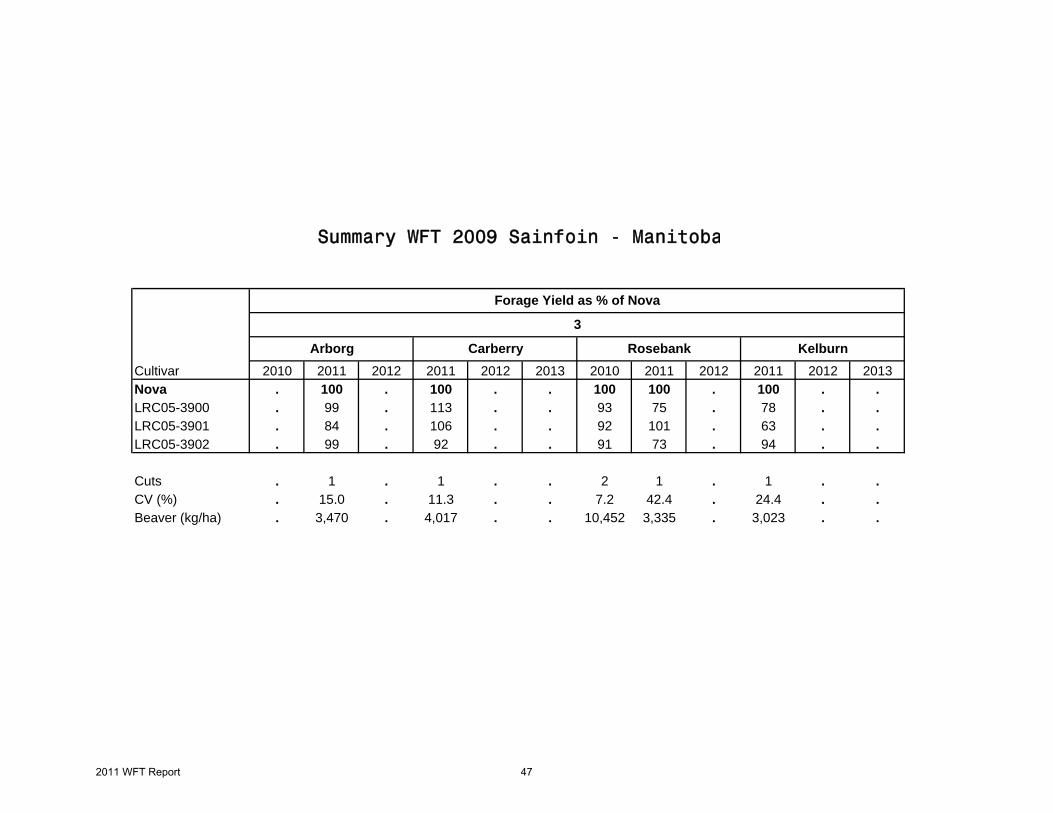
Cultivar 2010 2011 2012 2011 2012 2013 2010 2011 2012 2011 2012 2013Nova . 100 . 100 . . 100 100 . 100 . .LRC05-3900 . 99 . 113 . . 93 75 . 78 . .LRC05-3901 . 84 . 106 . . 92 101 . 63 . .LRC05-3902 . 99 . 92 . . 91 73 . 94 . .
Cuts . 1 . 1 . . 2 1 . 1 . .CV (%) . 15.0 . 11.3 . . 7.2 42.4 . 24.4 . .Beaver (kg/ha) . 3,470 . 4,017 . . 10,452 3,335 . 3,023 . .
Rosebank KelburnArborg
3
Carberry
Forage Yield as % of Nova
Summary WFT 2009 Sainfoin - Manitoba
2011 WFT Report 47
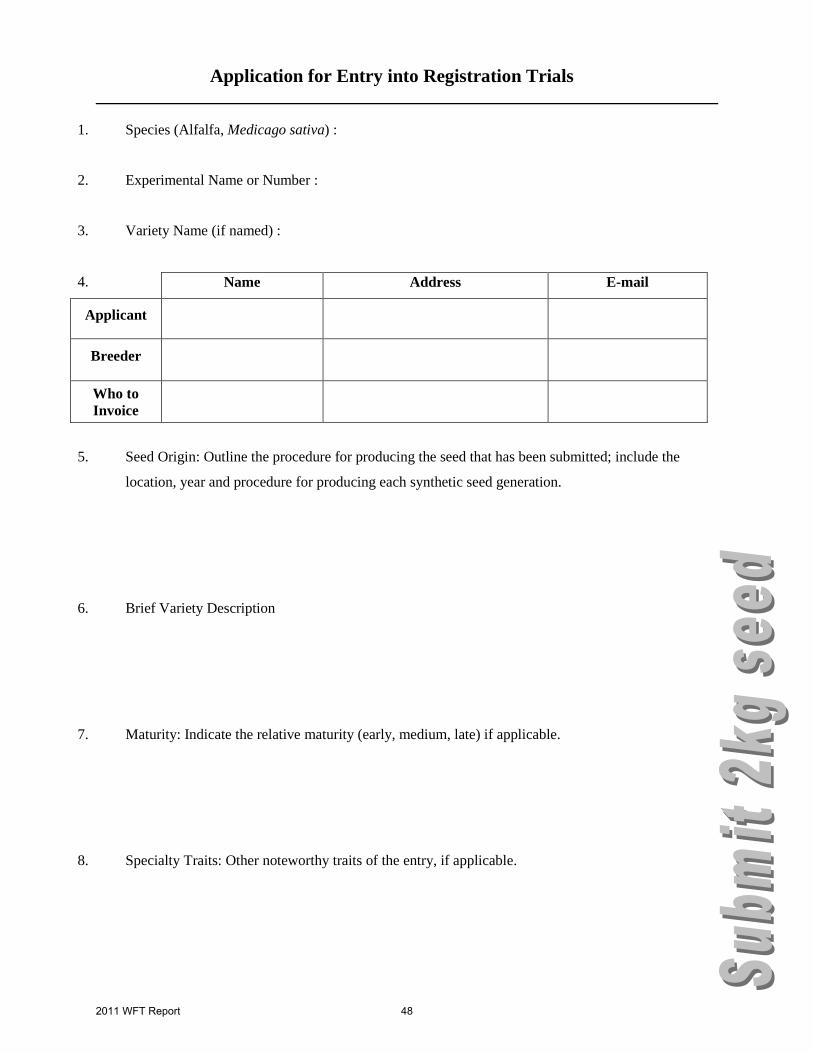
Application for Entry into Registration Trials 1. Species (Alfalfa, Medicago sativa) :
2. Experimental Name or Number :
3. Variety Name (if named) :
4. Name Address E-mail
Applicant
Breeder
Who to Invoice
5. Seed Origin: Outline the procedure for producing the seed that has been submitted; include the
location, year and procedure for producing each synthetic seed generation.
6. Brief Variety Description
7. Maturity: Indicate the relative maturity (early, medium, late) if applicable.
8. Specialty Traits: Other noteworthy traits of the entry, if applicable.
2011 WFT Report 48
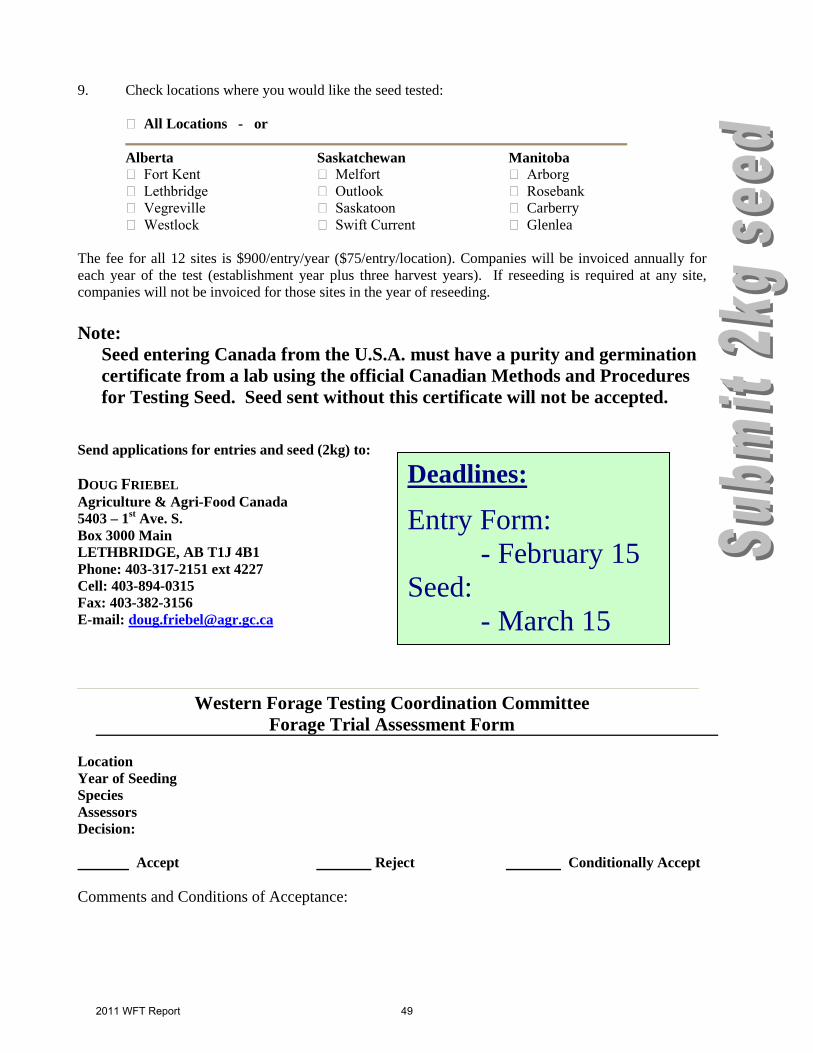
Deadlines:
Entry Form: - February 15 Seed: - March 15
9. Check locations where you would like the seed tested:
All Locations - or
Alberta Saskatchewan Manitoba Fort Kent Melfort Arborg Lethbridge Outlook Rosebank Vegreville Saskatoon Carberry Westlock Swift Current Glenlea
The fee for all 12 sites is $900/entry/year ($75/entry/location). Companies will be invoiced annually for each year of the test (establishment year plus three harvest years). If reseeding is required at any site, companies will not be invoiced for those sites in the year of reseeding. Note:
Seed entering Canada from the U.S.A. must have a purity and germination certificate from a lab using the official Canadian Methods and Procedures for Testing Seed. Seed sent without this certificate will not be accepted.
Send applications for entries and seed (2kg) to: DOUG FRIEBEL Agriculture & Agri-Food Canada 5403 – 1st Ave. S. Box 3000 Main LETHBRIDGE, AB T1J 4B1 Phone: 403-317-2151 ext 4227 Cell: 403-894-0315 Fax: 403-382-3156 E-mail: [email protected]
Western Forage Testing Coordination Committee
Forage Trial Assessment Form Location Year of Seeding Species Assessors Decision: Accept Reject Conditionally Accept
Comments and Conditions of Acceptance:
2011 WFT Report 49