Embed Size (px)
Citation preview

October 2018 FC 172/2
This document can be accessed using the Quick Response Code on this page;
an FAO initiative to minimize its environmental impact and promote greener communications.
Other documents can be consulted at www.fao.org
MX702e
E
FINANCE COMMITTEE
Hundred and Seventy-second Session
Rome, 5 - 6 November 2018
WFP Management Plan (2019–2021)
Queries on the substantive content of this document may be addressed to:
Mr S. O'Brien
Director
Budget and Programming Division
and
Deputy Chief Financial Officer
World Food Programme
Tel: +3906 6513 2682
2 FC 172/2
EXECUTIVE SUMMARY
The “WFP Management Plan (2019–2021)” is submitted to the Board for approval.
The Executive Summary of the “WFP Management Plan (2019–2021)” is included
within the main document presented to the Committee for its review.
GUIDANCE SOUGHT FROM THE FINANCE COMMITTEE
The Finance Committee is requested to review the “WFP Management Plan
(2019–2021)” and to endorse it for approval by the Executive Board.
Draft Advice
In accordance with Article XIV of the General Regulations of WFP, the
FAO Finance Committee advises the WFP Executive Board to approve the
draft decision as outlined in the document
“WFP Management Plan (2019–2021)”.
Focal points:
Mr M. Juneja
Assistant Executive Director
Resource Management Department
and Chief Financial Officer
tel.: 066513-2885
Mr S. O’Brien
Director
Budget and Programming Division
tel.: 066513-2682
Mr C. Gardner
Chief
Organizational Budgeting Service
tel.: 066513-2077
Mr D. Vidal
Chief Programme Officer
Project Budget and Programming Service
tel.: 066513-2595
World Food Programme, Via Cesare Giulio Viola, 68/70, 00148 Rome, Italy
Executive Board
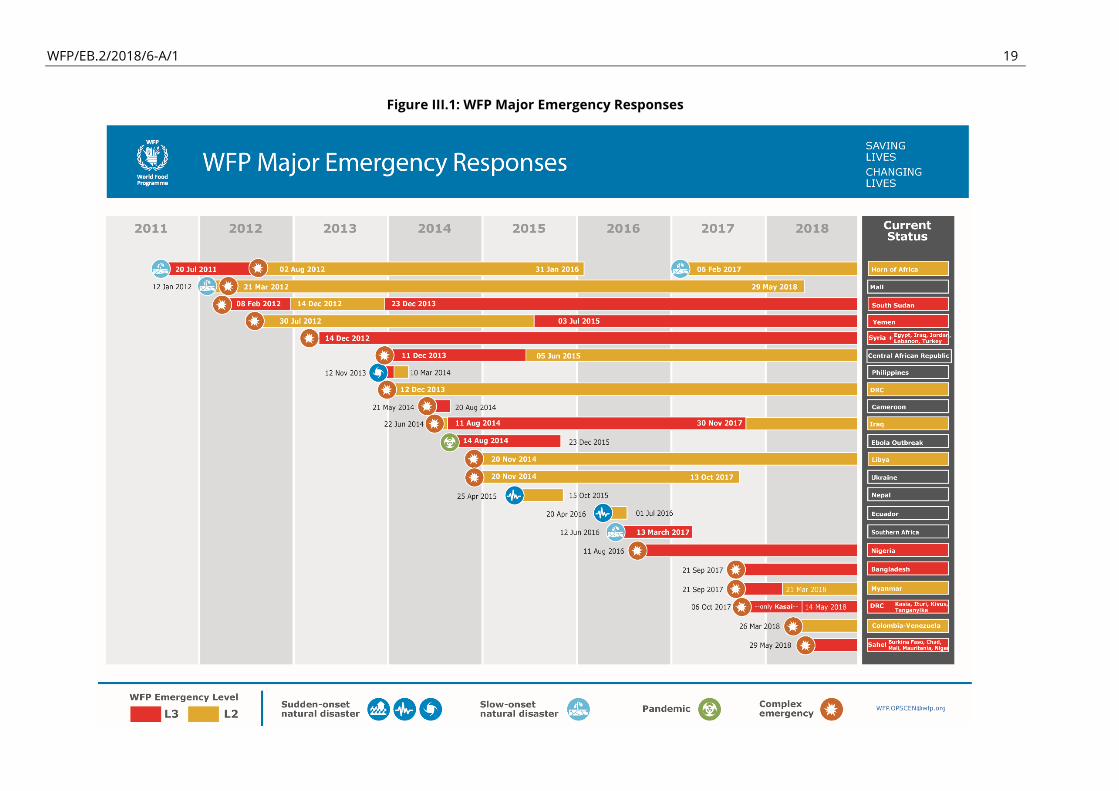
Second regular session
Rome, 26 29 November 2018
Distribution: General
Date: 22 October 2018
Original: English
Agenda item 6
WFP/EB.2/2018/6-A/1
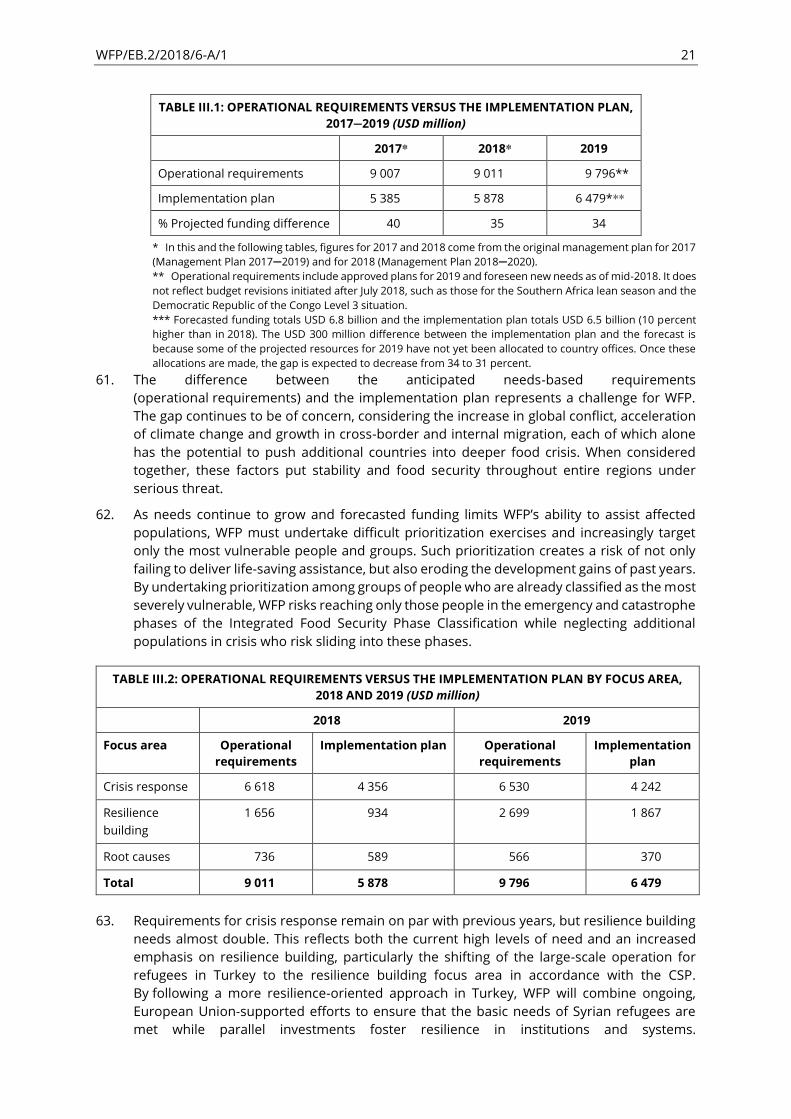
Resource, financial and budgetary matters
For approval
Executive Board documents are available on WFP’s website (https://executiveboard.wfp.org).
WFP Management Plan (2019 2021)
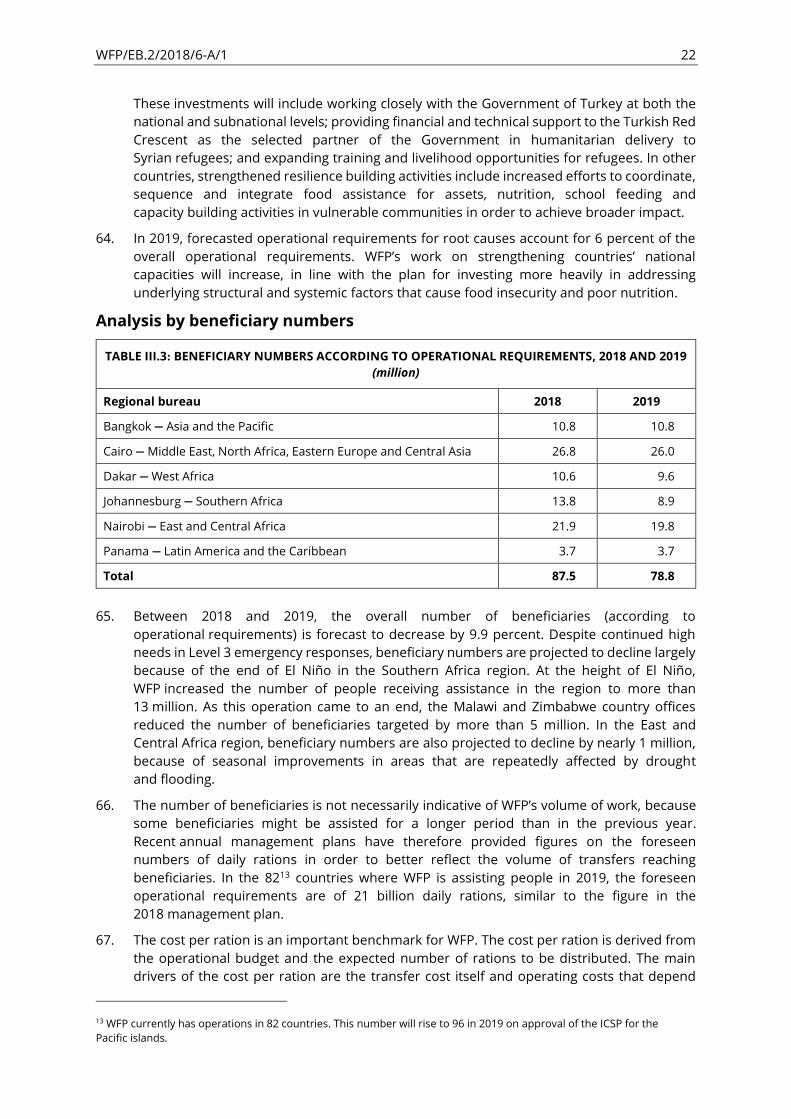
Executive summary
In 2017, world hunger increased for the third consecutive year. The number of undernourished
people in 2017, estimated at 821 million or close to 11 percent of the world’s population, was the highest for nearly ten years. Increasing instability and large-scale conflict, the consequences of
climate change and extreme weather events, large-scale migration resulting from conflict and
an economic slowdown are all contributing to the worsening situation.
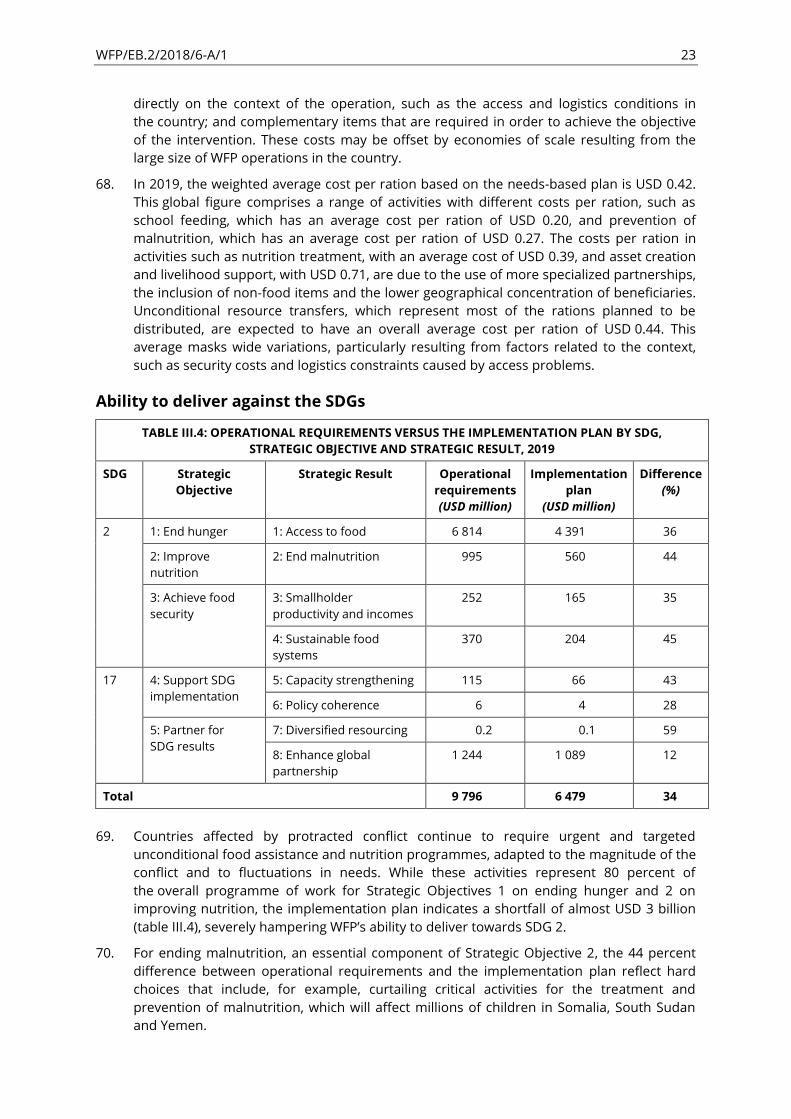
As the world’s leading emergency response organization, WFP has an essential role in a world of growing instability. However, the complexity of its operations and the unprecedented number of
declared WFP emergencies, coupled with significant resource constraints, — despite attaining
record levels of funding — can prevent WFP from reaching the people most in need.
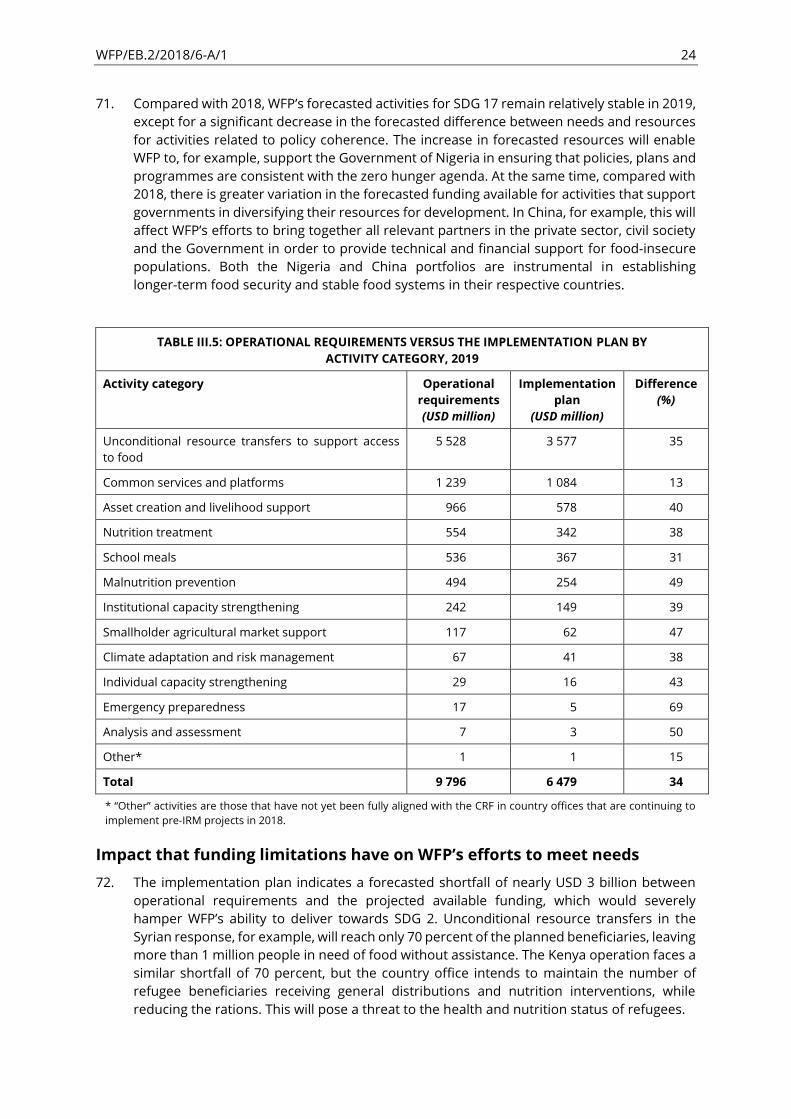
It is therefore critical that resources be employed effectively, to efficiently reach the largest
possible number of beneficiaries. To realize the vision articulated in the WFP Strategic Plan
(2017-2021) and contribute to the achievement of the goals of the 2030 Agenda for
Sustainable Development, WFP must save lives and change lives by implementing the
transformative programmes that are incorporated in the Integrated Road Map framework.
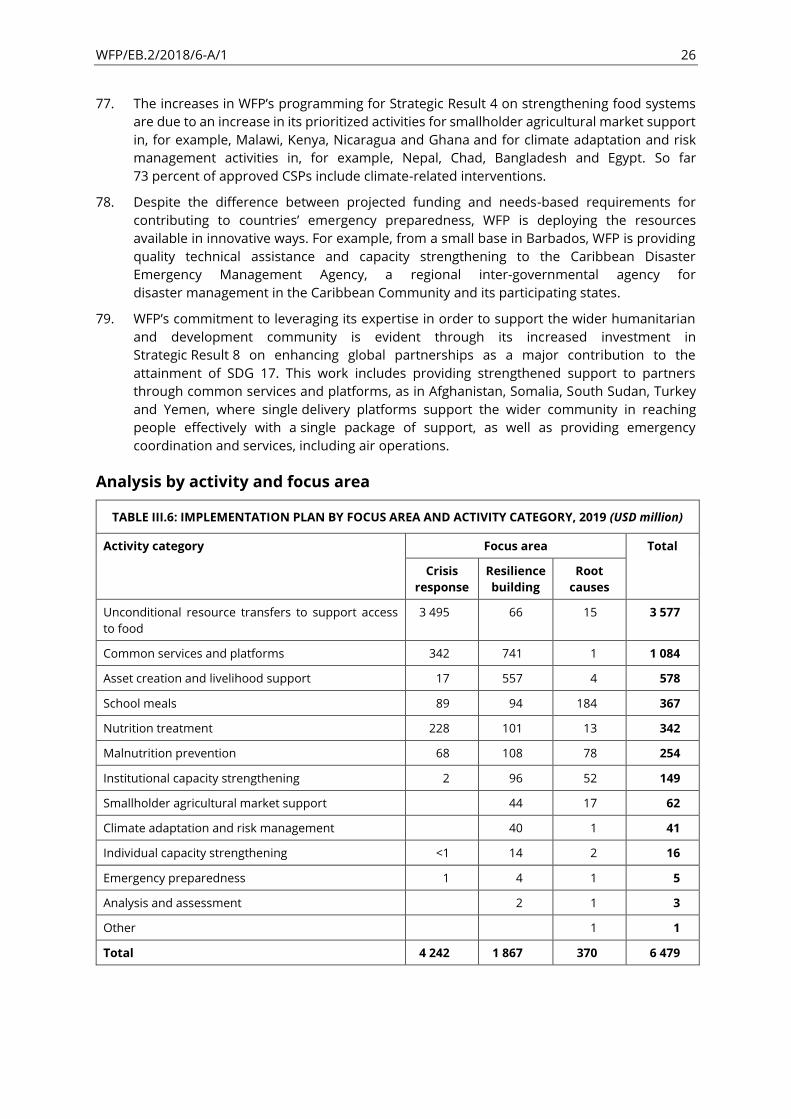
The Management Plan (2019 2021) sets out the core resource allocations in the programme
support and administrative (PSA) budget. It renews WFP’s focus on leadership in emergencies and
programme excellence, underpinned by a workforce that must be equipped to deliver
transformative country strategic plans at the humanitarian-development-peace nexus.
The Management Plan (2019 2021) addresses the need for completing the rollout of the
Integrated Road Map and increasing investments in oversight for improved learning and greater
WFP/EB.2/2018/6-A/1 2
assurance to stakeholders regarding WFP’s stewardship of resources. Investments in technology will assist in making every dollar resourced go further in support of the people served by WFP,
ensuring that WFP leverages digitization as an enabler for transforming its approach to
food assistance.
Needs and the WFP implementation plan
WFP’s operational requirements for 2019 amount to USD 9.8 billion, a 9 percent increase
from 2018. The three largest operations in the Syrian Arab Republic and the Syrian region, Yemen
and South Sudan account for 50 percent of total operational requirements.
WFP faces an unprecedented number of declared WFP emergencies, with seven Level 3
emergencies in Bangladesh, the Democratic Republic of the Congo, northeastern Nigeria,
the Sahel region, South Sudan, the Syrian Arab Republic (and neighbouring countries) and Yemen.
Although requirements for crisis response remain on a par with those in previous years,
resilience building activities have almost doubled, from nearly 16 percent of the
2018 implementation plan to 29 percent in 2019. This reflects the current high levels of need and
a shift to the resilience building focus area for the large-scale operation for refugees in Turkey,
in accordance with WFP’s country strategic plan (CSP) for Turkey. Requirements for the root causes focus area account for 6 percent of the implementation plan, down from 10 percent in 2018.
In-kind food is the main transfer modality for 2019, accounting for 48 percent of total transfer
costs in the implementation plan. Cash-based transfers account for 40 percent of the
implementation plan. Commodity vouchers will account for less than 2 percent of total
transfer costs. The capacity strengthening modality accounts for 5 percent of total transfer costs,
and service delivery for 6 percent. Capacity strengthening is expected to be implemented in 79 of
the 82 countries where WFP operates, while service delivery will be implemented in 34.
Despite the 9 percent increase in operational requirements compared with 2018, the global gap
between operational requirements and the implementation plan has decreased from 35 percent
in 2018 to 34 percent in 2019, with an expectation that this gap will reduce further to 31 percent
as additional contributions revenue already forecast at the global level is allocated to
country plans. In order to reduce this gap further, WFP will continue its efforts to broaden its
funding base and is engaging in a variety of approaches for increasing the resources available,
including the provision of incentives for alternative funding and financing of WFP operations,
re-establishment of the emerging donor matching fund, further development and marketing of
the ShareTheMeal mobile application and engagement with donors on the benefits of flexible and
predictable funding.
2019 programme support and administrative budget
The PSA budget covers the indirect costs of delivering on WFP’s implementation plan.
The PSA budget proposal for 2019 has been prepared on the basis of the expected indirect
support cost (ISC) income generated from the forecasted contribution revenue for 2019.
The Secretariat proposes that the ISC recovery rate be maintained at 6.5 percent in 2019.
Projected contribution revenue for 2019 of USD 6.8 billion is based on analyses of the policies and
strategic interests of donors and of past funding trends, which has been reconciled with local
funding projections from each country. Although lower than the 2018 projected contribution
revenue of USD 7.2 billion, the figure for 2019 represents a 30.8 percent increase over
projected revenue for 2017 in the Management Plan (2017—2019).
The ISC income for 2019 is expected to be USD 409.0 million and is derived from the
projected contribution revenue and the ISC recovery rate. The Secretariat proposes a
2019 PSA budget of USD 385.1 million. This is an increase of USD 49.7 million or 14.9 percent over
the PSA budget of USD 335.4 million for both 2017 and 2018.
WFP/EB.2/2018/6-A/1 3
Given the recent, favourable actual and projected income levels, the Secretariat is increasing the
PSA budget in order to ensure adequate support for WFP’s growing operational activity and the maintenance of its operational effectiveness and efficiency. Proposals are put forward for the use
of PSA resources for additional investments in critical areas such as independent oversight,
cybersecurity and internal controls, including those relating to anti-fraud and anti-corruption
initiatives. Proposals for the strengthening of school feeding capacity and emergency surge
capacity are also included.
In calculating their individual departmental budgets, departments have continued their efforts to
reprioritize the disposition of the PSA budget. For example, the Supply Chain Division is giving
greater priority to logistics support in the field and goods and services procurement, while the
Resource Management Department has increased investments in innovation and staff welfare
through the de-prioritization of transactional work.
The Secretariat has also doubled its financial support for the resident coordinator system to
USD 3.0 million, in accordance with the proposals set out in the Secretary-General’s report on repositioning of the United Nations development system in order to deliver on the 2030 Agenda.
Critical corporate initiatives funded from the PSA equalization account
In 2015, the Executive Board endorsed the use of the PSA equalization account for
critical corporate initiatives. The healthy balance in the account arises from successive years of
growth in contribution revenue and the development of PSA budgets aimed at ensuring that WFP
lives within its means . It provides an opportunity for WFP to make further investments in
strengthening its ways of working, its people and its systems.
The Secretariat proposes an investment of USD 69.3 million for six critical corporate initiatives.
Four of the initiatives will be funded for two years and the other two for one year. The following
table shows how the USD 69.3 million will be apportioned.
Name Amount
(USD million)
Timeframe
(years)
Integrated Road Map 10 1
Workforce 2020 11.1 2
WFP 2030 Fund 15 2
United Nations reform 8.2 2
Cash and the digital platform 20 2
Systems integration and IT-enabled efficiencies 5 1
Total 69.3
The Integrated Road Map (USD 10 million) initiative will ensure the successful transition of the
remaining 11 country offices to the IRM framework in early 2019 by maintaining capacity for the
regional bureaux and affected headquarters divisions providing country office support. In 2019,
a significantly smaller central IRM team will continue to provide overall coordination, carry out
simplifications and enhancements of the IRM framework, and finalize the permanent delegations
of authority to be presented for approval at the Board’s 2020 first regular session. All substantive
responsibilities under the Integrated Road Map framework will be mainstreamed into the
relevant units during 2019.
Workforce 2020 (USD 11.1 million) is aimed at ensuring that WFP’s workforce is appropriately managed and has the capabilities for leading and delivering on its corporate and
country strategic plans. The initiative will help WFP to anticipate future workforce needs for each
WFP/EB.2/2018/6-A/1 4
function, build functional capabilities and surge capacity, support cross-cutting skills development,
and expand its learning technology infrastructure in order to deliver a holistic information
technology (IT) platform for workforce development. These coordinated activities will lay the
foundation for an integrated capacity development approach.
The WFP 2030 Fund (USD 15 million) will finance actions that bridge the gap between
WFP’s previous and its new ways of working with a view to positioning WFP so that it can deliver
transformative CSPs that address the findings of countries’ comprehensive zero hunger
strategic reviews. The fund will strengthen the ability of selected country offices to operationalize
the CSPs through new initiatives and adapted working modalities.
The United Nations reform initiative (USD 8.2 million) will ensure that WFP has the capacity to
prepare for and support the Secretary-General’s reform of the United Nations development system. In 2019 and 2020, the investment will be directed to three main objectives: ensuring that
WFP has adequate capacity to prepare for and respond to the requirements of the reform;
supporting WFP’s role as co-lead of the business innovation group, which will focus on developing
common enabling services and common premises across the United Nations with associated
cost savings; and contributing to the development of processes, tools and platforms that will
enable the United Nations development system to gather and report on the system-wide collective
results achieved.
Under this initiative, WFP is committed to providing surge capacity to its New York office,
the United Nations development system reform transition team based in New York and the
inter-agency project team that was established to support the business innovations group.
The cash and the digital platform critical corporate initiative (CCI) (USD 20 million) will
leverage data and technology in order to enhance knowledge and improve the delivery of
assistance to people in need.
A digital ecosystem will be created from a combination of systems that have been internally built,
purchased by WFP or provided through partnerships. The investment will be used to fund the
completion and testing of the core elements of a digital system for cash-based transfers and to
create a platform that enables cost-efficient and cost-effective programmes, irrespective of the
transfer modality used.
Systems integration and IT-enabled efficiencies (USD 5 million) will launch investment in a
platform that integrates existing and new systems. Investing in the integration of corporate
systems will first require identification of the challenges to and gaps in existing system alignment.
Subsequent work on the development of tools, such as the incorporation of data analytics and the
strengthening of linkages between resources and results, will enhance the transparency of the
data provided to Member States via the CSP Data Portal and the presentation of management
insights via the WFP management dashboard. In 2019, WFP will also continue to deliver simplified
and automated core functional processes with a view to improving the efficiency of its operations.
Actions in this area include the rollout of a global service management tool for business support
functions, increased automation of data flows among systems in order to eliminate the need for
manual entry, and an assessment of the feasibility of using process automation technologies for
simplifying repetitive tasks.
Use of the General Fund
A report by the Inspector General included a recommendation for increasing staffing levels in the
Treasury Branch in order to meet the growing demand for treasury services that arises from
having larger volumes of cash and investments and increased business complexity.
Interest income from investments is credited to the General Fund. The Secretariat proposes to
increase the annual allocation from the General Fund for support to the Treasury Branch to
USD 1.5 million.

WFP/EB.2/2018/6-A/1 5
Review of the full cost recovery principle
Since 2017, the Secretariat has been reviewing WFP’s policies for full cost recovery and ISC rates. Based on inputs provided during informal consultations with the Board in 2018 on implementation
of the Integrated Road Map (IRM), the standard ISC rate of 6.5 percent will be applied to the vast
majority of contributions. In addition, it is proposed that a reduced ISC rate of 4 percent be applied
to contributions of two types: those that host governments make to WFP programmes in their own
countries; and those made by developing countries or countries with economies in transition.
Contributions made by host governments require less support from headquarters and
regional bureaux than other contributions so the proposed reduced ISC rate satisfies the
requirements for full cost recovery. The application of a reduced rate reflects the integration of
country-level trust funds into the IRM framework and underscores the importance of
host governments’ engagement in and national ownership of CSP implementation.
Contributions made by developing countries or countries with economies in transition incur
similar administrative costs to those of regular contributions. A new clause in General Rule XIII.4
will allow a reduced ISC rate to be applied to these contributions.
Corporate trust funds and special accounts
Trust funds are contributions that support WFP’s objectives but whose purpose, scope and reporting requirements are outside WFP’s regular operational programmes. Corporate trust funds at the headquarters and regional bureau levels support the enhancement of WFP’s institutional capacity and effectiveness in areas such as climate change, emergency preparedness and
response, food security, government capacity strengthening, nutrition and supply chain.
Corporate trust fund expenditure of USD 108.5 million is planned for 2019.
Special accounts enable WFP to finance its management of corporate services, provide business
services, and support activities that do not fall within a CSP.
WFP established the corporate services financing mechanism in 2014 to provide services
economically and efficiently through three types of financing: the Capital Budgeting Facility (CBF),
the Global Vehicle Leasing Programme and fee-for-service activities. All three are managed
through special accounts, and the overall ceiling of USD 82 million will be retained for 2019.
The ceiling for the CBF is USD 47 million, of which USD 20 million has been used to support
implementation of the Logistics Execution Support System (LESS). It is projected that the
CBF advance for LESS will be fully repaid by the end of 2018. Based on the successful experience
of using the CBF for the LESS pilot scheme, and the noted long-term efficiency gains, the
Secretariat is considering other options for using this financing facility.
Outside the corporate services financing mechanism, other special accounts provide
support services for WFP and its partners. The estimated volume of transactions in these
special accounts for 2019 is USD 152 million.
WFP/EB.2/2018/6-A/1 6
Draft decision*
Having considered WFP’s Management Plan (2019 2021) (WFP/EB.2/2018/6-A/1), the Board:
i. notes that the 2019 programme support and administrative appropriation assumes a
funding level of USD 6.8 billion in 2019;
ii. takes note of the projected operational requirements of USD 9.8 billion for 2019 and the
prioritization proposals to align the activities of WFP with anticipated funding, as outlined in
section III of the Management Plan (2019 2021);
iii. approves a 2019 programme support and administrative appropriation of USD 385.1 million,
to be allocated as follows:
strategy and direction USD 58.4 million
services to operations USD 218.7 million
governance, independent oversight and fundraising USD 108.0 million
Total USD 385.1 million
iv. approves the allocation of USD 69.3 million from the programme support and
administrative equalization account for critical corporate initiatives;
v. approves a standard indirect support cost recovery rate of 6.5 percent for 2019 for all
contributions except for governments’ contributions to programmes in their own countries
and contributions made by developing countries or countries with economies in transition,
as determined by the Executive Board, for which an indirect support cost recovery rate of
4 percent in 2019 shall apply;
vi. approves a ceiling of USD 82 million for corporate services advances from 2019 and looks
forward to reviewing this as part of future management plans; and
vii. authorizes the Executive Director to adjust the programme support and administrative
component of the budget in accordance with a change in the level of the forecasted income
for the year, at a rate not to exceed 2 percent of the anticipated change in income.
* This is a draft decision. For the final decision adopted by the Board, please refer to the decisions and recommendations
document issued at the end of the session.
WFP/EB.2/2018/6-A/1 7
Section I: Introduction
Reader’s guide 1. The Management Plan (2019 2021) presents a summary of WFP’s planned programmes for
the period based on the expected requirements, the resources it aims to raise and the
resources it expects to have available. The plan is intended for internal and
external oversight and accountability purposes but is not replacing the total needs’ plan of all beneficiaries, that WFP will continue to advocate for and which will remain the basis for
country office programme design.
2. The executive summary, draft decision and introduction to each section explain the flow and
logic of the plan. The body of each section contains the detailed provisions.
Structure of the document
3. The Management Plan (2019 2021) comprises an executive summary, draft decisions,
five sections and a number of annexes:
➢ Section I: Introduction. This section contains a discussion of the global economic and
political context for WFP’s management proposals.
➢ Section II: Funding context and resourcing assumptions. This section provides details of
the resourcing assumptions underlying projections of the level of resources expected
to be received during 2019.
➢ Section III: Operational requirements and implementation plan for 2019. The presentation
of information in this section follows the structure of the approved Strategic Plan
(2017 2021) and the Corporate Results Framework (CRF) (2017 2021). The section
contains an overview of operational requirements, the implementation plan for 2019
that is a consolidation of the individual country-level implementation plans prepared
by country offices on the basis of their individual funding projections, which are in turn
the result of detailed discussions with donors. Information continues to be drawn from
the different country planning instruments foreseen in the Integrated Road Map,
which are country strategic plans (CSPs), interim country strategic plans (ICSPs) and
transitional ICSPs (T-ICSPs). More details are available in the CSP data portal,
the website platform where Member States have access to programme, financial and
performance-related information.
➢ Section IV: Programme support and administrative budget. This section presents the
proposed 2019 programme support and administrative (PSA) budget, which is set
below the forecast level of indirect support cost (ISC) income for 2019. The section also
contains details of the proposed ISC rate for contributions provided by
host governments and those made by developing countries or countries with
economies in transition. The PSA budget is presented according to the appropriation
lines approved by the Executive Board in 2018 and by results pillar.
➢ Section V: Management performance measurement. This section presents the
management performance standards set in the Corporate Results Framework as well
as corporate priority performance measures established by external agreements and
WFP management. Tables of management key performance indicators (KPIs) and
components with baselines and targets are provided as well as KPIs measuring
progress of corporate priorities. These references are also used in reporting against
the management plan in the annual performance report.
WFP/EB.2/2018/6-A/1 8
➢ Section VI: Corporate trust funds and special accounts. This section presents the expected
amounts of corporate trust funds and special accounts, together with updates on
proposals for using the USD 82 million corporate services financing mechanism.
The annexes include details of the PSA budget and the evaluation work plan for 2019 2021.
Programmatic information is contained in section III, with fuller details of the operational
requirements and implementation plans for each country available on the management
plan website.
Global economic and political context
Economic outlook
4. In June 2018, the World Bank Group predicted that the global economic growth rate would
continue to be 3.1 percent in 2018, declining to 2.9 percent by 2020. In emerging markets
and developing economies, aggregate growth is expected to be firmer, but with only modest
upswings in commodity exports.1
5. The more prominent risks today include increasingly inward-looking protectionist policies
and geopolitical strains. Should trade restrictions among major economies intensify further,
global trade could depart from its recovery path, dampening investment activities and
ultimately leading to a global slowdown with severe consequences for those countries
relying on primary exports and that do not have the fiscal means to cushion the economy
by reacting in the policy space.
6. Crude oil prices (Brent) have recovered remarkably since the beginning of 2016, recently
because of supply constraints. Fuel prices rose by 150 percent between January 2016 and
May 2018, reaching almost USD 80/barrel in July 2018. The overall price recovery has
benefited exporting countries with their suppressed current account balances but also
raised caution against headline inflation in advanced and emerging economies.
7. Metal prices have also continued to recover considerably since early 2016. The World Bank
Metal & Mineral Price Index had increased by 20 percent year-on-year in May 2018, further
improving exporters’ revenues. For copper producers such as Zambia, however, respective prices continue to decline, losing about 4 percent in the past year.2
8. Global food prices have been on an upward trend in 2018 but are still below their
2017 levels. The Food Price Index of the Food and Agriculture Organization of the
United Nations (FAO) averaged 173.7 points in June 2018, negligibly lower than in June 2017.
While cereal prices increased by 8 percent in the same period, the 10 percent declines in
both sugar and dairy prices kept the index down. Higher oil prices, rising trade tensions,
currency fluctuations and weather patterns will influence the outlook for food markets over
the next year.
9. Local food prices remain under pressure in countries that are affected by adverse weather
conditions, conflict or economic turmoil. Consumers face rising cereal prices that trigger
anomaly alerts up to the crisis phase of the Alert for Price Spikes (ALPS) in, for example,
Burkina Faso, Mauritania, the Sudan and Yemen, reflecting consumers’ significantly reduced purchasing power for buying food.
1 World Bank Group. 2018. Global Economic Prospects The Turning of the Tide?
http://documents.worldbank.org/curated/en/409371528428688065/pdf/Embargoed-GEP2018b-full-report-05142018.pdf
2 World Bank Group. 2018. World Bank Commodities Price Data (The Pink Sheet), July 2018.
http://www.worldbank.org/en/research/commodity-markets.
WFP/EB.2/2018/6-A/1 9
10. Many emerging economies are experiencing high depreciation of their currencies against
the United States dollar. Countries where depreciation has reached alarming levels include
the Sudan, Angola, Argentina, Liberia, Turkey, the Bolivarian Republic of Venezuela and
the Islamic Republic of Iran.3
Climate
11. Climate and natural hazards are significant drivers of malnutrition and food insecurity.
Current areas of concern include the western Sahel, particularly Senegal and Mauritania
where rainfall forecasts indicate that conditions will continue to be drier than average during
the August 2018 rainfall season. If these forecasts are realized, the two countries will face a
second consecutive season of low crop and pasture production. Elsewhere in the Sahel and
towards Ethiopia and the Sudan, prospects are better and close to normal crop production
levels are expected.
12. In Central America and the Caribbean, through most of the second agricultural season
( de postrera ), recent dryness is forecast to continue at levels that may lead to significant shortfalls in crop production relative to recent average levels.
13. International institutions have declared El Niño Watch status: given current conditions and
forecasts, El Niño is likely to start an event in late 2018, potentially affecting the coming
short rains in East Africa and the next growing season in Southern Africa. In East Africa, the
impacts will result in enhanced rainfall, which will help pastoralist communities after the
recent sequence of droughts, but may lead to flooding, the scale of which would depend on
rainfall intensity and distribution. In Southern Africa, El Niño events usually lead to drier than
average conditions, affecting in particular vulnerable communities in Malawi,
southern Zimbabwe and Southern Mozambique. According to current seasonal forecasts,
Indonesia and surrounding regions are expected to suffer a fairly dry growing season.
14. WFP will continue to monitor growing season conditions throughout the coming months.
It is a contributing member of an inter-agency global El Niño unit, which provides a unified
opinion regarding the likelihood and possible impacts of such an event, and identifies
countries where early action should be prioritized.
Political instability and conflict
15. The geopolitical power shifts and multiple protracted large-scale conflicts currently taking
place will result in significant uncertainties, risks and challenges in 2019. Encouraging
developments are also occurring however. The Ethiopia Eritrea peace deal offers hope for
better stability in the Horn of Africa, particularly in Djibouti, Somalia and Somaliland, as
border tensions and conflicts over use of resources are likely to ease.
16. Over the past year, the number of people experiencing food crises and emergencies has
risen from 108 million to 124 million in 51 countries. This rise can largely be attributed to
new or intensified and protracted conflict or insecurity in, for example,
the Democratic Republic of the Congo, Myanmar, northern Nigeria, South Sudan and
Yemen. The worst food crises are in Yemen, South Sudan, northeastern Nigeria and Somalia,
where a total of nearly 32 million people are food-insecure and in need of urgent assistance.
Although humanitarian assistance has thus far contributed to preventing large-scale
famines, humanitarian needs remain exceptionally high in the four countries.
17. Forced displacements continue at a record rate and grew for the sixth consecutive year to
affect 68.5 million people, approximately two thirds of whom were internally displaced.
3 WFP Vulnerability Analysis and Mapping Unit. 2018. Economic Analysis Currencies, Hotspots.
http://dataviz.vam.wfp.org/global-coverage-currencies-sep-2017.
WFP/EB.2/2018/6-A/1 10
International humanitarian assistance
18. In 2017, an estimated 201.1 million people required international humanitarian assistance
as a result of crises. Conflict continued to fuel much of this need, with complex crises4
occurring in 29 of the 36 countries with the highest numbers of people in need. International
humanitarian assistance reached USD 27.3 billion in 2017, representing a 3 percent increase
for the second consecutive year, despite slowed growth in 2016 and 2017. Private donors
were primarily responsible for the increase.
19. Despite the increase in funding, there was still a shortfall of 41 percent for the
United Nations Consolidated Appeals Process. The funding gap affected appeals unevenly
as a small number of complex crises continued to absorb most of humanitarian assistance.
Sixty percent of all assistance was channelled to ten countries only, with 14 percent going to
the Syrian Arab Republic, the largest recipient, and 8 percent to Yemen, the second largest.
Organizational context
20. The Integrated Road Map (IRM) defines the transformative changes required to implement
the WFP Strategic Plan (2017 2021) and demonstrates WFP’s contribution to achieving the goals of the 2030 Agenda for Sustainable Development, particularly
Sustainable Development Goals (SDGs) 2 and 17. Following the Executive Board’s approval of the four components of the IRM5 at its 2016 second regular session, significant progress
has been made in implementation in 2017 and 2018, with 70 of WFP’s 82 country offices operating within the IRM framework by July 2018. During 2019, the final wave of countries
to move to the CSP framework will present their CSPs or ICSPs for Board approval.
Strategic Plan and Corporate Results Framework
21. The WFP Strategic Plan (2017 2021) and the CRF (2017 2021) have been in effect since
January 2017. The strategic plan aligns WFP with the 2030 Agenda, focusing on ending
hunger and contributing to revitalized global partnerships for achieving the SDGs.
It recognizes the strengths that WFP has built up over years of work in crisis response and
recovery, while also seeking opportunities to use this institutional expertise at the
humanitarian development peace nexus.
22. The CRF (2017 2021) was used in the design of recently approved CSPs, ICSPs and T-ICSPs.
Based on feedback and lessons learned in the CSP pilot phase, the CRF is being strengthened
to improve WFP’s reporting on its results and contribution to achieving national SDG targets. Additions and revisions to programme indicators will be included for consideration in the
revised CRF, to be presented to the Board for approval at its 2018 second regular session.
23. The Corporate Results Framework is also being strengthened by the incorporation of
key management performance indicators. This will support successful implementation of
the CSPs, assist in internal reporting and contribute to delivery on WFP’s commitments to
accountability and transparency.
4 Complex crises involve at least two of the following three conditions: conflict, disaster associated with natural hazards,
and refugee situations.
5 WFP Strategic Plan (2017 2021) (WFP/EB.2/2016/4-A/1/Rev.2), Policy on Country Strategic Plans (WFP/EB.2/2016/4-
C/1/Rev.1), Financial Framework Review (WFP/EB.2/2016/5-B/1/Rev.1) and Corporate Results Framework (2017 2021)
(WFP/EB.2/2016/4-B/1/Rev.1).

WFP/EB.2/2018/6-A/1 11
24. A revised CRF in 2019 will build on the current approach. Including both programme and
management performance indicators in the CRF advances a single framework to measure
WFP’s use of resources to achieve results. The CRF standards will give guidance across WFP
while maintaining the ability to refine based on lessons learned from monitoring, reporting
and evaluating CSP implementation.
Governance
25. The changes that WFP implemented during development of the IRM have compelled it to
review the general rules and financial regulations in order to ensure that they are aligned
with WFP’s new way of operating within the IRM framework. The realignment aims to ensure that terminology and definitions are coherent with the IRM framework, that the 1995 policy
on full-cost recovery is consistent with the IRM and that delegations of authority are
also updated.
26. Revised general rules and financial regulations will be considered by the Board at its
2018 second regular session. If approved, they will take effect from January 2019.
27. The interim delegations of authority that were established at the Board’s 2017 second regular session in order to allow IRM implementation within the new
architecture will remain valid until February 2020. The period up to that date will be used to
review the operation of existing interim delegations and to consider whether any changes
are necessary, based on experience gained from working in the new environment.
The permanent delegations of authority should take effect from 1 March 2020.
Summary
28. In 2019 the last wave of country offices will present their strategic plans to the
Executive Board. The changeover to this new way of working will be made while WFP
continues to implement emergency responses to seven Level 3 and five Level 2 crises
(at time of writing).
29. The critical corporate initiatives outlined for implementation starting in 2019 will strengthen
WFP. They will improve WFP’s ability to keep better track of vulnerable populations and to share data, while protecting the privacy and rights of the individuals concerned. WFP will
co-lead in United Nations business innovations aimed at generating savings through
consolidating back-office services and increasing the proportion of United Nations common
premises. The WFP 2030 Fund will ensure that WFP has the capacity to deliver truly
transformative country strategic plans and interim country strategic plans in selected
countries, while staff skills will be strengthened through investments that ensure the
sustained development of the staff capabilities required by 2020. Alongside these initiatives,
increased investments in WFP’s oversight entities will be made through the programme support and administrative budget in order to provide greater assurance to stakeholders
on WFP’s utilization of resources.
WFP/EB.2/2018/6-A/1 12
Section II: Funding context and resourcing assumptions
Overview
30. This section provides an overview of the financial context and assumptions supporting
WFP’s 2019 revenue forecast of USD 6.8 billion, including income from trust funds and
the immediate response account (IRA). The forecast is based on donor positions and trends
and reconciled with local funding projections from each country, which are aggregated to
form the basis of the Management Plan.
31. WFP continues to advocate for flexible and predictable funding. This section highlights
analysis and efforts in support of such types of funding.
32. In the face of record levels of humanitarian needs worldwide in 2018, WFP continues its
efforts to respond to emergencies. This section reflects on anticipated funding trends and
resourcing requirements in the present Management Plan, which was prepared six months
in advance of the budget period. Funding trends and requirements are continuously
adjusted in line with WFP’s operational needs.
Keeping pace with global trends
33. In 2017, implementation of the IRM started throughout WFP to further optimize operational
efficiency and effectiveness. The current strategic plan and the updated programmatic and
financial architecture resulting from introduction of the IRM provide new corporate tools as
well as programmatic and financial insights to catalyse increased predictable and
flexible funding.
34. WFP plays a critical role in addressing current and future humanitarian crises, and advocacy
is critical in generating the funding for WFP to respond to calls for action. With conflict driving
so many humanitarian needs, it is essential to emphasize the importance of WFP’s role in working at the humanitarian development peace nexus — following the triple nexus approach — in a globally challenging socio-political landscape.
35. WFP faces a clear challenge to increase financial commitments from not only its largest
donors, but also other funding sources and new donors to help WFP meet its operational
needs. WFP continues to augment the scope of funding streams from existing and potential
donor partners. Mindful of the United Nations reform agenda, WFP also continues to
explore the use of new financial instruments such as thematic funds, pooled funds,
digital channels, disaster insurance and debt swaps to boost its ability to respond to the
strategic and resourcing requirements of its programme of work.
WFP funding trends: 2018 2019 forecast
36. Available donor intelligence and a review of funding trends suggest that contributions
revenue for 2018, including trust funds, may reach USD 7.2 billion. The critical need to
address food insecurity, coupled with significant access challenges mean that WFP will
continue to play a key role in efforts to address many of the largest global challenges. While
emergency funding allocations are difficult to predict in advance, WFP remains confident
that contributions revenue will reach USD 6.8 billion in 2019. Strengthened fundraising
efforts, including a focus on diversifying funding sources, intensified corporate engagement
with International Financial Institutions (IFIs) and thematic funding, as well as partnerships
with private sector stakeholders, aim to reduce further the gap between needs and available
resources throughout 2019.

WFP/EB.2/2018/6-A/1 13
Possible effects of changing political landscapes on WFP income
37. The shifting geo-political landscape and the associated strategic priorities of major donors
will continue to have a significant impact on funding decisions in the future.
Humanitarian needs will continue to be prominent. However, recognition of the importance
of the triple nexus approach in promoting social and economic progress and fostering
political and social stability suggests that donors are likely to respond positively to
WFP’s overall funding needs. Ongoing domestic concerns about the effects of migration in
many countries in Europe are contributing to clearer perceptions of the impact of food
insecurity as a driver of conflict and displacement. Security Council resolution 2417 on
conflict-induced hunger (May 2018) has reinforced the importance of support for
WFP’s work.6
Keeping pace with needs WFP contribution trends
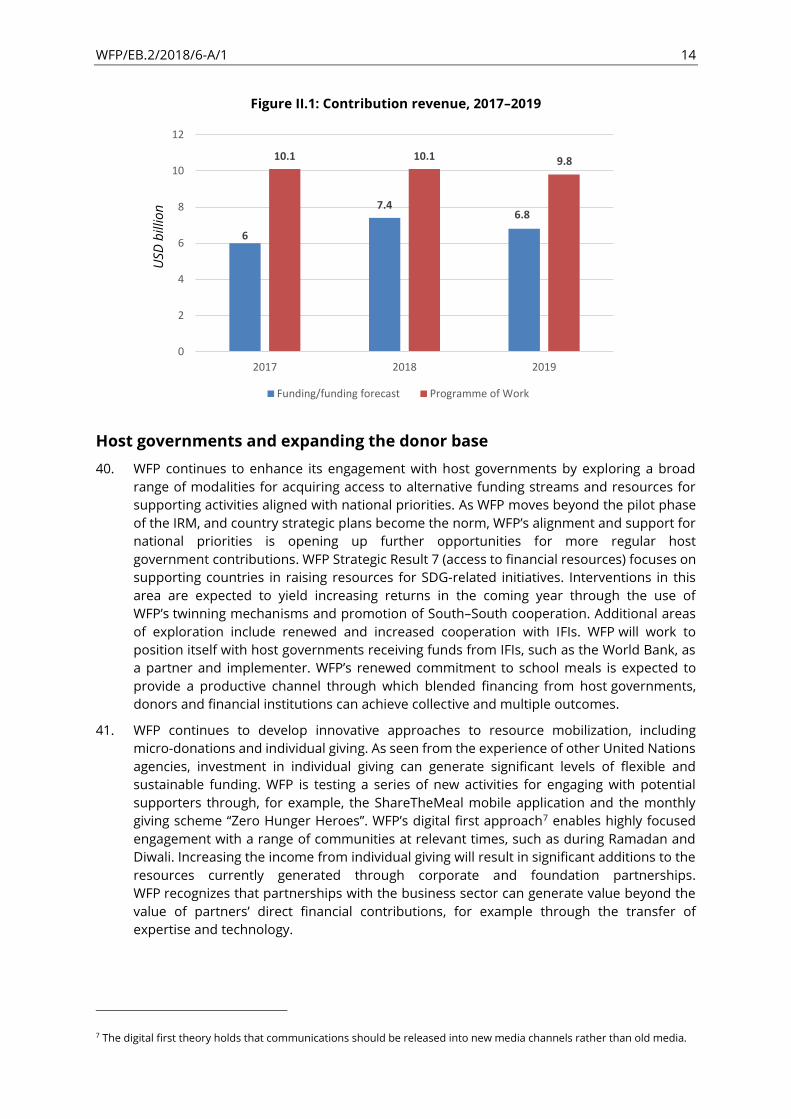
38. Operational requirements for 2018 stand at USD 10.1 billion. The operational funding gap
for 2018 is estimated at 29 percent with estimated resources of USD 7.2 billion.
The continued high level of operational needs is a result of requirements for Level 3
emergency responses, which account for approximately 60 percent of WFP’s programme of work. WFP received its highest ever annual level of contribution revenue in 2017, at
USD 6.0 billion. This is expected to be exceeded in 2018 as the criticality of needs in
WFP’s largest operations (Yemen, the Syrian Arab Republic and South Sudan) remains at
an all-time high.
39. Funding forecasts for 2019 factor in optimistic scenarios of a reduction in projected needs
in the largest operations with a commensurate decline in revenue, albeit with a continued
reduction in the percentage funding gap. However, in the event that WFP’s funding needs remain similar to, or increase beyond, its 2018 resource requirements because of major
crises or events in 2019, projections of contribution revenue foresee a commensurate
increase in funding levels. Projected contribution levels for 2020 and 2021 are for the
moment anticipated to remain similar to those of 2019, but updates will be provided
regularly to the Executive Board as such projections are revised over time. A snapshot of
WFP’s funding and contribution revenue forecasts for the period 2017 to 2019 is provided in figure II.1.
6 United Nations. 2018. Security Council resolution 2417 (2018) [on conflict-induced food insecurity].
https://digitallibrary.un.org/record/1627835?ln=en
WFP/EB.2/2018/6-A/1 14
Figure II.1: Contribution revenue, 2017 2019
Host governments and expanding the donor base
40. WFP continues to enhance its engagement with host governments by exploring a broad
range of modalities for acquiring access to alternative funding streams and resources for
supporting activities aligned with national priorities. As WFP moves beyond the pilot phase
of the IRM, and country strategic plans become the norm, WFP’s alignment and support for national priorities is opening up further opportunities for more regular host
government contributions. WFP Strategic Result 7 (access to financial resources) focuses on
supporting countries in raising resources for SDG-related initiatives. Interventions in this
area are expected to yield increasing returns in the coming year through the use of
WFP’s twinning mechanisms and promotion of South South cooperation. Additional areas
of exploration include renewed and increased cooperation with IFIs. WFP will work to
position itself with host governments receiving funds from IFIs, such as the World Bank, as
a partner and implementer. WFP’s renewed commitment to school meals is expected to
provide a productive channel through which blended financing from host governments,
donors and financial institutions can achieve collective and multiple outcomes.
41. WFP continues to develop innovative approaches to resource mobilization, including
micro-donations and individual giving. As seen from the experience of other United Nations
agencies, investment in individual giving can generate significant levels of flexible and
sustainable funding. WFP is testing a series of new activities for engaging with potential
supporters through, for example, the ShareTheMeal mobile application and the monthly
giving scheme Zero Hunger Heroes . WFP’s digital first approach7 enables highly focused
engagement with a range of communities at relevant times, such as during Ramadan and
Diwali. Increasing the income from individual giving will result in significant additions to the
resources currently generated through corporate and foundation partnerships.
WFP recognizes that partnerships with the business sector can generate value beyond the
value of partners’ direct financial contributions, for example through the transfer of expertise and technology.
7 The digital first theory holds that communications should be released into new media channels rather than old media.
6
7.46.8
10.1 10.1 9.8
0
2
4
6
8
10
12
2017 2018 2019
Funding/funding forecast Programme of Work
USD
billio
n
WFP/EB.2/2018/6-A/1 15
Flexible and predictable funding
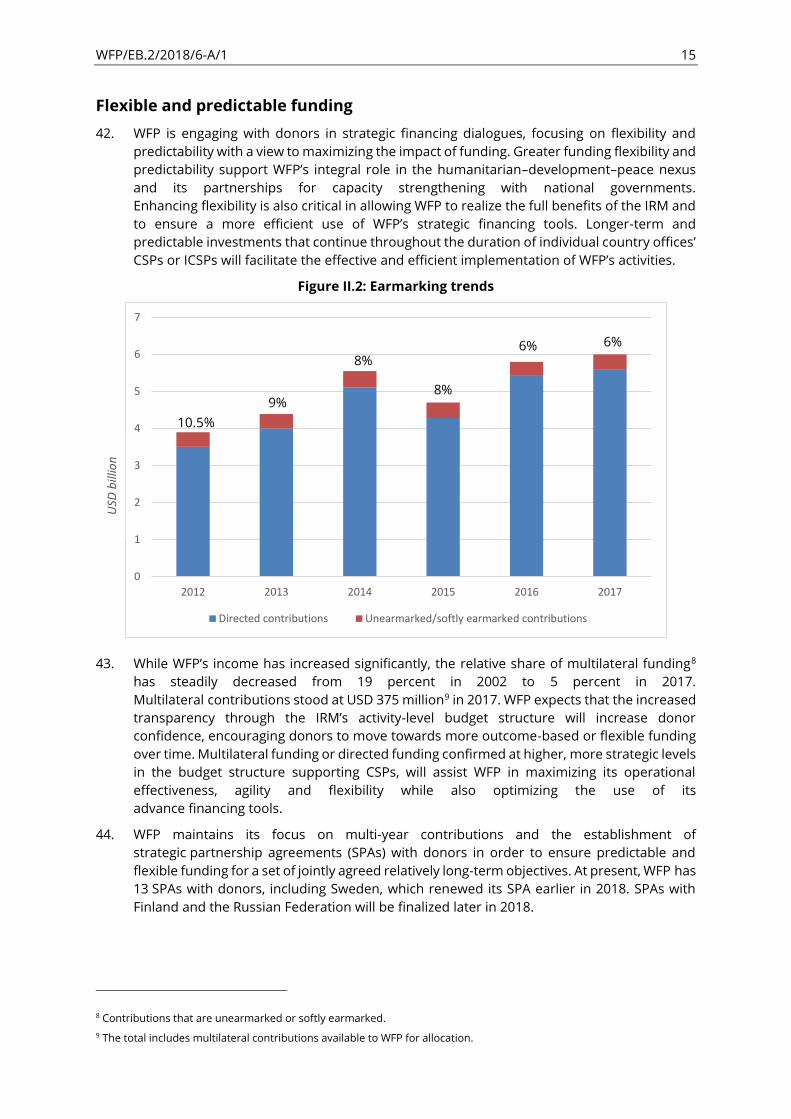
42. WFP is engaging with donors in strategic financing dialogues, focusing on flexibility and
predictability with a view to maximizing the impact of funding. Greater funding flexibility and
predictability support WFP’s integral role in the humanitarian development peace nexus
and its partnerships for capacity strengthening with national governments.
Enhancing flexibility is also critical in allowing WFP to realize the full benefits of the IRM and
to ensure a more efficient use of WFP’s strategic financing tools. Longer-term and
predictable investments that continue throughout the duration of individual country offices’ CSPs or ICSPs will facilitate the effective and efficient implementation of WFP’s activities.
Figure II.2: Earmarking trends
43. While WFP’s income has increased significantly, the relative share of multilateral funding8
has steadily decreased from 19 percent in 2002 to 5 percent in 2017.
Multilateral contributions stood at USD 375 million9 in 2017. WFP expects that the increased
transparency through the IRM’s activity-level budget structure will increase donor
confidence, encouraging donors to move towards more outcome-based or flexible funding
over time. Multilateral funding or directed funding confirmed at higher, more strategic levels
in the budget structure supporting CSPs, will assist WFP in maximizing its operational
effectiveness, agility and flexibility while also optimizing the use of its
advance financing tools.
44. WFP maintains its focus on multi-year contributions and the establishment of
strategic partnership agreements (SPAs) with donors in order to ensure predictable and
flexible funding for a set of jointly agreed relatively long-term objectives. At present, WFP has
13 SPAs with donors, including Sweden, which renewed its SPA earlier in 2018. SPAs with
Finland and the Russian Federation will be finalized later in 2018.
8 Contributions that are unearmarked or softly earmarked.
9 The total includes multilateral contributions available to WFP for allocation.
0
1
2
3
4
5
6
7
2012 2013 2014 2015 2016 2017
Directed contributions Unearmarked/softly earmarked contributions
US
D b
illi
on
10.5%
9%
8%
8%
6% 6%
WFP/EB.2/2018/6-A/1 16
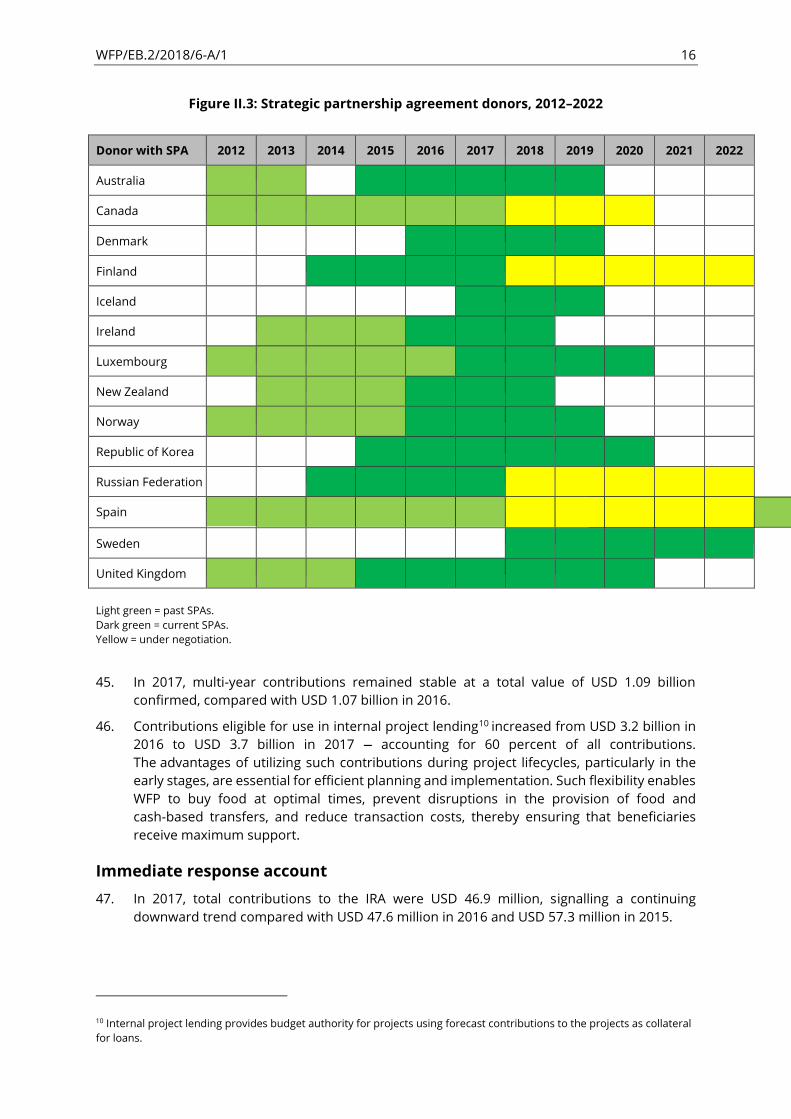
Figure II.3: Strategic partnership agreement donors, 2012 2022
Donor with SPA 2012 2013 2014 2015 2016 2017 2018 2019 2020 2021 2022
Australia
Canada
Denmark
Finland
Iceland
Ireland
Luxembourg
New Zealand
Norway
Republic of Korea
Russian Federation
Spain
Sweden
United Kingdom
Light green = past SPAs.
Dark green = current SPAs.
Yellow = under negotiation.
45. In 2017, multi-year contributions remained stable at a total value of USD 1.09 billion
confirmed, compared with USD 1.07 billion in 2016.
46. Contributions eligible for use in internal project lending10 increased from USD 3.2 billion in
2016 to USD 3.7 billion in 2017 — accounting for 60 percent of all contributions.
The advantages of utilizing such contributions during project lifecycles, particularly in the
early stages, are essential for efficient planning and implementation. Such flexibility enables
WFP to buy food at optimal times, prevent disruptions in the provision of food and
cash-based transfers, and reduce transaction costs, thereby ensuring that beneficiaries
receive maximum support.
Immediate response account
47. In 2017, total contributions to the IRA were USD 46.9 million, signalling a continuing
downward trend compared with USD 47.6 million in 2016 and USD 57.3 million in 2015.
10 Internal project lending provides budget authority for projects using forecast contributions to the projects as collateral
for loans.
WFP/EB.2/2018/6-A/1 17
Section III: Operational requirements and
implementation plan for 2019
Overview
48. WFP continues its commitment to aligning and integrating its food assistance capacities and
programmes with those of national authorities and other partners, in accordance with the
Sustainable Development Goals (SDGs). The strategic and programmatic shift set out in the
WFP Strategic Plan (2017—2021) is embedded in planning processes that are designed to
build on WFP’s priority emergency assistance in ways that result in not only saving lives but
also changing lives.
49. The Management Plan (2019 2021) defines the next phase in implementation of the
Integrated Road Map (IRM). Country strategic plans (CSPs), an integral component of the
IRM, are aligned with the WFP Strategic Plan (2017—2021) and the Corporate Results
Framework (CRF) (2017—2021). While the Management Plan (2018—2020) focused on
aligning WFP’s objectives and activities with the SDGs, the Management Plan (2019—2021)
outlines how WFP is delivering against the goals of the 2030 Agenda through well designed
strategies and programmes implemented in close partnership with nations, communities,
non-governmental organizations and United Nations agencies, particularly the Rome-based
agencies, the Office of the United Nations High Commissioner for Refugees (UNHCR) and
the United Nations Children’s Fund (UNICEF).
50. Since its adoption in 2013, the resource-based planning approach used in developing the
implementation plan, whereby operational requirements based on assessed needs are
prioritized according to forecasted contributions and incorporated into an
implementation plan, has become an essential mechanism for enhancing performance and
accountability.
51. Achieving the goals of the management plan requires that implementation of the
CSPs results in transformative programmes that save and change lives. In the
Management Plan (2019—2021), there is a renewed focus on leadership in emergencies and
programme excellence, with an emphasis on the humanitarian development peace nexus.
Saving lives and changing lives also requires funding and partnerships for zero hunger, a
digital transformation of WFP and for the people it serves, and increased simplicity,
efficiency and impact.
52. WFP and the broader humanitarian and development community face a growing number of
challenges: increasing instability and conflict, the consequences of climate change, and
large-scale migration resulting from conflicts and extreme weather events. Worldwide,
the number of people who are acutely food-insecure increased from 108 million in 2016 to
124 million in 2017, a rise of 15 percent.11 Of great concern is the evidence of a continuing
rise in world hunger, reversing the prolonged trend in declining hunger. In 2017, the number
of chronically food-insecure people is estimated to have increased to 815 million,
an increase of 38 million people (11 percent) from the previous year, meaning that about
one in every nine people in the world is hungry.
11 Food Security Information Network. 2018. Global Report on Food Crises 2018.
http://vam.wfp.org/sites/data/GRFC_2018_Full_Report_EN.pdf.
WFP/EB.2/2018/6-A/1 18
53. This situation has given rise to an unprecedented number of declared WFP emergencies,
and ongoing Level 3 emergencies represent the highest number of concurrent emergencies
that WFP has ever faced. Declared emergencies comprise seven Level 3 emergencies in
Bangladesh, the Democratic Republic of the Congo, northeastern Nigeria, the Sahel region
(covering Burkina Faso, Chad, Mali, Mauritania and the Niger), South Sudan, the Syrian Arab
Republic (including the impact of the Syrian crisis on neighbouring Egypt, Iraq, Jordan,
Lebanon and Turkey) and Yemen; and five Level 2 emergencies in the Central African
Republic, on the Colombia Venezuela border and in Iraq, Libya and Myanmar. In many of
these emergencies, conflict is the primary driver of humanitarian needs.
54. Figure III.1 shows that WFP’s Level 2 and 3 emergency responses in the Sahel/Mali,
South Sudan, the Syrian Arab Republic and Yemen will all have lasted for more than six years
by the end of 2018.
WFP/EB.2/2018/6-A/1 19
Figure III.1: WFP Major Emergency Responses
WFP/EB.2/2018/6-A/1 20
55. The magnitude of the overall requirements for these emergency responses reflects the
complex and protracted nature of many emergencies, such as those in the Central African
Republic, the Syrian Arab Republic and Yemen, and exacerbating factors such as successive
outbreaks of Ebola in the Democratic Republic of the Congo. The large and growing numbers
of beneficiaries are paired with significant resourcing constraints, which in some cases have
prevented WFP from reaching everyone in need in some of today’s most severe humanitarian emergencies.
56. While recognizing that saving lives is an overwhelming global need and the
core responsibility of WFP, the Secretariat also recognizes that there is a need to increase
investments and partnerships in order to deliver meaningful change in the lives of the
poorest and most vulnerable people. This requires WFP to establish strategic partnerships
with national and local authorities and other development actors, adhere to
humanitarian principles, and contribute to peace where appropriate.
57. In the Niger, for example, WFP has made progress in changing lives through
climate-sensitive livelihood and asset creation programmes and support for
smallholder farmers. These interventions are focused on vulnerable communities that are
subjected to recurrent drought, conflict and structural challenges such as lack of access to
education or land. Evidence shows that meeting the immediate humanitarian needs of these
vulnerable populations while simultaneously addressing longer-term issues can be
expected to result in reductions in migration, increases in households’ incomes and the coming together of communities (men and women) in order to identify priorities and
common goals. The achievement of these results is made possible by multi-year,
flexible funding, partnerships and government leadership.
58. Following this approach incurs a cost, however. Resilience building is more expensive than
traditional humanitarian response at the outset, but the returns reduce humanitarian costs
in the long term. For every USD 1 invested in building people’s resilience, donors can expect to save up to USD 3 in reduced humanitarian aid and avoided losses.12
59. Faced with increases in the numbers of acutely food-insecure people and constraints to
financing in 2018, WFP has had to make difficult decisions, determining which of the world’s most vulnerable populations — including those in conflict zones such as the Syrian Arab
Republic and Yemen — to prioritize for assistance and deciding who receives desperately
needed support. The need for such prioritization will unfortunately continue given the
projected gap between WFP’s operational needs and its implementation plan. Investments in resilience building and political solutions for ending conflict have the potential to end
hunger, but resilience building efforts will fail if people’s essential needs are not being met.
The impact of limited resources on growing needs
60. WFP’s operational requirements for 2019 amount to USD 9.8 billion, a 9 percent increase from 2018 caused primarily by the 47 percent increase in requirements for Yemen, which
reach USD 1.6 billion for 2019. WFP’s three largest operations, in the Syrian Arab Republic and neighbouring countries affected by the Syrian crisis, Yemen and South Sudan, account
for 50 percent of overall operational requirements.
12 United States Agency for International Development. 2018. Economics of resilience to drought in Ethiopia, Kenya
and Somalia: Summary of overall findings. https://www.usaid.gov/documents/1867/economics-resilience-drought-
summary.
WFP/EB.2/2018/6-A/1 21
TABLE III.1: OPERATIONAL REQUIREMENTS VERSUS THE IMPLEMENTATION PLAN,
2017—2019 (USD million)
2017* 2018* 2019
Operational requirements 9 007 9 011 9 796**
Implementation plan 5 385 5 878 6 479***
% Projected funding difference 40 35 34
* In this and the following tables, figures for 2017 and 2018 come from the original management plan for 2017
(Management Plan 2017—2019) and for 2018 (Management Plan 2018—2020).
** Operational requirements include approved plans for 2019 and foreseen new needs as of mid-2018. It does
not reflect budget revisions initiated after July 2018, such as those for the Southern Africa lean season and the
Democratic Republic of the Congo Level 3 situation.
*** Forecasted funding totals USD 6.8 billion and the implementation plan totals USD 6.5 billion (10 percent
higher than in 2018). The USD 300 million difference between the implementation plan and the forecast is
because some of the projected resources for 2019 have not yet been allocated to country offices. Once these
allocations are made, the gap is expected to decrease from 34 to 31 percent.
61. The difference between the anticipated needs-based requirements
(operational requirements) and the implementation plan represents a challenge for WFP.
The gap continues to be of concern, considering the increase in global conflict, acceleration
of climate change and growth in cross-border and internal migration, each of which alone
has the potential to push additional countries into deeper food crisis. When considered
together, these factors put stability and food security throughout entire regions under
serious threat.
62. As needs continue to grow and forecasted funding limits WFP’s ability to assist affected populations, WFP must undertake difficult prioritization exercises and increasingly target
only the most vulnerable people and groups. Such prioritization creates a risk of not only
failing to deliver life-saving assistance, but also eroding the development gains of past years.
By undertaking prioritization among groups of people who are already classified as the most
severely vulnerable, WFP risks reaching only those people in the emergency and catastrophe
phases of the Integrated Food Security Phase Classification while neglecting additional
populations in crisis who risk sliding into these phases.
TABLE III.2: OPERATIONAL REQUIREMENTS VERSUS THE IMPLEMENTATION PLAN BY FOCUS AREA,
2018 AND 2019 (USD million)
2018 2019
Focus area Operational
requirements
Implementation plan Operational
requirements
Implementation
plan
Crisis response 6 618 4 356 6 530 4 242
Resilience
building
1 656 934 2 699 1 867
Root causes 736 589 566 370
Total 9 011 5 878 9 796 6 479
63. Requirements for crisis response remain on par with previous years, but resilience building
needs almost double. This reflects both the current high levels of need and an increased
emphasis on resilience building, particularly the shifting of the large-scale operation for
refugees in Turkey to the resilience building focus area in accordance with the CSP.
By following a more resilience-oriented approach in Turkey, WFP will combine ongoing,
European Union-supported efforts to ensure that the basic needs of Syrian refugees are
met while parallel investments foster resilience in institutions and systems.
WFP/EB.2/2018/6-A/1 22
These investments will include working closely with the Government of Turkey at both the
national and subnational levels; providing financial and technical support to the Turkish Red
Crescent as the selected partner of the Government in humanitarian delivery to
Syrian refugees; and expanding training and livelihood opportunities for refugees. In other
countries, strengthened resilience building activities include increased efforts to coordinate,
sequence and integrate food assistance for assets, nutrition, school feeding and
capacity building activities in vulnerable communities in order to achieve broader impact.
64. In 2019, forecasted operational requirements for root causes account for 6 percent of the
overall operational requirements. WFP’s work on strengthening countries’ national capacities will increase, in line with the plan for investing more heavily in addressing
underlying structural and systemic factors that cause food insecurity and poor nutrition.
Analysis by beneficiary numbers
TABLE III.3: BENEFICIARY NUMBERS ACCORDING TO OPERATIONAL REQUIREMENTS, 2018 AND 2019
(million)
Regional bureau 2018 2019
Bangkok — Asia and the Pacific 10.8 10.8
Cairo — Middle East, North Africa, Eastern Europe and Central Asia 26.8 26.0
Dakar — West Africa 10.6 9.6
Johannesburg — Southern Africa 13.8 8.9
Nairobi — East and Central Africa 21.9 19.8
Panama — Latin America and the Caribbean 3.7 3.7
Total 87.5 78.8
65. Between 2018 and 2019, the overall number of beneficiaries (according to
operational requirements) is forecast to decrease by 9.9 percent. Despite continued high
needs in Level 3 emergency responses, beneficiary numbers are projected to decline largely
because of the end of El Niño in the Southern Africa region. At the height of El Niño,
WFP increased the number of people receiving assistance in the region to more than
13 million. As this operation came to an end, the Malawi and Zimbabwe country offices
reduced the number of beneficiaries targeted by more than 5 million. In the East and
Central Africa region, beneficiary numbers are also projected to decline by nearly 1 million,
because of seasonal improvements in areas that are repeatedly affected by drought
and flooding.
66. The number of beneficiaries is not necessarily indicative of WFP’s volume of work, because
some beneficiaries might be assisted for a longer period than in the previous year.
Recent annual management plans have therefore provided figures on the foreseen
numbers of daily rations in order to better reflect the volume of transfers reaching
beneficiaries. In the 8213 countries where WFP is assisting people in 2019, the foreseen
operational requirements are of 21 billion daily rations, similar to the figure in the
2018 management plan.
67. The cost per ration is an important benchmark for WFP. The cost per ration is derived from
the operational budget and the expected number of rations to be distributed. The main
drivers of the cost per ration are the transfer cost itself and operating costs that depend
13 WFP currently has operations in 82 countries. This number will rise to 96 in 2019 on approval of the ICSP for the
Pacific islands.
WFP/EB.2/2018/6-A/1 23
directly on the context of the operation, such as the access and logistics conditions in
the country; and complementary items that are required in order to achieve the objective
of the intervention. These costs may be offset by economies of scale resulting from the
large size of WFP operations in the country.
68. In 2019, the weighted average cost per ration based on the needs-based plan is USD 0.42.
This global figure comprises a range of activities with different costs per ration, such as
school feeding, which has an average cost per ration of USD 0.20, and prevention of
malnutrition, which has an average cost per ration of USD 0.27. The costs per ration in
activities such as nutrition treatment, with an average cost of USD 0.39, and asset creation
and livelihood support, with USD 0.71, are due to the use of more specialized partnerships,
the inclusion of non-food items and the lower geographical concentration of beneficiaries.
Unconditional resource transfers, which represent most of the rations planned to be
distributed, are expected to have an overall average cost per ration of USD 0.44. This
average masks wide variations, particularly resulting from factors related to the context,
such as security costs and logistics constraints caused by access problems.
Ability to deliver against the SDGs
TABLE III.4: OPERATIONAL REQUIREMENTS VERSUS THE IMPLEMENTATION PLAN BY SDG, STRATEGIC OBJECTIVE AND STRATEGIC RESULT, 2019
SDG Strategic
Objective
Strategic Result Operational
requirements
(USD million)
Implementation
plan (USD million)
Difference
(%)
2 1: End hunger 1: Access to food 6 814 4 391 36
2: Improve
nutrition
2: End malnutrition 995 560 44
3: Achieve food
security
3: Smallholder
productivity and incomes
252 165 35
4: Sustainable food
systems
370 204 45
17 4: Support SDG
implementation
5: Capacity strengthening 115 66 43
6: Policy coherence 6 4 28
5: Partner for
SDG results
7: Diversified resourcing 0.2 0.1 59
8: Enhance global
partnership
1 244 1 089 12
Total 9 796 6 479 34
69. Countries affected by protracted conflict continue to require urgent and targeted
unconditional food assistance and nutrition programmes, adapted to the magnitude of the
conflict and to fluctuations in needs. While these activities represent 80 percent of
the overall programme of work for Strategic Objectives 1 on ending hunger and 2 on
improving nutrition, the implementation plan indicates a shortfall of almost USD 3 billion
(table III.4), severely hampering WFP’s ability to deliver towards SDG 2.
70. For ending malnutrition, an essential component of Strategic Objective 2, the 44 percent
difference between operational requirements and the implementation plan reflect hard
choices that include, for example, curtailing critical activities for the treatment and
prevention of malnutrition, which will affect millions of children in Somalia, South Sudan
and Yemen.
WFP/EB.2/2018/6-A/1 24
71. Compared with 2018, WFP’s forecasted activities for SDG 17 remain relatively stable in 2019,
except for a significant decrease in the forecasted difference between needs and resources
for activities related to policy coherence. The increase in forecasted resources will enable
WFP to, for example, support the Government of Nigeria in ensuring that policies, plans and
programmes are consistent with the zero hunger agenda. At the same time, compared with
2018, there is greater variation in the forecasted funding available for activities that support
governments in diversifying their resources for development. In China, for example, this will
affect WFP’s efforts to bring together all relevant partners in the private sector, civil society and the Government in order to provide technical and financial support for food-insecure
populations. Both the Nigeria and China portfolios are instrumental in establishing
longer-term food security and stable food systems in their respective countries.
TABLE III.5: OPERATIONAL REQUIREMENTS VERSUS THE IMPLEMENTATION PLAN BY
ACTIVITY CATEGORY, 2019
Activity category Operational
requirements (USD million)
Implementation
plan (USD million)
Difference
(%)
Unconditional resource transfers to support access
to food
5 528 3 577 35
Common services and platforms 1 239 1 084 13
Asset creation and livelihood support 966 578 40
Nutrition treatment 554 342 38
School meals 536 367 31
Malnutrition prevention 494 254 49
Institutional capacity strengthening 242 149 39
Smallholder agricultural market support 117 62 47
Climate adaptation and risk management 67 41 38
Individual capacity strengthening 29 16 43
Emergency preparedness 17 5 69
Analysis and assessment 7 3 50
Other* 1 1 15
Total 9 796 6 479 34
* Other activities are those that have not yet been fully aligned with the CRF in country offices that are continuing to implement pre-IRM projects in 2018.
Impact that funding limitations have on WFP’s efforts to meet needs 72. The implementation plan indicates a forecasted shortfall of nearly USD 3 billion between
operational requirements and the projected available funding, which would severely
hamper WFP’s ability to deliver towards SDG 2. Unconditional resource transfers in the
Syrian response, for example, will reach only 70 percent of the planned beneficiaries, leaving
more than 1 million people in need of food without assistance. The Kenya operation faces a
similar shortfall of 70 percent, but the country office intends to maintain the number of
refugee beneficiaries receiving general distributions and nutrition interventions, while
reducing the rations. This will pose a threat to the health and nutrition status of refugees.
WFP/EB.2/2018/6-A/1 25
73. If unconditional food transfers are not coupled with a set of layered resilience building
interventions as part of a single integrated programme, year on year calls for humanitarian
support will continue, with costs likely to increase steadily. Relevant resilience building
interventions include food assistance for assets activities for asset creation and
livelihood support, and activities for malnutrition prevention, school meals, smallholder
agricultural market support and climate adaptation and risk management, which face
shortfalls that range from 38 percent or USD 388 million for asset creation and livelihood
support to 49 percent or USD 240 million for malnutrition prevention. The variety in the
funding gaps for different activities demonstrates a disconnect between the intention to
deliver increasingly integrated programmes and the resources required to do so.
74. If nutrition treatment activities, which face a forecasted shortfall of USD 212 million, are not
complemented by sufficient malnutrition prevention activities, which face an even higher
shortfall of 49 percent, the need for nutrition treatment will continue.
Targeted supplementary feeding programmes rely on costly, specialized nutritional
products, ultimately placing a greater burden on WFP’s donors in the long term. Even more important is the detrimental impact on children’s future: a lack of adequate nutrition during the first 1,000 days following conception severely impairs a child’s future potential, and that of the next generation of children in large protracted crises. In the Democratic Republic of
the Congo, for example, current funding projections are forcing WFP to reduce the number
of children and breastfeeding mothers receiving nutrition treatment and to suspend
activities in several areas where needs are high.
75. The largest percentage forecasted funding gap, of 69 percent or USD 12 million, is for
emergency preparedness activities. This will impinge on WFP’s ability to support governments in becoming better prepared for emergency response. In Bangladesh,
for example, WFP plans to support the Ministry of Disaster Management and Relief in
enhancing its emergency supply chain and establishing a staging area for the reception and
dispatch of humanitarian assistance in large-scale emergencies. In Pakistan, WFP intends to
support all levels of government and communities in adopting and integrating climate risk
management systems. This will include raising awareness of the links between climate
change and food and nutrition security among civil servants and the staff of
academic institutions.
Planned activities based on forecasted resources
76. Of the total 2019 implementation plan, more than half (55 percent) of WFP’s total programme of work is focused on the provision of unconditional transfers that contribute
to the achievement of SDG 2 in 52 countries. Of the remaining USD 2.9 billion in the
implementation plan:
a) almost one third (31 percent) is directed to three countries — Turkey, Yemen and
South Sudan — where WFP is providing common services and platforms to national
governments and partners as part of its contribution to the attainment of SDG 17
(Strategic Result 8);
b) the remaining USD 1.9 billion is distributed among the remaining 11 activity
categories, with asset creation and livelihoods, nutrition programming
(malnutrition prevention and nutrition treatment) and school meals activities
contributing to the attainment of SDG 2 in 64 countries expected to account for a total
of USD 1.5 billion or 77 percent of the balance, more than one third of which is
expected to be allocated to activities in South Sudan, Yemen, the Syrian Arab Republic
and Lebanon; and
c) the remaining implementation plan balance of approximately 1 percent is allocated
to seven activity categories for outputs that contribute to Strategic Results 5, 6 and 7.
WFP/EB.2/2018/6-A/1 26
77. The increases in WFP’s programming for Strategic Result 4 on strengthening food systems
are due to an increase in its prioritized activities for smallholder agricultural market support
in, for example, Malawi, Kenya, Nicaragua and Ghana and for climate adaptation and risk
management activities in, for example, Nepal, Chad, Bangladesh and Egypt. So far
73 percent of approved CSPs include climate-related interventions.
78. Despite the difference between projected funding and needs-based requirements for
contributing to countries’ emergency preparedness, WFP is deploying the resources
available in innovative ways. For example, from a small base in Barbados, WFP is providing
quality technical assistance and capacity strengthening to the Caribbean Disaster
Emergency Management Agency, a regional inter-governmental agency for
disaster management in the Caribbean Community and its participating states.
79. WFP’s commitment to leveraging its expertise in order to support the wider humanitarian and development community is evident through its increased investment in
Strategic Result 8 on enhancing global partnerships as a major contribution to the
attainment of SDG 17. This work includes providing strengthened support to partners
through common services and platforms, as in Afghanistan, Somalia, South Sudan, Turkey
and Yemen, where single delivery platforms support the wider community in reaching
people effectively with a single package of support, as well as providing emergency
coordination and services, including air operations.
Analysis by activity and focus area
TABLE III.6: IMPLEMENTATION PLAN BY FOCUS AREA AND ACTIVITY CATEGORY, 2019 (USD million)
Activity category Focus area Total
Crisis
response
Resilience
building
Root
causes
Unconditional resource transfers to support access
to food
3 495 66 15 3 577
Common services and platforms 342 741 1 1 084
Asset creation and livelihood support 17 557 4 578
School meals 89 94 184 367
Nutrition treatment 228 101 13 342
Malnutrition prevention 68 108 78 254
Institutional capacity strengthening 2 96 52 149
Smallholder agricultural market support 44 17 62
Climate adaptation and risk management 40 1 41
Individual capacity strengthening <1 14 2 16
Emergency preparedness 1 4 1 5
Analysis and assessment 2 1 3
Other 1 1
Total 4 242 1 867 370 6 479
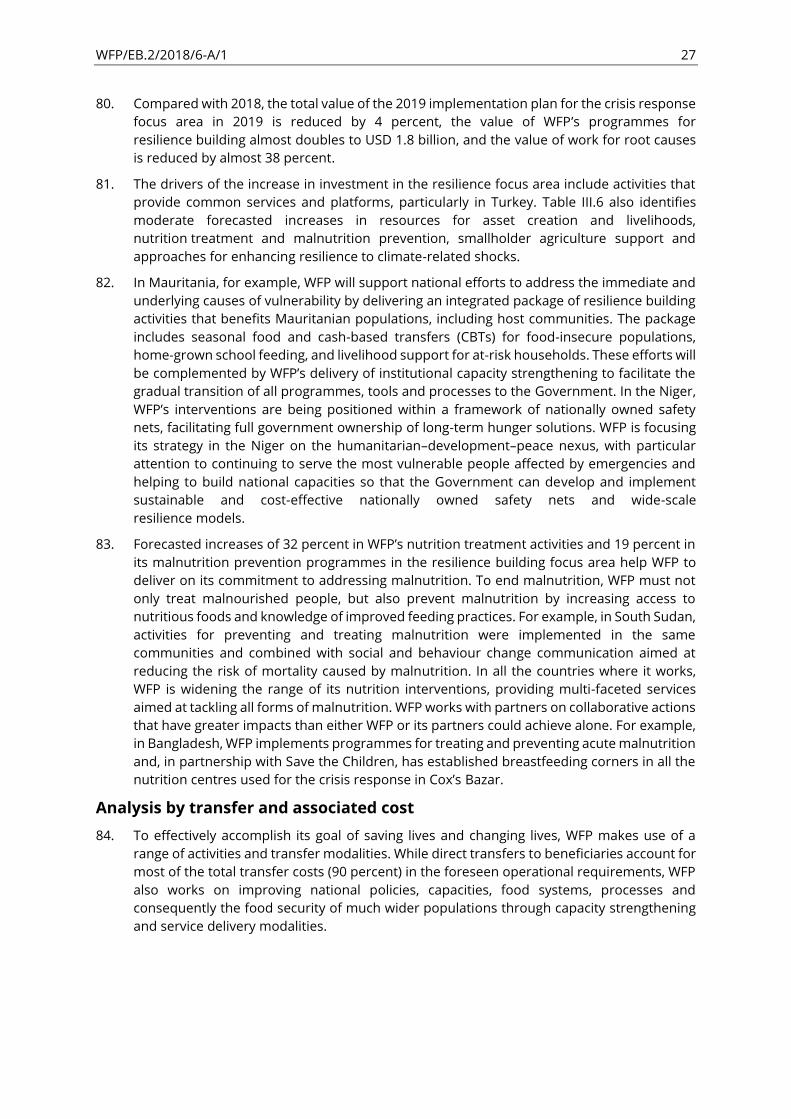
WFP/EB.2/2018/6-A/1 27
80. Compared with 2018, the total value of the 2019 implementation plan for the crisis response
focus area in 2019 is reduced by 4 percent, the value of WFP’s programmes for resilience building almost doubles to USD 1.8 billion, and the value of work for root causes
is reduced by almost 38 percent.
81. The drivers of the increase in investment in the resilience focus area include activities that
provide common services and platforms, particularly in Turkey. Table III.6 also identifies
moderate forecasted increases in resources for asset creation and livelihoods,
nutrition treatment and malnutrition prevention, smallholder agriculture support and
approaches for enhancing resilience to climate-related shocks.
82. In Mauritania, for example, WFP will support national efforts to address the immediate and
underlying causes of vulnerability by delivering an integrated package of resilience building
activities that benefits Mauritanian populations, including host communities. The package
includes seasonal food and cash-based transfers (CBTs) for food-insecure populations,
home-grown school feeding, and livelihood support for at-risk households. These efforts will
be complemented by WFP’s delivery of institutional capacity strengthening to facilitate the
gradual transition of all programmes, tools and processes to the Government. In the Niger,
WFP’s interventions are being positioned within a framework of nationally owned safety nets, facilitating full government ownership of long-term hunger solutions. WFP is focusing
its strategy in the Niger on the humanitarian development peace nexus, with particular
attention to continuing to serve the most vulnerable people affected by emergencies and
helping to build national capacities so that the Government can develop and implement
sustainable and cost-effective nationally owned safety nets and wide-scale
resilience models.
83. Forecasted increases of 32 percent in WFP’s nutrition treatment activities and 19 percent in its malnutrition prevention programmes in the resilience building focus area help WFP to
deliver on its commitment to addressing malnutrition. To end malnutrition, WFP must not
only treat malnourished people, but also prevent malnutrition by increasing access to
nutritious foods and knowledge of improved feeding practices. For example, in South Sudan,
activities for preventing and treating malnutrition were implemented in the same
communities and combined with social and behaviour change communication aimed at
reducing the risk of mortality caused by malnutrition. In all the countries where it works,
WFP is widening the range of its nutrition interventions, providing multi-faceted services
aimed at tackling all forms of malnutrition. WFP works with partners on collaborative actions
that have greater impacts than either WFP or its partners could achieve alone. For example,
in Bangladesh, WFP implements programmes for treating and preventing acute malnutrition
and, in partnership with Save the Children, has established breastfeeding corners in all the
nutrition centres used for the crisis response in Cox’s Bazar.
Analysis by transfer and associated cost
84. To effectively accomplish its goal of saving lives and changing lives, WFP makes use of a
range of activities and transfer modalities. While direct transfers to beneficiaries account for
most of the total transfer costs (90 percent) in the foreseen operational requirements, WFP
also works on improving national policies, capacities, food systems, processes and
consequently the food security of much wider populations through capacity strengthening
and service delivery modalities.
WFP/EB.2/2018/6-A/1 28
TABLE III.7: OPERATIONAL REQUIREMENTS VERSUS THE IMPLEMENTATION PLAN BY
TRANSFER MODALITY, 2018 AND 2019
Transfer
modality
2018
operational
requirements
(USD million)
2018 implementation
plan
2019
operational
requirements
(USD million)
2019 implementation
plan
USD million % of total
transfer
costs
(USD
million)
(% of
total
transfer
costs)
In-kind food 4 176 2 510 53 4 143 2 582 48
CBTs 2 400 1 755 37 3 083 2 172 40
Unrestricted CBTs
(cash)
1 737 1 294 27 2 004 1 435 27
Restricted CBTs
(value vouchers)
663 462 10 1 079 738 14
Commodity
vouchers
219 100 2 141 84 2
Capacity
strengthening
279 187 4 426 245 5
Service delivery 283 197 4 456 308 6
Total transfer
costs
7 358 4 750 100 8 249 5 392 100
In-kind food
85. Of the total transfer costs for the 2019 implementation plan, USD 2.5 billion (48 percent) is
allocated to in-kind food transfers, which will provide 2.88 million mt of food for
beneficiaries, a 2 percent reduction compared with 2018.
86. WFP continues to increase the sophistication of its procurement and logistics activities with
a view to supplying in-kind food where doing so is the best option, such as when markets
are disrupted by conflict, inflation or poor harvests. Donated food constitutes a third of
in-kind transfers, with the remainder procured by WFP in local, regional and
international markets.
87. Nutritious foods form a large part of the food basket and range from fortified wheat flour
to products such as Supercereal plus and ready-to-use supplementary foods, which are
used to prevent and treat malnutrition in young children and pregnant and lactating women
and girls. WFP will continue to focus on ensuring that all the staple flours, oils and salt
provided in in-kind food baskets are appropriately fortified, and will work on reducing
barriers in order to increase the amount of rice that is appropriately fortified to provide the
vitamins and minerals needed for the prevention of serious micronutrient deficiencies.
WFP is implementing capacity strengthening programmes aimed at enabling local suppliers
to start fortifying their own products, thereby reducing the need for imports from
developed countries.
88. In 2018, WFP expects to purchase 3.3 million mt of food — 300,000 mt or 9 percent more
than in 2017. So far in 2018, the average tonnage purchased per month has been
approximately 300,000 mt, compared with close to 250,000 mt in 2017. In 2019,
the projected food procurement trend is similar to that of 2018. So far in 2018, food has
been procured from more than 80 countries, with 75 percent of the total by value being
WFP/EB.2/2018/6-A/1 29
sourced from developing countries in accordance with WFP’s strategy for supporting the development of local and regional markets.
89. WFP’s Food Procurement Service continues to make significant progress in increasing the
agility, cost efficiency and reliability of WFP’s food procurement. Innovative procurement modalities and sourcing strategies for major commodity groups have been essential tools
in meeting increased demand.
90. WFP has benefited from decreases in the prices of maize and sorghum, which were driven
by the ready availability of these crops in East and Southern Africa. As a result, WFP has been
able to purchase in regional markets and at favourable prices. With high availability of
sorghum and a strong sorghum harvest in the Sudan, sorghum prices reached a record low.
Last year, the Sudan became a leading exporter of sorghum, enabling WFP to purchase more
than 400,000 mt for its operations in East Africa.
91. WFP’s Supply Chain Division reported productivity gains of USD 140 million in 2017; while achievements in 2018 have not yet been verified, a similar level of efficiencies is
estimated for this year. In 2019, WFP will aim to achieve further productivity gains and
efficiencies through integrated end-to-end supply chain planning and optimized use of
advance financing mechanisms such as the Global Commodity Management Facility;
compliance of WFP’s food procurement activities with best practices in the
food procurement industry; and use of market intelligence and innovations.
Cash-based transfers
92. WFP continues to be the largest humanitarian agency in terms of cash programming.
CBTs are the second largest modality used by WFP. Over the past ten years, the use of CBTs
has consistently increased, and WFP’s CBT portfolio in the 2019 implementation plan is estimated to grow to USD 2.17 billion in 68 countries, with CBTs expected to account for
40 percent of total transfers. Among regions, the Regional Bureau in Cairo has the
largest proportion of CBTs in the 2019 implementation plan. Of total implementation costs,
the largest share is in Turkey, followed by Lebanon, Yemen, Jordan, Ethiopia and
the Syrian Arab Republic.
93. CBTs support a variety of programmes and are employed as one of WFP’s transfer modalities in all the activities under six Strategic Results. CBTs vary in value and are
distributed for periods of varying duration according to needs, reflecting WFP’s ability to mix programming modalities in order to achieve cost effectiveness and programme outcomes.
Greater use of real-time analytics derived from market monitoring and assessments is
allowing WFP to provide beneficiaries with CBTs during post-harvest periods while returning
to in-kind food transfers during lean seasons, such as in the Niger and the Sudan.
94. In 2019, the use of unrestricted cash transfers will continue to increase,
reaching USD 1,44 billion according to the implementation plan and accounting for almost
27 percent of total WFP transfers and twice as much as value vouchers, which will
total USD 738 million in 2019.
95. Value vouchers account for 14 percent of transfer costs in the implementation plan.
With this form of assistance, beneficiaries can choose what to buy at designated and
contracted shops. WFP must ensure that the commodities available at contracted shops are
of high quality and as cheap as possible by providing technical assistance to retailers and
wholesalers. Where possible, WFP negotiates with contracted retailers to increase the
purchasing power of beneficiaries, resulting in reduced costs for all customers and not just
those receiving direct assistance from WFP.
WFP/EB.2/2018/6-A/1 30
96. The increased use of unrestricted CBTs or cash creates opportunities for addressing food
security needs in a more holistic way. WFP has worked with partners in Chad,
the Democratic Republic of the Congo, Lebanon and Turkey in order to enhance the
effectiveness of unrestricted cash transfers by using them to meet several competing needs
at the same time; and in Jordan on ways of giving assisted populations the choice of
redeeming their entitlements at selected retailers or withdrawing them as cash at ATMs.
Working through national safety nets provides an opportunity for strengthening national
systems and avoids the need to construct parallel structures. WFP has used this model in
several countries in recent years, including the Dominican Republic, Ecuador, Fiji,
the Philippines and Sri Lanka, and intends to expand it as an effective way of responding to
emergencies through cash assistance.
97. WFP works through 70 financial service providers including banks, microfinance institutions,
mobile money operators and money transfer agents. In locations where financial service
providers cannot operate, WFP partners with governments, non-governmental
organizations and the Red Cross and Red Crescent through its corporate digital beneficiary
and transfer management platform, SCOPE. Cash transfers are known to have a
multiplier effect on the local economy. By enabling people to purchase essential goods
locally, they can help strengthen local markets, encourage smallholder farmers to be more
productive and build national capacities. Studies conducted in Lebanon, Rwanda and
Uganda have shown that every USD 1 given to a refugee translates into almost USD 2 in
the local economy, as businesses respond to the increase in demand.
Commodity vouchers
98. The total value of commodity vouchers, which have proved to be a critical form of assistance
in situations where markets are fragile, is projected to decrease from USD 100 million in
2018 to USD 84 million in 2019, accounting for less than 2 percent of total transfers costs.
Yemen is the largest operation relying on commodity vouchers, with a USD 53 million budget
for vouchers, followed by the Democratic Republic of the Congo with USD 12 million.
Capacity strengthening
99. Capacity strengthening costs amount to USD 245 million in the 2019 implementation plan,
accounting for 5 percent of total transfer costs. Capacity strengthening is expected to be
provided in 79 countries, with the top five countries the Syrian Arab Republic, Kenya,
Ethiopia, South Sudan and the Niger accounting for more than 30 percent of the
total value. Examples of WFP’s capacity strengthening work include the Kenya country office’s efforts to build the resilience of food-insecure communities by
unlocking the potential of national food systems. This will be achieved through the provision
of technical support for improving the efficiency of food markets and supply chains, among
other interventions.
Service delivery
100. Service delivery, which includes WFP’s support for humanitarian clusters and logistics and the provision of systems and platforms that enable partner agencies to
transfer entitlements to beneficiaries, accounts for 6 percent of total transfer costs.
Countries where WFP provides such platforms to other agencies include Bangladesh, Chad,
Jordan and Lebanon.
101. In its work towards Strategic Result 8 on common services and platforms, WFP leverages its
deep field presence and comparative advantage in logistics in order to provide services to
humanitarian and development actors that lack the resources, infrastructure or experience
to meet their own logistics needs. As well as the common services that it is mandated to
provide, WFP also provides partners with services on demand through the logistics cluster,
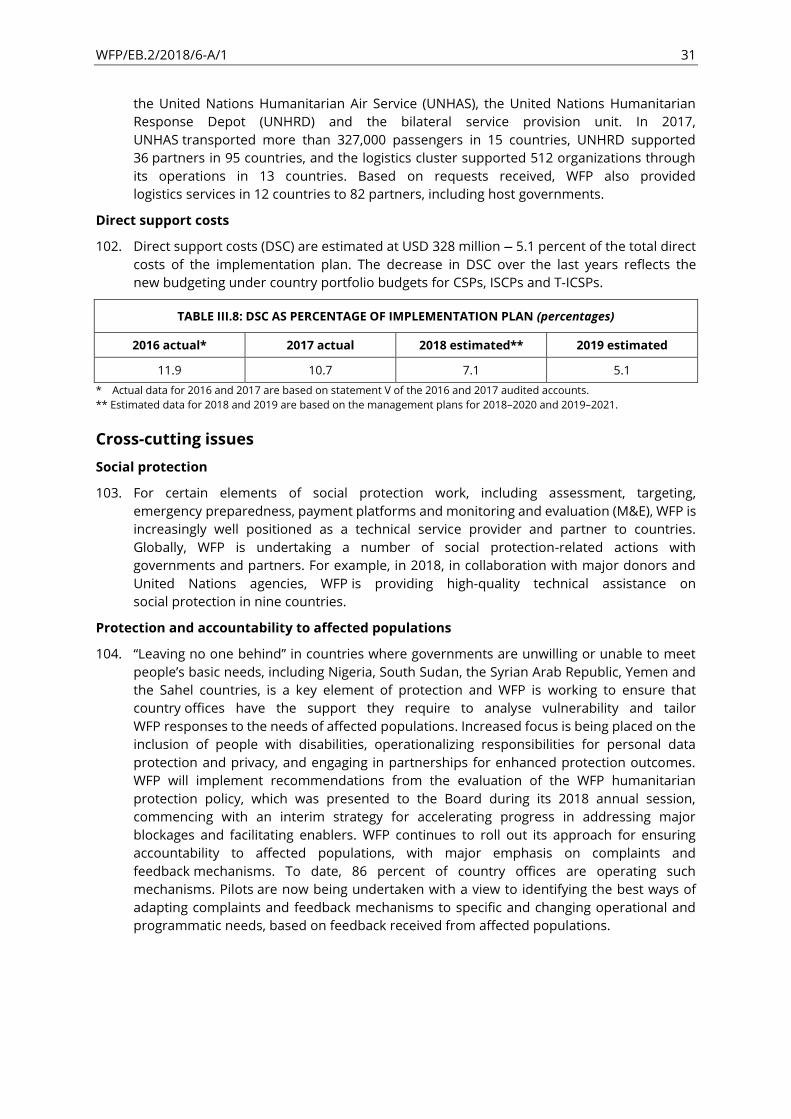
WFP/EB.2/2018/6-A/1 31
the United Nations Humanitarian Air Service (UNHAS), the United Nations Humanitarian
Response Depot (UNHRD) and the bilateral service provision unit. In 2017,
UNHAS transported more than 327,000 passengers in 15 countries, UNHRD supported
36 partners in 95 countries, and the logistics cluster supported 512 organizations through
its operations in 13 countries. Based on requests received, WFP also provided
logistics services in 12 countries to 82 partners, including host governments.
Direct support costs
102. Direct support costs (DSC) are estimated at USD 328 million — 5.1 percent of the total direct
costs of the implementation plan. The decrease in DSC over the last years reflects the
new budgeting under country portfolio budgets for CSPs, ISCPs and T-ICSPs.
TABLE III.8: DSC AS PERCENTAGE OF IMPLEMENTATION PLAN (percentages)
2016 actual* 2017 actual 2018 estimated** 2019 estimated
11.9 10.7 7.1 5.1
* Actual data for 2016 and 2017 are based on statement V of the 2016 and 2017 audited accounts. ** Estimated data for 2018 and 2019 are based on the management plans for 2018 2020 and 2019 2021.
Cross-cutting issues
Social protection
103. For certain elements of social protection work, including assessment, targeting,
emergency preparedness, payment platforms and monitoring and evaluation (M&E), WFP is
increasingly well positioned as a technical service provider and partner to countries.
Globally, WFP is undertaking a number of social protection-related actions with
governments and partners. For example, in 2018, in collaboration with major donors and
United Nations agencies, WFP is providing high-quality technical assistance on
social protection in nine countries.
Protection and accountability to affected populations
104. Leaving no one behind in countries where governments are unwilling or unable to meet
people’s basic needs, including Nigeria, South Sudan, the Syrian Arab Republic, Yemen and
the Sahel countries, is a key element of protection and WFP is working to ensure that
country offices have the support they require to analyse vulnerability and tailor
WFP responses to the needs of affected populations. Increased focus is being placed on the
inclusion of people with disabilities, operationalizing responsibilities for personal data
protection and privacy, and engaging in partnerships for enhanced protection outcomes.
WFP will implement recommendations from the evaluation of the WFP humanitarian
protection policy, which was presented to the Board during its 2018 annual session,
commencing with an interim strategy for accelerating progress in addressing major
blockages and facilitating enablers. WFP continues to roll out its approach for ensuring
accountability to affected populations, with major emphasis on complaints and
feedback mechanisms. To date, 86 percent of country offices are operating such
mechanisms. Pilots are now being undertaken with a view to identifying the best ways of
adapting complaints and feedback mechanisms to specific and changing operational and
programmatic needs, based on feedback received from affected populations.

WFP/EB.2/2018/6-A/1 32
Access
105. All of the 12 countries in which WFP has declared Level 2 or 3 emergencies face access
challenges; in ten of these countries, the challenges are directly related to armed conflict.
To address this, WFP is committed to making more robust investments in its
corporate approach to securing access to populations in need. It will seek to optimize the
delivery of assistance by using practical tools for increasing competencies, systematizing
decision making and establishing clearer processes and responsibilities for addressing
access constraints and challenges. For example, country offices will receive support in
developing access strategies and plans that better enable WFP to secure principled
humanitarian access. Recently, such support has been provided to the Central African
Republic and Libya country offices, and there are plans for supporting the Mali and other
country offices in the near future.
Environment
106. WFP recognizes that achieving food security and ending hunger require healthy natural
ecosystems and sustainable use of natural resources, consistent with the SDGs. WFP is
developing environmental standards, screening procedures and an
environmental management system with the aim of enhancing environmental co-benefits
and identifying, minimizing and managing the environmental impacts associated with its
activities. Environmental considerations are being mainstreamed into CSPs; into global
guidance manuals in areas that include emergencies, supply chain and administration; and
into tools for staff capacity enhancement, such as onboarding and role-specific learning.
Reporting against two CRF indicators will commence from 2018 and be reflected in the
annual performance report presented at the Board’s 2019 annual session. In line with inter-agency commitments, WFP is also expanding its reporting on the management of
energy and greenhouse gas emissions by including its management of the waste and water
associated with its operations. These indicators will form a basis for expanded reporting as
the environmental management system is established.
Gender
107. WFP is committed to advancing gender equality as a fundamental contribution to realizing
a world without hunger and as a goal in its own right. WFP will therefore seek to ensure that
its work is gender-transformative and its interventions contribute to the food and nutrition
security of all people, while prioritizing the individuals and communities that are most
vulnerable to hunger and malnutrition.
108. To this end, consideration of gender issues is being embedded in the IRM.
Other mechanisms for translating concepts into action include the Gender Transformation
Programme,14 the Gender and Age Marker,15 the second iteration of the United Nations
System-Wide Action Plan for Implementation of the Chief Executives Board for Coordination
(CEB) United Nations System-Wide Policy on Gender Equality and the Empowerment of
Women (UN SWAP)16 and the inclusion of gender equality activities in
WFP’s country strategic plans.
14 Available at https://gtp.wfp.org/
15 Available at http://gender.manuals.wfp.org/en/gender-toolkit/gender-in-programming/gender-and-age-marker/
16 Available at http://www.unwomen.org/en/how-we-work/un-system-coordination/promoting-un-accountability

WFP/EB.2/2018/6-A/1 33
109. In order to implement activities and deliver transformative results effectively, efficiently,
equitably and in ways that empower their participants, a gender-competent workforce
is essential. Investments will continue to be made in enhancing the knowledge and skills of
employees and partners, including through the Gender Learning Channel,
the WFP Gender Toolkit,17 tailored capacity strengthening opportunities and research.
Partnerships with entities that range from community-based organizations and
country-level gender reference groups, to international non-governmental organizations
such as Plan International, CARE and ActionAid and global actors such as Women Deliver
will be strengthened and expanded for joint programming, knowledge generation
and advocacy.
110. The WFP Gender Policy (2015—2020)18 establishes the target of allocating 15 percent of
project funds to gender equality activities by 2020. Based on provisional figures in the
2019 implementation plan, 12.5 percent of the resources needed are allocated to activities
that promote gender equality.
17 Available at http://gender.manuals.wfp.org/en/
18 Available at https://www.wfp.org/content/2015-wfp-gender-policy-2015-2020-
0?_ga=2.260722062.2085813799.1532439588-223929127.1525340837
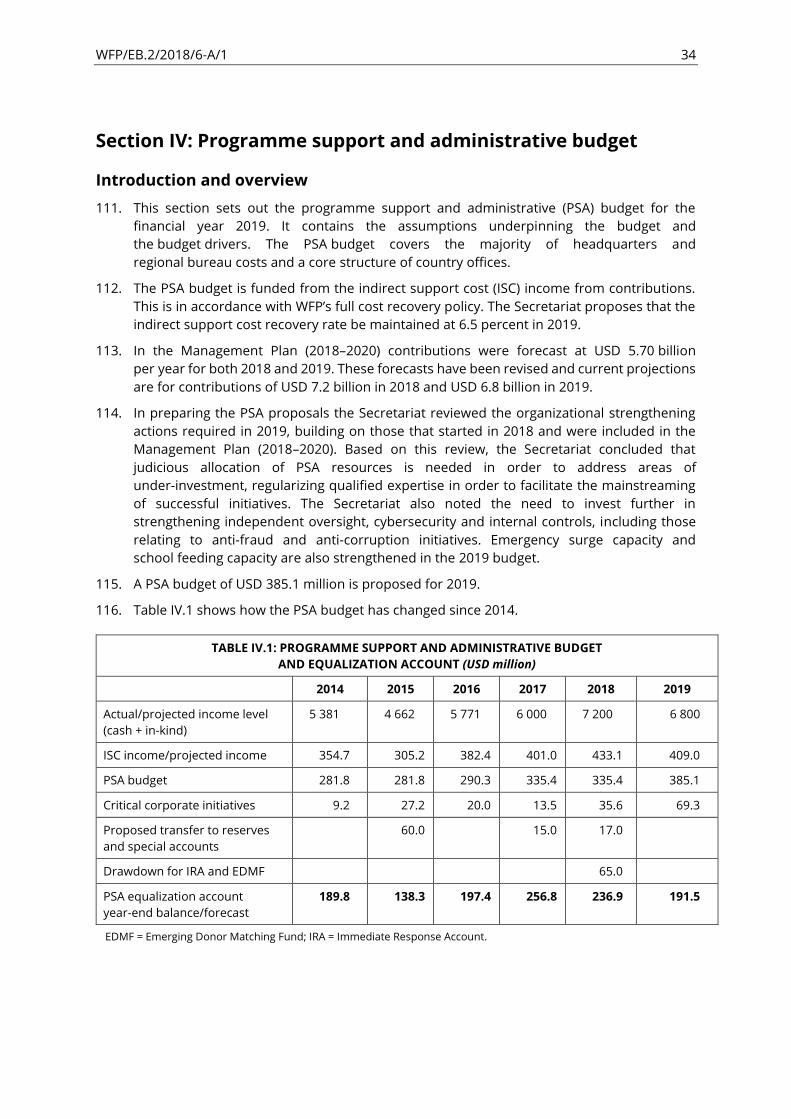
WFP/EB.2/2018/6-A/1 34
Section IV: Programme support and administrative budget
Introduction and overview
111. This section sets out the programme support and administrative (PSA) budget for the
financial year 2019. It contains the assumptions underpinning the budget and
the budget drivers. The PSA budget covers the majority of headquarters and
regional bureau costs and a core structure of country offices.
112. The PSA budget is funded from the indirect support cost (ISC) income from contributions.
This is in accordance with WFP’s full cost recovery policy. The Secretariat proposes that the indirect support cost recovery rate be maintained at 6.5 percent in 2019.
113. In the Management Plan (2018 2020) contributions were forecast at USD 5.70 billion
per year for both 2018 and 2019. These forecasts have been revised and current projections
are for contributions of USD 7.2 billion in 2018 and USD 6.8 billion in 2019.
114. In preparing the PSA proposals the Secretariat reviewed the organizational strengthening
actions required in 2019, building on those that started in 2018 and were included in the
Management Plan (2018 2020). Based on this review, the Secretariat concluded that
judicious allocation of PSA resources is needed in order to address areas of
under-investment, regularizing qualified expertise in order to facilitate the mainstreaming
of successful initiatives. The Secretariat also noted the need to invest further in
strengthening independent oversight, cybersecurity and internal controls, including those
relating to anti-fraud and anti-corruption initiatives. Emergency surge capacity and
school feeding capacity are also strengthened in the 2019 budget.
115. A PSA budget of USD 385.1 million is proposed for 2019.
116. Table IV.1 shows how the PSA budget has changed since 2014.
TABLE IV.1: PROGRAMME SUPPORT AND ADMINISTRATIVE BUDGET
AND EQUALIZATION ACCOUNT (USD million)
2014 2015 2016 2017 2018 2019
Actual/projected income level
(cash + in-kind)
5 381 4 662 5 771 6 000 7 200 6 800
ISC income/projected income 354.7 305.2 382.4 401.0 433.1 409.0
PSA budget 281.8 281.8 290.3 335.4 335.4 385.1
Critical corporate initiatives 9.2 27.2 20.0 13.5 35.6 69.3
Proposed transfer to reserves
and special accounts
60.0 15.0 17.0
Drawdown for IRA and EDMF 65.0
PSA equalization account
year-end balance/forecast
189.8 138.3 197.4 256.8 236.9 191.5
EDMF = Emerging Donor Matching Fund; IRA = Immediate Response Account.
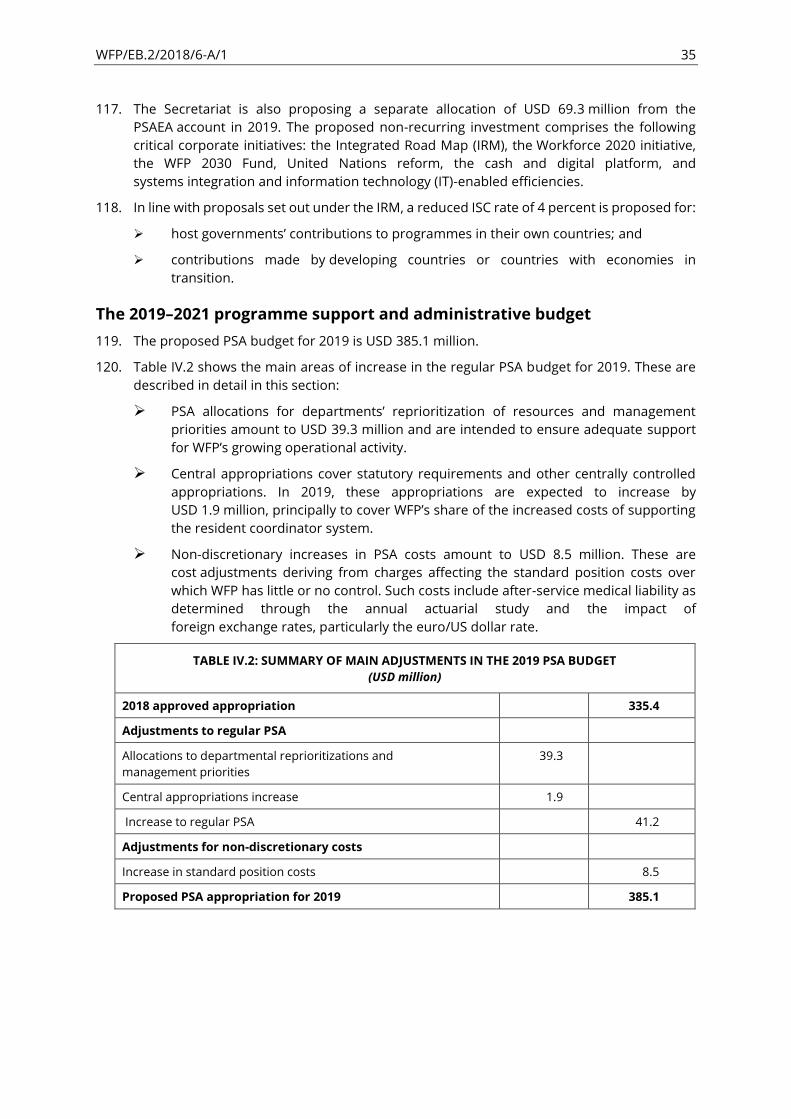
WFP/EB.2/2018/6-A/1 35
117. The Secretariat is also proposing a separate allocation of USD 69.3 million from the
PSAEA account in 2019. The proposed non-recurring investment comprises the following
critical corporate initiatives: the Integrated Road Map (IRM), the Workforce 2020 initiative,
the WFP 2030 Fund, United Nations reform, the cash and digital platform, and
systems integration and information technology (IT)-enabled efficiencies.
118. In line with proposals set out under the IRM, a reduced ISC rate of 4 percent is proposed for:
➢ host governments’ contributions to programmes in their own countries; and
➢ contributions made by developing countries or countries with economies in
transition.
The 2019 2021 programme support and administrative budget
119. The proposed PSA budget for 2019 is USD 385.1 million.
120. Table IV.2 shows the main areas of increase in the regular PSA budget for 2019. These are
described in detail in this section:
➢ PSA allocations for departments’ reprioritization of resources and management priorities amount to USD 39.3 million and are intended to ensure adequate support
for WFP’s growing operational activity.
➢ Central appropriations cover statutory requirements and other centrally controlled
appropriations. In 2019, these appropriations are expected to increase by
USD 1.9 million, principally to cover WFP’s share of the increased costs of supporting the resident coordinator system.
➢ Non-discretionary increases in PSA costs amount to USD 8.5 million. These are
cost adjustments deriving from charges affecting the standard position costs over
which WFP has little or no control. Such costs include after-service medical liability as
determined through the annual actuarial study and the impact of
foreign exchange rates, particularly the euro/US dollar rate.
TABLE IV.2: SUMMARY OF MAIN ADJUSTMENTS IN THE 2019 PSA BUDGET
(USD million)
2018 approved appropriation
335.4
Adjustments to regular PSA
Allocations to departmental reprioritizations and
management priorities
39.3
Central appropriations increase 1.9
Increase to regular PSA
41.2
Adjustments for non-discretionary costs
Increase in standard position costs 8.5
Proposed PSA appropriation for 2019 385.1
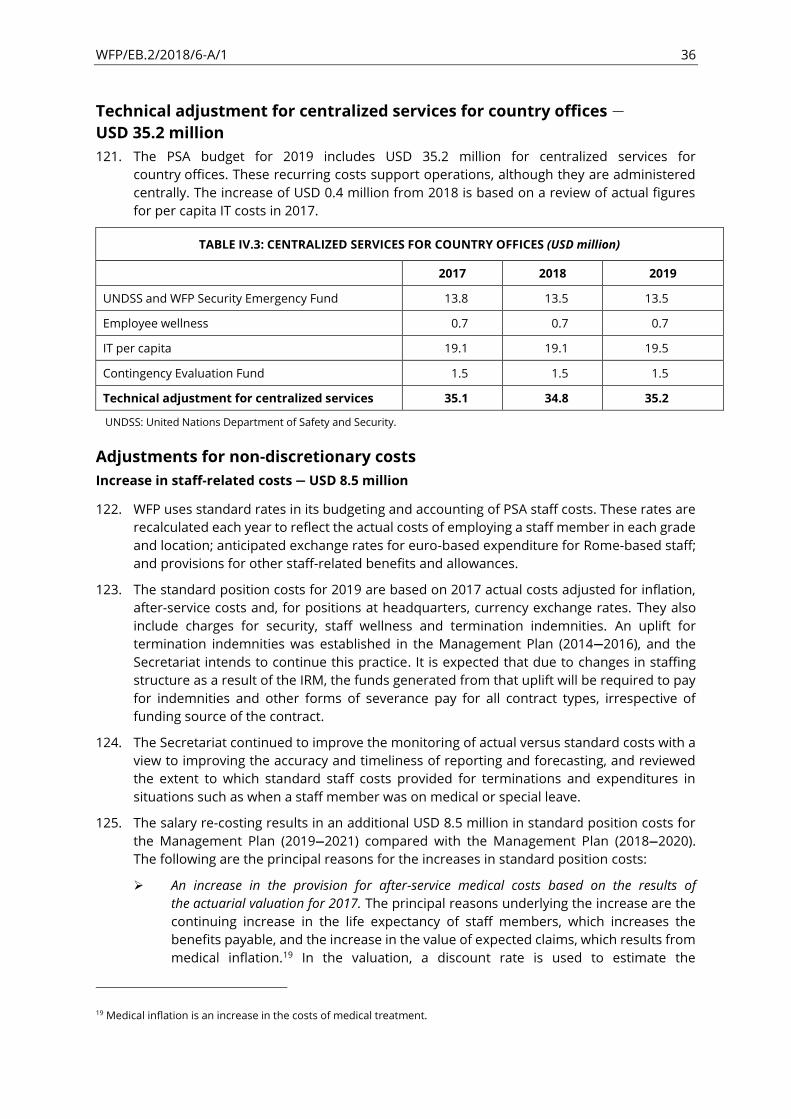
WFP/EB.2/2018/6-A/1 36
Technical adjustment for centralized services for country offices —
USD 35.2 million
121. The PSA budget for 2019 includes USD 35.2 million for centralized services for
country offices. These recurring costs support operations, although they are administered
centrally. The increase of USD 0.4 million from 2018 is based on a review of actual figures
for per capita IT costs in 2017.
TABLE IV.3: CENTRALIZED SERVICES FOR COUNTRY OFFICES (USD million)
2017 2018 2019
UNDSS and WFP Security Emergency Fund 13.8 13.5 13.5
Employee wellness 0.7 0.7 0.7
IT per capita 19.1 19.1 19.5
Contingency Evaluation Fund 1.5 1.5 1.5
Technical adjustment for centralized services 35.1 34.8 35.2
UNDSS: United Nations Department of Safety and Security.
Adjustments for non-discretionary costs
Increase in staff-related costs — USD 8.5 million
122. WFP uses standard rates in its budgeting and accounting of PSA staff costs. These rates are
recalculated each year to reflect the actual costs of employing a staff member in each grade
and location; anticipated exchange rates for euro-based expenditure for Rome-based staff;
and provisions for other staff-related benefits and allowances.
123. The standard position costs for 2019 are based on 2017 actual costs adjusted for inflation,
after-service costs and, for positions at headquarters, currency exchange rates. They also
include charges for security, staff wellness and termination indemnities. An uplift for
termination indemnities was established in the Management Plan (2014—2016), and the
Secretariat intends to continue this practice. It is expected that due to changes in staffing
structure as a result of the IRM, the funds generated from that uplift will be required to pay
for indemnities and other forms of severance pay for all contract types, irrespective of
funding source of the contract.
124. The Secretariat continued to improve the monitoring of actual versus standard costs with a
view to improving the accuracy and timeliness of reporting and forecasting, and reviewed
the extent to which standard staff costs provided for terminations and expenditures in
situations such as when a staff member was on medical or special leave.
125. The salary re-costing results in an additional USD 8.5 million in standard position costs for
the Management Plan (2019—2021) compared with the Management Plan (2018—2020).
The following are the principal reasons for the increases in standard position costs:
➢ An increase in the provision for after-service medical costs based on the results of
the actuarial valuation for 2017. The principal reasons underlying the increase are the
continuing increase in the life expectancy of staff members, which increases the
benefits payable, and the increase in the value of expected claims, which results from
medical inflation.19 In the valuation, a discount rate is used to estimate the
19 Medical inflation is an increase in the costs of medical treatment.
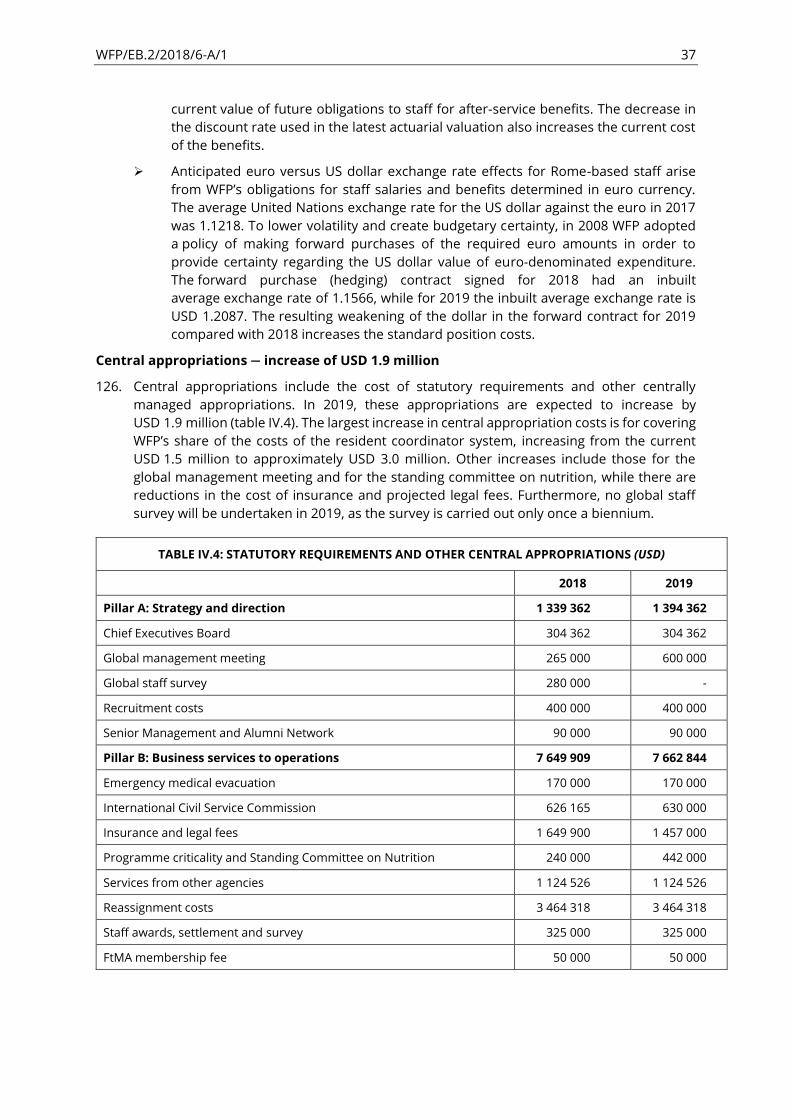
WFP/EB.2/2018/6-A/1 37
current value of future obligations to staff for after-service benefits. The decrease in
the discount rate used in the latest actuarial valuation also increases the current cost
of the benefits.
➢ Anticipated euro versus US dollar exchange rate effects for Rome-based staff arise
from WFP’s obligations for staff salaries and benefits determined in euro currency. The average United Nations exchange rate for the US dollar against the euro in 2017
was 1.1218. To lower volatility and create budgetary certainty, in 2008 WFP adopted
a policy of making forward purchases of the required euro amounts in order to
provide certainty regarding the US dollar value of euro-denominated expenditure.
The forward purchase (hedging) contract signed for 2018 had an inbuilt
average exchange rate of 1.1566, while for 2019 the inbuilt average exchange rate is
USD 1.2087. The resulting weakening of the dollar in the forward contract for 2019
compared with 2018 increases the standard position costs.
Central appropriations — increase of USD 1.9 million
126. Central appropriations include the cost of statutory requirements and other centrally
managed appropriations. In 2019, these appropriations are expected to increase by
USD 1.9 million (table IV.4). The largest increase in central appropriation costs is for covering
WFP’s share of the costs of the resident coordinator system, increasing from the current
USD 1.5 million to approximately USD 3.0 million. Other increases include those for the
global management meeting and for the standing committee on nutrition, while there are
reductions in the cost of insurance and projected legal fees. Furthermore, no global staff
survey will be undertaken in 2019, as the survey is carried out only once a biennium.
TABLE IV.4: STATUTORY REQUIREMENTS AND OTHER CENTRAL APPROPRIATIONS (USD)
2018 2019
Pillar A: Strategy and direction 1 339 362 1 394 362
Chief Executives Board 304 362 304 362
Global management meeting 265 000 600 000
Global staff survey 280 000 -
Recruitment costs 400 000 400 000
Senior Management and Alumni Network 90 000 90 000
Pillar B: Business services to operations 7 649 909 7 662 844
Emergency medical evacuation 170 000 170 000
International Civil Service Commission 626 165 630 000
Insurance and legal fees 1 649 900 1 457 000
Programme criticality and Standing Committee on Nutrition 240 000 442 000
Services from other agencies 1 124 526 1 124 526
Reassignment costs 3 464 318 3 464 318
Staff awards, settlement and survey 325 000 325 000
FtMA membership fee 50 000 50 000
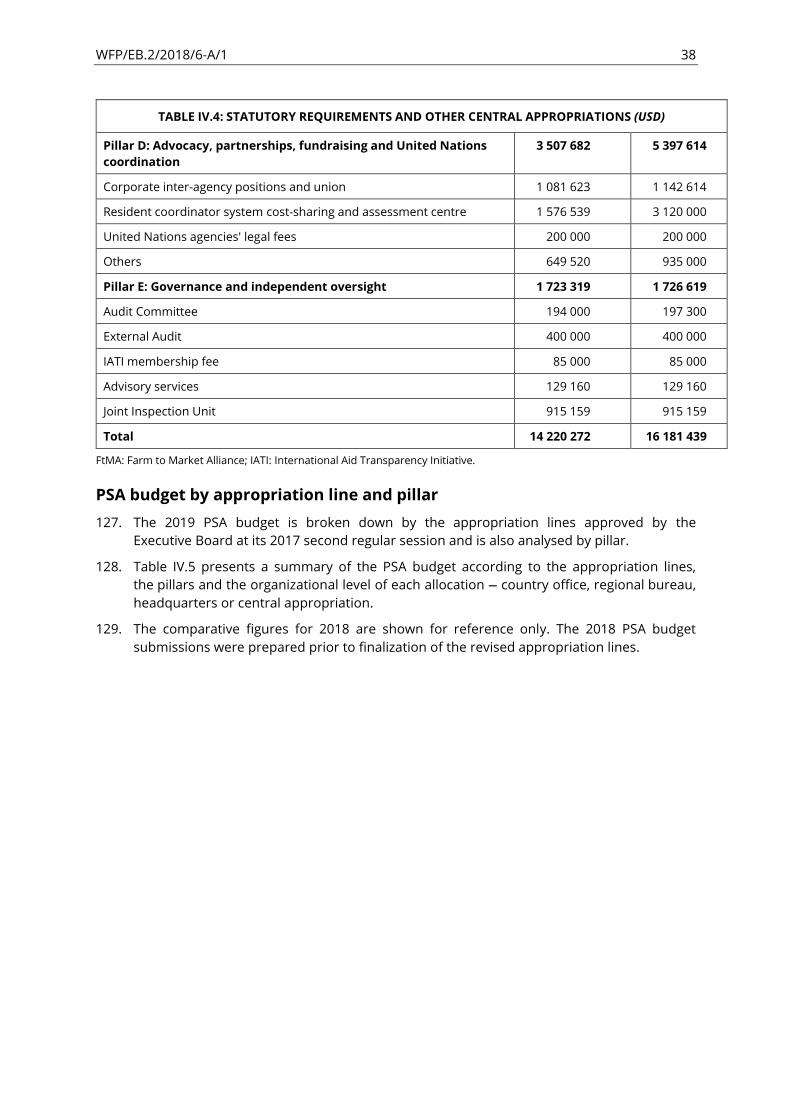
WFP/EB.2/2018/6-A/1 38
TABLE IV.4: STATUTORY REQUIREMENTS AND OTHER CENTRAL APPROPRIATIONS (USD)
Pillar D: Advocacy, partnerships, fundraising and United Nations
coordination
3 507 682 5 397 614
Corporate inter-agency positions and union 1 081 623 1 142 614
Resident coordinator system cost-sharing and assessment centre 1 576 539 3 120 000
United Nations agencies' legal fees 200 000 200 000
Others 649 520 935 000
Pillar E: Governance and independent oversight 1 723 319 1 726 619
Audit Committee 194 000 197 300
External Audit 400 000 400 000
IATI membership fee 85 000 85 000
Advisory services 129 160 129 160
Joint Inspection Unit 915 159 915 159
Total 14 220 272 16 181 439
FtMA: Farm to Market Alliance; IATI: International Aid Transparency Initiative.
PSA budget by appropriation line and pillar
127. The 2019 PSA budget is broken down by the appropriation lines approved by the
Executive Board at its 2017 second regular session and is also analysed by pillar.
128. Table IV.5 presents a summary of the PSA budget according to the appropriation lines,
the pillars and the organizational level of each allocation — country office, regional bureau,
headquarters or central appropriation.
129. The comparative figures for 2018 are shown for reference only. The 2018 PSA budget
submissions were prepared prior to finalization of the revised appropriation lines.
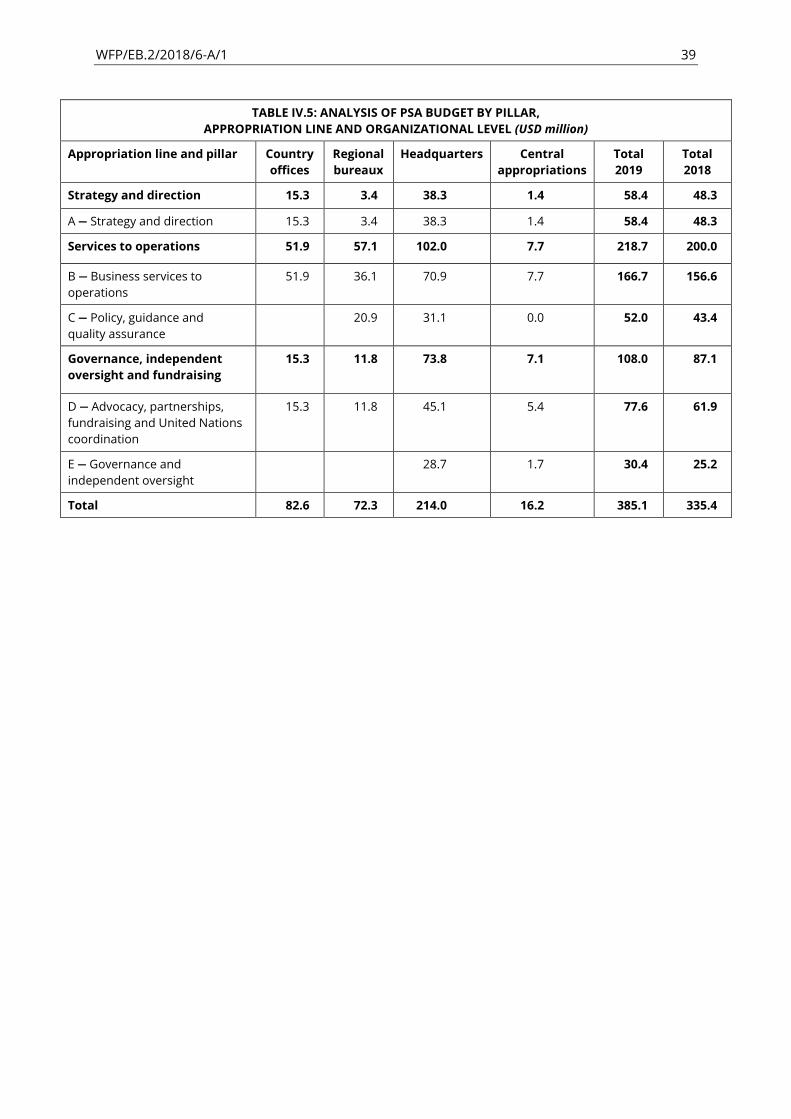
WFP/EB.2/2018/6-A/1 39
TABLE IV.5: ANALYSIS OF PSA BUDGET BY PILLAR,
APPROPRIATION LINE AND ORGANIZATIONAL LEVEL (USD million)
Appropriation line and pillar Country
offices
Regional
bureaux
Headquarters Central
appropriations
Total
2019
Total
2018
Strategy and direction 15.3 3.4 38.3 1.4 58.4 48.3
A — Strategy and direction 15.3 3.4 38.3 1.4 58.4 48.3
Services to operations 51.9 57.1 102.0 7.7 218.7 200.0
B — Business services to
operations
51.9 36.1 70.9 7.7 166.7 156.6
C — Policy, guidance and
quality assurance
20.9 31.1 0.0 52.0 43.4
Governance, independent
oversight and fundraising
15.3 11.8 73.8 7.1 108.0 87.1
D — Advocacy, partnerships,
fundraising and United Nations
coordination
15.3 11.8 45.1 5.4 77.6 61.9
E — Governance and
independent oversight
28.7 1.7 30.4 25.2
Total 82.6 72.3 214.0 16.2 385.1 335.4
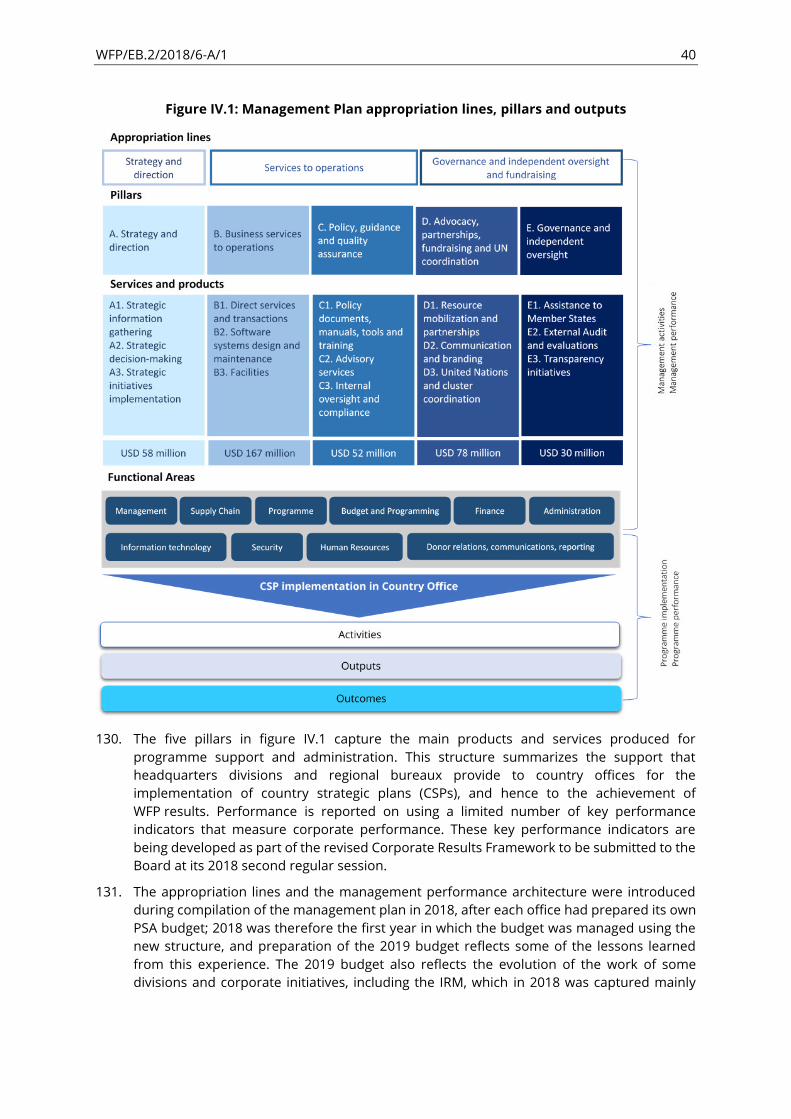
WFP/EB.2/2018/6-A/1 40
Figure IV.1: Management Plan appropriation lines, pillars and outputs
130. The five pillars in figure IV.1 capture the main products and services produced for
programme support and administration. This structure summarizes the support that
headquarters divisions and regional bureaux provide to country offices for the
implementation of country strategic plans (CSPs), and hence to the achievement of
WFP results. Performance is reported on using a limited number of key performance
indicators that measure corporate performance. These key performance indicators are
being developed as part of the revised Corporate Results Framework to be submitted to the
Board at its 2018 second regular session.
131. The appropriation lines and the management performance architecture were introduced
during compilation of the management plan in 2018, after each office had prepared its own
PSA budget; 2018 was therefore the first year in which the budget was managed using the
new structure, and preparation of the 2019 budget reflects some of the lessons learned
from this experience. The 2019 budget also reflects the evolution of the work of some
divisions and corporate initiatives, including the IRM, which in 2018 was captured mainly
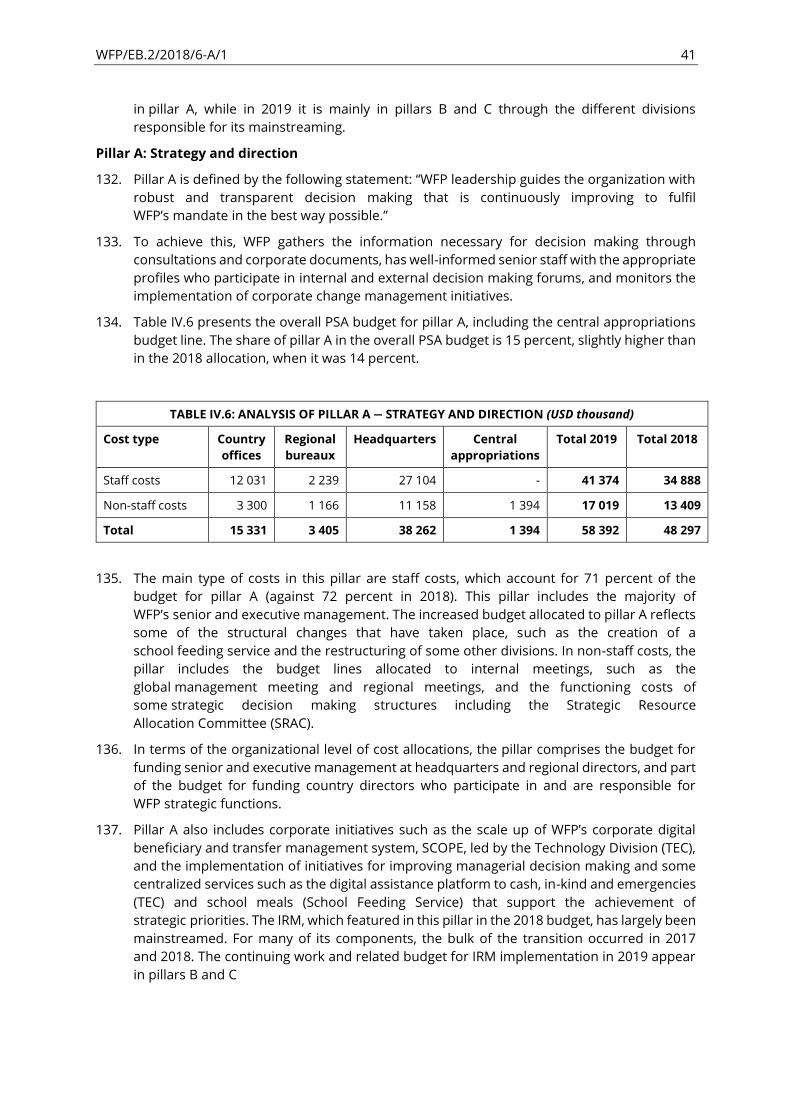
WFP/EB.2/2018/6-A/1 41
in pillar A, while in 2019 it is mainly in pillars B and C through the different divisions
responsible for its mainstreaming.
Pillar A: Strategy and direction
132. Pillar A is defined by the following statement: WFP leadership guides the organization with robust and transparent decision making that is continuously improving to fulfil
WFP’s mandate in the best way possible.
133. To achieve this, WFP gathers the information necessary for decision making through
consultations and corporate documents, has well-informed senior staff with the appropriate
profiles who participate in internal and external decision making forums, and monitors the
implementation of corporate change management initiatives.
134. Table IV.6 presents the overall PSA budget for pillar A, including the central appropriations
budget line. The share of pillar A in the overall PSA budget is 15 percent, slightly higher than
in the 2018 allocation, when it was 14 percent.
TABLE IV.6: ANALYSIS OF PILLAR A — STRATEGY AND DIRECTION (USD thousand)
Cost type Country
offices
Regional
bureaux
Headquarters Central
appropriations
Total 2019 Total 2018
Staff costs 12 031 2 239 27 104 - 41 374 34 888
Non-staff costs 3 300 1 166 11 158 1 394 17 019 13 409
Total 15 331 3 405 38 262 1 394 58 392 48 297
135. The main type of costs in this pillar are staff costs, which account for 71 percent of the
budget for pillar A (against 72 percent in 2018). This pillar includes the majority of
WFP’s senior and executive management. The increased budget allocated to pillar A reflects
some of the structural changes that have taken place, such as the creation of a
school feeding service and the restructuring of some other divisions. In non-staff costs, the
pillar includes the budget lines allocated to internal meetings, such as the
global management meeting and regional meetings, and the functioning costs of
some strategic decision making structures including the Strategic Resource
Allocation Committee (SRAC).
136. In terms of the organizational level of cost allocations, the pillar comprises the budget for
funding senior and executive management at headquarters and regional directors, and part
of the budget for funding country directors who participate in and are responsible for
WFP strategic functions.
137. Pillar A also includes corporate initiatives such as the scale up of WFP’s corporate digital beneficiary and transfer management system, SCOPE, led by the Technology Division (TEC),
and the implementation of initiatives for improving managerial decision making and some
centralized services such as the digital assistance platform to cash, in-kind and emergencies
(TEC) and school meals (School Feeding Service) that support the achievement of
strategic priorities. The IRM, which featured in this pillar in the 2018 budget, has largely been
mainstreamed. For many of its components, the bulk of the transition occurred in 2017
and 2018. The continuing work and related budget for IRM implementation in 2019 appear
in pillars B and C
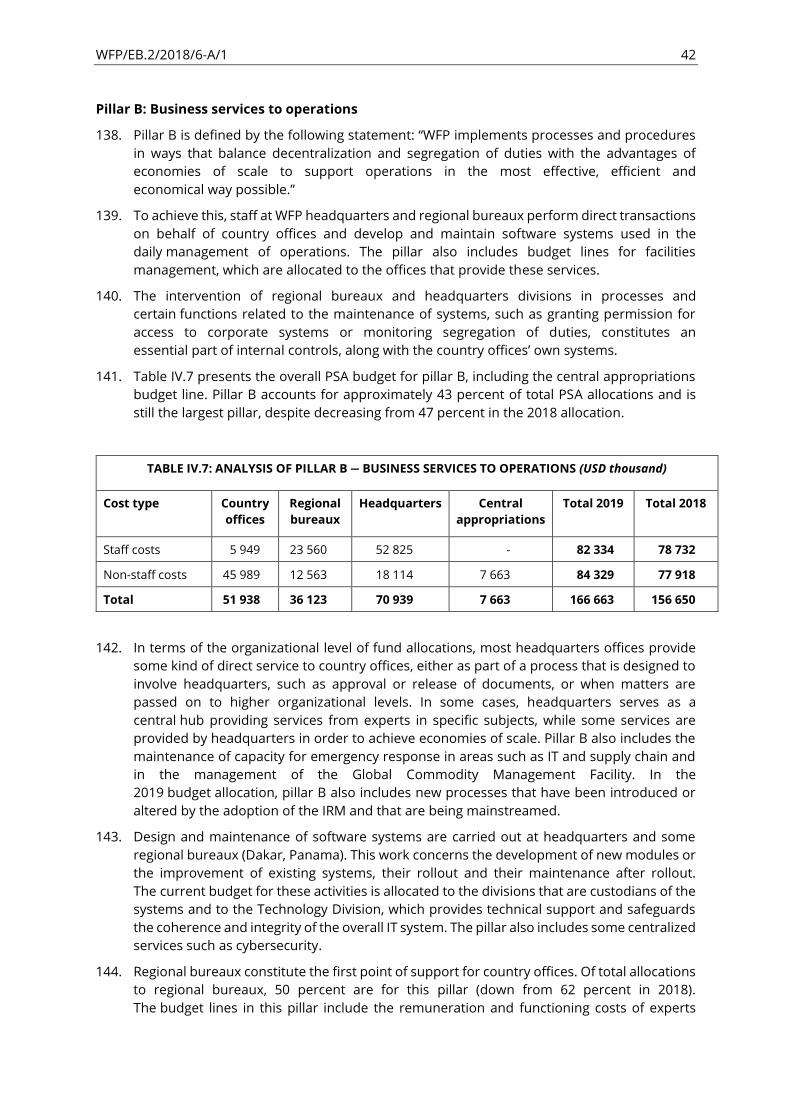
WFP/EB.2/2018/6-A/1 42
Pillar B: Business services to operations
138. Pillar B is defined by the following statement: WFP implements processes and procedures in ways that balance decentralization and segregation of duties with the advantages of
economies of scale to support operations in the most effective, efficient and
economical way possible.
139. To achieve this, staff at WFP headquarters and regional bureaux perform direct transactions
on behalf of country offices and develop and maintain software systems used in the
daily management of operations. The pillar also includes budget lines for facilities
management, which are allocated to the offices that provide these services.
140. The intervention of regional bureaux and headquarters divisions in processes and
certain functions related to the maintenance of systems, such as granting permission for
access to corporate systems or monitoring segregation of duties, constitutes an
essential part of internal controls, along with the country offices’ own systems.
141. Table IV.7 presents the overall PSA budget for pillar B, including the central appropriations
budget line. Pillar B accounts for approximately 43 percent of total PSA allocations and is
still the largest pillar, despite decreasing from 47 percent in the 2018 allocation.
TABLE IV.7: ANALYSIS OF PILLAR B — BUSINESS SERVICES TO OPERATIONS (USD thousand)
Cost type Country
offices
Regional
bureaux
Headquarters Central
appropriations
Total 2019 Total 2018
Staff costs 5 949 23 560 52 825 - 82 334 78 732
Non-staff costs 45 989 12 563 18 114 7 663 84 329 77 918
Total 51 938 36 123 70 939 7 663 166 663 156 650
142. In terms of the organizational level of fund allocations, most headquarters offices provide
some kind of direct service to country offices, either as part of a process that is designed to
involve headquarters, such as approval or release of documents, or when matters are
passed on to higher organizational levels. In some cases, headquarters serves as a
central hub providing services from experts in specific subjects, while some services are
provided by headquarters in order to achieve economies of scale. Pillar B also includes the
maintenance of capacity for emergency response in areas such as IT and supply chain and
in the management of the Global Commodity Management Facility. In the
2019 budget allocation, pillar B also includes new processes that have been introduced or
altered by the adoption of the IRM and that are being mainstreamed.
143. Design and maintenance of software systems are carried out at headquarters and some
regional bureaux (Dakar, Panama). This work concerns the development of new modules or
the improvement of existing systems, their rollout and their maintenance after rollout.
The current budget for these activities is allocated to the divisions that are custodians of the
systems and to the Technology Division, which provides technical support and safeguards
the coherence and integrity of the overall IT system. The pillar also includes some centralized
services such as cybersecurity.
144. Regional bureaux constitute the first point of support for country offices. Of total allocations
to regional bureaux, 50 percent are for this pillar (down from 62 percent in 2018).
The budget lines in this pillar include the remuneration and functioning costs of experts

WFP/EB.2/2018/6-A/1 43
in specific subjects, who are based in regional bureaux. This reflects a shift in the regional
bureau budget allocation following the first year of implementation of the revised
budget structure. The corresponding budget has been moved from pillar B to pillar C,
in which the regional bureaux also play a key second line of defence role for country offices.
The ongoing review of the roles and responsibilities of regional bureaux will help clarify
these distinct functions.
145. Country offices also receive a part of the PSA allocation for pillar B. These funds are allocated
to cover P4 or P3 technical positions in small country offices that would otherwise not have
sufficient resources to guarantee a good standard of operations.
146. In the 2019 budget, pillar B also includes some specific initiatives such as the provision of
surge capacity for responding to allegations of sexual exploitation and abuse. Through this
initiative, direct services will be provided to any office requiring them, including
country offices, and investments will be made in increasing the capacities of
regional bureaux.
Pillar C: Policy, guidance and quality assurance
147. Pillar C is defined by the following statement: WFP maintains high standards in its internal norms, policies and tools and has capable staff who ensure that its operations are designed
and implemented to meet the needs of the people it serves.
148. To achieve this, the pillar includes top-down activities such as policy design and
implementation, bottom-up interventions such as responding to country offices’ requests for guidance and support, and the monitoring of compliance with policies. Activities included
in the pillar constitute a critical second line of defence for the oversight function, which by
their nature are implemented by headquarters offices and regional bureaux.
149. Table IV.8 presents the overall PSA budget for pillar C. The overall share of the PSA budget
for pillar C has increased slightly since 2018 to 14 percent.
TABLE IV.8: ANALYSIS OF PILLAR C — POLICY, GUIDANCE AND QUALITY ASSURANCE (USD thousand)
Cost type Country
offices
Regional
bureaux
Headquarters Central
appropriations
Total 2019 Total 2018
Staff costs - 12 290 25 213 - 37 503 31 797
Non-staff costs - 8 644 5 843 - 14 487 11 611
Total 20 934 31 056 - 51 989 43 408
150. Staff costs represent 72 percent of the total allocation for pillar C. Non-staff costs included
in this pillar are for training, which is very often provided remotely, and the publication of
guidance and materials through internal information and knowledge
management platforms.
151. In terms of the organizational level of these budget allocations, all are allocated to
headquarters and regional bureaux. The regional bureaux have increased their share of the
total budget allocated to pillar C, accounting for 29 percent in 2019 compared with
18 percent in 2018. This reflects the prominent role that the regional bureaux have taken in
implementation of the IRM and its progressive rollout. The pillar C policy, guidance and
quality assurance function is not provided by country offices.

WFP/EB.2/2018/6-A/1 44
152. Budget allocations to the headquarters level focus on the preparation, updating and
approval of policy documents and the development of all materials for supporting the
implementation of policies, such as guidance, tools and training packages. Because of the
impact of the IRM on WFP’s internal processes, the budget for 2019, as in 2018, includes numerous allocations for updating guidance and tools. Most of WFP’s training initiatives are included in this pillar remote training based in WeLearn, face-to-face training organized by
headquarters and regional bureaux or combinations of both.
153. The pillar also includes all advisory work provided by subject experts at regional bureaux as
the first point of support for country offices and at headquarters as the second. It also
includes internal technical oversight activities, which inform changes to policies and
implementation and can also highlight issues for corporate attention. The budget for these
activities is allocated to headquarters for central services such as the legal and ethics offices,
and to regional bureaux for more decentralized functions such as the programme function.
The activities included in the pillar complement the direct support provided by the
technical units of regional bureaux and headquarters and budgeted in pillar B. As such, any
decentralization of activities that decreases budgets allocated to pillar B may create a need
for increases in staff capacity building and advisory activities (pillar C) in order to ensure the
quality of operations.
154. Pillar C also includes oversight and compliance activities performed either by the divisions
responsible for functional areas or by specific compliance units in the regional bureaux.
The strengthening of capacities for this function has increased the number of offices that
perform the related roles and have specific budget allocations, from 8 in 2018 to 13 in 2019.
This increase is responsible for part of the increase of the budget allocated to this pillar.
Pillar D: Advocacy, partnerships, fundraising and United Nations coordination
155. Pillar D is defined by the following statement: WFP collaborates with host and
donor governments, NGOs and the private sector to align priorities and mobilize resources,
advocate for zero hunger and partner with United Nations agencies in contributing to
achievement of the SDGs.
156. To achieve this, the pillar includes WFP’s efforts to mobilize resources, communicate, advocate and coordinate with the Rome-based agencies, other United Nations agencies and
the humanitarian response system. It also includes the establishment and maintenance of
strategic partnerships with non-governmental organizations (NGOs), the private sector and
academic institutions, which can contribute to or facilitate partnerships at the country and
operational levels.
157. Table IV.9 presents the overall budget for pillar D, including the central appropriations
budget line. The share of this pillar in the overall PSA budget is 20 percent, compared with
18 percent in 2018.
TABLE IV.9: ANALYSIS OF PILLAR D — ADVOCACY, PARTNERSHIPS, FUNDRAISING AND
UNITED NATIONS COORDINATION (USD thousand)
Cost type Country
offices
Regional
bureaux
Headquarters Central
appropriations
Total 2019 Total 2018
Staff costs 12 031 7 927 31 620 860 52 438 42 857
Non-staff
costs
3 300 3 919 13 454 4 537 25 210 19 000
Total 15 331 11 846 45 074 5 398 77 648 61 857
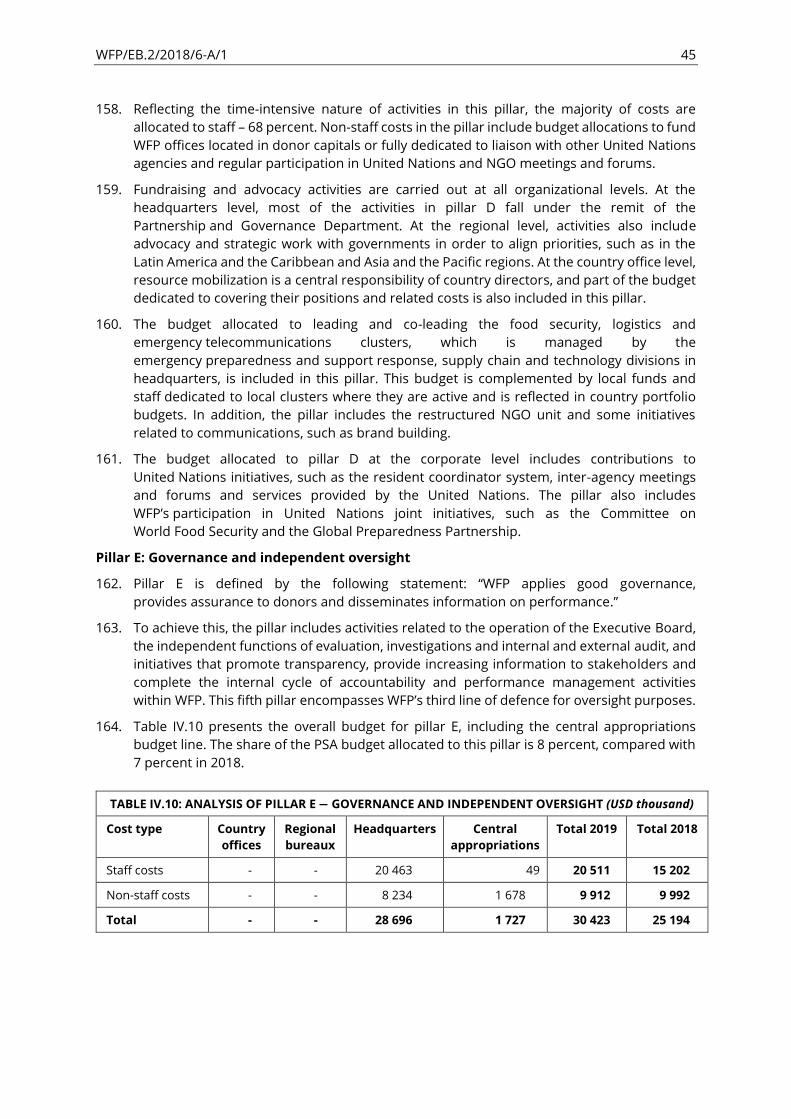
WFP/EB.2/2018/6-A/1 45
158. Reflecting the time-intensive nature of activities in this pillar, the majority of costs are
allocated to staff 68 percent. Non-staff costs in the pillar include budget allocations to fund
WFP offices located in donor capitals or fully dedicated to liaison with other United Nations
agencies and regular participation in United Nations and NGO meetings and forums.
159. Fundraising and advocacy activities are carried out at all organizational levels. At the
headquarters level, most of the activities in pillar D fall under the remit of the
Partnership and Governance Department. At the regional level, activities also include
advocacy and strategic work with governments in order to align priorities, such as in the
Latin America and the Caribbean and Asia and the Pacific regions. At the country office level,
resource mobilization is a central responsibility of country directors, and part of the budget
dedicated to covering their positions and related costs is also included in this pillar.
160. The budget allocated to leading and co-leading the food security, logistics and
emergency telecommunications clusters, which is managed by the
emergency preparedness and support response, supply chain and technology divisions in
headquarters, is included in this pillar. This budget is complemented by local funds and
staff dedicated to local clusters where they are active and is reflected in country portfolio
budgets. In addition, the pillar includes the restructured NGO unit and some initiatives
related to communications, such as brand building.
161. The budget allocated to pillar D at the corporate level includes contributions to
United Nations initiatives, such as the resident coordinator system, inter-agency meetings
and forums and services provided by the United Nations. The pillar also includes
WFP’s participation in United Nations joint initiatives, such as the Committee on
World Food Security and the Global Preparedness Partnership.
Pillar E: Governance and independent oversight
162. Pillar E is defined by the following statement: WFP applies good governance,
provides assurance to donors and disseminates information on performance.
163. To achieve this, the pillar includes activities related to the operation of the Executive Board,
the independent functions of evaluation, investigations and internal and external audit, and
initiatives that promote transparency, provide increasing information to stakeholders and
complete the internal cycle of accountability and performance management activities
within WFP. This fifth pillar encompasses WFP’s third line of defence for oversight purposes.
164. Table IV.10 presents the overall budget for pillar E, including the central appropriations
budget line. The share of the PSA budget allocated to this pillar is 8 percent, compared with
7 percent in 2018.
TABLE IV.10: ANALYSIS OF PILLAR E — GOVERNANCE AND INDEPENDENT OVERSIGHT (USD thousand)
Cost type Country
offices
Regional
bureaux
Headquarters Central
appropriations
Total 2019 Total 2018
Staff costs - - 20 463 49 20 511 15 202
Non-staff costs - - 8 234 1 678 9 912 9 992
Total - - 28 696 1 727 30 423 25 194
WFP/EB.2/2018/6-A/1 46
165. The majority of allocations for this pillar are directed to staff costs, with 67 percent; non-staff
costs account for 33 percent. The budget allocated to staff costs covers the divisions in
charge of coordination and management of the functions in pillar E. The budget allocated
to the evaluation function also covers support to decentralized evaluations and all the
necessary activities for increasing staff capacity to coordinate independent evaluations,
in accordance with the WFP Evaluation Policy (2016 2021). The budget for pillar E also
includes allocations to internal and external transparency initiatives such as the
Annual Conflicts of Interest and Financial Disclosure Programme managed by the
Ethics Office, and the publication of WFP financial data in reports and the IATI platform, all of
which are staff intensive.
166. The non-staff costs include the organization of Board sessions and similar events for other
advisory committees and bodies, other Board-related trips and activities, and the
procurement of external services for these activities.
167. Because of the nature of the activities in this pillar, they are carried out exclusively at
headquarters by a small number of dedicated organizational units. While the proportion of
the budget in pillar E has increased only slightly, some offices have received significant
budget increases.
WFP’s corporate performance
168. WFP’s corporate performance will be measured against the revised corporate results framework using a set of indicators that reflect the performance of country offices and the
support provided by regional bureaux and headquarters divisions.
169. Corporate key performance indicators to be used in measuring WFP’s performance in 2019 and reported on in the annual performance report have been discussed with the Board
during informal consultations on the revised Corporate Results Framework (2017—2021).
The final KPIs are presented in section V together with baselines and targets for
measuring performance.
Contributions of functions by organizational unit
170. The five results pillars are intended to capture all the ways in which regional bureaux and
headquarters provide support to country offices. In this structure, different
organizational units provide different and often complementary types of support, while the
nature of some offices might prescribe certain functions. For example, the offices of the
Deputy Executive Director and assistant executive directors will provide more services in
pillar A (strategy and direction), while the Office of the Inspector General (OIG) provides
services that are mostly in pillar E (governance and independent oversight) and the
regional bureaux provide more direct services in pillar B (business services to operations).
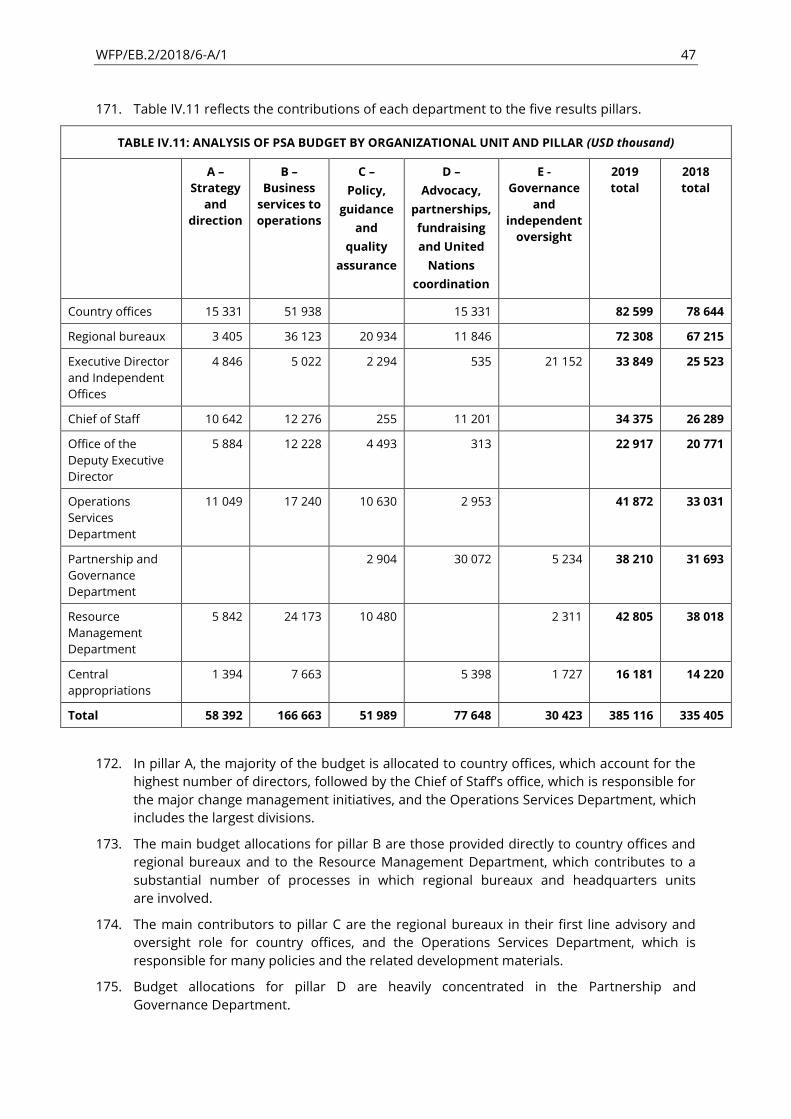
WFP/EB.2/2018/6-A/1 47
171. Table IV.11 reflects the contributions of each department to the five results pillars.
TABLE IV.11: ANALYSIS OF PSA BUDGET BY ORGANIZATIONAL UNIT AND PILLAR (USD thousand)
A
Strategy
and
direction
B
Business
services to
operations
C
Policy,
guidance
and
quality
assurance
D
Advocacy,
partnerships,
fundraising
and United
Nations
coordination
E -
Governance
and
independent
oversight
2019
total
2018
total
Country offices 15 331 51 938 15 331 82 599 78 644
Regional bureaux 3 405 36 123 20 934 11 846 72 308 67 215
Executive Director
and Independent
Offices
4 846 5 022 2 294 535 21 152 33 849 25 523
Chief of Staff 10 642 12 276 255 11 201 34 375 26 289
Office of the
Deputy Executive
Director
5 884 12 228 4 493 313 22 917 20 771
Operations
Services
Department
11 049 17 240 10 630 2 953 41 872 33 031
Partnership and
Governance
Department
2 904 30 072 5 234 38 210 31 693
Resource
Management
Department
5 842 24 173 10 480 2 311 42 805 38 018
Central
appropriations
1 394 7 663 5 398 1 727 16 181 14 220
Total 58 392 166 663 51 989 77 648 30 423 385 116 335 405
172. In pillar A, the majority of the budget is allocated to country offices, which account for the
highest number of directors, followed by the Chief of Staff’s office, which is responsible for the major change management initiatives, and the Operations Services Department, which
includes the largest divisions.
173. The main budget allocations for pillar B are those provided directly to country offices and
regional bureaux and to the Resource Management Department, which contributes to a
substantial number of processes in which regional bureaux and headquarters units
are involved.
174. The main contributors to pillar C are the regional bureaux in their first line advisory and
oversight role for country offices, and the Operations Services Department, which is
responsible for many policies and the related development materials.
175. Budget allocations for pillar D are heavily concentrated in the Partnership and
Governance Department.
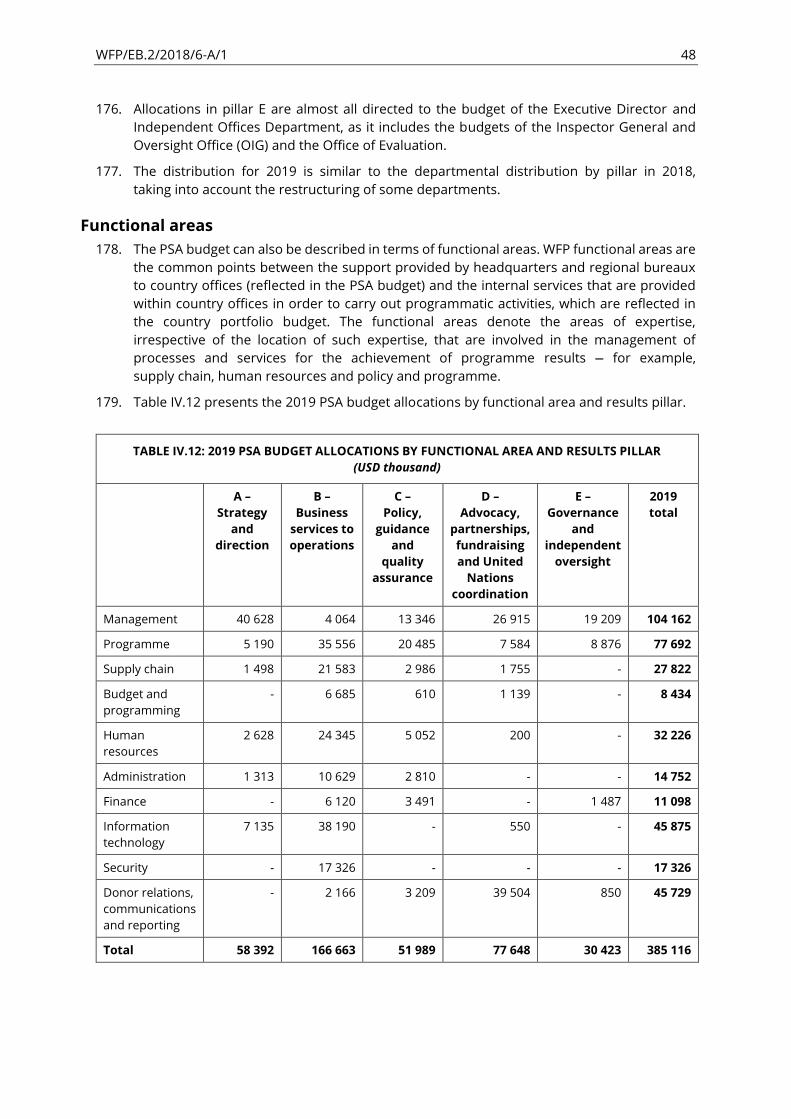
WFP/EB.2/2018/6-A/1 48
176. Allocations in pillar E are almost all directed to the budget of the Executive Director and
Independent Offices Department, as it includes the budgets of the Inspector General and
Oversight Office (OIG) and the Office of Evaluation.
177. The distribution for 2019 is similar to the departmental distribution by pillar in 2018,
taking into account the restructuring of some departments.
Functional areas
178. The PSA budget can also be described in terms of functional areas. WFP functional areas are
the common points between the support provided by headquarters and regional bureaux
to country offices (reflected in the PSA budget) and the internal services that are provided
within country offices in order to carry out programmatic activities, which are reflected in
the country portfolio budget. The functional areas denote the areas of expertise,
irrespective of the location of such expertise, that are involved in the management of
processes and services for the achievement of programme results — for example,
supply chain, human resources and policy and programme.
179. Table IV.12 presents the 2019 PSA budget allocations by functional area and results pillar.
TABLE IV.12: 2019 PSA BUDGET ALLOCATIONS BY FUNCTIONAL AREA AND RESULTS PILLAR
(USD thousand)
A
Strategy
and
direction
B
Business
services to
operations
C
Policy,
guidance
and
quality
assurance
D
Advocacy,
partnerships,
fundraising
and United
Nations
coordination
E
Governance
and
independent
oversight
2019
total
Management 40 628 4 064 13 346 26 915 19 209 104 162
Programme 5 190 35 556 20 485 7 584 8 876 77 692
Supply chain 1 498 21 583 2 986 1 755 - 27 822
Budget and
programming
- 6 685 610 1 139 - 8 434
Human
resources
2 628 24 345 5 052 200 - 32 226
Administration 1 313 10 629 2 810 - - 14 752
Finance - 6 120 3 491 - 1 487 11 098
Information
technology
7 135 38 190 - 550 - 45 875
Security - 17 326 - - - 17 326
Donor relations,
communications
and reporting
- 2 166 3 209 39 504 850 45 729
Total 58 392 166 663 51 989 77 648 30 423 385 116
WFP/EB.2/2018/6-A/1 49
180. In the 2019 PSA budget proposal, the functional areas with the highest PSA allocations are
management and programme. In most functional areas, the largest allocations are made
for pillar B, where most headquarters divisions and regional bureaux provide services to the
country offices. This is consistent with pillar B accounting for the highest share of
total budget allocations.
181. In pillars B and C, in which similar allocations of budget are made to different
functional areas, the highest allocations are made to the programme, supply chain and
human resources functions, which are the more pertinent areas of responsibility in
country offices. Pillar B also has a very high allocation for IT, as it includes the budget for
maintaining software and providing solutions to country offices.
182. The largest allocation in pillar D is for the donor relations, communications and
reporting function in country offices. Allocations to management and programme are also
significant. These three functional areas are normally responsible for United Nations
relations and partnerships, including with governments, at the country office level.
183. For comparison with past years, table IV.13 shows the PSA budget by organizational location,
displaying the number of positions and the breakdown between staff and other costs.

WFP/EB.2/2018/6-A/1 50
TABLE IV.13: PSA BUDGET BY ORGANIZATIONAL LEVEL
2017 expenditures 2018 estimated 2019 projected
Post counts Staff
costs
USD
million
Other
costs
USD
million
Total
costs
USD
million
Post counts Staff
costs
USD
million
Other
costs
USD
million
Total
costs
USD
million
Post counts Staff
costs
USD
million
Other
costs
USD
million
Total
costs
USD
million
Prof GS Nat Total Prof GS Nat Total Prof GS Nat Total
Country
offices
105 - 323 428 27.0 51.8 78.8 106 - 345 451 30.0 48.7 78.6 106 - 345 451 30.0 52.6 82.6
Regional
bureaux
171
- 259 430 34.9 32.3 67.2 188 - 279 467 42.3 24.9 67.2 202 - 269 471 46.0 26.3 72.3
Headquarters 484 331 9 824 112.2 63.7 175.9 481 338 4 823 130.4 44.9 175.3 563 379 18 959 157.2 56.8 214.0
Central
appropriations
3 - - 3 1.6 11.2 12.8 3 - - 3 0.7 13.5 14.2 3 2 - 5 0.9 15.3 16.2
Total 763 331 591 1 685 175.7 159.0 334.7 778 338 628 1 744 203.5 131.9 335.4 874 380 632 1 886 234.2 151.0 385.1
GS: general service; Nat.: national; Prof.: professional.
WFP/EB.2/2018/6-A/1 51
Organizational structure
184. Headquarters departments report to the Executive Director. OIG, the Office of
the Ombudsman, the Office of Evaluation, the Ethics Office and the Legal Office also report
directly to the Executive Director, with support provided by the Deputy Executive Director.
For presentation purposes, these are referred to as the independent offices .
185. The Deputy Executive Director directly supervises the regional bureaux.
The Deputy Executive Director retains responsibility for implementation of the IRM (to be
completed in 2019) in order to ensure seamless liaison with field operations as they
complete the transition to the new approach. The Deputy Executive Director also supervises
the Human Resources Division, the Gender Office and the Strategic Coordination and
Support Office.
186. The Strategic Coordination and Support Office was created to provide effective leadership
and play a core role in the formulation of WFP’s corporate strategies and the directions that are critical to WFP’s engagement in the 2030 Agenda. The office will contribute to the development and pursuit of national, regional and global priorities for achieving SDG 2 and
related SDG targets and indicators. Focus will be on partnerships with the World Bank
Group, other international and regional financial institutions, the African Union and China;
provision of support to the G77 + China initiative for enhancing knowledge-sharing,
skills and technology transfer; and national and international resource mobilization.
187. The Chief of Staff focuses on leading WFPs digital transformation. The critical divisions
supporting this work and reporting directly to the Chief of Staff are the Global Coordinator
for Cash-Based Transfers, the Technology Division, the Innovation and
Change Management Division and the Communications, Advocacy and Marketing Division.
188. The Operations Services Department leads WFP’s work in emergency response and provides support aimed at ensuring operational excellence. The department plays the main role in
supporting operations while continuing to promote greater effectiveness and efficiency in
the policy and programme, nutrition, supply chain and emergency preparedness and
support response divisions and the new School Feeding Service.
189. The School Feeding Service has been established to lead the design and implementation of
policy, research and strategic thinking related to school meals and to regain
WFP’s global leadership in the direct implementation of school meal programmes and the
provision of related technical support to governments. School feeding is a cornerstone of
WFP’s assistance, delivering multiple benefits in support of childhood education and
nutrition and serving as part of national social protection and social safety net systems
and services.
190. When implementing its school feeding programmes, WFP promotes a broad set of often
interlinked objectives, including combating inadequate nutrition and lack of diversity in
children’s diets, increasing girls’ school attendance and retention, promoting local production and creating markets for local farmers, which provide jobs for women and
ensure protection for the most vulnerable families.
191. The Resource Management Department focuses on the effective stewardship and
financial management of WFP. The department is supported by the core functions of budget
and programming, finance and treasury, enterprise risk management,
performance management and monitoring, management services, security and
staff wellness.
WFP/EB.2/2018/6-A/1 52
192. The Partnership and Governance Department provides leadership and expertise in
WFP’s global partnership and resource mobilization efforts, ensuring that WFP gets the
maximum resources possible for supporting Member States in achieving the goals of the
2030 Agenda. Engagement with the Rome-based agencies and other United Nations and
multilateral institutions, and collaboration with the private sector are increasingly important
elements of WFP’s outreach approach.
193. The WFP organizational structure is shown in figure IV.2.
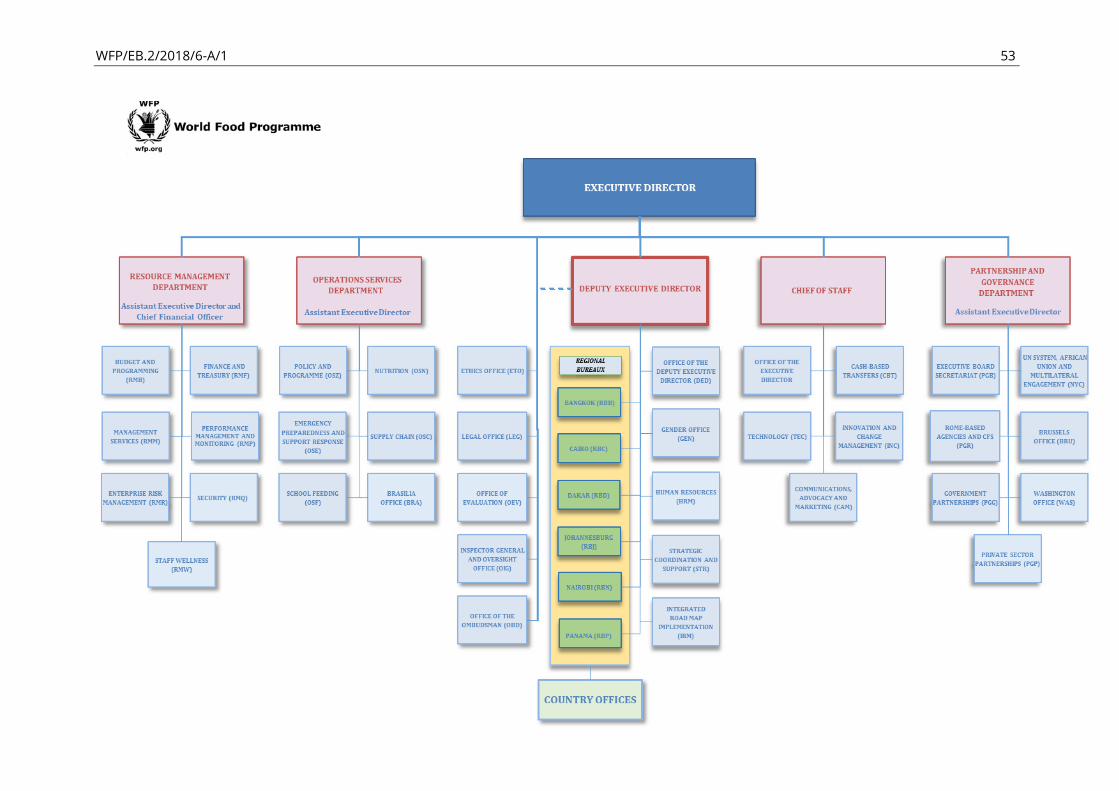
WFP/EB.2/2018/6-A/1 53
WFP/EB.2/2018/6-A/1 54
Budget allocations for departmental reprioritizations
and management priorities
194. Allocations for departments’ reprioritization of resources and for management priorities amount to USD 39.3 million of additional PSA. These allocations are made with a view to
ensuring that resources are available for supporting WFP’s increasing operational activity and that underfunded areas identified through audit and investigatory work are prioritized
so that the oversight offices, in particular, are better resourced for carrying out
their responsibilities.
195. The Management Plan (2019 2021) provides WFP with an opportunity to increase the use
of PSA resources for maintaining operational effectiveness and efficiency. The budget
required comes from the PSA budget, but the benefits that accrue in reduced operational
expenditure or increased effectiveness are seen in operations.
196. All budget submissions for 2019 were reviewed with a view to identifying those that fall
within WFP’s management priorities, with costs identified as recurring being prioritized for PSA allocations.
Summary of the 2019 PSA budget by department
Office of the Executive Director and Independent Offices
(2019: USD 33.85 million; 2018: USD 25.52 million)
197. WFP’s approach to implementation of the evaluation policy requires steadily increased resourcing over the period of the policy in order to meet the evaluation coverage norms
stipulated in the policy. The policy calls for establishing a significant decentralized evaluation
function alongside the well-established centralized function in order to support integrated
learning from the use of both types of evaluation. The Office of Evaluation is using its budget
to meet critical structural requirements and to prepare WFP for the increased volume of
centralized evaluations.
198. The mandate of the Ethics Office covers five main areas: education and outreach, protection
from retaliation, the annual disclosure programme, standard setting and policy advocacy,
and advice and guidance. Resources have been prioritized to ensure adequate capacity for
supporting the updating of policies, including the protection from retaliation policy; creating
standard operating procedures and addressing other standards and governance matters;
and enhancing advice and guidance by issuing new materials and modifying existing ones
based on experience of using the new 2018/2019 user application and training activities.
The PSA allocation will also enable the Ethics Office to deliver on its increased internal and
external reporting responsibilities.
199. In line with a broader movement within the United Nations system and indications received
from members of the WFP Executive Board in 2018, WFP has significantly increased its focus
on the enforcement of accountability and policies for ensuring protection from harassment,
sexual harassment, abuse of authority and discrimination, and sexual exploitation
and abuse. The Legal Office is reprioritizing its structure and resources in order to carry out
the associated increased legal work and provision of advice to OIG and the
Human Resources Division.
200. The Office of the Ombudsman and Mediation Services exists to help and support employees
in addressing any work-related problem or conflict in a confidential, informal, impartial and
independent manner, and to contribute to creating an engaged and committed workforce.
The office will use additional budgetary resources in order to enhance its ability to address
WFP/EB.2/2018/6-A/1 55
in a timely and efficient manner the growing number of requests from staff. Through the
additional capacity, WFP employees in the field will have better access to the office’s services.
201. OIG has prioritized its PSA resources with a view to enhancing its staffing structure in order
to align it with the benchmarking of other United Nations organizations. This is part of an
ongoing effort to scale up OIG and ensure that it is able to meet the current demand for
assurance coverage requested by donors and the Board. The resources will be instrumental
in covering the increased workload for investigations of, for example, sexual harassment or
fraud allegations.
Office of the Deputy Executive Director
(2019: USD 22.92 million; 2018: USD 20.77 million)
202. Resources have been prioritized to address requirements in the Human Resources Division
in emerging areas, including harassment, sexual harassment and abuse of authority,
recruitment and workforce planning, gender and diversity, management of the emergency
roster and training expertise, and to strengthen the division’s staffing structure for delivering in these priority areas.
203. The increase in PSA resources for work on gender issues is being allocated to supporting
and enhancing WFP’s capacity to implement its gender policy. The additional resources will be directed to integrating the pursuit of gender equality into corporate policies and
implementing core gender mainstreaming mechanisms, specifically the revised
United Nations System-Wide Action Plan for Implementation of the United Nations
Chief Executives Board Policy on Gender Equality and the Empowerment of Women
(UN SWAP 2.0), the Gender Transformation Programme and the gender and age marker.
They will also be used to raise awareness of the importance of gender equality in all aspects
of WFP’s work.
204. WFP allocated USD 5.5 million to providing support to regional bureaux, covering immediate
requirements in functional areas that include implementation of the IRM, vulnerability
analysis and mapping, oversight, compliance, supply chain and human resources.
These resource allocations, along with the original regional PSA budgets, will be reviewed in
preparation for the 2020 management plan and as part of the ongoing review of
regional bureaux terms of reference.
Office of the Chief of Staff
(2019: USD 34.38 million; 2018: USD 26.29 million)
205. The Office of the Chief of Staff plays a central role in providing strategic guidance on the
implementation of actions aimed at realizing the Executive Director’s vision for WFP. Fundraising and partnerships, digital transformation, operational effectiveness and
excellence in programme and emergency response are critical management priorities.
206. The Office of the Chief of Staff will continue to invest additional resources with the aim of
ensuring that WFP leads the way as the largest, most agile, innovative and technologically
advanced humanitarian agency. To support these efforts, the office coordinates the work of
the divisions of communications, advocacy and marketing, innovation and
change management, cash-based transfers, and technology.
207. Reporting to the Chief of Staff, the Office of the Executive Director ensures that the
Executive Director’s missions, strategic engagements and direction for WFP in times of limited resources and rising needs contribute to the objective of serving all severely
food-insecure people around the world. The Executive Director’s extensive engagement with governments, the private sector, WFP headquarters and offices around the world and
WFP/EB.2/2018/6-A/1 56
participation in global events contribute to ensuring that WFP is strategically positioned in
the humanitarian development space, increasing WFP’s visibility as a lead agency and voice for the most vulnerable people while supporting WFP offices with the resources and profile
that are needed in a fast changing and complex environment.
208. The Chief of Staff has established new platforms such as the Global Impact Council, which
is aimed at facilitating private sector partnerships and diversifying WFP’s funding sources. External expertise has also been brought on board in order to assist WFP, particularly the
Communications, Advocacy and Marketing Division, with rebranding and to devise new
advertising strategies for increasing WFP’s presence in the digital/social media space.
This will also expand WFP’s traditional donor base and audience outreach.
209. Under the leadership of the Chief of Staff, knowing about the people whom WFP and its
partners serve with dignity and respect is one of the core pillars of the activities of the office.
Initiatives such as the dashboard will provide senior management with timely and reliable
information based on more detailed and segregated data and made available to
headquarters units, regional bureaux and country offices in order to inform
decision making. The dashboard is a single interface that automatically combines data on,
for example, numbers of beneficiaries, funding requirements, project activities in a
given country and numbers of women and men staff members employed. It provides
WFP staff with access to real-time, relevant and accurate data at the corporate, regional and
country office levels. In the medium term, the dashboard will replace redundant reports and
platforms and improve the overall efficiency of WFP’s operations and support services.
Collaboration with other United Nations agencies, governments and partners and the
provision of support to the field are a main pillar in ensuring coherence, coordination and
the ability to achieve zero hunger.
210. The divisions reporting to the Chief of Staff play critical roles in supporting the office.
The Technology Division will assist in building new, agile and efficient tools and business
models for WFP and its partners such as digital platforms, blockchains and dashboards. In a
changing world where needs are on the rise, new funding, branding and marketing
strategies are required, particularly for the digital/social media and private sector areas. The
revised goodwill ambassador programme, new private sector partnerships with Mastercard
and Facebook and WFP’s ShareTheMeal application are examples of the critical initiatives
under way. Investments have been allocated to the Communications, Advocacy and
Marketing Division with a view to strengthening these vital efforts.
211. The work of the Innovation and Change Management Division, particularly the
Innovation Accelerator, is now at a stage where innovative initiatives are being scaled up
and institutionalized. As WFP continues to adapt to the changes brought by implementation
of the IRM, and against the background of United Nations reform, change management
processes will create a new working culture. As a continuation of actions taken in 2017,
a global cash coordinator has been appointed, reporting to the Chief of Staff. This allows
WFP to focus on strengthening the effective and efficient corporate delivery of cash-based
transfers, including multi-purpose cash, with greater coherence, coordination
and compliance.
WFP/EB.2/2018/6-A/1 57
Partnership and Governance Department
(2019: USD 38.20 million; 2018: USD 31.69 million)
212. The Partnership and Governance Department will focus on improving the management of
existing and new partnerships, increasing access to diverse funding resources,
advancing WFP’s positions in accordance with United Nations reform efforts and increasing the stewardship by all staff of all resources with the aim of improving partnering
and fundraising.
213. The United Nations System, African Union and Multilateral Engagement Division will receive
extra staff capacity in view of the reform of the United Nations development system,
the Security Council resolution on conflict and hunger20 and the ongoing discussions on the
humanitarian development peace nexus. The division will be strengthened in order to
enhance WFP’s coordination of reform issues and augment WFP’s engagement in peacekeeping and integrated planning discussions and policy forums, ensuring that WFP is
well informed on issues that affect its operations.
214. The Government Partnerships Division and the WFP offices in major donor capitals will be
strengthened with the aim of attracting increased financial commitments from donors in
order to help WFP meet the needs of the people it serves. This investment will support WFP
in tapping into official development assistance, other donor discretionary funds and funding
from host governments.
215. As part of WFP’s efforts to enhance its partnerships with the private sector, the Private Sector Partnerships Division will also be strengthened with additional staff to manage ongoing
partnerships with companies such as Mastercard, Amazon and AB InBev, among others.
Operations Services Department
(2019: USD 41.87 million; 2018: USD 33.03 million)
216. The Operations Services Department’s submission for PSA funding in 2019 focused on priorities for renewing the vision of the department, which emerged following intensive
consultations with the leaders of field operations and taking into account
management priorities and recent corporate developments that influence the mandatory
work of the department. The department will strengthen its provision of service support to
the field, focus its thought leadership activities in major areas and integrate the work of all
its divisions and units in order to achieve maximum impact.
217. The Policy and Programme Division will continue to support country-level work towards
achievement of the 2030 Agenda SDGs in line with the WFP Strategic Plan (2017 2021).
In 2019, priority areas have been defined in five thematic areas: saving lives, changing lives,
positioning WFP for tomorrow, building strategic partnerships, and fostering programmatic
leadership. Actions will include strengthening the division’s support functions in the areas of climate, resilience and country capacity strengthening. Integration with other divisions
has also been prioritized, including through joint initiatives on vulnerability-based targeting,
and the incorporation of support to smallholders and food systems.
218. Having expanded its support to implementation of the IRM in 2018 by reprioritizing
resources from some nutrition-specific activities in order to facilitate wider deployment of
an analytical and decision making tool for governments, the Nutrition Division is now
focusing its attention on supporting WFP’s work in contributing to the achievement of
20 Security Council Resolution 2417 (2018) of 24 May 2018, available at
https://www.un.org/press/en/2018/sc13354.doc.htm.
WFP/EB.2/2018/6-A/1 58
SDG 2.2 and WFP Strategic Objective 2 through implementation of the corporate
nutrition policy. This work includes finding new solutions for ensuring that WFP can
contribute substantially in the areas of its partnerships with the United Nations
Children’s Fund (UNICEF) and other nutrition players, and increasing social and behaviour
change programmes related to nutrition.
219. The Supply Chain Division will continue to refine its enabling role in 2019, providing optimal
services for ensuring effective and efficient support to operations. The division will prioritize
its core activities of logistics and supply chain field support, sourcing and goods and services
procurement. To further support these services, the division has reallocated funding from
units that are currently well resourced — aviation and retail — and is finalizing the creation
of a special account that will be used to support food safety and quality.
220. For 2019, the Emergency Preparedness and Support Response Division has prioritized
the augmentation of capacities in global surge coordination in order to enhance
WFP’s system for deploying qualified staff to emergencies. Core elements of this initiative
include developing the next generation of responders, fostering new approaches to
emergency skills assessment and training, and fostering opportunities for building the
capacities of national staff through training and exchange programmes. The division will
also prioritize the strengthening of staff capacities in geographic information systems,
functional and support training for emergency response (FASTER) and continued
management of operational information for critical emergencies.
221. WFP has established a new School Feeding Service to reinforce its worldwide leadership in
and commitment to this crucial intervention. The service will focus on global thought
leadership and innovation, providing support to regional bureaux and country offices for
better programming and cost effectiveness, and supporting governments in national
school feeding programmes. It will also seek to enhance policy dialogue on sustainability
and to build stronger and better partnerships throughout the education, social protection
and agriculture sectors, including with the other Rome-based agencies, the World Bank and
UNICEF. Another important role of the School Feeding Service will be leading discussions
with donors and helping to mobilize resources for the scale up of school feeding activities
where they are most needed.
222. The return of the NGO Partnership Unit to the Operations Services Department in mid-2018
has helped to lay a solid foundation for closer integration of field partnerships, with
operational practices reinforced by specialist expertise from the department.
Resource Management Department
(2019: USD 42.80 million; 2018: USD 38.02 million)
223. The Resource Management Department consists of two core functions: the chief financial
officer (CFO) function is supported by divisions such as those of budget and programming,
finance and treasury, enterprise risk management and performance management and
monitoring; and the duty of care function includes the divisions of security, staff wellness
and management services. Within these two functions, the Resource Management
Department has continued to prioritize the enterprise risk management and internal control
management functions, including anti-fraud and anti-corruption, and other priority areas
identified in the recommendations deriving from oversight reports and related to
implementation of the IRM, financial analysis, monitoring and reporting. Increases in the
volumes of PSA funding required by the department in recent years were kept to a minimum
by increasing efficiencies in order to keep staff numbers fixed. However, thresholds for step
increases have now been reached in several areas, including headquarters security.
The most significant prioritization of the department’s budget allocation (in both percentage

WFP/EB.2/2018/6-A/1 59
and value terms) is for the Enterprise Risk Management Division and will enable a continued
focus on the anti-fraud and anti-corruption function and the expansion of management-side
oversight support.
224. The proposed increase in PSA funding for the Enterprise Risk Management Division (RMR)
in 2019 will allow the division to invest in core areas including risk management and
fraud prevention. Specifically, two additional fraud prevention specialists will be recruited
with a view to building a team of experts in the second line of defence in regional bureaux who will, among other tasks, deliver training and cross-cutting guidance, provide focused
support to functional and operational risk owners on high priority anti-fraud and
anti-corruption issues and, where required, support investigations led by the Office of
Inspections and Investigations. The additional staff will also conduct stocktaking and
benchmarking exercises, address governance and policy gaps and streamline counter-fraud
controls in specific processes. An additional position will be created in order to support the
tracking of oversight recommendations, management’s follow up on the implementation of
recommendations and reporting on progress. This new position takes into consideration
WFP’s investment in the third line of defence and the increase in oversight reporting anticipated, particularly from internal audits and evaluations.
225. Following the IRM pilot, strengthening performance management is a key priority to meet
corporate commitments of accountability and transparency. In 2019,
the Performance Management and Monitoring Division will increase support to
country offices implementing the corporate monitoring strategy by adding or
mainstreaming a total of 4 posts. The additional staff will complement advances in
monitoring efforts by increasing day-to-day support to country offices and regional bureaux,
supporting guideline development and increasing the reporting and analytics capacity.
226. Despite significant increases in the volume of transactions throughout the department,
some areas were deprioritized with the aim of creating room for investing in capacity for
innovation and new initiatives such as staff welfare (with more medical services for
emergency responses and in the field), field engineering and the financial aspects of
cash-based transfers. The department has initiated reviews in order to identify transactional
work that could be deprioritized and, where possible, has looked for automation solutions
to cope with the increased volume, although this will require some short-term investments
in 2019. Efficiencies in enabling services will also continue to be pursued through
United Nations-wide reform efforts, in which WFP has assumed a leadership role in the
Business Innovations Strategic Results Group.
Use of the General Fund
227. OIG has recommended a review and increase of staffing levels in the Treasury Branch in
order to enable WFP to meet effectively some of the demands arising from larger volumes
of cash and investments and increased business complexity. WFP’s investment committee
has echoed the need for increased treasury capacity and adequate staffing in order to
ensure optimal management of WFP’s financial resources. As annual investment income is
credited to the General Fund, this fund was identified and approved in past years as a
funding source for supplementing the PSA resources allocated to the Treasury Branch.
WFP is proposing to increase the annual General Fund usage for this purpose from
USD 1 million to USD 1.55 million. The increase would be fully offset against the expected
higher income from interest on investments, which is allocated each year to the
General Fund. The increase in resources would provide funding for three additional
Treasury Branch positions and increased IT and other support costs.
WFP/EB.2/2018/6-A/1 60
PSA gender marker
228. The Gender Office has created a programme of work for implementing the Gender Policy
(2015 2020) successfully and strategically and supporting the integration of gender equality
into the IRM. The office’s activities build on existing initiatives and constitute core components of WFP’s gender mainstreaming.
229. The non-programmatic gender marker that WFP uses for its PSA budget is based on the
Inter-Agency Standing Committee (IASC) gender marker for project resources. The marker
measures the level of resources budgeted for activities promoting gender equality and the
empowerment of women. For 2019, USD 21.3 million of such resources is incorporated in
the PSA budget. This total includes the costs of personnel whose work is primarily dedicated
to gender issues and part of the costs of gender focal points and other staff whose work
supports gender-related activities.
Status of the PSA equalization account
230. The PSAEA is used to cover any difference between ISC income and approved
PSA expenditure; as a reserve that underwrites the risk of decreases in ISC income or
underfunding of the PSA budget; for critical corporate initiatives or thematic support funds;
and for strengthening WFP’s reserves. Following the review of the PSAEA target level agreed by the Board at its 2015 annual session,21 the Secretariat increased the target level to
five months of PSA expenditure and established a floor in the account that is equivalent to
two months of PSA expenditure. The portion of the account below the floor would be used
only for the first two purposes listed above.
231. The projected opening balance of the PSAEA at 1 January 2019 is USD 236.9 million. This is
calculated based on a funding forecast for 2018 of USD 7.2 billion. The balance is equivalent
to 8.5 months of PSA expenditure.
TABLE IV.14: PSAEA PROJECTION FOR 2018 (USD million)
PSAEA balance at 1 January 2018 256.8
Estimated ISC income 2018 (based on projected income of USD 7.2 billion) 433.1
Approved PSA budget (335.4)
2018 critical corporate initiatives (35.6)
2018 allocations to reserves (17.0)
PSAEA drawdown for IRA and EDMF* (65.0)
Projected PSAEA balance at 31 December 2018 236.9
* WFP/EB.A/2018/6-C/1/Rev.1.
21 WFP/EB.A/2015/6-C/1.
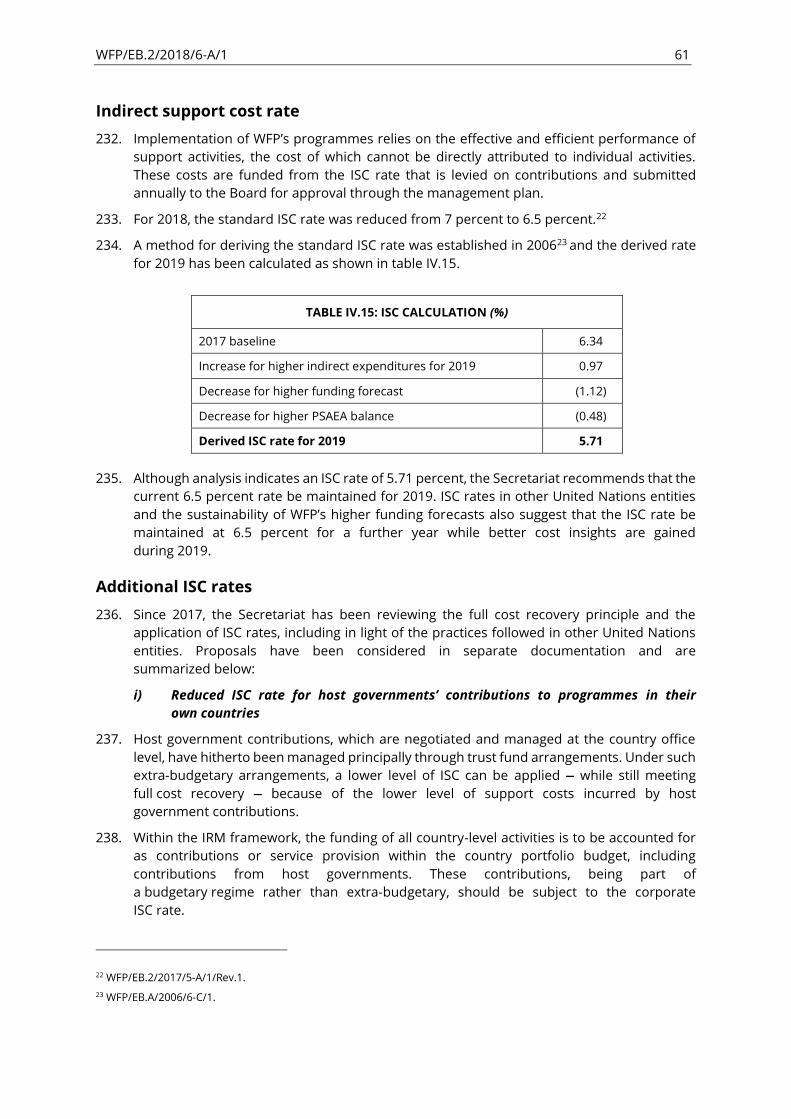
WFP/EB.2/2018/6-A/1 61
Indirect support cost rate
232. Implementation of WFP’s programmes relies on the effective and efficient performance of support activities, the cost of which cannot be directly attributed to individual activities.
These costs are funded from the ISC rate that is levied on contributions and submitted
annually to the Board for approval through the management plan.
233. For 2018, the standard ISC rate was reduced from 7 percent to 6.5 percent.22
234. A method for deriving the standard ISC rate was established in 200623 and the derived rate
for 2019 has been calculated as shown in table IV.15.
TABLE IV.15: ISC CALCULATION (%)
2017 baseline 6.34
Increase for higher indirect expenditures for 2019 0.97
Decrease for higher funding forecast (1.12)
Decrease for higher PSAEA balance (0.48)
Derived ISC rate for 2019 5.71
235. Although analysis indicates an ISC rate of 5.71 percent, the Secretariat recommends that the
current 6.5 percent rate be maintained for 2019. ISC rates in other United Nations entities
and the sustainability of WFP’s higher funding forecasts also suggest that the ISC rate be
maintained at 6.5 percent for a further year while better cost insights are gained
during 2019.
Additional ISC rates
236. Since 2017, the Secretariat has been reviewing the full cost recovery principle and the
application of ISC rates, including in light of the practices followed in other United Nations
entities. Proposals have been considered in separate documentation and are
summarized below:
i) Reduced ISC rate for host governments’ contributions to programmes in their
own countries
237. Host government contributions, which are negotiated and managed at the country office
level, have hitherto been managed principally through trust fund arrangements. Under such
extra-budgetary arrangements, a lower level of ISC can be applied — while still meeting
full cost recovery — because of the lower level of support costs incurred by host
government contributions.
238. Within the IRM framework, the funding of all country-level activities is to be accounted for
as contributions or service provision within the country portfolio budget, including
contributions from host governments. These contributions, being part of
a budgetary regime rather than extra-budgetary, should be subject to the corporate
ISC rate.
22 WFP/EB.2/2017/5-A/1/Rev.1.
23 WFP/EB.A/2006/6-C/1.

WFP/EB.2/2018/6-A/1 62
239. Noting that such contributions require reduced support from headquarters and
regional bureaux, the Secretariat is proposing that a separate corporate rate be approved
for host governments’ contributions and contributions from donors that are eligible to receive support in meeting full cost recovery.24 A rate of 4 percent is proposed for 2019.
ii) Reduced ISC rate for contributions made by developing countries or countries with
economies in transition
240. This proposal is aligned with General Regulation XIII.2, with the criteria for eligibility having
been expanded by the Executive Board in the 2004 strategy New partnerships to meet rising needs expanding the WFP donor base .25 The proposal would help to encourage
additional contributions to WFP. These countries are not host government countries.
Because the actual cost of managing and administering such contributions would be similar
to that for regular contributions, such contributions would not achieve full cost recovery
with the proposed reduced ISC rate that would be applied. Therefore, the reduced rate will
be approved through the inclusion of a new clause in General Rule XIII.4 (e), allowing
an exception to full cost recovery in General Rule XIII.4, and through the approval of
a separate ISC rate in the management plan.
The PSAEA and critical corporate initiatives
241. In 2015, the Board endorsed the use of the PSAEA for critical corporate initiatives,26 which
enable WFP to invest in sustainable initiatives that require non-recurring investment and
improve the delivery of services to beneficiaries.
242. In light of the requirements and the healthy PSAEA balance projected for the beginning
of 2019, the Secretariat is proposing to invest in a number of critical corporate initiatives
totalling USD 69.3 million. Table IV.16 shows the projections for the PSAEA in 2019, with the
projected closing balance of USD 191.5 million equivalent to 6.0 months of PSA expenditure.
TABLE IV.16: PSAEA PROJECTIONS FOR 2019 (USD million)
PSAEA balance at 1 January 2019 236.9
Estimated ISC income 2019 (based on projected income
of USD 6.8 billion) 409.0
Proposed PSA budget (385.1)
Proposed 2019 critical corporate initiatives (69.3)
Projected PSAEA balance at 31 December 2019 191.5
PSAEA target (equivalent to 5 months of PSA expenditures) 160.5
Excess over target PSAEA balance 31.0
24 WFP/EB.3/2004/4-C. Countries eligible for assistance in meeting full cost recovery will be least-developed countries,
low-income and lower-middle-income countries defined by the Development Assistance Committee of the Organisation for
Economic Co-operation and Development.
25 WFP/EB.3/2004/4-C.
26 WFP/EB.A/2015/6-C/1. The criteria are that a proposal must be one-off; not covered by the regular PSA budget;
not related to a project; in need of predictable funding; unlikely to generate sufficient additional investment from donors;
and focused on organizational change.
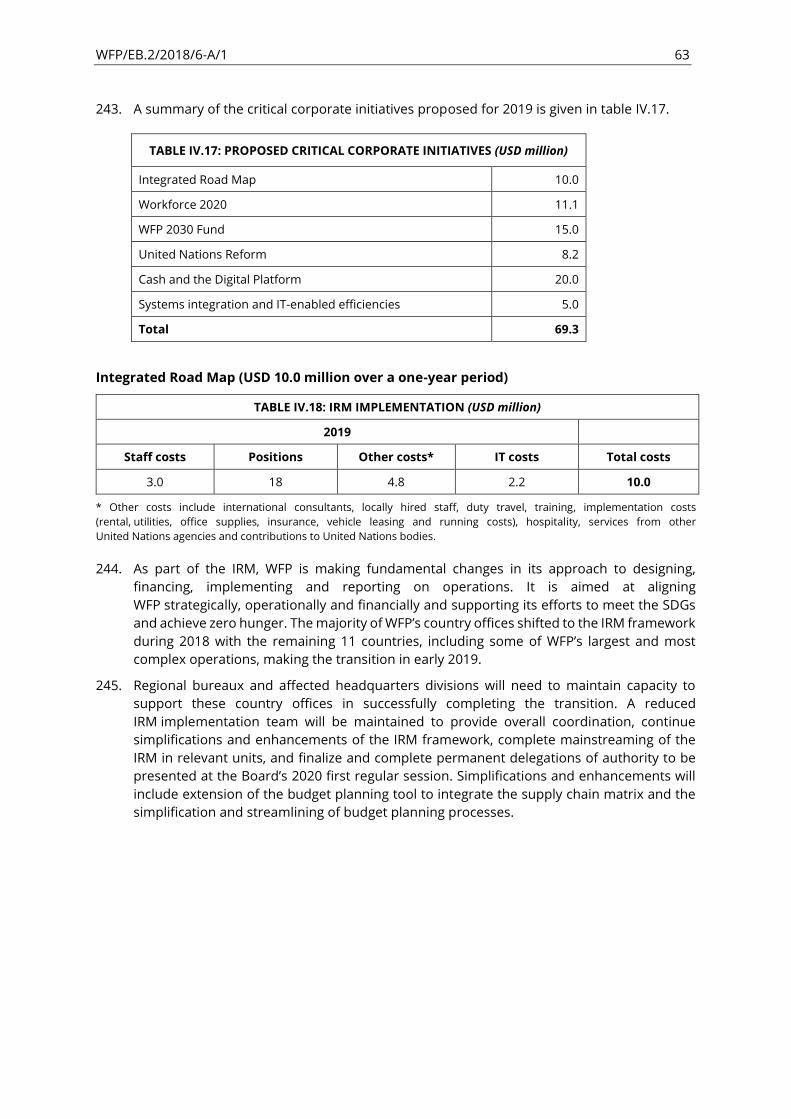
WFP/EB.2/2018/6-A/1 63
243. A summary of the critical corporate initiatives proposed for 2019 is given in table IV.17.
TABLE IV.17: PROPOSED CRITICAL CORPORATE INITIATIVES (USD million)
Integrated Road Map 10.0
Workforce 2020 11.1
WFP 2030 Fund 15.0
United Nations Reform 8.2
Cash and the Digital Platform 20.0
Systems integration and IT-enabled efficiencies 5.0
Total 69.3
Integrated Road Map (USD 10.0 million over a one-year period)
TABLE IV.18: IRM IMPLEMENTATION (USD million)
2019
Staff costs Positions Other costs* IT costs Total costs
3.0 18 4.8 2.2 10.0
* Other costs include international consultants, locally hired staff, duty travel, training, implementation costs
(rental, utilities, office supplies, insurance, vehicle leasing and running costs), hospitality, services from other
United Nations agencies and contributions to United Nations bodies.
244. As part of the IRM, WFP is making fundamental changes in its approach to designing,
financing, implementing and reporting on operations. It is aimed at aligning
WFP strategically, operationally and financially and supporting its efforts to meet the SDGs
and achieve zero hunger. The majority of WFP’s country offices shifted to the IRM framework during 2018 with the remaining 11 countries, including some of WFP’s largest and most complex operations, making the transition in early 2019.
245. Regional bureaux and affected headquarters divisions will need to maintain capacity to
support these country offices in successfully completing the transition. A reduced
IRM implementation team will be maintained to provide overall coordination, continue
simplifications and enhancements of the IRM framework, complete mainstreaming of the
IRM in relevant units, and finalize and complete permanent delegations of authority to be
presented at the Board’s 2020 first regular session. Simplifications and enhancements will include extension of the budget planning tool to integrate the supply chain matrix and the
simplification and streamlining of budget planning processes.
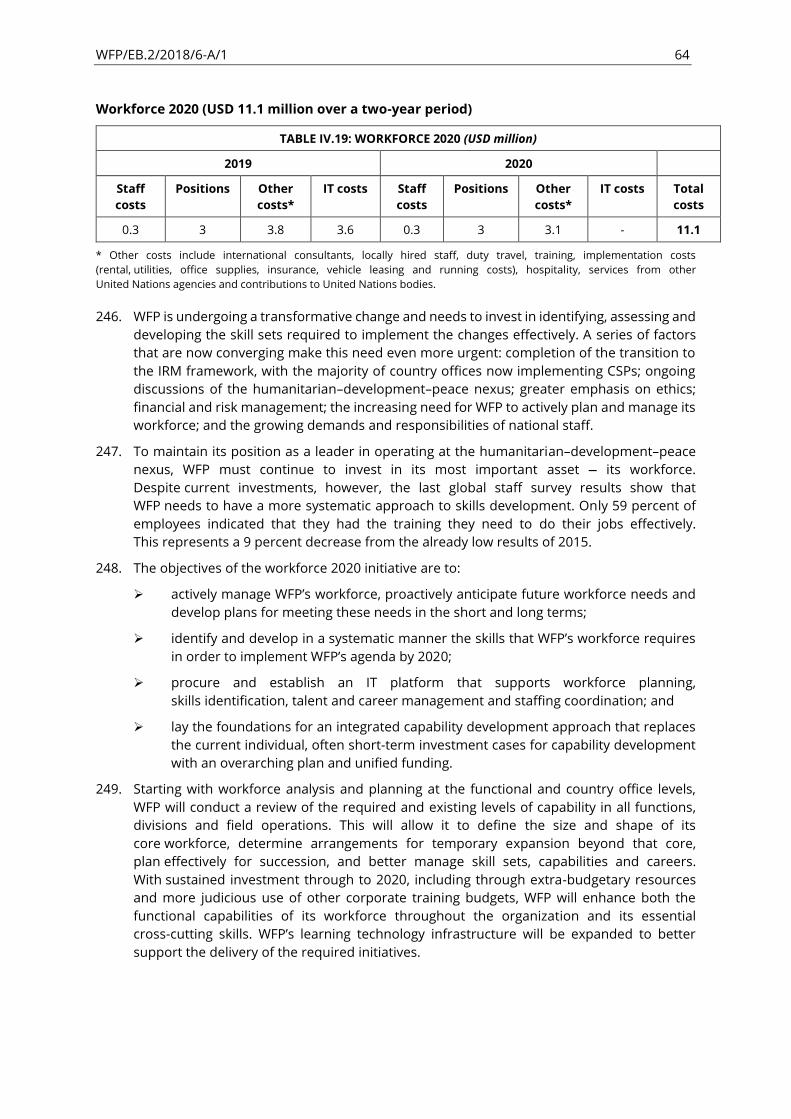
WFP/EB.2/2018/6-A/1 64
Workforce 2020 (USD 11.1 million over a two-year period)
TABLE IV.19: WORKFORCE 2020 (USD million)
2019 2020
Staff
costs
Positions Other
costs*
IT costs Staff
costs
Positions Other
costs*
IT costs Total
costs
0.3 3 3.8 3.6 0.3 3 3.1 - 11.1
* Other costs include international consultants, locally hired staff, duty travel, training, implementation costs
(rental, utilities, office supplies, insurance, vehicle leasing and running costs), hospitality, services from other
United Nations agencies and contributions to United Nations bodies.
246. WFP is undergoing a transformative change and needs to invest in identifying, assessing and
developing the skill sets required to implement the changes effectively. A series of factors
that are now converging make this need even more urgent: completion of the transition to
the IRM framework, with the majority of country offices now implementing CSPs; ongoing
discussions of the humanitarian development peace nexus; greater emphasis on ethics;
financial and risk management; the increasing need for WFP to actively plan and manage its
workforce; and the growing demands and responsibilities of national staff.
247. To maintain its position as a leader in operating at the humanitarian development peace
nexus, WFP must continue to invest in its most important asset — its workforce.
Despite current investments, however, the last global staff survey results show that
WFP needs to have a more systematic approach to skills development. Only 59 percent of
employees indicated that they had the training they need to do their jobs effectively.
This represents a 9 percent decrease from the already low results of 2015.
248. The objectives of the workforce 2020 initiative are to:
➢ actively manage WFP’s workforce, proactively anticipate future workforce needs and
develop plans for meeting these needs in the short and long terms;
➢ identify and develop in a systematic manner the skills that WFP’s workforce requires in order to implement WFP’s agenda by 2020;
➢ procure and establish an IT platform that supports workforce planning,
skills identification, talent and career management and staffing coordination; and
➢ lay the foundations for an integrated capability development approach that replaces
the current individual, often short-term investment cases for capability development
with an overarching plan and unified funding.
249. Starting with workforce analysis and planning at the functional and country office levels,
WFP will conduct a review of the required and existing levels of capability in all functions,
divisions and field operations. This will allow it to define the size and shape of its
core workforce, determine arrangements for temporary expansion beyond that core,
plan effectively for succession, and better manage skill sets, capabilities and careers.
With sustained investment through to 2020, including through extra-budgetary resources
and more judicious use of other corporate training budgets, WFP will enhance both the
functional capabilities of its workforce throughout the organization and its essential
cross-cutting skills. WFP’s learning technology infrastructure will be expanded to better support the delivery of the required initiatives.
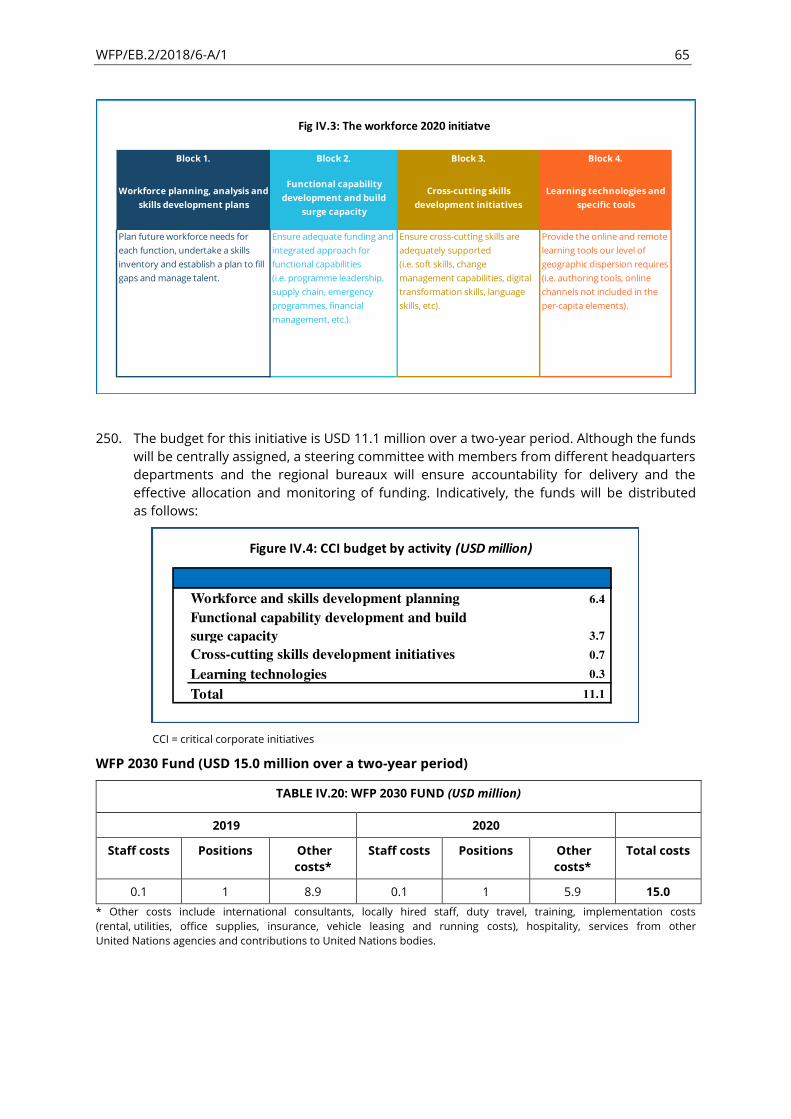
WFP/EB.2/2018/6-A/1 65
250. The budget for this initiative is USD 11.1 million over a two-year period. Although the funds
will be centrally assigned, a steering committee with members from different headquarters
departments and the regional bureaux will ensure accountability for delivery and the
effective allocation and monitoring of funding. Indicatively, the funds will be distributed
as follows:
CCI = critical corporate initiatives
WFP 2030 Fund (USD 15.0 million over a two-year period)
TABLE IV.20: WFP 2030 FUND (USD million)
2019 2020
Staff costs Positions Other
costs*
Staff costs Positions Other
costs*
Total costs
0.1 1 8.9 0.1 1 5.9 15.0
* Other costs include international consultants, locally hired staff, duty travel, training, implementation costs
(rental, utilities, office supplies, insurance, vehicle leasing and running costs), hospitality, services from other
United Nations agencies and contributions to United Nations bodies.
Block 1. Block 2. Block 3. Block 4.
Workforce planning, analysis and
skills development plans
Functional capability
development and build
surge capacity
Cross-cutting skills
development initiatives
Learning technologies and
specific tools
Plan future workforce needs for
each function, undertake a skills
inventory and establish a plan to fill
gaps and manage talent.
Ensure adequate funding and
integrated approach for
functional capabilities
(i.e. programme leadership,
supply chain, emergency
programmes, financial
management, etc.).
Ensure cross-cutting skills are
adequately supported
(i.e. soft skills, change
management capabilities, digital
transformation skills, language
skills, etc).
Provide the online and remote
learning tools our level of
geographic dispersion requires
(i.e. authoring tools, online
channels not included in the
per-capita elements).
Fig IV.3: The workforce 2020 initiatve
Workforce and skills development planning 6.4
Functional capability development and build
surge capacity 3.7
Cross-cutting skills development initiatives 0.7
Learning technologies 0.3
Total 11.1
Figure IV.4: CCI budget by activity (USD million)
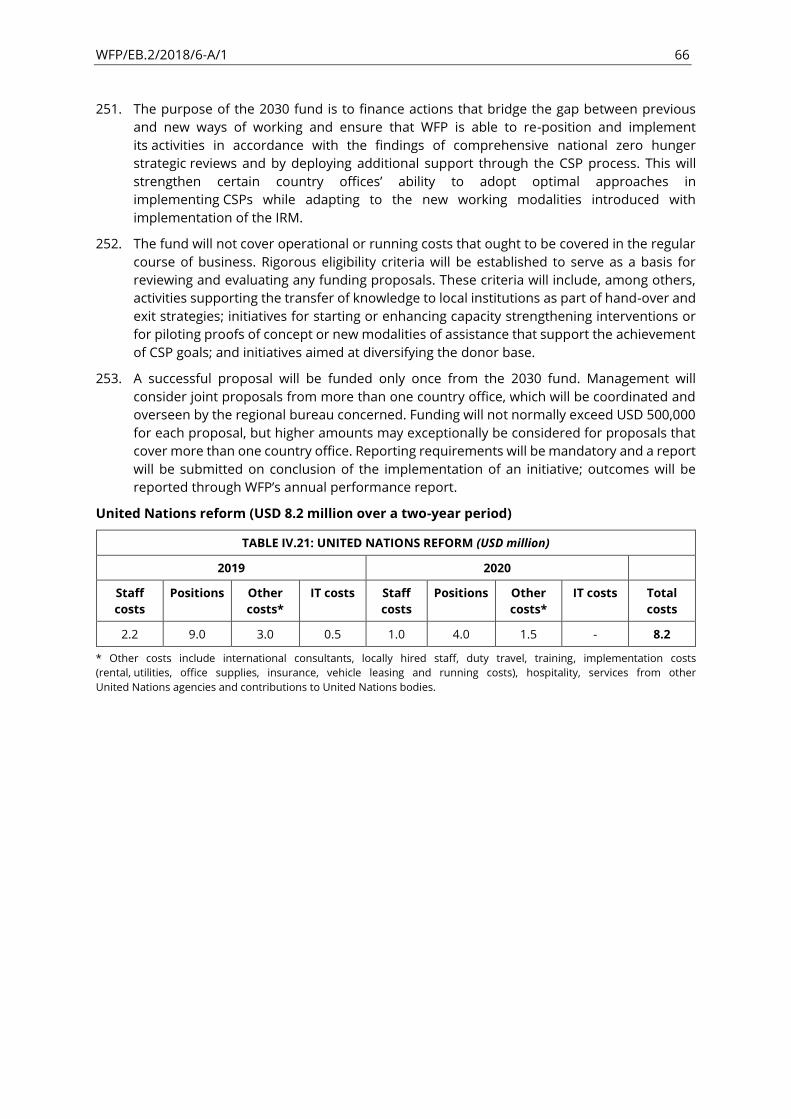
WFP/EB.2/2018/6-A/1 66
251. The purpose of the 2030 fund is to finance actions that bridge the gap between previous
and new ways of working and ensure that WFP is able to re-position and implement
its activities in accordance with the findings of comprehensive national zero hunger
strategic reviews and by deploying additional support through the CSP process. This will
strengthen certain country offices’ ability to adopt optimal approaches in
implementing CSPs while adapting to the new working modalities introduced with
implementation of the IRM.
252. The fund will not cover operational or running costs that ought to be covered in the regular
course of business. Rigorous eligibility criteria will be established to serve as a basis for
reviewing and evaluating any funding proposals. These criteria will include, among others,
activities supporting the transfer of knowledge to local institutions as part of hand-over and
exit strategies; initiatives for starting or enhancing capacity strengthening interventions or
for piloting proofs of concept or new modalities of assistance that support the achievement
of CSP goals; and initiatives aimed at diversifying the donor base.
253. A successful proposal will be funded only once from the 2030 fund. Management will
consider joint proposals from more than one country office, which will be coordinated and
overseen by the regional bureau concerned. Funding will not normally exceed USD 500,000
for each proposal, but higher amounts may exceptionally be considered for proposals that
cover more than one country office. Reporting requirements will be mandatory and a report
will be submitted on conclusion of the implementation of an initiative; outcomes will be
reported through WFP’s annual performance report.
United Nations reform (USD 8.2 million over a two-year period)
TABLE IV.21: UNITED NATIONS REFORM (USD million)
2019 2020
Staff
costs
Positions Other
costs*
IT costs Staff
costs
Positions Other
costs*
IT costs Total
costs
2.2 9.0 3.0 0.5 1.0 4.0 1.5 - 8.2
* Other costs include international consultants, locally hired staff, duty travel, training, implementation costs
(rental, utilities, office supplies, insurance, vehicle leasing and running costs), hospitality, services from other
United Nations agencies and contributions to United Nations bodies.
WFP/EB.2/2018/6-A/1 67
254. An initial budget of USD 8.2 million is required in 2019 and 2020 for WFP’s investment in the
changes proposed for the reform of the United Nations development system. In 2019, these
investments will be focused on the design and piloting of the first phase of the sizeable
efforts required, with implementation and rollout of piloted activities and systems starting
in 2019 and continuing throughout 2020 and beyond. This initial budget estimate may need
to be revisited as the direction of reform becomes clearer, following an initial scoping phase
in late 2018.
255. A Member States’ resolution27 on the United Nations development system reform adopted
on 31 May 2018 proposed a series of reforms that include the adoption of common
back-office (or enabling) services28 and common premises.29 The United Nations is initiating
a transition period during which the specifics of how these reforms are to be implemented
will be outlined. Implementation is expected to commence from January 2019.
Overall objectives
256. This critical corporate initiative, over an initial two-year period from 2019 to 2020, will ensure
that WFP has the capacity to support the Secretary-General’s efforts to prepare for and implement reform of the United Nations development system. It will be focused in particular
on WFP’s role in co-leading, with UNHCR,30 the transformation of business operations aimed
at establishing common business (enabling) services, where larger agencies will make
available common business services to the 34 entities in the United Nations
development system. This will be done in a number of ways, including through the
expansion of an improved business operations strategy31 at the country level and its
adoption by all United Nations country teams; and achieving the target of turning 50 percent
of the United Nations’ 2,900 premises worldwide into common premises. These efforts are
aimed at facilitating greater collaboration among agencies throughout the United Nations
development system with a view to achieving joint results, improved service quality and
cost efficiencies. In carrying them out, WFP will aim to do the following:
➢ Provide informed, effective and timely whole-of-WFP inputs into inter-agency
reform efforts during the transition and implementation periods, ensuring that it has
the capacity to support effectively its internal efforts to prepare for and respond to
reform requirements through the provision of information and support
for coordination.
27 General Assembly of the United Nations. 2018. Repositioning of the United Nations development system in the context of the
quadrennial comprehensive policy review of operational activities for development of the United Nations system. Resolution A/72/L.52,
May 2018. https://undocs.org/A/72/L.52
28 The business operations strategies (BOS) of the United Nations Development Group refers to back-office functions or enabling
services such as procurement; information and communications technology (ICT); human resources (HR); logistics; finance; and facility
services including common premises. Enabling services facilitate or enable the delivery of programme services, while common enabling
services are those that serve more than the organization that provides them and are offered for the use of others.
https://undg.org/business-operations/
29 The adoption of common premises includes establishing common back offices for all United Nations country teams by 2022;
ensuring that all United Nations country teams are utilizing an improved business operations strategy by 2021; and increasing
the proportion of United Nations common premises to 50 percent by 2021 of 2,931 United Nations premises worldwide,
469 (16 percent) are currently common premises.
30 The WFP Executive Director and the United Nations High Commissioner for Refugees co-lead the business innovations strategic
results group.
31 The business operations strategies (BOS) of the United Nations Development Group refer to back-office functions
or enabling services. https://undg.org/business-operations/.
WFP/EB.2/2018/6-A/1 68
➢ Provide leadership in the development of common enabling services and common
premises aimed at facilitating system-wide improved services and associated
cost savings. Efforts will include the design, piloting and rollout of global shared
service provision among agencies in the United Nations development system,
an improved business operations strategy for the country level and,
the establishment of common premises. In the spirit of the United Nations reform,
a core aspect of this work will be making available to the United Nations development
system certain WFP enabling services that are well established and in which WFP has
a comparative advantage.
➢ Contribute to development of the necessary processes, tools and platforms that will
ensure that the United Nations development system is able to gather and report on
system-wide collective results towards achievement of the SDGs. This will entail
building processes and systems that enable the United Nations to gather, analyse and
report on collective results at the country and global levels.
Key activities for fund use
257. WFP will provide additional coordination and facilitate two-way information exchange
through its New York Office as the main interface with United Nations development system
reform efforts. The aim is to ensure that WFP management and other major stakeholders
are kept fully updated on developments during the transition and implementation periods
and, to inform associated decision making in order to enable WFP’s implementation of the reforms. It is envisaged that this activity will involve the deployment of one senior and
two junior consultants supporting the New York Office.
258. WFP is planning also to contribute a staff member at P5 level as surge capacity for the
United Nations development system reform transition team based in New York.
The inter-agency transition team, which will be based in the United Nations Secretariat, is in
the process of being formed and the United Nations Secretariat is relying on United Nations
agencies to second staff to it. With some agencies having already seconded staff to the team,
WFP is planning to do likewise. The transition team, which is expected to be in place for
two years, will oversee the preparation of implementation plans for core areas of the
reform, including among others the reinvigorated resident coordinator system, adaptation
of the United Nations development assistance framework (UNDAF) to the needs of the
reform, and the strengthening of data collection and reporting mechanisms at the
United Nations system level.
259. Through its co-leadership of the Business Innovations Strategic Results Group, WFP plans to
contribute to the achievement of the vision of the Secretary-General and Member States32
by increasing value for money in the United Nations system through transformational
change in the management and consolidation of business operations and
common premises. This will be spearheaded by a full-time inter-agency project team that
will be established to undertake a diagnosis of how best to prepare for, design and
implement approaches and models for more consolidated business operations and
common premises. The team will work towards the overall objectives laid out for the
business innovations group, which include:
32 This includes establishing common back offices for all United Nations country teams (UNCTs) by 2022; all UNCTs utilizing an improved
business operations strategy by 2021; and increasing the proportion of United Nations common premises to 50 percent by 2021 —of 2,931 United Nations premises worldwide, 469 (16 percent) are currently common premises.
WFP/EB.2/2018/6-A/1 69
i) devising a strategy for establishing common back offices for all United Nations
country teams by 2022, overseeing a diagnosis and design phase for this work and
launching pilots for testing designs and informing implementation;
ii) supporting United Nations country teams with a view to ensuring that they are
benefiting from an improved business operations strategy by 2021; and
iii) raising to 50 percent the share of United Nations premises that are common premises
by 2021.
260. The team will require additional surge capacity for data analysis and in specific
functional areas so that it can provide advice on approaches and legal considerations that
will inform evidence-based decision making and the design and piloting of actions for
ensuring progress. Specifically, WFP will fund a team lead position at D2 level for overseeing
these ambitious efforts and will contribute an additional staff member (P3) to work
alongside team members seconded from other agencies. An initial investment of
USD 1 million has been proposed for supporting the development of country-level capacity
for piloting the approaches identified.
261. WFP will also dedicate a P4 staff member to supporting its own internal efforts in this area.
The staff member will work closely with an internal cross-divisional coordination group,
which has been set up in WFP to coordinate the engagement of all the divisions that provide
enabling services. Both the inter-agency efforts and those of WFP alone will be supported
by additional capacity in WFP’s innovations and change management team (INC) of
five consultants, increasing to six in 2020. The team will support analysis of the business
operations strategy and preparation of an improved strategy for the country level, which
will then be piloted and rolled out, including through relevant training. Internal efforts will
include an analysis of the services that WFP would seek to offer to and receive from the
wider United Nations system. Additional legal capacity of two people will be made available
in order to support the mutual recognition33 of policies and procedures among
United Nations entities as an enabler for the establishment of common business operations
and common premises.
262. WFP will also require additional capacity and investment in order to expand services that it
can make available to the United Nations development system, and to shift to using
common premises and other common services from the system. This will include
investments in proofs of concept for specific services that are well established within WFP,
in which WFP has a comparative advantage and that WFP can therefore make available to
the wider United Nations system. These services include:
i) management services such as travel and accommodation; global vehicle leasing;
surge capacity in engineering and infrastructure development and maintenance
in emergencies, which builds on WFP’s experiences from the Ebola, Yemen cholera
and Myanmar responses; and green energy solutions for United Nations premises
and beyond. Initially, four staff members and a consultant will be deployed to work
full-time on leading the development of proofs of concept for and piloting of
these services;
33 Mutual recognition is a principle that allows agencies to use each other’s policies, processes and tools without having to carry out additional due diligence in order to prove competitiveness, legal contracting or external auditing. It can enable
deeper collaboration and integration, such as on the business operations strategy, and capacity consolidation, such as on
shared service centres.

WFP/EB.2/2018/6-A/1 70
ii) developing a proof of concept for the global end-to-end supply chain beyond
emergency settings, building on WFP’s expertise in leading the logistics cluster; and
iii) developing front-end business-to-business and customer-to-business digital platforms for common enabling services — such as the United Nations
Humanitarian Air Service, accommodation services and the United Nations
Humanitarian Response Depot through the cloud.
Cash and the digital platform (USD 20.0 million over a two-year period)
TABLE IV.22: CASH AND THE DIGITAL PLATFORM (USD million)
2019 2020
Staff costs Positions Other
costs*
Staff costs Positions Other
costs*
Total costs
3.8 22 9.4 2.7 16 4.1 20.0
* Other costs include international consultants, locally hired staff, duty travel, training, implementation costs
(rental, utilities, office supplies, insurance, vehicle leasing and running costs), hospitality, services from other
United Nations agencies and contributions to United Nations bodies.
263. Technology and connectivity are rapidly reaching some of the most vulnerable people and
places affected by crisis. They are also enablers for improving and expanding the services
provided in response to crises. As one of the main humanitarian actors, WFP has the
opportunity and the obligation to leverage data and technology in order to enhance its
knowledge of and service to people in need by digitally transforming the way in which
it works. Pursuit of this objective has led to the development of a plan aimed at establishing,
integrating and mainstreaming, in the next two years, the core elements of an end-to-end
digital business process. The investment will allow WFP to create a digital assistance
platform for serving beneficiaries better and more efficiently.
264. The intention is to develop a digital ecosystem that is supported by a flexible architecture,
enabling modular solutions and allowing interoperability among both internal and
external systems. The digital ecosystem will be formed from a combination of internally built
systems, off-the-shelf solutions and partnerships.
265. This investment will be critical for completing and testing core elements developed for
cash-based transfers and adapting and expanding them to create an enhanced platform for
providing digital assistance that enables more cost-efficient and cost-effective operations
and programmes irrespective of the transfer modalities used. The development of end-to-
end processes, systems and governance for cash-based transfers will lay the foundation for
facilitating their adaptation to other modalities.
266. Investments need to be made in both technology (development and support) and the ability
of operations staff and functions throughout WFP to use the digital platform.
Approximately 60 percent of this one-time two-year investment will be used to finance
systems development and associated support costs. The remaining 40 percent will be
dedicated to ensuring that operations and functions throughout WFP are able to use the
digital platform appropriately in order to achieve WFP’s planned programme outcomes.
267. The development and use of the platform will serve five objectives, many of which will
benefit all transfer modalities.
268. Security of beneficiary identity and information management. The objective is to secure
the privacy and protection of people and data and the operations processes for adequately
collecting, storing, making anonymous, purging, securing and appropriately sharing and
WFP/EB.2/2018/6-A/1 71
using information regarding individual households and communities. Secure systems
integration and data transmission that enables WFP to receive beneficiary identity data from
relevant partners such as governments, the International Organization for Migration and
UNHCR will also be developed where needed.
269. Improved programme design and delivery. The objective is to improve programme design
and quality, including cross-sector programming, enhance technical implementation skills
through staff capacity-building and address and mitigate risks. The work includes
cost efficiency and cost effectiveness analysis for better decision making and
programme design and implementation.
270. Transfer delivery. The objective is to continue developing digital transfers of benefits
(e-vouchers, mobile wallets and mobile money) and the digital management of cash,
voucher and in-kind transfers by enhancing payment and distribution planning,
payment and distribution instructions to financial service providers and cooperating
partners, and digital, real-time redemption of benefit entitlements. WFP will assess financial
service providers and prioritize those that are able to provide more financially inclusive
services for beneficiaries.
271. Increased assurances, safeguards and risk management. The objective is to facilitate
the development and use of a robust assurance framework that uses performance and
risk management tools at critical stages in WFP’s programme implementation process —beneficiary verification, distribution reconciliations, vendor management, analysis of
transaction anomalies, post-distribution monitoring, beneficiary complaints and feedback
and whistle-blower mechanisms, and second-level data analytics.
272. Centralized data analytics and insights. The objective is to support country offices through
cross-functional analysis and expertise in functions such as programme, supply chain and
finance, for reviewing the efficiency and effectiveness of and the risks and trends
in programmes.
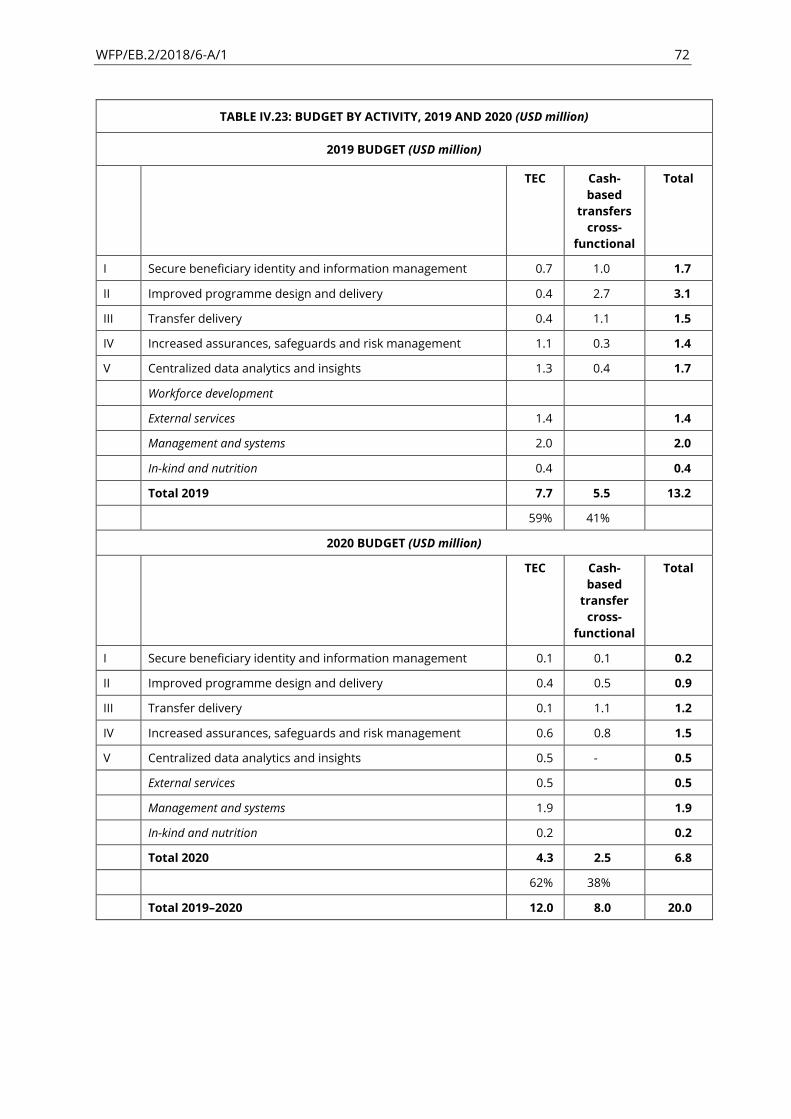
WFP/EB.2/2018/6-A/1 72
TABLE IV.23: BUDGET BY ACTIVITY, 2019 AND 2020 (USD million)
2019 BUDGET (USD million)
TEC Cash-
based
transfers
cross-
functional
Total
I Secure beneficiary identity and information management 0.7 1.0 1.7
II Improved programme design and delivery 0.4 2.7 3.1
III Transfer delivery 0.4 1.1 1.5
IV Increased assurances, safeguards and risk management 1.1 0.3 1.4
V Centralized data analytics and insights 1.3 0.4 1.7
Workforce development
External services 1.4 1.4
Management and systems 2.0 2.0
In-kind and nutrition 0.4 0.4
Total 2019 7.7 5.5 13.2
59% 41%
2020 BUDGET (USD million)
TEC Cash-
based
transfer
cross-
functional
Total
I Secure beneficiary identity and information management 0.1 0.1 0.2
II Improved programme design and delivery 0.4 0.5 0.9
III Transfer delivery 0.1 1.1 1.2
IV Increased assurances, safeguards and risk management 0.6 0.8 1.5
V Centralized data analytics and insights 0.5 - 0.5
External services 0.5 0.5
Management and systems 1.9 1.9
In-kind and nutrition 0.2 0.2
Total 2020 4.3 2.5 6.8
62% 38%
Total 2019 2020 12.0 8.0 20.0
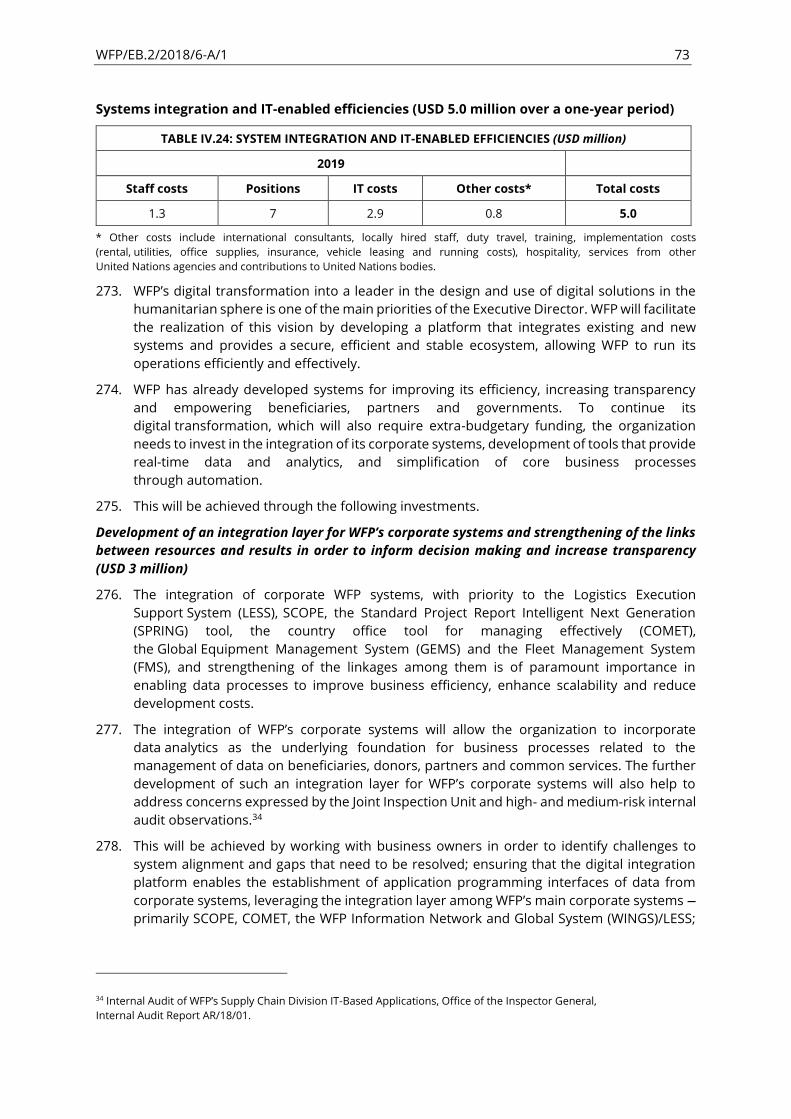
WFP/EB.2/2018/6-A/1 73
Systems integration and IT-enabled efficiencies (USD 5.0 million over a one-year period)
TABLE IV.24: SYSTEM INTEGRATION AND IT-ENABLED EFFICIENCIES (USD million)
2019
Staff costs Positions IT costs Other costs* Total costs
1.3 7 2.9 0.8 5.0
* Other costs include international consultants, locally hired staff, duty travel, training, implementation costs
(rental, utilities, office supplies, insurance, vehicle leasing and running costs), hospitality, services from other
United Nations agencies and contributions to United Nations bodies.
273. WFP’s digital transformation into a leader in the design and use of digital solutions in the
humanitarian sphere is one of the main priorities of the Executive Director. WFP will facilitate
the realization of this vision by developing a platform that integrates existing and new
systems and provides a secure, efficient and stable ecosystem, allowing WFP to run its
operations efficiently and effectively.
274. WFP has already developed systems for improving its efficiency, increasing transparency
and empowering beneficiaries, partners and governments. To continue its
digital transformation, which will also require extra-budgetary funding, the organization
needs to invest in the integration of its corporate systems, development of tools that provide
real-time data and analytics, and simplification of core business processes
through automation.
275. This will be achieved through the following investments.
Development of an integration layer for WFP’s corporate systems and strengthening of the links between resources and results in order to inform decision making and increase transparency
(USD 3 million)
276. The integration of corporate WFP systems, with priority to the Logistics Execution
Support System (LESS), SCOPE, the Standard Project Report Intelligent Next Generation
(SPRING) tool, the country office tool for managing effectively (COMET),
the Global Equipment Management System (GEMS) and the Fleet Management System
(FMS), and strengthening of the linkages among them is of paramount importance in
enabling data processes to improve business efficiency, enhance scalability and reduce
development costs.
277. The integration of WFP’s corporate systems will allow the organization to incorporate
data analytics as the underlying foundation for business processes related to the
management of data on beneficiaries, donors, partners and common services. The further
development of such an integration layer for WFP’s corporate systems will also help to address concerns expressed by the Joint Inspection Unit and high- and medium-risk internal
audit observations.34
278. This will be achieved by working with business owners in order to identify challenges to
system alignment and gaps that need to be resolved; ensuring that the digital integration
platform enables the establishment of application programming interfaces of data from
corporate systems, leveraging the integration layer among WFP’s main corporate systems —
primarily SCOPE, COMET, the WFP Information Network and Global System (WINGS)/LESS;
34 Internal Audit of WFP’s Supply Chain Division IT-Based Applications, Office of the Inspector General,
Internal Audit Report AR/18/01.

WFP/EB.2/2018/6-A/1 74
and scaling up support in response to the requests of more than 15 country offices and
five divisions for including new corporate data sources in the institutional data lake .
279. Another significant activity that will increase data visibility for Member States is
the Member State CSP Data Portal. WFP will continue to invest resources in updating the
portal through the expansion and inclusion of relevant programme, finance and
performance-related information and data from CSPs and interim CSPs.
280. Continued development of the WFP management dashboard will improve the presentation
of complex corporate data that are intended to provide management with essential
business intelligence, expressed graphically and based on meaningful key performance
indicators, in order to answer critical questions, align actions with corporate strategy and
goals and improve fact-based decision making. This may be facilitated through the
development of a mobile version of the dashboard using more than 15 additional indicators
in various business areas and leveraging the near real-time capture and display of data.
Continued simplification and automation of WFP’s core business processes (USD 2 million)
281. Development and rollout of IT-enabled initiatives that improve the efficiency of
WFP’s operations and support services is a business priority. With a number of
core processes already automated, WFP needs to continue driving operational efficiency by
automating and simplifying manual business processes in order to reduce paperwork that
does not add value and improve operational efficiencies.
282. The primary benefits of automating operations are reduced costs and
enhanced productivity, availability, reliability and performance. It also increases the
efficiency of a global digital workforce in areas that are historically transaction-heavy, such
as administration, human resources, finance and procurement.
283. To support this effort, WFP intends to roll out a global service management tool for business
support functions, automate data flows among systems in order to eliminate
manual entries, introduce 15 new automated forms in WFP Self-Service, and carry out a
feasibility assessment of process automation technologies for simplifying repetitive tasks.
284. Figure IV.5 shows details of the initiatives to be undertaken, their benefits and budgets.
Initiative Benefit Budget
Further development of an integration
layer for WFP’s corporate systemsEnhanced business efficiency, scalability,
and reduced development costs 1.2
Strengthening the linkages between
resources and results for improved
decision making
Ability to uncover insights from diverse and
complex large-scale data sets. Improved
decision making
0.8
Updates to the Member State CSP
Data Portal
Increased transparency and accountability
toward Member States 0.6
Continued development of a
dashboard for WFP management
Informed decision making and understanding
of complex corporate data 0.4
Development of roll-out of some
IT-enabled initiatives that will
improve the efficiency of WFP’s operations and support services
Increased operational efficiency, through
automation and simplification of manual
processes
2.0
5.0
Figure IV.5 - CCI budget by activity (USD million)
Total
WFP/EB.2/2018/6-A/1 75
Section V: Management performance measurement
Overview
285. The Corporate Results Framework (CRF) (revised 2018), WFP Strategic Plan (2017 2021),
Financial Framework Review and Policy on Country Strategic Plans promote the alignment
of resources with results as a principle that is key to ensuring transparency and
accountability in reporting on performance. In keeping with this principle, WFP considers
that management performance is ancillary to programme performance. Section IV provides
a description of appropriation lines, pillars and functional areas and explains that there are
no specific management results because the purpose of management functions is to
support programme implementation as defined in the country strategic plans (CSPs).35
Performance measurement
286. Management performance is measured in the functional areas described in section IV,
which enable the implementation of CSP activities. The functional areas provide the
foundation for determining the structure of country offices, regional bureaux and
headquarters and the necessary skills and competencies of employees.
Annual performance plans articulate the deliverables expected from and the resources
required in each functional area in order to support programme implementation.
The business processes that are carried out in each functional area in order to implement
programmes at the country level are the elements on which regional bureaux and
headquarters focus for oversight and accountability purposes.
287. Key performance indicators (KPIs) for measuring management performance are used in
work planning, monitoring and reporting. The KPIs in the revised CRF are the product of an
evolution in the metrics introduced in the WFP Management Plan (2018 2020), resulting in
a more complete and relevant set of KPIs aimed at improving the measurement of
management performance in supporting programme performance. Some KPIs are also
used as risk metrics where performance has implications for risk management. The KPIs are
organized according to three categories of accountability:
a) Category I KPIs reflect WFP’s corporate performance and measure management
performance that contributes to implementation of the WFP strategic plan through
the CSPs.
b) Category II KPIs have a more short-term perspective and review progress against
corporate priorities set by WFP’s leadership, multilateral arrangements and
externally governed commitments.
c) Category III KPIs and metrics measure performance in the management of daily
operations and business processes in the various functional areas.
Management key performance indicators
288. The management KPIs measure management’s support to programme implementation. These category I KPIs measure trends on an annual basis for the duration of the CRF. They
are compiled from the measurements of a selection of category III KPIs that are compulsory
35 This contrasts with the pre-2017 system of having two parallel and equally important results frameworks, one for
strategic results and one for management results.

WFP/EB.2/2018/6-A/1 76
in all country offices. The management KPIs facilitate the analysis of management
performance globally. The KPIs are as follows:
a) KPI 1: Overall progress in country strategic plan implementation
Measures how funding and operational constraints influence WFP’s implementation,
and the performance of the activities and strategic outcomes that are implemented
during the period being measured.
b) KPI 2: Effective emergency preparedness and response
Measures WFP’s performance against emergency preparedness and response
standards. This includes preparedness at the country and corporate levels, as well
as implementation of corporate responses to acute emergencies.
c) KPI 3: Overall achievement of management performance standards
Measures country office performance in each functional area in supporting the
implementation of CSPs. Aggregation of functional area permits a corporate analysis
of management processes.
TABLE V.1: MANAGEMENT KEY PERFORMANCE INDICATORS AND COMPONENTS
KPI 1: Overall progress in country strategic plan
implementation
Target to be determined36
Component indicators Baseline 2019 Target
% of outcomes with implementation - -
% of outcomes for which values were achieved or on track 68% 75%
% of outputs with implementation - -
% of outputs for which values were achieved or on track - 80%
KPI 2: Effective emergency preparedness and response 5 of 5 components reach targets
Preparedness
Component indicators Baseline 2019 Target
% of country offices that update or implement at least 80% of
minimum preparedness actions
- 100%
Number of training events in emergency response according to
functional and support training for emergency response (FASTER)
standard
2 4
Timeliness of the Immediate Response Preparedness facility 9 days 5 working days from
country office’s request to receipt of funds
36 Baselines and targets for new KPIs and for components for which historical data are not available will be determined
on the basis of 2018 data, which will be available in the second quarter of 2019 on completion of the annual performance
report, annual country reports and standard project reports. The 2018 annual performance report will be the first for
which sufficient country offices are reporting against the CSP model to allow the necessary analysis for setting baselines
and targets.
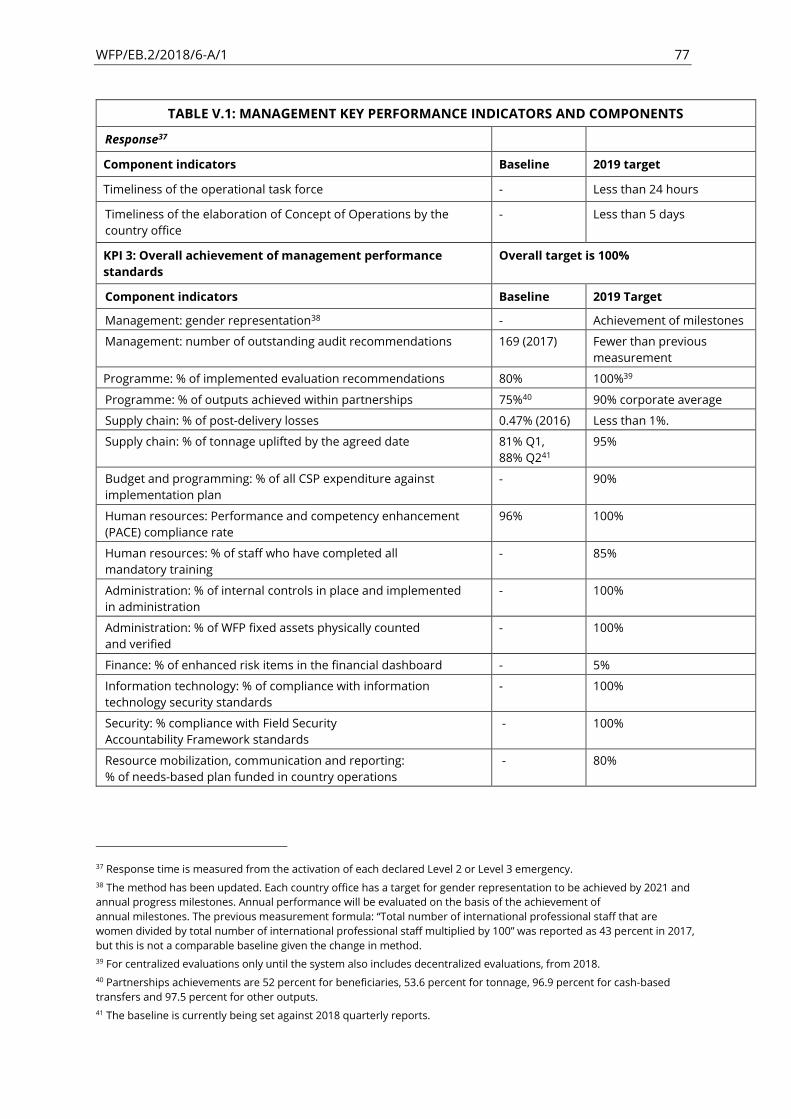
WFP/EB.2/2018/6-A/1 77
TABLE V.1: MANAGEMENT KEY PERFORMANCE INDICATORS AND COMPONENTS
Response37
Component indicators Baseline 2019 target
Timeliness of the operational task force - Less than 24 hours
Timeliness of the elaboration of Concept of Operations by the
country office
- Less than 5 days
KPI 3: Overall achievement of management performance
standards
Overall target is 100%
Component indicators Baseline 2019 Target
Management: gender representation38 - Achievement of milestones
Management: number of outstanding audit recommendations 169 (2017) Fewer than previous
measurement
Programme: % of implemented evaluation recommendations 80% 100%39
Programme: % of outputs achieved within partnerships 75%40 90% corporate average
Supply chain: % of post-delivery losses 0.47% (2016) Less than 1%.
Supply chain: % of tonnage uplifted by the agreed date 81% Q1,
88% Q241
95%
Budget and programming: % of all CSP expenditure against
implementation plan
- 90%
Human resources: Performance and competency enhancement
(PACE) compliance rate
96% 100%
Human resources: % of staff who have completed all
mandatory training
- 85%
Administration: % of internal controls in place and implemented
in administration
- 100%
Administration: % of WFP fixed assets physically counted
and verified
- 100%
Finance: % of enhanced risk items in the financial dashboard - 5%
Information technology: % of compliance with information
technology security standards
- 100%
Security: % compliance with Field Security
Accountability Framework standards
- 100%
Resource mobilization, communication and reporting:
% of needs-based plan funded in country operations
- 80%
37 Response time is measured from the activation of each declared Level 2 or Level 3 emergency.
38 The method has been updated. Each country office has a target for gender representation to be achieved by 2021 and
annual progress milestones. Annual performance will be evaluated on the basis of the achievement of
annual milestones. The previous measurement formula: Total number of international professional staff that are women divided by total number of international professional staff multiplied by 100 was reported as 43 percent in 2017,
but this is not a comparable baseline given the change in method.
39 For centralized evaluations only until the system also includes decentralized evaluations, from 2018.
40 Partnerships achievements are 52 percent for beneficiaries, 53.6 percent for tonnage, 96.9 percent for cash-based
transfers and 97.5 percent for other outputs.
41 The baseline is currently being set against 2018 quarterly reports.
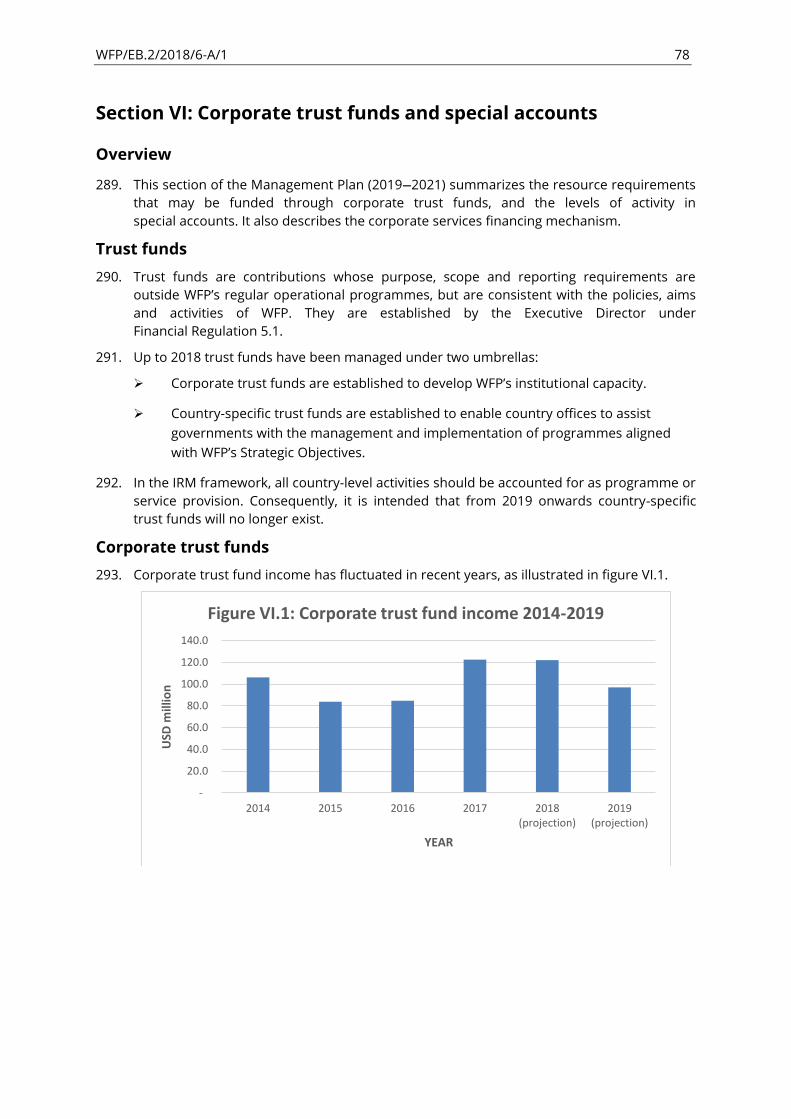
WFP/EB.2/2018/6-A/1 78
Section VI: Corporate trust funds and special accounts
Overview
289. This section of the Management Plan (2019—2021) summarizes the resource requirements
that may be funded through corporate trust funds, and the levels of activity in
special accounts. It also describes the corporate services financing mechanism.
Trust funds
290. Trust funds are contributions whose purpose, scope and reporting requirements are
outside WFP’s regular operational programmes, but are consistent with the policies, aims
and activities of WFP. They are established by the Executive Director under
Financial Regulation 5.1.
291. Up to 2018 trust funds have been managed under two umbrellas:
➢ Corporate trust funds are established to develop WFP’s institutional capacity.
➢ Country-specific trust funds are established to enable country offices to assist
governments with the management and implementation of programmes aligned
with WFP’s Strategic Objectives.
292. In the IRM framework, all country-level activities should be accounted for as programme or
service provision. Consequently, it is intended that from 2019 onwards country-specific
trust funds will no longer exist.
Corporate trust funds
293. Corporate trust fund income has fluctuated in recent years, as illustrated in figure VI.1.
-
20.0
40.0
60.0
80.0
100.0
120.0
140.0
2014 2015 2016 2017 2018
(projection)
2019
(projection)
US
D m
illi
on
YEAR
Figure VI.1: Corporate trust fund income 2014-2019
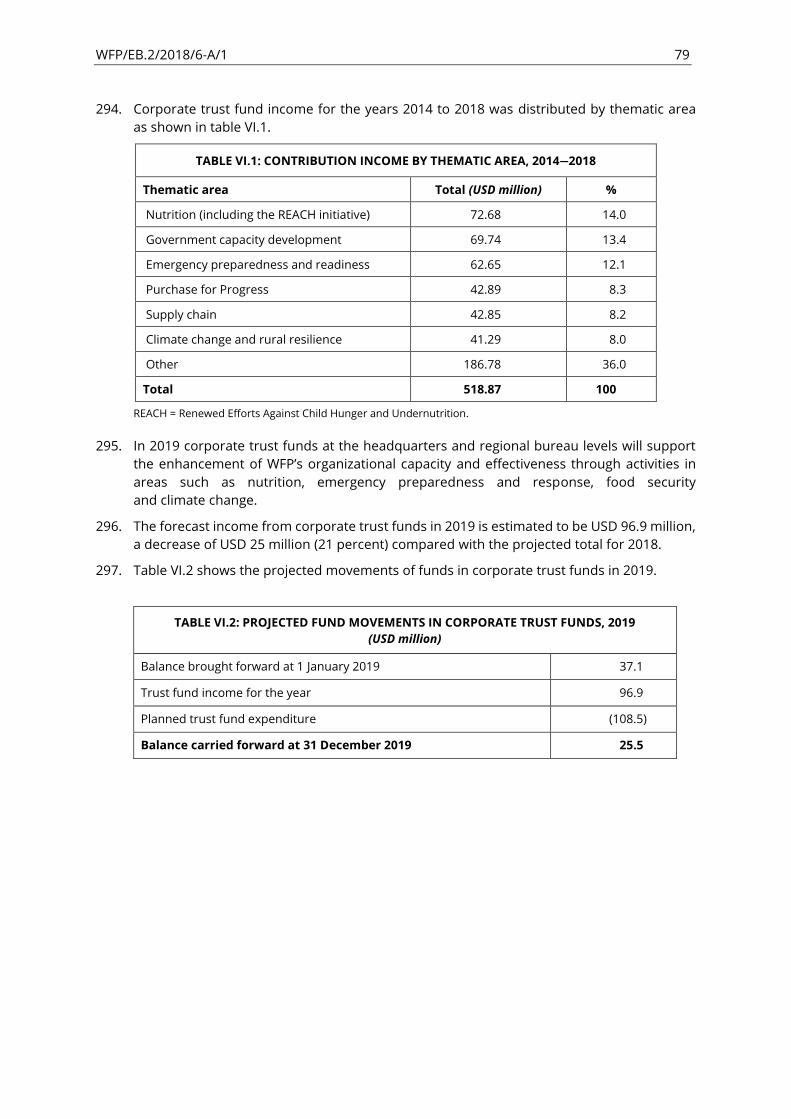
WFP/EB.2/2018/6-A/1 79
294. Corporate trust fund income for the years 2014 to 2018 was distributed by thematic area
as shown in table VI.1.
TABLE VI.1: CONTRIBUTION INCOME BY THEMATIC AREA, 2014—2018
Thematic area Total (USD million) %
Nutrition (including the REACH initiative) 72.68 14.0
Government capacity development 69.74 13.4
Emergency preparedness and readiness 62.65 12.1
Purchase for Progress 42.89 8.3
Supply chain 42.85 8.2
Climate change and rural resilience 41.29 8.0
Other 186.78 36.0
Total 518.87 100
REACH = Renewed Efforts Against Child Hunger and Undernutrition.
295. In 2019 corporate trust funds at the headquarters and regional bureau levels will support
the enhancement of WFP’s organizational capacity and effectiveness through activities in
areas such as nutrition, emergency preparedness and response, food security
and climate change.
296. The forecast income from corporate trust funds in 2019 is estimated to be USD 96.9 million,
a decrease of USD 25 million (21 percent) compared with the projected total for 2018.
297. Table VI.2 shows the projected movements of funds in corporate trust funds in 2019.
TABLE VI.2: PROJECTED FUND MOVEMENTS IN CORPORATE TRUST FUNDS, 2019
(USD million)
Balance brought forward at 1 January 2019 37.1
Trust fund income for the year 96.9
Planned trust fund expenditure (108.5)
Balance carried forward at 31 December 2019 25.5

WFP/EB.2/2018/6-A/1 80
298. Table VI.3 indicates the corporate trust funds income and expenditure figures for 2019,
by thematic area.
TABLE VI.3: CORPORATE TRUST FUNDS INCOME PROJECTION VERSUS
EXPENDITURE PLAN BY THEMATIC AREA, 2019
Thematic area Income projection Expenditure plan
Supply chain 17.7 23.0
Government capacity strengthening 7.6 15.2
Nutrition 11.4 12.7
Climate change and disaster risk reduction 11.1 10.8
Emergency preparedness and response 11.6 11.1
Other 37.5 35.7
Total 96.9 108.5
Corporate trust funds by thematic area
299. The following sub-sections describe a selection of trust funds in each of the thematic areas.
Supply chain
300. The food quality management system trust fund is used for the leveraging of top-level expertise
in order to assist WFP in enhancing food safety and quality throughout its operations by
improving the products in its supply chain (including packaging) and strengthening quality
management practices.
301. The Supply Optimization through Logistics, Visibility and Evolution (SOLVE) initiative supports the
Family Planning 202042 initiative in 17 countries and serves as a channel for
financial contributions to both global and country-level SOLVE activities which include
ensuring sustainable supplies of health commodities in the SOLVE project countries.
302. The logistics capacity building trust fund exists to support the deployment of standby partners
that increase WFP’s capacity to respond to emergencies. Standby partners provide
personnel and technical expertise that complement WFP’s internal staffing, deliver programmes and provide administrative support capacity in a cost-effective way and
in accordance with the requirements of WFP’s operations in the specific emergency region
or country.
303. The smallholder farmer purchasing initiative (Farm to Market Alliance) trust fund was
established with the main objective of supporting efforts to promote sustainable
pro-smallholder agricultural value chains. The initiative helps to secure sustainable and
commercially viable participation in markets by smallholder farmers through a demand-led
value chain maintained by a consortium of public and private sector partners.
42 Family Planning 2020 is a global initiative that supports the right of women and girls to decide, freely and for
themselves, whether and when to have children, and how many they want to have.
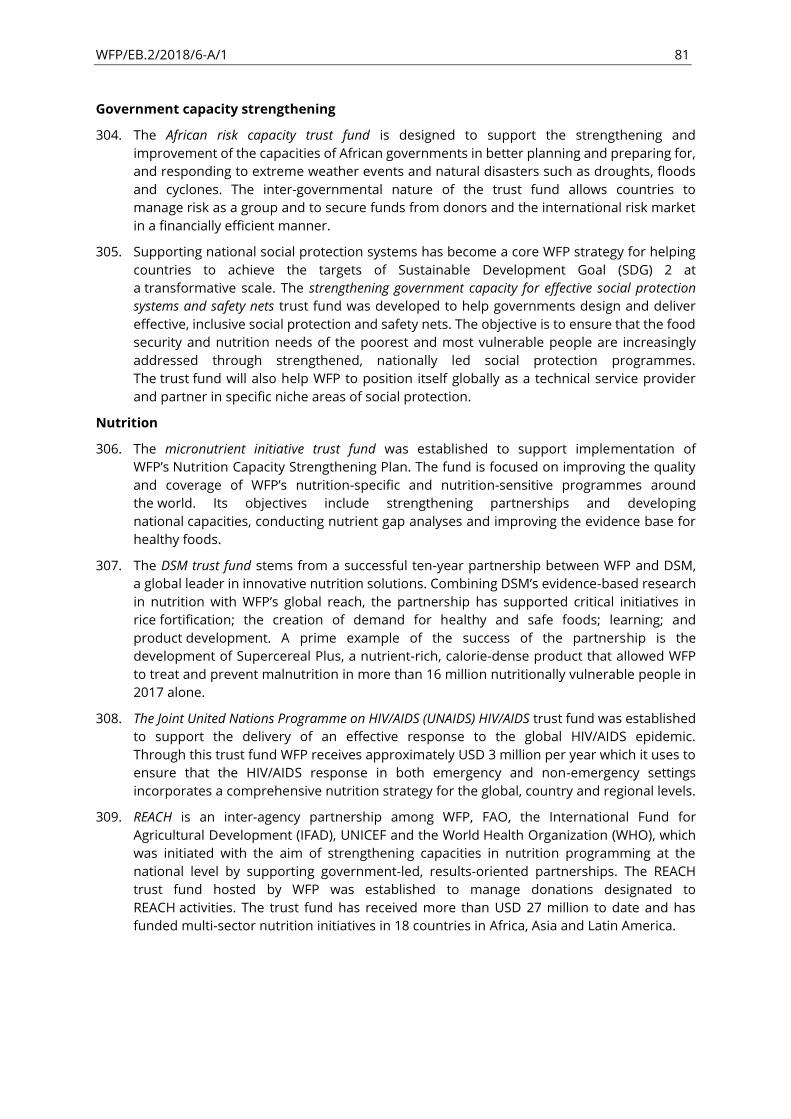
WFP/EB.2/2018/6-A/1 81
Government capacity strengthening
304. The African risk capacity trust fund is designed to support the strengthening and
improvement of the capacities of African governments in better planning and preparing for,
and responding to extreme weather events and natural disasters such as droughts, floods
and cyclones. The inter-governmental nature of the trust fund allows countries to
manage risk as a group and to secure funds from donors and the international risk market
in a financially efficient manner.
305. Supporting national social protection systems has become a core WFP strategy for helping
countries to achieve the targets of Sustainable Development Goal (SDG) 2 at
a transformative scale. The strengthening government capacity for effective social protection
systems and safety nets trust fund was developed to help governments design and deliver
effective, inclusive social protection and safety nets. The objective is to ensure that the food
security and nutrition needs of the poorest and most vulnerable people are increasingly
addressed through strengthened, nationally led social protection programmes.
The trust fund will also help WFP to position itself globally as a technical service provider
and partner in specific niche areas of social protection.
Nutrition
306. The micronutrient initiative trust fund was established to support implementation of
WFP’s Nutrition Capacity Strengthening Plan. The fund is focused on improving the quality
and coverage of WFP’s nutrition-specific and nutrition-sensitive programmes around
the world. Its objectives include strengthening partnerships and developing
national capacities, conducting nutrient gap analyses and improving the evidence base for
healthy foods.
307. The DSM trust fund stems from a successful ten-year partnership between WFP and DSM,
a global leader in innovative nutrition solutions. Combining DSM’s evidence-based research
in nutrition with WFP’s global reach, the partnership has supported critical initiatives in
rice fortification; the creation of demand for healthy and safe foods; learning; and
product development. A prime example of the success of the partnership is the
development of Supercereal Plus, a nutrient-rich, calorie-dense product that allowed WFP
to treat and prevent malnutrition in more than 16 million nutritionally vulnerable people in
2017 alone.
308. The Joint United Nations Programme on HIV/AIDS (UNAIDS) HIV/AIDS trust fund was established
to support the delivery of an effective response to the global HIV/AIDS epidemic.
Through this trust fund WFP receives approximately USD 3 million per year which it uses to
ensure that the HIV/AIDS response in both emergency and non-emergency settings
incorporates a comprehensive nutrition strategy for the global, country and regional levels.
309. REACH is an inter-agency partnership among WFP, FAO, the International Fund for
Agricultural Development (IFAD), UNICEF and the World Health Organization (WHO), which
was initiated with the aim of strengthening capacities in nutrition programming at the
national level by supporting government-led, results-oriented partnerships. The REACH
trust fund hosted by WFP was established to manage donations designated to
REACH activities. The trust fund has received more than USD 27 million to date and has
funded multi-sector nutrition initiatives in 18 countries in Africa, Asia and Latin America.

WFP/EB.2/2018/6-A/1 82
Climate change and disaster risk reduction
310. The Rural Resilience Initiative (R4) trust fund is used for the coordination of a joint endeavour
by WFP and Oxfam America, which has the aim of promoting the large-scale use of
micro-insurance as part of an integrated risk management strategy for addressing
food insecurity exacerbated by climate shocks. The initiative offers a sustainable model for
the scale-up of micro-insurance worldwide, with a target of insuring 500,000 food-insecure
people by 2020.
311. The climate risk financing trust fund was established to support activities that include
the provision of technical assistance to countries, the provision of premiums for buying
insurance policies and related activities through the adoption of ARC Replica43 and other
measures for anticipatory action and early response (including insurance). Building on
WFP’s innovative work in climate risk management, the aim of the initiative is to develop a
more integrated approach to layered risk financing44 that supports vulnerable countries and
communities in reducing their financial exposure to climate and disaster risk.
312. The hunger-related climate change trust fund is used to support WFP’s capacity development initiatives and innovations that address the impact of climate change on hunger. It enables
WFP to engage in global policy processes and to provide its country offices with guidance
and support in the design of climate change adaptation programmes that promote
food security in an environmentally sustainable manner.
313. The Safe Access to Fuel and Energy (SAFE) trust fund was developed to support management
of the SAFE Initiative through the coordination of global, regional and national SAFE and
other energy initiatives based on proposals and agreements developed between WFP
and donors. The trust fund is used for overseeing WFP’s management of and reporting on SAFE and energy grants, which are used to implement both field-based implementation of
SAFE projects and significant headquarters-based strategic, technical, inter-agency and
communication activities.
Emergency preparedness and response
314. The emergency preparedness and response trust fund is used to promote preparedness actions
that are focused on reinforcing existing tools through investments in human capacity,
early warning and internal processes and systems; strengthening capacities through
support to governments and national social protection mechanisms; and expanding and
consolidating partnerships.
Other corporate trust funds
315. Among the other corporate trust funds, the school feeding and the vouchers, cash and
research trust funds are the most significant.
316. The School Feeding trust fund is used to support the global scale up of school feeding
activities, especially the work of the new School Feeding Service in the Operations Services
Department. Donors and private sector partners support work related to enhancing the
quality of school feeding programmes, improving the efficiency of supply chain mechanisms
for the programmes, and providing better support to the field through improved guidance,
43 ARC Replica is an insurance product offered by African Risk Capacity (ARC) Limited to WFP and other
humanitarian actors. 44 Layered risk financing is the use of several risk management instruments, such as insurance, rehabilitation of
natural buffer zones and establishment of savings groups at the community level, to address risks of different levels
(in terms of frequency and intensity) concurrently.
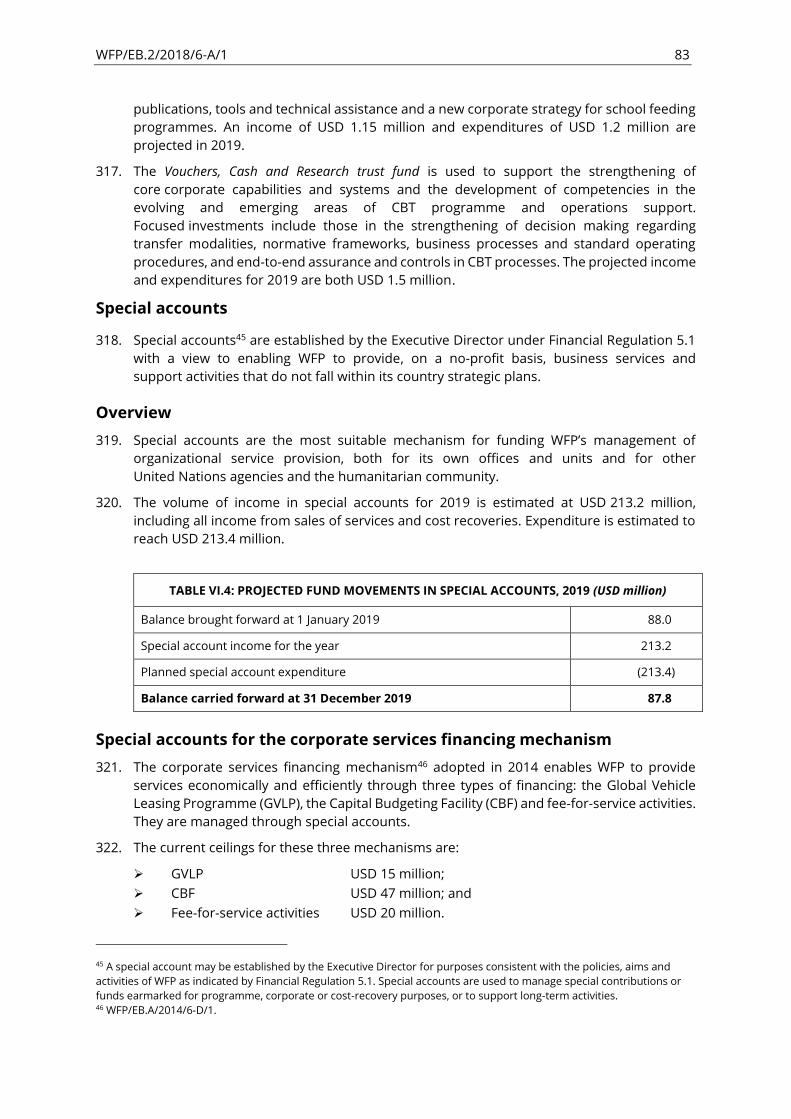
WFP/EB.2/2018/6-A/1 83
publications, tools and technical assistance and a new corporate strategy for school feeding
programmes. An income of USD 1.15 million and expenditures of USD 1.2 million are
projected in 2019.
317. The Vouchers, Cash and Research trust fund is used to support the strengthening of
core corporate capabilities and systems and the development of competencies in the
evolving and emerging areas of CBT programme and operations support.
Focused investments include those in the strengthening of decision making regarding
transfer modalities, normative frameworks, business processes and standard operating
procedures, and end-to-end assurance and controls in CBT processes. The projected income
and expenditures for 2019 are both USD 1.5 million.
Special accounts
318. Special accounts45 are established by the Executive Director under Financial Regulation 5.1
with a view to enabling WFP to provide, on a no-profit basis, business services and
support activities that do not fall within its country strategic plans.
Overview
319. Special accounts are the most suitable mechanism for funding WFP’s management of organizational service provision, both for its own offices and units and for other
United Nations agencies and the humanitarian community.
320. The volume of income in special accounts for 2019 is estimated at USD 213.2 million,
including all income from sales of services and cost recoveries. Expenditure is estimated to
reach USD 213.4 million.
TABLE VI.4: PROJECTED FUND MOVEMENTS IN SPECIAL ACCOUNTS, 2019 (USD million)
Balance brought forward at 1 January 2019 88.0
Special account income for the year 213.2
Planned special account expenditure (213.4)
Balance carried forward at 31 December 2019 87.8
Special accounts for the corporate services financing mechanism
321. The corporate services financing mechanism46 adopted in 2014 enables WFP to provide
services economically and efficiently through three types of financing: the Global Vehicle
Leasing Programme (GVLP), the Capital Budgeting Facility (CBF) and fee-for-service activities.
They are managed through special accounts.
322. The current ceilings for these three mechanisms are:
➢ GVLP USD 15 million;
➢ CBF USD 47 million; and
➢ Fee-for-service activities USD 20 million.
45 A special account may be established by the Executive Director for purposes consistent with the policies, aims and
activities of WFP as indicated by Financial Regulation 5.1. Special accounts are used to manage special contributions or
funds earmarked for programme, corporate or cost-recovery purposes, or to support long-term activities. 46 WFP/EB.A/2014/6-D/1.
WFP/EB.2/2018/6-A/1 84
Global Vehicle Leasing Programme
323. Through the GVLP, WFP leases vehicles to country offices. The centralized procurement,
management and preparation of vehicles improves WFP’s asset management and ensures that country offices have access to vehicles that are compliant with security standards.
Leasing fees are included in project and country portfolio budgets in order to ensure that
the GVLP recovers its costs.
Capital Budgeting Facility
324. The CBF was established in the Management Plan (2014—2016). It is a revolving facility,
enabling WFP to provide advances for multi-year projects, with repayment from
country portfolio budgets or other funding sources over an agreed timescale.
325. The CBF was established with an approved level of USD 20 million, which was used in a pilot
scheme to support implementation of the Logistics Execution Support System (LESS).
The global rollout of LESS was completed in late 2016, allowing WFP to track, monitor and
manage all food commodities in real time thereby generating long-term efficiency gains in
areas that include pipeline management, inventory management and
warehouse operations. Full repayment of CBF advances is projected to be completed before
the end of 2018.
326. Subsequent to the creation of the CBF, the Executive Board approved increases of
USD 27 million to the ceiling of the facility in order to provide financing for improvements to
field premises where WFP foresees that a long-term presence will improve return on
investments, provide better security for staff and improve operational efficiency.
327. The success of the CBF pilot in financing the LESS system opens possibilities for other
strategic uses of the CBF. Currently, approximately USD 34 million of the USD 47 million
envelope is available for allocation, which is carried out through application to the
Strategic Resource Allocation Committee. Use of the CBF may be considered for providing
further support to the SCOPE platform, for example, which would be repayable through a
small uplift for each beneficiary registered. Investments in common premises could also be
considered, with the savings arising from reduced rental income payments providing the
means by which the CBF advance would be recovered. Use of the CBF cannot be considered
without the provision of a clear, viable repayment plan as an integral part of the
allocation request.
328. No increase in the CBF ceiling is required at this time.
Fee-for-service activities
329. The fee-for-service mechanism can provide advances of up to USD 20 million for information
technology (IT) services and staff security. The volume of advances transacted each year may
exceed the amount of the ceiling but the recoveries made during the year ensure that the
balance of advances outstanding at any time cannot exceed the ceiling.
330. In order to scale corporate IT costs to the size of each operation and accurately reflect these
costs in the most appropriate cost category, without adding an excessive administrative
overhead, in 2013 WFP started to implement a per capita cost recovery model for
operational IT services, allowing funding to be provided upfront with fund recovery
managed centrally. The main activities included in this model are WFP’s global connectivity via satellite and terrestrial links; WFP’s hosting of the United Nations International Computing Centre; licences for WFP’s corporate IT services such as SAP and Microsoft;
and the PasPort application for field staff payroll.
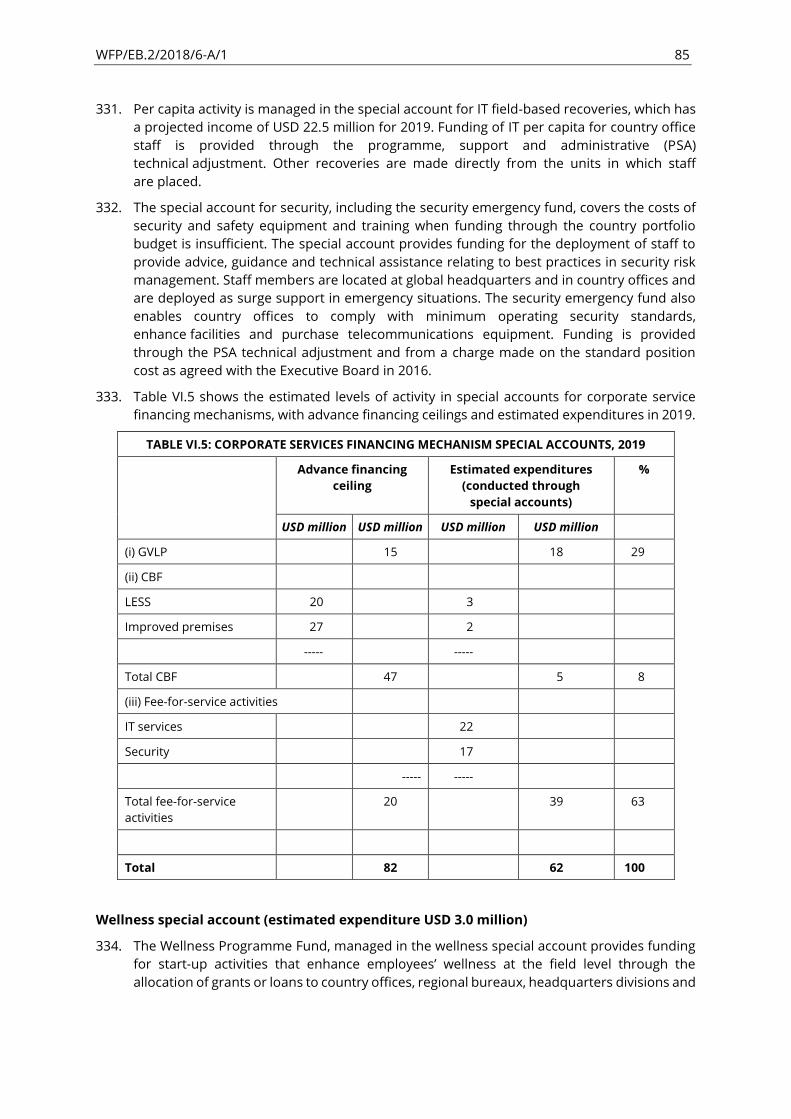
WFP/EB.2/2018/6-A/1 85
331. Per capita activity is managed in the special account for IT field-based recoveries, which has
a projected income of USD 22.5 million for 2019. Funding of IT per capita for country office
staff is provided through the programme, support and administrative (PSA)
technical adjustment. Other recoveries are made directly from the units in which staff
are placed.
332. The special account for security, including the security emergency fund, covers the costs of
security and safety equipment and training when funding through the country portfolio
budget is insufficient. The special account provides funding for the deployment of staff to
provide advice, guidance and technical assistance relating to best practices in security risk
management. Staff members are located at global headquarters and in country offices and
are deployed as surge support in emergency situations. The security emergency fund also
enables country offices to comply with minimum operating security standards,
enhance facilities and purchase telecommunications equipment. Funding is provided
through the PSA technical adjustment and from a charge made on the standard position
cost as agreed with the Executive Board in 2016.
333. Table VI.5 shows the estimated levels of activity in special accounts for corporate service
financing mechanisms, with advance financing ceilings and estimated expenditures in 2019.
TABLE VI.5: CORPORATE SERVICES FINANCING MECHANISM SPECIAL ACCOUNTS, 2019
Advance financing
ceiling
Estimated expenditures
(conducted through
special accounts)
%
USD million USD million USD million USD million
(i) GVLP
15
18 29
(ii) CBF
LESS 20 3
Improved premises 27 2
----- -----
Total CBF
47
5 8
(iii) Fee-for-service activities
IT services
22
Security
17
----- -----
Total fee-for-service
activities
20
39 63
Total 82 62 100
Wellness special account (estimated expenditure USD 3.0 million)
334. The Wellness Programme Fund, managed in the wellness special account provides funding
for start-up activities that enhance employees’ wellness at the field level through the allocation of grants or loans to country offices, regional bureaux, headquarters divisions and
WFP/EB.2/2018/6-A/1 86
WFP offices that have only limited funding for staff wellness initiatives. Wellness initiatives
include, but are not limited to:
a) medical and mental health prevention and care;
b) staff safety;
c) improved staff working and living conditions;
d) enhanced work-life balance; and
e) increased access to staff support services.
335. Proposals for funding from the Staff Wellness Programme are prioritized in relation to the
number of goals and objectives of the WFP staff wellness strategy that are addressed by the
proposal or by its cross-functional impact.
Other special accounts
336. Other special accounts provide business services in WFP and for partners. The estimated
volume of transactions in these special accounts in 2019 is USD 152 million. The four largest
account for 72 percent of this total.
United Nations Humanitarian Response Depot (UNHRD) special account
(Estimated income USD 33.4 million, estimated expenditures USD 35.4 million)
337. The UNHRD network is operated by WFP and consists of six hubs at strategic locations
around the world. It facilitates preparedness for and response to emergencies by supporting
strategic stockpiling by United Nations, international, government and non-governmental
organizations. The network also holds stocks of emergency relief goods such as medical kits,
shelter items, ready-to-use supplementary foods, IT equipment and other assets,
all designed to support relief organizations in responding to emergencies.
Aviation special account
(Estimated income USD 34.9 million, estimated expenditures USD 31.6 million)
338. The Aviation special account is the core funding source for various aviation activities
including the promotion of a safety culture, support to WFP’s safety structures and ensuring
compliance with standards through an effective quality management system for all
aviation operations. In addition, the special account provides bridging finance that enables
WFP to maintain preferential contractual terms with air operators and serves as a reserve
for sustaining poorly funded operations in view of anticipated donor contributions.
Self-insurance special account
(Estimated income USD 24.0 million, estimated expenditures USD 28.0 million)
339. The self-insurance special account, established by the Committee on Food Aid Policies
and Programmes in 1993, enables WFP to provide insurance cover for food and goods
in transit. Through the account, WFP self-insures against a significant part of any potential
food loss, which allows it to negotiate premiums at significantly below market rates in order
to cover the balance of the potential loss and to minimize negative economic effects on
projects resulting from food losses.

WFP/EB.2/2018/6-A/1 87
IT special account
(Estimated income USD 15 million, estimated expenditures USD 15.0 million)
340. The IT special account was established to ensure continuous support to WFP divisions and
offices for the development, implementation and maintenance of internal IT projects
and applications. The special account facility reduces the effort required from the
requesting division or office in order to administer funding, facilitates cost recovery for
IT efforts and provides transparency and a clear line of sight on all the costs associated with
the projects and applications. The special account also serves as a tool for cost recovery on
Fast Information Technology and Telecommunications Emergency Support Team (FITTEST)
activities, including equipment sales and the provision of support for WFP and other
United Nations agencies. FITTEST uses a self-financing model, and the special account is
used to cover the operational and personnel costs of the team.
WFP/EB.2/2018/6-A/1 88
ANNEX I
The 2019 PSA budget proposal
1. This annex complements section IV on the programme support and administrative (PSA)
budget and outlines the review process used in preparing the 2019 PSA budget proposal.
The budget review
2. The PSA budget for 2019 has been increased by USD 49.7 million (14.8 percent). The increase
reflects a desire on the part of WFP management to ensure that additional resources were
directed towards areas that were identified in audit and investigatory work as being
underfunded, and particularly that the oversight offices were better resourced.
The Secretariat also recognized that priorities such as school feeding and emergency surge
capacity should be supported.
3. In each department, budgets were reviewed with a view to reprioritizing existing budget
items and adding additional budget allocations to some of the functions in greatest need of
resources for maintaining operational effectiveness and efficiency. Divisional PSA proposals
were then prepared based on the initial PSA ceilings established by the head of the
department. The divisional proposals were consolidated into a PSA budget proposal for the
department, which was submitted to the Strategic Resource Allocation Committee (SRAC)
along with investment cases requesting funding in excess of the initial divisional PSA ceilings.
The consolidation of all the departmental proposals constituted a first PSA budget proposal.
4. The SRAC considered the departmental budget proposals, allocating additional funds for
corporate priorities in 2019. These additions together with the initial divisional and
departmental reprioritized budgets increased the PSA budget by USD 39.3 million. A further
USD 1.96 million was added to the central appropriations budget, principally to cover
WFP’s increased share of the cost of supporting the resident coordinator system.
5. The positions proposed in the PSA budget are costed using standard rates. These are
calculated each year to reflect the actual costs of employing a staff member at the grade
and in the location concerned; projected exchange rates for euro-based expenditure for
Rome-based staff; and provisions for staff benefits and other staff-related allowances. The
standard position costs calculated for 2019 resulted in an increase of USD 8.5 million to the
baseline salary cost.
6. Following a review of the investment cases submitted as part of the PSA budget exercise,
the Secretariat compiled a list of investment cases that were not included for funding
through the PSA budget or as critical corporate initiatives (CCIs). The Strategic Resource
Allocation Committee may consider these for future multilateral funding or inclusion as CCIs
in 2019, or for funding from donor contributions made specifically for the purpose.
Structure of the Secretariat
7. The structure of the Secretariat is set out in paragraphs 184 193 of the Management Plan
(2019—2021).
The PSA budget proposal in detail
8. The tables in this annex provide a comparison of budgets for the most recent complete
calendar year, the current year (estimated) and next year (projected). The figures are
presented by geographical location — of WFP country offices, regional bureaux and

WFP/EB.2/2018/6-A/1 89
global offices — in order to facilitate comparisons between the 2019 PSA budget proposal
and the budgets of past years.
9. A detailed PSA budget for 2019 with divisional budgets broken down by pillar is shown
in annex II.
The 2019 PSA budget proposal by organizational level
10. Table A.I.1 presents the numbers and costs of positions and other staff costs by
organizational level — country office, regional bureau, headquarters and corporate —
with actual figures for 2017, estimates for 2018 and projections for 2019.
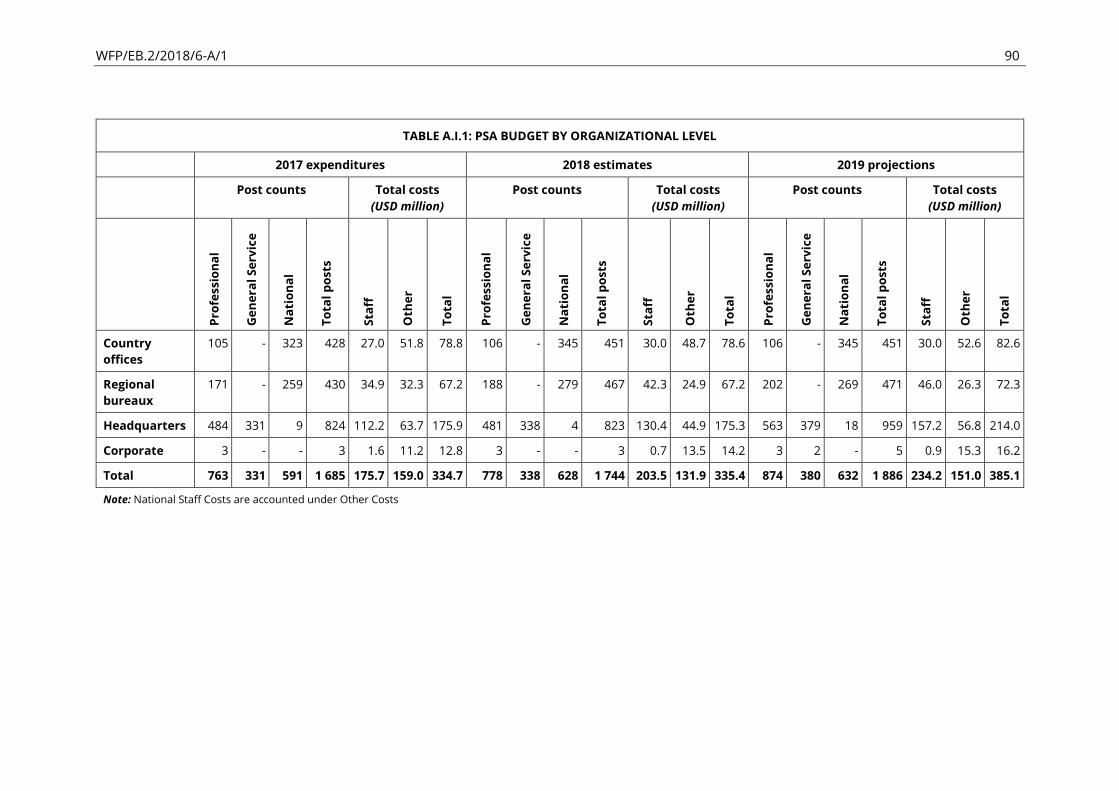
WFP/EB.2/2018/6-A/1 90
TABLE A.I.1: PSA BUDGET BY ORGANIZATIONAL LEVEL
2017 expenditures 2018 estimates 2019 projections
Post counts Total costs
(USD million)
Post counts Total costs
(USD million)
Post counts Total costs
(USD million)
Pro
fessi
on
al
Ge
ne
ral
Se
rvic
e
Na
tio
na
l
To
tal
po
sts
Sta
ff
Oth
er
To
tal
Pro
fessi
on
al
Ge
ne
ral
Se
rvic
e
Na
tio
na
l
To
tal
po
sts
Sta
ff
Oth
er
To
tal
Pro
fessi
on
al
Ge
ne
ral
Se
rvic
e
Na
tio
na
l
To
tal
po
sts
Sta
ff
Oth
er
To
tal
Country
offices
105 - 323 428 27.0 51.8 78.8 106 - 345 451 30.0 48.7 78.6 106 - 345 451 30.0 52.6 82.6
Regional
bureaux
171 - 259 430 34.9 32.3 67.2 188 - 279 467 42.3 24.9 67.2 202 - 269 471 46.0 26.3 72.3
Headquarters 484 331 9 824 112.2 63.7 175.9 481 338 4 823 130.4 44.9 175.3 563 379 18 959 157.2 56.8 214.0
Corporate 3 - - 3 1.6 11.2 12.8 3 - - 3 0.7 13.5 14.2 3 2 - 5 0.9 15.3 16.2
Total 763 331 591 1 685 175.7 159.0 334.7 778 338 628 1 744 203.5 131.9 335.4 874 380 632 1 886 234.2 151.0 385.1
Note: National Staff Costs are accounted under Other Costs

WFP/EB.2/2018/6-A/1 91
Country offices
11. As in previous years, no breakdown by individual country office is provided.
12. Country offices ensure that corporate priorities are implemented at the country level.
Their main functions are to:
➢ ensure that WFP’s country-level activities are aligned with and complement national
and United Nations strategies, plans and programmes;
➢ design and implement country strategic plans in accordance with WFP’s policies and strategic plan and as part of implementation of the Integrated Road Map (IRM);
➢ monitor and report on programme results;
➢ develop partnerships with national authorities, United Nations agencies,
non-governmental organizations, civil society groups, donors and the private sector
with a view to maximizing programme effectiveness;
➢ ensure implementation of the country office gender action plan, in line with
WFP’s gender policy and the regional gender strategy;
➢ ensure implementation of WFP’s evaluation policy and strategy;
➢ ensure accountability of management for country-level physical, financial and
human resources, including staff safety and security; and
➢ ensure implementation of other corporate initiatives and new tools, as appropriate.
13. A standard PSA allocation is made to each of WFP’s 83 country offices in order to provide
funds for country director positions, with additional allocations for national staff and
operating costs, which take into consideration an 8 percent increase in the PSA budget for
2019. The overall PSA allocation for country offices also covers an additional 29 P3 and
P4 positions that are allocated to selected countries in order to provide strategic and
targeted support for their operations.
Regional bureaux
14. As announced earlier, a comprehensive review of the roles and responsibilities of regional
bureaux is currently being undertaken, with results expected to be available in late 2019.
Under current arrangements, the regional bureaux are the first line of support for
country offices in implementing strategies and policies at the operational level while
ensuring management effectiveness, operational oversight and coherence at the regional
and country levels. Their main current functions are to:
➢ provide policy support and strategic direction for WFP’s operations;
➢ deliver strategic and technical support and oversee quality standards;
➢ formulate and disseminate best practice and lessons learned throughout the region;
➢ coordinate the scheduling, preparation and submission of country strategic plans;
➢ ensure the substantive and presentational quality of country strategy and
project documents;
➢ facilitate sharing of technical resources so that country offices have the required
operational capacities;
➢ lead development and implementation of the regional gender implementation strategy
in line with WFP’s gender policy and gender action plan;
WFP/EB.2/2018/6-A/1 92
➢ ensure implementation of the provisions of WFP’s evaluation policy and strategy;
➢ ensure effectiveness and efficiency in Level 2 emergency responses through coherent
utilization of regional resources;
➢ ensure effectiveness and efficiency in Level 3 emergency responses by providing
operational guidance and regional back-up; and
➢ serve as the second line of defence in the oversight of country office management and
budgetary matters, including the monitoring of risks and compliance with rules
and regulations.
15. Table A.I.2 shows the distribution of PSA posts and costs by regional bureau in 2017, with
estimates for 2018 and projections for 2019. The total positions columns include international professional staff and national staff. The total USD million columns present the totals of all staff and non-staff costs. Details of the budget breakdown for 2019 are
provided in annex II.

WFP/EB.2/2018/6-A/1 93
TABLE A.I.2: DISTRIBUTION OF PSA POSTS AND COSTS BY REGIONAL BUREAU, 2017—2019
2017 expenditures 2018 estimates 2019 projections
Pro
fessi
on
al
To
tal
po
sts
To
tal
sta
ff
(US
D m
illi
on
)
To
tal
oth
er
(US
D m
illi
on
)
To
tal
(US
D m
illi
on
)
Pro
fessi
on
al
To
tal
po
sts
To
tal
sta
ff
(US
D m
illi
on
)
To
tal
oth
er
(US
D m
illi
on
)
To
tal
(US
D m
illi
on
)
Pro
fessi
on
al
To
tal
po
sts
To
tal
sta
ff
(US
D m
illi
on
)
To
tal
oth
er
(US
D m
illi
on
)
To
tal
(US
D m
illi
on
)
Total regional bureaux 171 430 34.9 32.3 67.2 188 467 42.3 24.9 67.2 202 471 46.0 26.3 72.3
RB — Asia and the Pacific 32 80 6.1 6.0 12.1 33 81 7.4 5.3 12.7 33 68 7.4 5.8 13.2
RB — Middle East,
North Africa, Eastern
Europe and Central Asia
32 80 6.6 4.0 10.6 39 87 8.7 3.4 12.1 46 94 10.3 3.2 13.5
RB — West Africa 33 75 6.4 4.3 10.7 36 78 8.0 3.5 11.5 37 87 8.6 3.4 12.1
RB — Southern Africa 24 61 4.9 5.2 10.1 26 77 5.8 4.8 10.6 26 75 5.9 5.3 11.3
RB — East and
Central Africa
30 74 6.3 5.0 11.2 32 81 7.3 4.3 11.6 37 85 8.4 4.6 13.0
RB — Latin America and
the Caribbean
20 60 4.7 3.5 8.2 23 64 5.2 3.5 8.7 23 62 5.3 3.9 9.2
Integrated Road Map Team
— RBs
- - - 4.3 4.3 - - - - - - - - - -
Note: National Staff Costs are accounted under Other Costs
WFP/EB.2/2018/6-A/1 94
Headquarters
16. Table A.I.3 shows the distribution of PSA posts and costs for the provision of programme
support to WFP’s global offices and units in 2017, with estimates for 2018 and projections
for 2019. The total positions columns include international professional staff and
national staff. The total USD million columns include staff and non-staff costs. Details of
the budget breakdown for 2019 are provided in annex II.
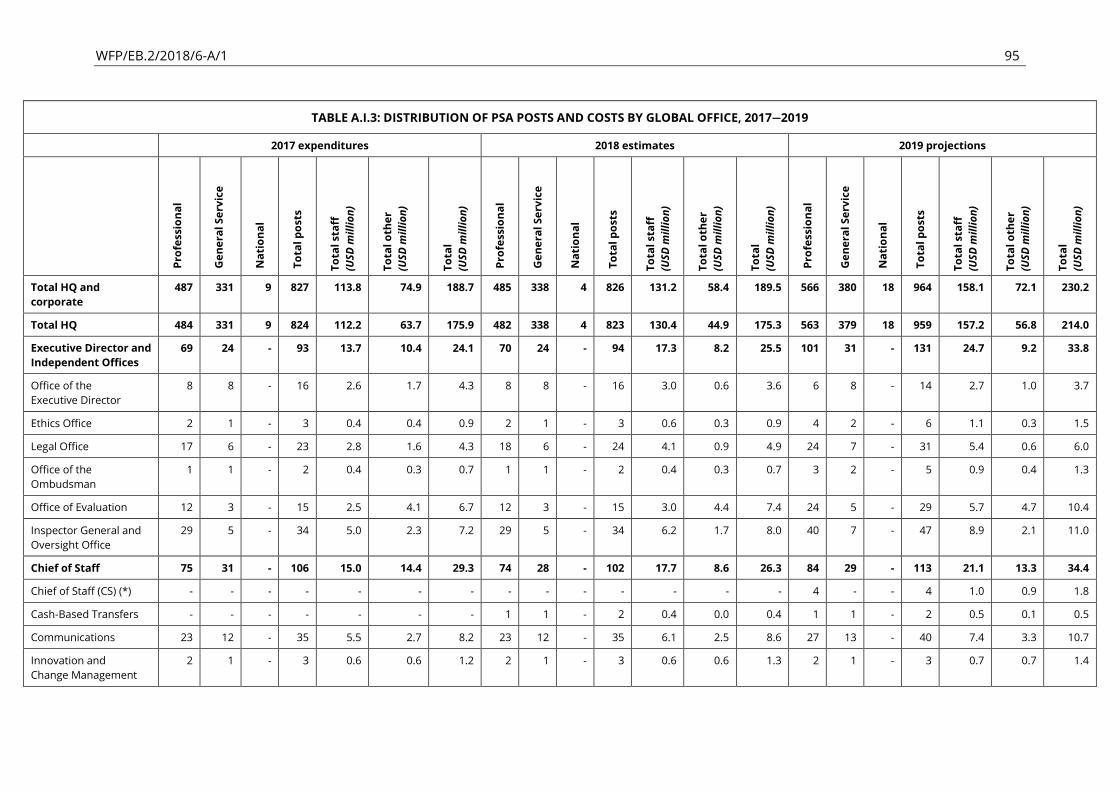
WFP/EB.2/2018/6-A/1 95
TABLE A.I.3: DISTRIBUTION OF PSA POSTS AND COSTS BY GLOBAL OFFICE, 2017—2019
2017 expenditures 2018 estimates 2019 projections
Pro
fess
ion
al
Ge
ne
ral
Se
rvic
e
Na
tio
na
l
To
tal
po
sts
To
tal
sta
ff
(US
D m
illi
on
)
To
tal
oth
er
(US
D m
illi
on
)
To
tal
(US
D m
illi
on
)
Pro
fess
ion
al
Ge
ne
ral
Se
rvic
e
Na
tio
na
l
To
tal
po
sts
To
tal
sta
ff
(US
D m
illi
on
)
To
tal
oth
er
(US
D m
illi
on
)
To
tal
(US
D m
illi
on
)
Pro
fess
ion
al
Ge
ne
ral
Se
rvic
e
Na
tio
na
l
To
tal
po
sts
To
tal
sta
ff
(US
D m
illi
on
)
To
tal
oth
er
(US
D m
illi
on
)
To
tal
(US
D m
illi
on
)
Total HQ and
corporate
487 331 9 827 113.8 74.9 188.7 485 338 4 826 131.2 58.4 189.5 566 380 18 964 158.1 72.1 230.2
Total HQ 484 331 9 824 112.2 63.7 175.9 482 338 4 823 130.4 44.9 175.3 563 379 18 959 157.2 56.8 214.0
Executive Director and
Independent Offices
69 24 - 93 13.7 10.4 24.1 70 24 - 94 17.3 8.2 25.5 101 31 - 131 24.7 9.2 33.8
Office of the
Executive Director
8 8 - 16 2.6 1.7 4.3 8 8 - 16 3.0 0.6 3.6 6 8 - 14 2.7 1.0 3.7
Ethics Office 2 1 - 3 0.4 0.4 0.9 2 1 - 3 0.6 0.3 0.9 4 2 - 6 1.1 0.3 1.5
Legal Office 17 6 - 23 2.8 1.6 4.3 18 6 - 24 4.1 0.9 4.9 24 7 - 31 5.4 0.6 6.0
Office of the
Ombudsman
1 1 - 2 0.4 0.3 0.7 1 1 - 2 0.4 0.3 0.7 3 2 - 5 0.9 0.4 1.3
Office of Evaluation 12 3 - 15 2.5 4.1 6.7 12 3 - 15 3.0 4.4 7.4 24 5 - 29 5.7 4.7 10.4
Inspector General and
Oversight Office
29 5 - 34 5.0 2.3 7.2 29 5 - 34 6.2 1.7 8.0 40 7 - 47 8.9 2.1 11.0
Chief of Staff 75 31 - 106 15.0 14.4 29.3 74 28 - 102 17.7 8.6 26.3 84 29 - 113 21.1 13.3 34.4
Chief of Staff (CS) (*) - - - - - - - - - - - - - - 4 - - 4 1.0 0.9 1.8
Cash-Based Transfers - - - - - - - 1 1 - 2 0.4 0.0 0.4 1 1 - 2 0.5 0.1 0.5
Communications 23 12 - 35 5.5 2.7 8.2 23 12 - 35 6.1 2.5 8.6 27 13 - 40 7.4 3.3 10.7
Innovation and
Change Management
2 1 - 3 0.6 0.6 1.2 2 1 - 3 0.6 0.6 1.3 2 1 - 3 0.7 0.7 1.4
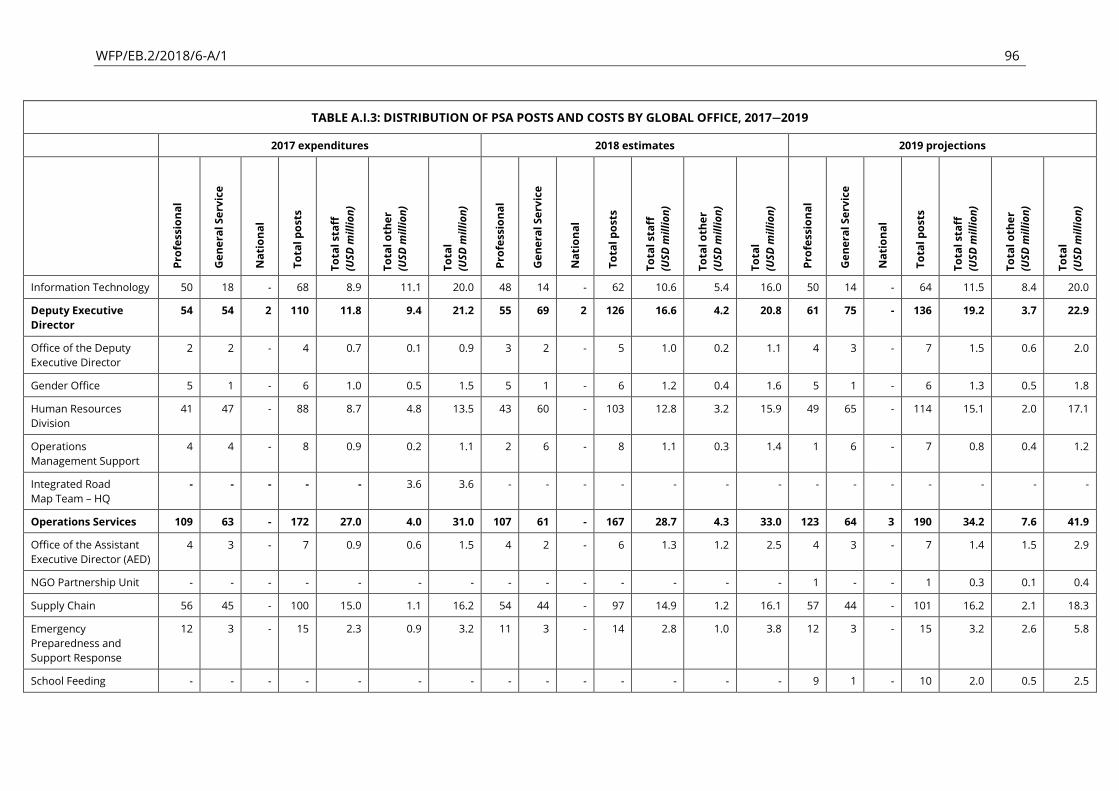
WFP/EB.2/2018/6-A/1 96
TABLE A.I.3: DISTRIBUTION OF PSA POSTS AND COSTS BY GLOBAL OFFICE, 2017—2019
2017 expenditures 2018 estimates 2019 projections
Pro
fess
ion
al
Ge
ne
ral
Se
rvic
e
Na
tio
na
l
To
tal
po
sts
To
tal
sta
ff
(US
D m
illi
on
)
To
tal
oth
er
(US
D m
illi
on
)
To
tal
(US
D m
illi
on
)
Pro
fess
ion
al
Ge
ne
ral
Se
rvic
e
Na
tio
na
l
To
tal
po
sts
To
tal
sta
ff
(US
D m
illi
on
)
To
tal
oth
er
(US
D m
illi
on
)
To
tal
(US
D m
illi
on
)
Pro
fess
ion
al
Ge
ne
ral
Se
rvic
e
Na
tio
na
l
To
tal
po
sts
To
tal
sta
ff
(US
D m
illi
on
)
To
tal
oth
er
(US
D m
illi
on
)
To
tal
(US
D m
illi
on
)
Information Technology 50 18 - 68 8.9 11.1 20.0 48 14 - 62 10.6 5.4 16.0 50 14 - 64 11.5 8.4 20.0
Deputy Executive
Director
54 54 2 110 11.8 9.4 21.2 55 69 2 126 16.6 4.2 20.8 61 75 - 136 19.2 3.7 22.9
Office of the Deputy
Executive Director
2 2 - 4 0.7 0.1 0.9 3 2 - 5 1.0 0.2 1.1 4 3 - 7 1.5 0.6 2.0
Gender Office 5 1 - 6 1.0 0.5 1.5 5 1 - 6 1.2 0.4 1.6 5 1 - 6 1.3 0.5 1.8
Human Resources
Division
41 47 - 88 8.7 4.8 13.5 43 60 - 103 12.8 3.2 15.9 49 65 - 114 15.1 2.0 17.1
Operations
Management Support
4 4 - 8 0.9 0.2 1.1 2 6 - 8 1.1 0.3 1.4 1 6 - 7 0.8 0.4 1.2
Integrated Road
Map Team HQ
- - - - - 3.6 3.6 - - - - - - - - - - - - - -
Operations Services 109 63 - 172 27.0 4.0 31.0 107 61 - 167 28.7 4.3 33.0 123 64 3 190 34.2 7.6 41.9
Office of the Assistant
Executive Director (AED)
4 3 - 7 0.9 0.6 1.5 4 2 - 6 1.3 1.2 2.5 4 3 - 7 1.4 1.5 2.9
NGO Partnership Unit - - - - - - - - - - - - - - 1 - - 1 0.3 0.1 0.4
Supply Chain 56 45 - 100 15.0 1.1 16.2 54 44 - 97 14.9 1.2 16.1 57 44 - 101 16.2 2.1 18.3
Emergency
Preparedness and
Support Response
12 3 - 15 2.3 0.9 3.2 11 3 - 14 2.8 1.0 3.8 12 3 - 15 3.2 2.6 5.8
School Feeding - - - - - - - - - - - - - - 9 1 - 10 2.0 0.5 2.5
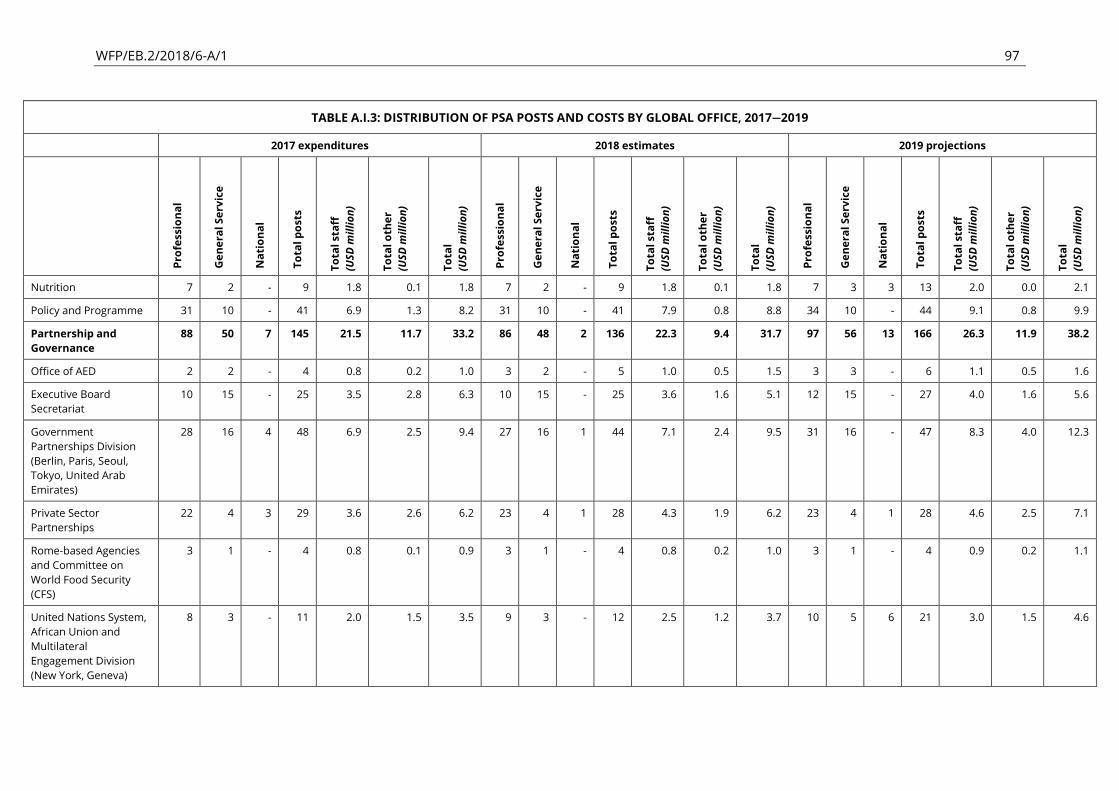
WFP/EB.2/2018/6-A/1 97
TABLE A.I.3: DISTRIBUTION OF PSA POSTS AND COSTS BY GLOBAL OFFICE, 2017—2019
2017 expenditures 2018 estimates 2019 projections
Pro
fess
ion
al
Ge
ne
ral
Se
rvic
e
Na
tio
na
l
To
tal
po
sts
To
tal
sta
ff
(US
D m
illi
on
)
To
tal
oth
er
(US
D m
illi
on
)
To
tal
(US
D m
illi
on
)
Pro
fess
ion
al
Ge
ne
ral
Se
rvic
e
Na
tio
na
l
To
tal
po
sts
To
tal
sta
ff
(US
D m
illi
on
)
To
tal
oth
er
(US
D m
illi
on
)
To
tal
(US
D m
illi
on
)
Pro
fess
ion
al
Ge
ne
ral
Se
rvic
e
Na
tio
na
l
To
tal
po
sts
To
tal
sta
ff
(US
D m
illi
on
)
To
tal
oth
er
(US
D m
illi
on
)
To
tal
(US
D m
illi
on
)
Nutrition 7 2 - 9 1.8 0.1 1.8 7 2 - 9 1.8 0.1 1.8 7 3 3 13 2.0 0.0 2.1
Policy and Programme 31 10 - 41 6.9 1.3 8.2 31 10 - 41 7.9 0.8 8.8 34 10 - 44 9.1 0.8 9.9
Partnership and
Governance
88 50 7 145 21.5 11.7 33.2 86 48 2 136 22.3 9.4 31.7 97 56 13 166 26.3 11.9 38.2
Office of AED 2 2 - 4 0.8 0.2 1.0 3 2 - 5 1.0 0.5 1.5 3 3 - 6 1.1 0.5 1.6
Executive Board
Secretariat
10 15 - 25 3.5 2.8 6.3 10 15 - 25 3.6 1.6 5.1 12 15 - 27 4.0 1.6 5.6
Government
Partnerships Division
(Berlin, Paris, Seoul,
Tokyo, United Arab
Emirates)
28 16 4 48 6.9 2.5 9.4 27 16 1 44 7.1 2.4 9.5 31 16 - 47 8.3 4.0 12.3
Private Sector
Partnerships
22 4 3 29 3.6 2.6 6.2 23 4 1 28 4.3 1.9 6.2 23 4 1 28 4.6 2.5 7.1
Rome-based Agencies
and Committee on
World Food Security
(CFS)
3 1 - 4 0.8 0.1 0.9 3 1 - 4 0.8 0.2 1.0 3 1 - 4 0.9 0.2 1.1
United Nations System,
African Union and
Multilateral
Engagement Division
(New York, Geneva)
8 3 - 11 2.0 1.5 3.5 9 3 - 12 2.5 1.2 3.7 10 5 6 21 3.0 1.5 4.6
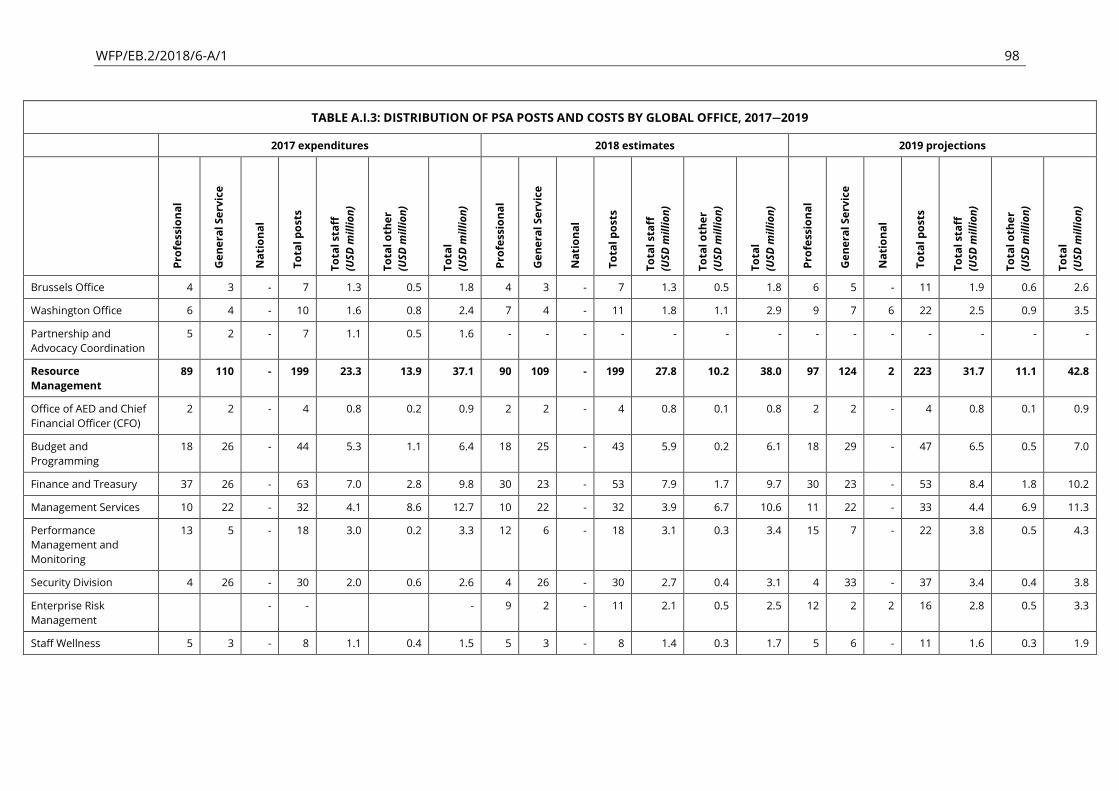
WFP/EB.2/2018/6-A/1 98
TABLE A.I.3: DISTRIBUTION OF PSA POSTS AND COSTS BY GLOBAL OFFICE, 2017—2019
2017 expenditures 2018 estimates 2019 projections
Pro
fess
ion
al
Ge
ne
ral
Se
rvic
e
Na
tio
na
l
To
tal
po
sts
To
tal
sta
ff
(US
D m
illi
on
)
To
tal
oth
er
(US
D m
illi
on
)
To
tal
(US
D m
illi
on
)
Pro
fess
ion
al
Ge
ne
ral
Se
rvic
e
Na
tio
na
l
To
tal
po
sts
To
tal
sta
ff
(US
D m
illi
on
)
To
tal
oth
er
(US
D m
illi
on
)
To
tal
(US
D m
illi
on
)
Pro
fess
ion
al
Ge
ne
ral
Se
rvic
e
Na
tio
na
l
To
tal
po
sts
To
tal
sta
ff
(US
D m
illi
on
)
To
tal
oth
er
(US
D m
illi
on
)
To
tal
(US
D m
illi
on
)
Brussels Office 4 3 - 7 1.3 0.5 1.8 4 3 - 7 1.3 0.5 1.8 6 5 - 11 1.9 0.6 2.6
Washington Office 6 4 - 10 1.6 0.8 2.4 7 4 - 11 1.8 1.1 2.9 9 7 6 22 2.5 0.9 3.5
Partnership and
Advocacy Coordination
5 2 - 7 1.1 0.5 1.6 - - - - - - - - - - - - - -
Resource
Management
89 110 - 199 23.3 13.9 37.1 90 109 - 199 27.8 10.2 38.0 97 124 2 223 31.7 11.1 42.8
Office of AED and Chief
Financial Officer (CFO)
2 2 - 4 0.8 0.2 0.9 2 2 - 4 0.8 0.1 0.8 2 2 - 4 0.8 0.1 0.9
Budget and
Programming
18 26 - 44 5.3 1.1 6.4 18 25 - 43 5.9 0.2 6.1 18 29 - 47 6.5 0.5 7.0
Finance and Treasury 37 26 - 63 7.0 2.8 9.8 30 23 - 53 7.9 1.7 9.7 30 23 - 53 8.4 1.8 10.2
Management Services 10 22 - 32 4.1 8.6 12.7 10 22 - 32 3.9 6.7 10.6 11 22 - 33 4.4 6.9 11.3
Performance
Management and
Monitoring
13 5 - 18 3.0 0.2 3.3 12 6 - 18 3.1 0.3 3.4 15 7 - 22 3.8 0.5 4.3
Security Division 4 26 - 30 2.0 0.6 2.6 4 26 - 30 2.7 0.4 3.1 4 33 - 37 3.4 0.4 3.8
Enterprise Risk
Management
- -
- 9 2 - 11 2.1 0.5 2.5 12 2 2 16 2.8 0.5 3.3
Staff Wellness 5 3 - 8 1.1 0.4 1.5 5 3 - 8 1.4 0.3 1.7 5 6 - 11 1.6 0.3 1.9

WFP/EB.2/2018/6-A/1 99
TABLE A.I.3: DISTRIBUTION OF PSA POSTS AND COSTS BY GLOBAL OFFICE, 2017—2019
2017 expenditures 2018 estimates 2019 projections
Pro
fess
ion
al
Ge
ne
ral
Se
rvic
e
Na
tio
na
l
To
tal
po
sts
To
tal
sta
ff
(US
D m
illi
on
)
To
tal
oth
er
(US
D m
illi
on
)
To
tal
(US
D m
illi
on
)
Pro
fess
ion
al
Ge
ne
ral
Se
rvic
e
Na
tio
na
l
To
tal
po
sts
To
tal
sta
ff
(US
D m
illi
on
)
To
tal
oth
er
(US
D m
illi
on
)
To
tal
(US
D m
illi
on
)
Pro
fess
ion
al
Ge
ne
ral
Se
rvic
e
Na
tio
na
l
To
tal
po
sts
To
tal
sta
ff
(US
D m
illi
on
)
To
tal
oth
er
(US
D m
illi
on
)
To
tal
(US
D m
illi
on
)
Corporate 3 - - 3 1.6 11.2 12.8 3 - - 3 0.7 13.5 14.2 3 2 - 5 0.9 15.3 16.2
Central appropriations 3 - - 3 1.6 11.2 12.8 3 - - 3 0.7 13.5 14.2 3 2 - 5 0.9 15.3 16.2
Note: National Staff Costs are accounted under Other Costs
* Chief of Staff is included in Office of the Executive Director (OED) for 2018
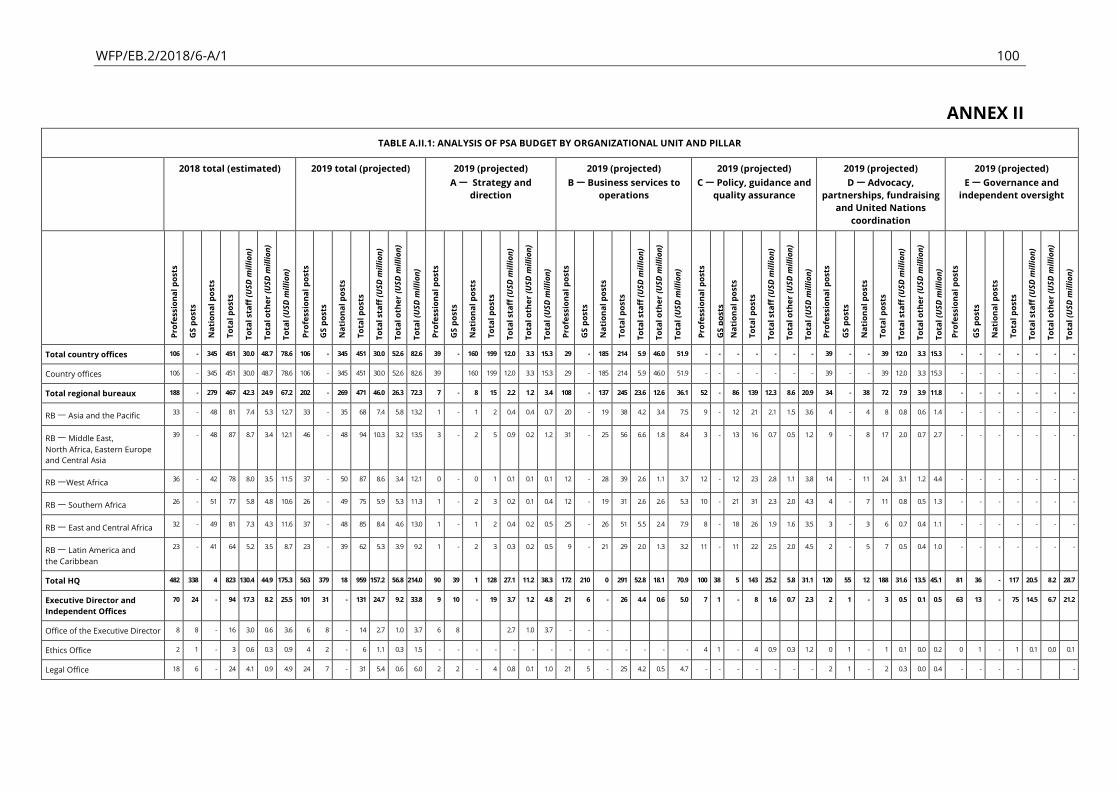
WFP/EB.2/2018/6-A/1 100
ANNEX II
TABLE A.II.1: ANALYSIS OF PSA BUDGET BY ORGANIZATIONAL UNIT AND PILLAR
2018 total (estimated) 2019 total (projected) 2019 (projected)
A — Strategy and
direction
2019 (projected)
B — Business services to
operations
2019 (projected)
C — Policy, guidance and
quality assurance
2019 (projected)
D — Advocacy,
partnerships, fundraising
and United Nations
coordination
2019 (projected)
E — Governance and
independent oversight
Pro
fess
ion
al
po
sts
GS
po
sts
Na
tio
na
l p
ost
s
To
tal
po
sts
To
tal
sta
ff (
US
D m
illi
on
)
To
tal
oth
er
(US
D m
illi
on
)
To
tal
(US
D m
illi
on
)
Pro
fess
ion
al
po
sts
GS
po
sts
Na
tio
na
l p
ost
s
To
tal
po
sts
To
tal
sta
ff (
US
D m
illi
on
)
To
tal
oth
er
(US
D m
illi
on
)
To
tal
(US
D m
illi
on
)
Pro
fess
ion
al
po
sts
GS
po
sts
Na
tio
na
l p
ost
s
To
tal
po
sts
To
tal
sta
ff (
US
D m
illi
on
)
To
tal
oth
er
(US
D m
illi
on
)
To
tal
(US
D m
illi
on
)
Pro
fess
ion
al
po
sts
GS
po
sts
Na
tio
na
l p
ost
s
To
tal
po
sts
To
tal
sta
ff (
US
D m
illi
on
)
To
tal
oth
er
(US
D m
illi
on
)
To
tal
(US
D m
illi
on
)
Pro
fess
ion
al
po
sts
GS
po
sts
Na
tio
na
l p
ost
s
To
tal
po
sts
To
tal
sta
ff (
US
D m
illi
on
)
To
tal
oth
er
(US
D m
illi
on
)
To
tal
(US
D m
illi
on
)
Pro
fess
ion
al
po
sts
GS
po
sts
Na
tio
na
l p
ost
s
To
tal
po
sts
To
tal
sta
ff (
US
D m
illi
on
)
To
tal
oth
er
(US
D m
illi
on
)
To
tal
(US
D m
illi
on
)
Pro
fess
ion
al
po
sts
GS
po
sts
Na
tio
na
l p
ost
s
To
tal
po
sts
To
tal
sta
ff (
US
D m
illi
on
)
To
tal
oth
er
(US
D m
illi
on
)
To
tal
(US
D m
illi
on
)
Total country offices 106 - 345 451 30.0 48.7 78.6 106 - 345 451 30.0 52.6 82.6 39 - 160 199 12.0 3.3 15.3 29 - 185 214 5.9 46.0 51.9 - - - - - - - 39 - - 39 12.0 3.3 15.3 - - - - - - -
Country offices 106 - 345 451 30.0 48.7 78.6 106 - 345 451 30.0 52.6 82.6 39
160 199 12.0 3.3 15.3 29 - 185 214 5.9 46.0 51.9 - - - - - - - 39 - - 39 12.0 3.3 15.3 - - - - - - -
Total regional bureaux 188 - 279 467 42.3 24.9 67.2 202 - 269 471 46.0 26.3 72.3 7 - 8 15 2.2 1.2 3.4 108 - 137 245 23.6 12.6 36.1 52 - 86 139 12.3 8.6 20.9 34 - 38 72 7.9 3.9 11.8 - - - - - - -
RB — Asia and the Pacific 33 - 48 81 7.4 5.3 12.7 33 - 35 68 7.4 5.8 13.2 1 - 1 2 0.4 0.4 0.7 20 - 19 38 4.2 3.4 7.5 9 - 12 21 2.1 1.5 3.6 4 - 4 8 0.8 0.6 1.4 - - - - - - -
RB — Middle East,
North Africa, Eastern Europe
and Central Asia
39 - 48 87 8.7 3.4 12.1 46 - 48 94 10.3 3.2 13.5 3 - 2 5 0.9 0.2 1.2 31 - 25 56 6.6 1.8 8.4 3 - 13 16 0.7 0.5 1.2 9 - 8 17 2.0 0.7 2.7 - - - - - - -
RB —West Africa 36 - 42 78 8.0 3.5 11.5 37 - 50 87 8.6 3.4 12.1 0 - 0 1 0.1 0.1 0.1 12 - 28 39 2.6 1.1 3.7 12 - 12 23 2.8 1.1 3.8 14 - 11 24 3.1 1.2 4.4 - - - - - - -
RB — Southern Africa 26 - 51 77 5.8 4.8 10.6 26 - 49 75 5.9 5.3 11.3 1 - 2 3 0.2 0.1 0.4 12 - 19 31 2.6 2.6 5.3 10 - 21 31 2.3 2.0 4.3 4 - 7 11 0.8 0.5 1.3 - - - - - - -
RB — East and Central Africa 32 - 49 81 7.3 4.3 11.6 37 - 48 85 8.4 4.6 13.0 1 - 1 2 0.4 0.2 0.5 25 - 26 51 5.5 2.4 7.9 8 - 18 26 1.9 1.6 3.5 3 - 3 6 0.7 0.4 1.1 - - - - - - -
RB — Latin America and
the Caribbean
23 - 41 64 5.2 3.5 8.7 23 - 39 62 5.3 3.9 9.2 1 - 2 3 0.3 0.2 0.5 9 - 21 29 2.0 1.3 3.2 11 - 11 22 2.5 2.0 4.5 2 - 5 7 0.5 0.4 1.0 - - - - - - -
Total HQ 482 338 4 823 130.4 44.9 175.3 563 379 18 959 157.2 56.8 214.0 90 39 1 128 27.1 11.2 38.3 172 210 0 291 52.8 18.1 70.9 100 38 5 143 25.2 5.8 31.1 120 55 12 188 31.6 13.5 45.1 81 36 - 117 20.5 8.2 28.7
Executive Director and
Independent Offices
70 24 - 94 17.3 8.2 25.5 101 31 - 131 24.7 9.2 33.8 9 10 - 19 3.7 1.2 4.8 21 6 - 26 4.4 0.6 5.0 7 1 - 8 1.6 0.7 2.3 2 1 - 3 0.5 0.1 0.5 63 13 - 75 14.5 6.7 21.2
Office of the Executive Director 8 8 - 16 3.0 0.6 3.6 6 8 - 14 2.7 1.0 3.7 6 8
2.7 1.0 3.7 - - -
Ethics Office 2 1 - 3 0.6 0.3 0.9 4 2 - 6 1.1 0.3 1.5 - - - - - - - - - - - - - - 4 1 - 4 0.9 0.3 1.2 0 1 - 1 0.1 0.0 0.2 0 1 - 1 0.1 0.0 0.1
Legal Office 18 6 - 24 4.1 0.9 4.9 24 7 - 31 5.4 0.6 6.0 2 2 - 4 0.8 0.1 1.0 21 5 - 25 4.2 0.5 4.7 - - - - - - - 2 1 - 2 0.3 0.0 0.4 - - - -
-
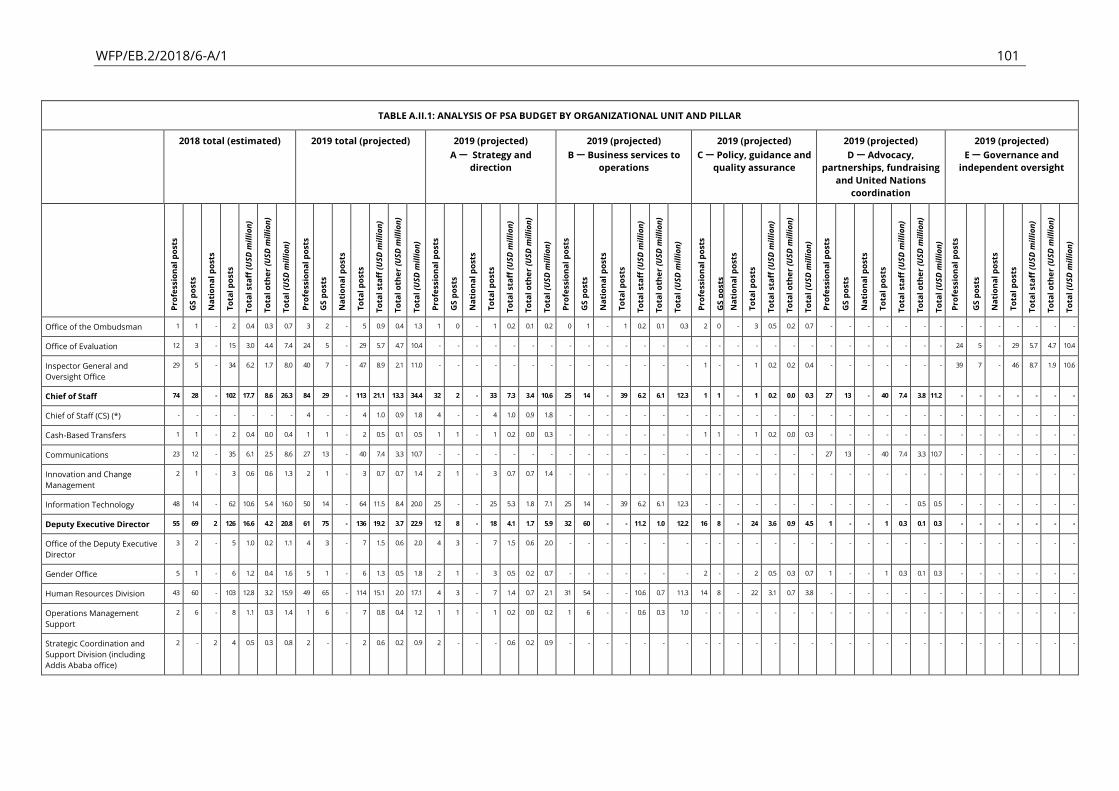
WFP/EB.2/2018/6-A/1 101
TABLE A.II.1: ANALYSIS OF PSA BUDGET BY ORGANIZATIONAL UNIT AND PILLAR
2018 total (estimated) 2019 total (projected) 2019 (projected)
A — Strategy and
direction
2019 (projected)
B — Business services to
operations
2019 (projected)
C — Policy, guidance and
quality assurance
2019 (projected)
D — Advocacy,
partnerships, fundraising
and United Nations
coordination
2019 (projected)
E — Governance and
independent oversight
Pro
fess
ion
al
po
sts
GS
po
sts
Na
tio
na
l p
ost
s
To
tal
po
sts
To
tal
sta
ff (
US
D m
illi
on
)
To
tal
oth
er
(US
D m
illi
on
)
To
tal
(US
D m
illi
on
)
Pro
fess
ion
al
po
sts
GS
po
sts
Na
tio
na
l p
ost
s
To
tal
po
sts
To
tal
sta
ff (
US
D m
illi
on
)
To
tal
oth
er
(US
D m
illi
on
)
To
tal
(US
D m
illi
on
)
Pro
fess
ion
al
po
sts
GS
po
sts
Na
tio
na
l p
ost
s
To
tal
po
sts
To
tal
sta
ff (
US
D m
illi
on
)
To
tal
oth
er
(US
D m
illi
on
)
To
tal
(US
D m
illi
on
)
Pro
fess
ion
al
po
sts
GS
po
sts
Na
tio
na
l p
ost
s
To
tal
po
sts
To
tal
sta
ff (
US
D m
illi
on
)
To
tal
oth
er
(US
D m
illi
on
)
To
tal
(US
D m
illi
on
)
Pro
fess
ion
al
po
sts
GS
po
sts
Na
tio
na
l p
ost
s
To
tal
po
sts
To
tal
sta
ff (
US
D m
illi
on
)
To
tal
oth
er
(US
D m
illi
on
)
To
tal
(US
D m
illi
on
)
Pro
fess
ion
al
po
sts
GS
po
sts
Na
tio
na
l p
ost
s
To
tal
po
sts
To
tal
sta
ff (
US
D m
illi
on
)
To
tal
oth
er
(US
D m
illi
on
)
To
tal
(US
D m
illi
on
)
Pro
fess
ion
al
po
sts
GS
po
sts
Na
tio
na
l p
ost
s
To
tal
po
sts
To
tal
sta
ff (
US
D m
illi
on
)
To
tal
oth
er
(US
D m
illi
on
)
To
tal
(US
D m
illi
on
)
Office of the Ombudsman 1 1 - 2 0.4 0.3 0.7 3 2 - 5 0.9 0.4 1.3 1 0 - 1 0.2 0.1 0.2 0 1 - 1 0.2 0.1 0.3 2 0 - 3 0.5 0.2 0.7 - - - - - - - - - - - - - -
Office of Evaluation 12 3 - 15 3.0 4.4 7.4 24 5 - 29 5.7 4.7 10.4 - - - - - - - - - - - - - - - - - - - - - - - - - - - - 24 5 - 29 5.7 4.7 10.4
Inspector General and
Oversight Office
29 5 - 34 6.2 1.7 8.0 40 7 - 47 8.9 2.1 11.0 - - - - - - - - - - - - - - 1 - - 1 0.2 0.2 0.4 - - - - - - - 39 7 - 46 8.7 1.9 10.6
Chief of Staff 74 28 - 102 17.7 8.6 26.3 84 29 - 113 21.1 13.3 34.4 32 2 - 33 7.3 3.4 10.6 25 14 - 39 6.2 6.1 12.3 1 1 - 1 0.2 0.0 0.3 27 13 - 40 7.4 3.8 11.2 - - - - - - -
Chief of Staff (CS) (*) - - - - - - - 4 - - 4 1.0 0.9 1.8 4 - - 4 1.0 0.9 1.8 - - - - - - - - - - - - - - - - - - - - - - - - - - - -
Cash-Based Transfers 1 1 - 2 0.4 0.0 0.4 1 1 - 2 0.5 0.1 0.5 1 1 - 1 0.2 0.0 0.3 - - - - - - - 1 1 - 1 0.2 0.0 0.3 - - - - - - - - - - - - - -
Communications 23 12 - 35 6.1 2.5 8.6 27 13 - 40 7.4 3.3 10.7 - - - - - - - - - - - - - - - - - - - - - 27 13 - 40 7.4 3.3 10.7 - - - - - - -
Innovation and Change
Management
2 1 - 3 0.6 0.6 1.3 2 1 - 3 0.7 0.7 1.4 2 1 - 3 0.7 0.7 1.4 - - - - - - - - - - - - - - - - - - - - - - - - - - - -
Information Technology 48 14 - 62 10.6 5.4 16.0 50 14 - 64 11.5 8.4 20.0 25 - - 25 5.3 1.8 7.1 25 14 - 39 6.2 6.1 12.3 - - - - - - - - - - - - 0.5 0.5 - - - - - - -
Deputy Executive Director 55 69 2 126 16.6 4.2 20.8 61 75 - 136 19.2 3.7 22.9 12 8 - 18 4.1 1.7 5.9 32 60 - - 11.2 1.0 12.2 16 8 - 24 3.6 0.9 4.5 1 - - 1 0.3 0.1 0.3 - - - - - - -
Office of the Deputy Executive
Director
3 2 - 5 1.0 0.2 1.1 4 3 - 7 1.5 0.6 2.0 4 3 - 7 1.5 0.6 2.0 - - - - - - - - - - - - - - - - - - - - - - - - - - - -
Gender Office 5 1 - 6 1.2 0.4 1.6 5 1 - 6 1.3 0.5 1.8 2 1 - 3 0.5 0.2 0.7 - - - - - - - 2 - - 2 0.5 0.3 0.7 1 - - 1 0.3 0.1 0.3 - - - - - - -
Human Resources Division 43 60 - 103 12.8 3.2 15.9 49 65 - 114 15.1 2.0 17.1 4 3 - 7 1.4 0.7 2.1 31 54 - - 10.6 0.7 11.3 14 8 - 22 3.1 0.7 3.8 - - - - - - - - - - - - - -
Operations Management
Support
2 6 - 8 1.1 0.3 1.4 1 6 - 7 0.8 0.4 1.2 1 1 - 1 0.2 0.0 0.2 1 6 - - 0.6 0.3 1.0 - - - - - - - - - - - - - - - - - - - - -
Strategic Coordination and
Support Division (including
Addis Ababa office)
2 - 2 4 0.5 0.3 0.8 2 - - 2 0.6 0.2 0.9 2 - - - 0.6 0.2 0.9 - - - - - - - - - - - - - - - - - - - - - - - - - - - -
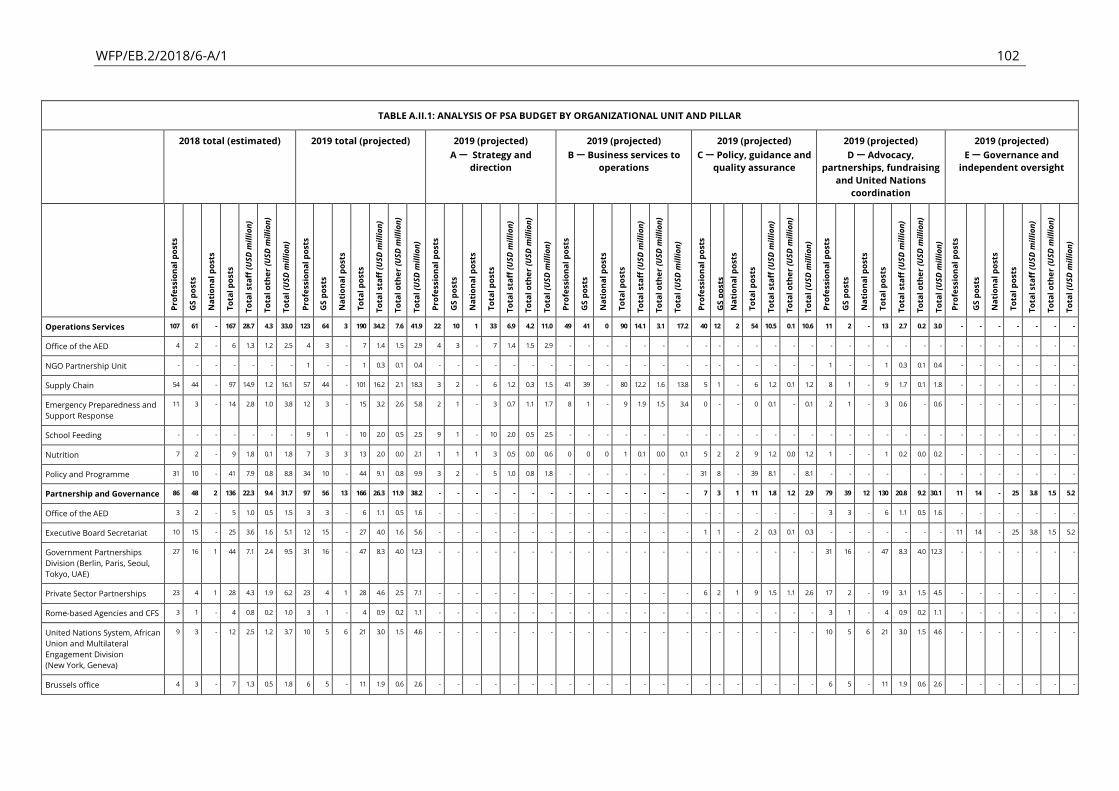
WFP/EB.2/2018/6-A/1 102
TABLE A.II.1: ANALYSIS OF PSA BUDGET BY ORGANIZATIONAL UNIT AND PILLAR
2018 total (estimated) 2019 total (projected) 2019 (projected)
A — Strategy and
direction
2019 (projected)
B — Business services to
operations
2019 (projected)
C — Policy, guidance and
quality assurance
2019 (projected)
D — Advocacy,
partnerships, fundraising
and United Nations
coordination
2019 (projected)
E — Governance and
independent oversight
Pro
fess
ion
al
po
sts
GS
po
sts
Na
tio
na
l p
ost
s
To
tal
po
sts
To
tal
sta
ff (
US
D m
illi
on
)
To
tal
oth
er
(US
D m
illi
on
)
To
tal
(US
D m
illi
on
)
Pro
fess
ion
al
po
sts
GS
po
sts
Na
tio
na
l p
ost
s
To
tal
po
sts
To
tal
sta
ff (
US
D m
illi
on
)
To
tal
oth
er
(US
D m
illi
on
)
To
tal
(US
D m
illi
on
)
Pro
fess
ion
al
po
sts
GS
po
sts
Na
tio
na
l p
ost
s
To
tal
po
sts
To
tal
sta
ff (
US
D m
illi
on
)
To
tal
oth
er
(US
D m
illi
on
)
To
tal
(US
D m
illi
on
)
Pro
fess
ion
al
po
sts
GS
po
sts
Na
tio
na
l p
ost
s
To
tal
po
sts
To
tal
sta
ff (
US
D m
illi
on
)
To
tal
oth
er
(US
D m
illi
on
)
To
tal
(US
D m
illi
on
)
Pro
fess
ion
al
po
sts
GS
po
sts
Na
tio
na
l p
ost
s
To
tal
po
sts
To
tal
sta
ff (
US
D m
illi
on
)
To
tal
oth
er
(US
D m
illi
on
)
To
tal
(US
D m
illi
on
)
Pro
fess
ion
al
po
sts
GS
po
sts
Na
tio
na
l p
ost
s
To
tal
po
sts
To
tal
sta
ff (
US
D m
illi
on
)
To
tal
oth
er
(US
D m
illi
on
)
To
tal
(US
D m
illi
on
)
Pro
fess
ion
al
po
sts
GS
po
sts
Na
tio
na
l p
ost
s
To
tal
po
sts
To
tal
sta
ff (
US
D m
illi
on
)
To
tal
oth
er
(US
D m
illi
on
)
To
tal
(US
D m
illi
on
)
Operations Services 107 61 - 167 28.7 4.3 33.0 123 64 3 190 34.2 7.6 41.9 22 10 1 33 6.9 4.2 11.0 49 41 0 90 14.1 3.1 17.2 40 12 2 54 10.5 0.1 10.6 11 2 - 13 2.7 0.2 3.0 - - - - - - -
Office of the AED 4 2 - 6 1.3 1.2 2.5 4 3 - 7 1.4 1.5 2.9 4 3 - 7 1.4 1.5 2.9 - - - - - - - - - - - - - - - - - - - - - - - - - - - -
NGO Partnership Unit - - - - - - - 1 - - 1 0.3 0.1 0.4 - - - - - - - - - - - - - - - - - - - - - 1 - - 1 0.3 0.1 0.4 - - - - - - -
Supply Chain 54 44 - 97 14.9 1.2 16.1 57 44 - 101 16.2 2.1 18.3 3 2 - 6 1.2 0.3 1.5 41 39 - 80 12.2 1.6 13.8 5 1 - 6 1.2 0.1 1.2 8 1 - 9 1.7 0.1 1.8 - - - - - - -
Emergency Preparedness and
Support Response
11 3 - 14 2.8 1.0 3.8 12 3 - 15 3.2 2.6 5.8 2 1 - 3 0.7 1.1 1.7 8 1 - 9 1.9 1.5 3.4 0 - - 0 0.1 - 0.1 2 1 - 3 0.6 - 0.6 - - - - - - -
School Feeding - - - - - - - 9 1 - 10 2.0 0.5 2.5 9 1 - 10 2.0 0.5 2.5 - - - - - - - - - - - - - - - - - - - - - - - - - - - -
Nutrition 7 2 - 9 1.8 0.1 1.8 7 3 3 13 2.0 0.0 2.1 1 1 1 3 0.5 0.0 0.6 0 0 0 1 0.1 0.0 0.1 5 2 2 9 1.2 0.0 1.2 1 - - 1 0.2 0.0 0.2 - - - - - - -
Policy and Programme 31 10 - 41 7.9 0.8 8.8 34 10 - 44 9.1 0.8 9.9 3 2 - 5 1.0 0.8 1.8 - - - - - - - 31 8 - 39 8.1 - 8.1 - - - -
- - - - - - - - -
Partnership and Governance 86 48 2 136 22.3 9.4 31.7 97 56 13 166 26.3 11.9 38.2 - - - - - - - - - - - - - - 7 3 1 11 1.8 1.2 2.9 79 39 12 130 20.8 9.2 30.1 11 14 - 25 3.8 1.5 5.2
Office of the AED 3 2 - 5 1.0 0.5 1.5 3 3 - 6 1.1 0.5 1.6 - - - - - - - - - - - - - - - - - - - - - 3 3 - 6 1.1 0.5 1.6 - - - - - - -
Executive Board Secretariat 10 15 - 25 3.6 1.6 5.1 12 15 - 27 4.0 1.6 5.6 - - - - - - - - - - - - - - 1 1 - 2 0.3 0.1 0.3 - - - - - - - 11 14 - 25 3.8 1.5 5.2
Government Partnerships
Division (Berlin, Paris, Seoul,
Tokyo, UAE)
27 16 1 44 7.1 2.4 9.5 31 16 - 47 8.3 4.0 12.3 - - - - - - - - - - - - - - - - - - - - - 31 16 - 47 8.3 4.0 12.3 - - - - - - -
Private Sector Partnerships 23 4 1 28 4.3 1.9 6.2 23 4 1 28 4.6 2.5 7.1 - - - - - - - - - - - - - - 6 2 1 9 1.5 1.1 2.6 17 2 - 19 3.1 1.5 4.5 - - - - - - -
Rome-based Agencies and CFS 3 1 - 4 0.8 0.2 1.0 3 1 - 4 0.9 0.2 1.1 - - - - - - - - - - - - - - - - - - - - - 3 1 - 4 0.9 0.2 1.1 - - - - - - -
United Nations System, African
Union and Multilateral
Engagement Division
(New York, Geneva)
9 3 - 12 2.5 1.2 3.7 10 5 6 21 3.0 1.5 4.6 - - - - - - - - - - - - - - - - - - - - - 10 5 6 21 3.0 1.5 4.6 - - - - - - -
Brussels office 4 3 - 7 1.3 0.5 1.8 6 5 - 11 1.9 0.6 2.6 - - - - - - - - - - - - - - - - - - - - - 6 5 - 11 1.9 0.6 2.6 - - - - - - -
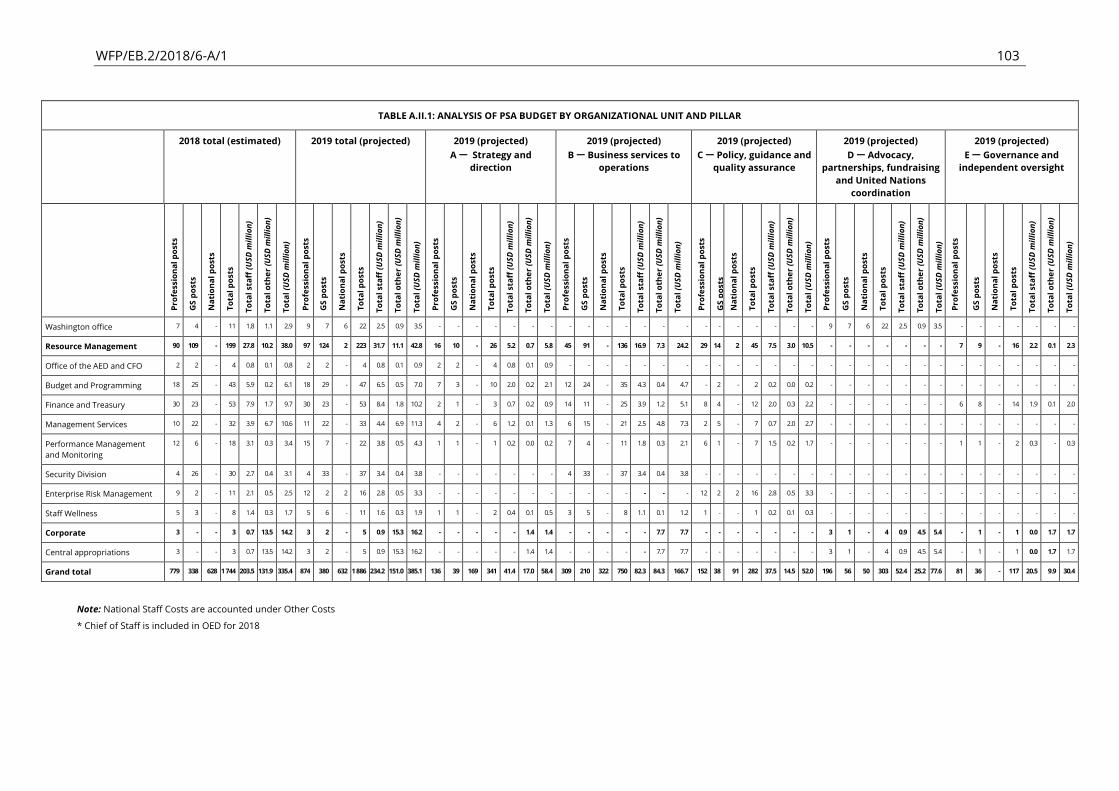
WFP/EB.2/2018/6-A/1 103
TABLE A.II.1: ANALYSIS OF PSA BUDGET BY ORGANIZATIONAL UNIT AND PILLAR
2018 total (estimated) 2019 total (projected) 2019 (projected)
A — Strategy and
direction
2019 (projected)
B — Business services to
operations
2019 (projected)
C — Policy, guidance and
quality assurance
2019 (projected)
D — Advocacy,
partnerships, fundraising
and United Nations
coordination
2019 (projected)
E — Governance and
independent oversight
Pro
fess
ion
al
po
sts
GS
po
sts
Na
tio
na
l p
ost
s
To
tal
po
sts
To
tal
sta
ff (
US
D m
illi
on
)
To
tal
oth
er
(US
D m
illi
on
)
To
tal
(US
D m
illi
on
)
Pro
fess
ion
al
po
sts
GS
po
sts
Na
tio
na
l p
ost
s
To
tal
po
sts
To
tal
sta
ff (
US
D m
illi
on
)
To
tal
oth
er
(US
D m
illi
on
)
To
tal
(US
D m
illi
on
)
Pro
fess
ion
al
po
sts
GS
po
sts
Na
tio
na
l p
ost
s
To
tal
po
sts
To
tal
sta
ff (
US
D m
illi
on
)
To
tal
oth
er
(US
D m
illi
on
)
To
tal
(US
D m
illi
on
)
Pro
fess
ion
al
po
sts
GS
po
sts
Na
tio
na
l p
ost
s
To
tal
po
sts
To
tal
sta
ff (
US
D m
illi
on
)
To
tal
oth
er
(US
D m
illi
on
)
To
tal
(US
D m
illi
on
)
Pro
fess
ion
al
po
sts
GS
po
sts
Na
tio
na
l p
ost
s
To
tal
po
sts
To
tal
sta
ff (
US
D m
illi
on
)
To
tal
oth
er
(US
D m
illi
on
)
To
tal
(US
D m
illi
on
)
Pro
fess
ion
al
po
sts
GS
po
sts
Na
tio
na
l p
ost
s
To
tal
po
sts
To
tal
sta
ff (
US
D m
illi
on
)
To
tal
oth
er
(US
D m
illi
on
)
To
tal
(US
D m
illi
on
)
Pro
fess
ion
al
po
sts
GS
po
sts
Na
tio
na
l p
ost
s
To
tal
po
sts
To
tal
sta
ff (
US
D m
illi
on
)
To
tal
oth
er
(US
D m
illi
on
)
To
tal
(US
D m
illi
on
)
Washington office 7 4 - 11 1.8 1.1 2.9 9 7 6 22 2.5 0.9 3.5 - - - - - - - - - - - - - - - - - - - - - 9 7 6 22 2.5 0.9 3.5 - - - - - - -
Resource Management 90 109 - 199 27.8 10.2 38.0 97 124 2 223 31.7 11.1 42.8 16 10 - 26 5.2 0.7 5.8 45 91 - 136 16.9 7.3 24.2 29 14 2 45 7.5 3.0 10.5 - - - - - - - 7 9 - 16 2.2 0.1 2.3
Office of the AED and CFO 2 2 - 4 0.8 0.1 0.8 2 2 - 4 0.8 0.1 0.9 2 2 - 4 0.8 0.1 0.9 - - - - - - - - - - - - - - - - - - - - - - - - - - - -
Budget and Programming 18 25 - 43 5.9 0.2 6.1 18 29 - 47 6.5 0.5 7.0 7 3 - 10 2.0 0.2 2.1 12 24 - 35 4.3 0.4 4.7 - 2 - 2 0.2 0.0 0.2 - - - - - - - - - - - - - -
Finance and Treasury 30 23 - 53 7.9 1.7 9.7 30 23 - 53 8.4 1.8 10.2 2 1 - 3 0.7 0.2 0.9 14 11 - 25 3.9 1.2 5.1 8 4 - 12 2.0 0.3 2.2 - - - - - - - 6 8 - 14 1.9 0.1 2.0
Management Services 10 22 - 32 3.9 6.7 10.6 11 22 - 33 4.4 6.9 11.3 4 2 - 6 1.2 0.1 1.3 6 15 - 21 2.5 4.8 7.3 2 5 - 7 0.7 2.0 2.7 - - - - - - - - - - - - - -
Performance Management
and Monitoring
12 6 - 18 3.1 0.3 3.4 15 7 - 22 3.8 0.5 4.3 1 1 - 1 0.2 0.0 0.2 7 4 - 11 1.8 0.3 2.1 6 1 - 7 1.5 0.2 1.7 - - - - - - - 1 1 - 2 0.3 - 0.3
Security Division 4 26 - 30 2.7 0.4 3.1 4 33 - 37 3.4 0.4 3.8 - - - - - - - 4 33 - 37 3.4 0.4 3.8 - - - - - - - - - - - - - - - - - - - - -
Enterprise Risk Management 9 2 - 11 2.1 0.5 2.5 12 2 2 16 2.8 0.5 3.3 - - - - - - - - - - - - - - 12 2 2 16 2.8 0.5 3.3 - - - - - - - - - - - - - -
Staff Wellness 5 3 - 8 1.4 0.3 1.7 5 6 - 11 1.6 0.3 1.9 1 1 - 2 0.4 0.1 0.5 3 5 - 8 1.1 0.1 1.2 1 - - 1 0.2 0.1 0.3 - - - - - - - - - - - - - -
Corporate 3 - - 3 0.7 13.5 14.2 3 2 - 5 0.9 15.3 16.2 - - - - - 1.4 1.4 - - - - - 7.7 7.7 - - - - - - - 3 1 - 4 0.9 4.5 5.4 - 1 - 1 0.0 1.7 1.7
Central appropriations 3 - - 3 0.7 13.5 14.2 3 2 - 5 0.9 15.3 16.2 - - - - - 1.4 1.4 - - - - - 7.7 7.7 - - - - - - - 3 1 - 4 0.9 4.5 5.4 - 1 - 1 0.0 1.7 1.7
Grand total 779 338 628 1 744 203.5 131.9 335.4 874 380 632 1 886 234.2 151.0 385.1 136 39 169 341 41.4 17.0 58.4 309 210 322 750 82.3 84.3 166.7 152 38 91 282 37.5 14.5 52.0 196 56 50 303 52.4 25.2 77.6 81 36 - 117 20.5 9.9 30.4
Note: National Staff Costs are accounted under Other Costs
* Chief of Staff is included in OED for 2018
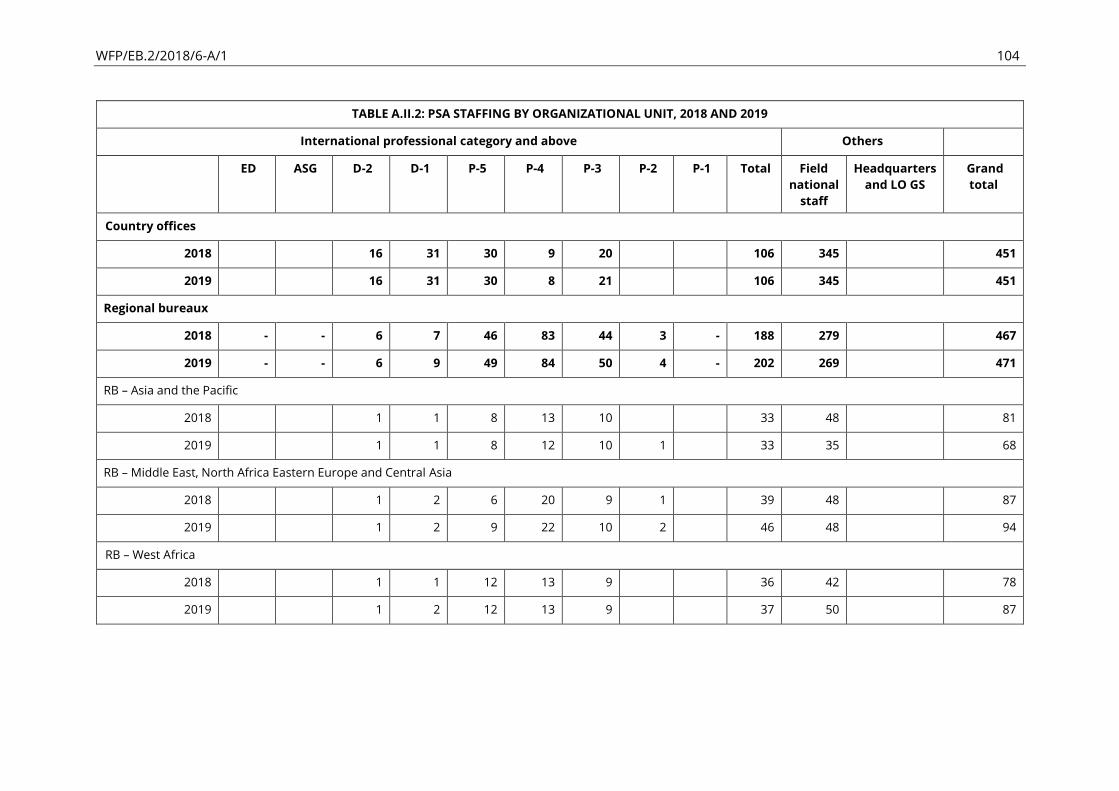
WFP/EB.2/2018/6-A/1 104
TABLE A.II.2: PSA STAFFING BY ORGANIZATIONAL UNIT, 2018 AND 2019
International professional category and above Others
ED ASG D-2 D-1 P-5 P-4 P-3 P-2 P-1 Total Field
national
staff
Headquarters
and LO GS
Grand
total
Country offices
2018 16 31 30 9 20 106 345 451
2019 16 31 30 8 21 106 345 451
Regional bureaux
2018 - - 6 7 46 83 44 3 - 188 279 467
2019 - - 6 9 49 84 50 4 - 202 269 471
RB Asia and the Pacific
2018 1 1 8 13 10
33 48
81
2019 1 1 8 12 10 1
33 35
68
RB Middle East, North Africa Eastern Europe and Central Asia
2018 1 2 6 20 9 1 39 48 87
2019 1 2 9 22 10 2 46 48 94
RB West Africa
2018 1 1 12 13 9 36 42 78
2019 1 2 12 13 9 37 50 87
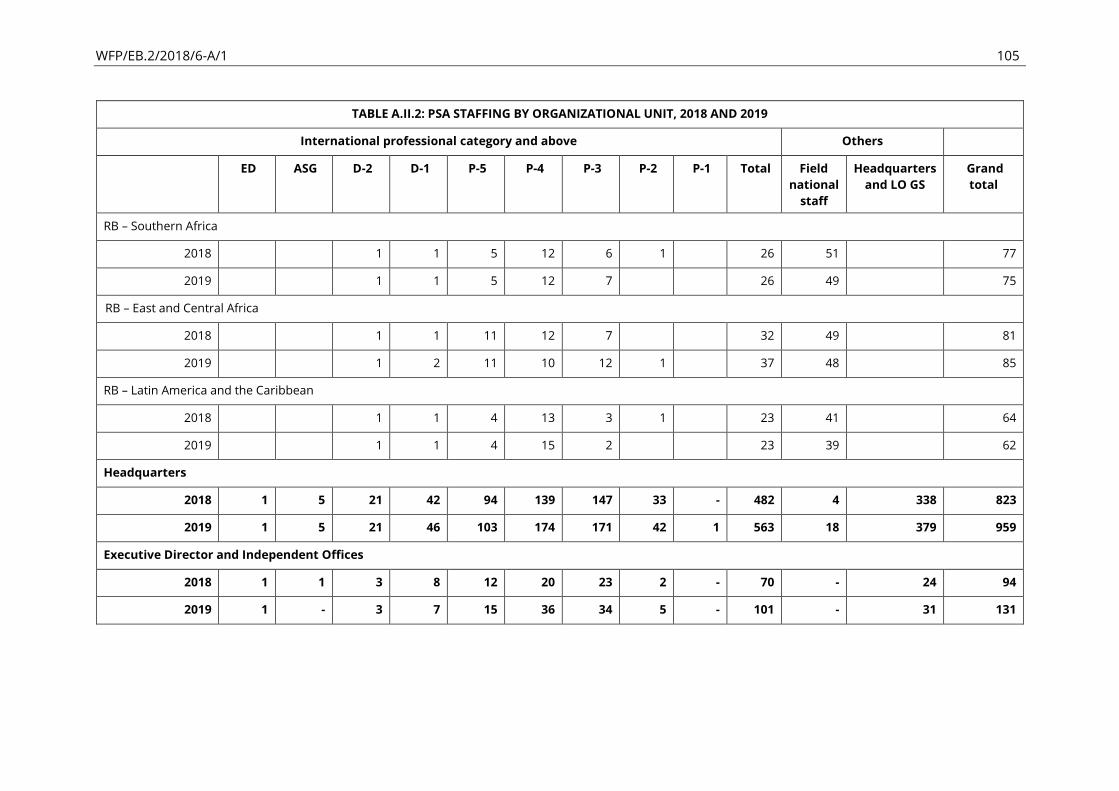
WFP/EB.2/2018/6-A/1 105
TABLE A.II.2: PSA STAFFING BY ORGANIZATIONAL UNIT, 2018 AND 2019
International professional category and above Others
ED ASG D-2 D-1 P-5 P-4 P-3 P-2 P-1 Total Field
national
staff
Headquarters
and LO GS
Grand
total
RB Southern Africa
2018 1 1 5 12 6 1 26 51 77
2019 1 1 5 12 7 26 49 75
RB East and Central Africa
2018 1 1 11 12 7 32 49 81
2019 1 2 11 10 12 1 37 48 85
RB Latin America and the Caribbean
2018
1 1 4 13 3 1
23 41
64
2019
1 1 4 15 2
23 39
62
Headquarters
2018 1 5 21 42 94 139 147 33 - 482 4 338 823
2019 1 5 21 46 103 174 171 42 1 563 18 379 959
Executive Director and Independent Offices
2018 1 1 3 8 12 20 23 2 - 70 - 24 94
2019 1 - 3 7 15 36 34 5 - 101 - 31 131

WFP/EB.2/2018/6-A/1 106
TABLE A.II.2: PSA STAFFING BY ORGANIZATIONAL UNIT, 2018 AND 2019
International professional category and above Others
ED ASG D-2 D-1 P-5 P-4 P-3 P-2 P-1 Total Field
national
staff
Headquarters
and LO GS
Grand
total
Office of the Executive Director
2018 1 1
2 1 1 2
8
8 16
2019 1
1 2 2
6
8 14
Ethics Office
2018
1
1
2
1 3
2019
1
3
4
2 6
Legal Office
2018
1 1 4 4 7 1
18
6 24
2019
1 1 4 6 8 4
24
7 31
Office of the Ombudsman
2018
1
1
1 2
2019
1
1 1
3
2 5
Office of Evaluation
2018
1 1 3 6 1
12
3 15
2019
1 1 4 11 6 1
24
5 29
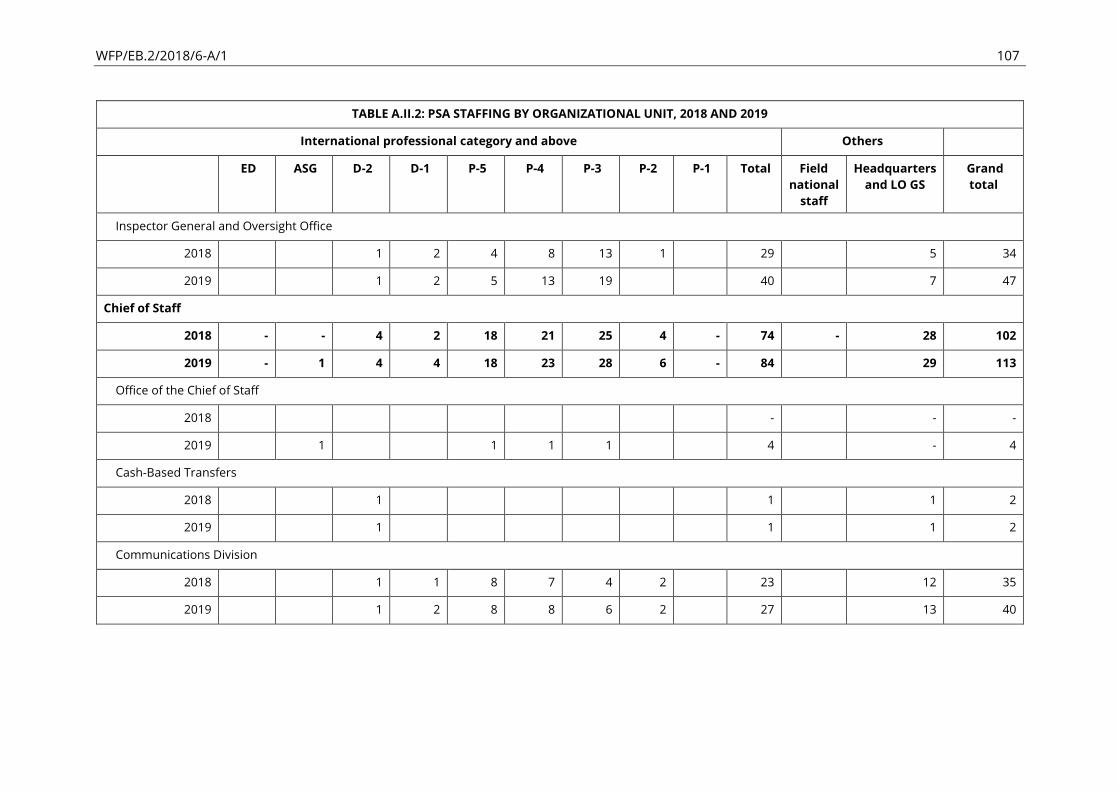
WFP/EB.2/2018/6-A/1 107
TABLE A.II.2: PSA STAFFING BY ORGANIZATIONAL UNIT, 2018 AND 2019
International professional category and above Others
ED ASG D-2 D-1 P-5 P-4 P-3 P-2 P-1 Total Field
national
staff
Headquarters
and LO GS
Grand
total
Inspector General and Oversight Office
2018
1 2 4 8 13 1
29
5 34
2019
1 2 5 13 19
40
7 47
Chief of Staff
2018 - - 4 2 18 21 25 4 - 74 - 28 102
2019 - 1 4 4 18 23 28 6 - 84
29 113
Office of the Chief of Staff
2018 - - -
2019 1 1 1 1 4 - 4
Cash-Based Transfers
2018
1
1
1 2
2019
1
1
1 2
Communications Division
2018
1 1 8 7 4 2
23
12 35
2019
1 2 8 8 6 2
27
13 40
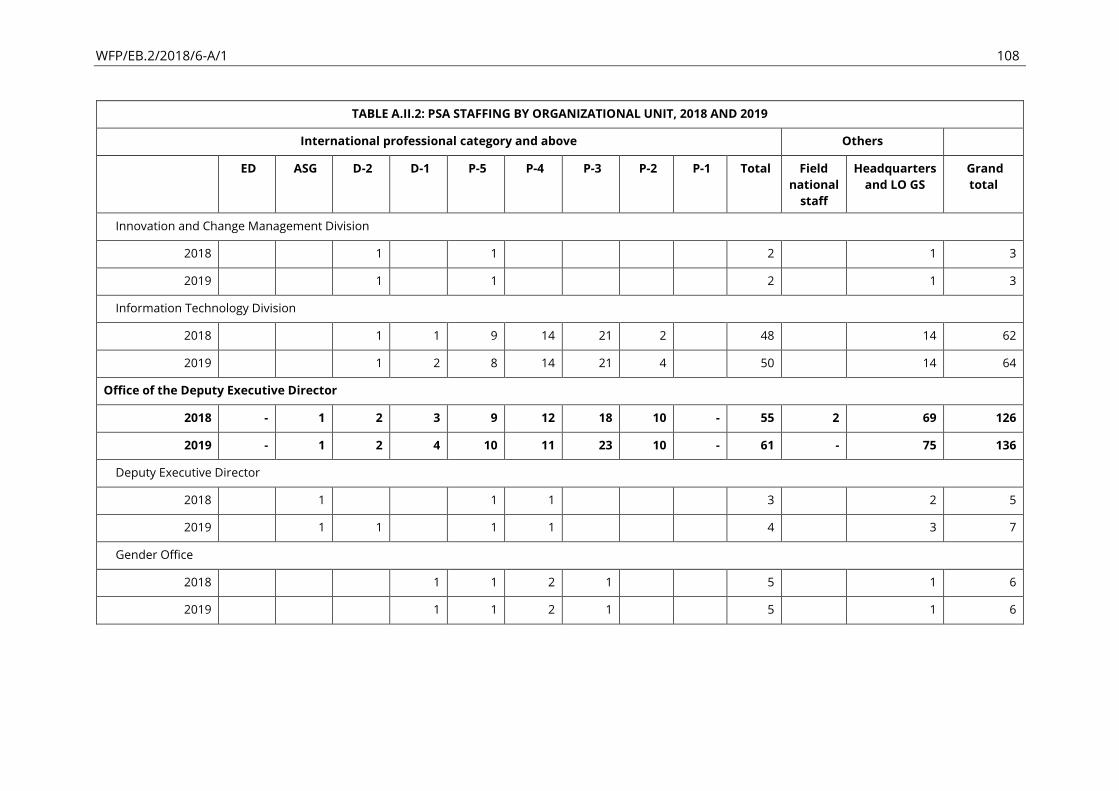
WFP/EB.2/2018/6-A/1 108
TABLE A.II.2: PSA STAFFING BY ORGANIZATIONAL UNIT, 2018 AND 2019
International professional category and above Others
ED ASG D-2 D-1 P-5 P-4 P-3 P-2 P-1 Total Field
national
staff
Headquarters
and LO GS
Grand
total
Innovation and Change Management Division
2018
1
1
2
1 3
2019
1
1
2
1 3
Information Technology Division
2018
1 1 9 14 21 2
48
14 62
2019
1 2 8 14 21 4
50
14 64
Office of the Deputy Executive Director
2018 - 1 2 3 9 12 18 10 - 55 2 69 126
2019 - 1 2 4 10 11 23 10 - 61 - 75 136
Deputy Executive Director
2018
1
1 1
3
2 5
2019
1 1
1 1
4
3 7
Gender Office
2018 1 1 2 1 5 1 6
2019 1 1 2 1 5 1 6
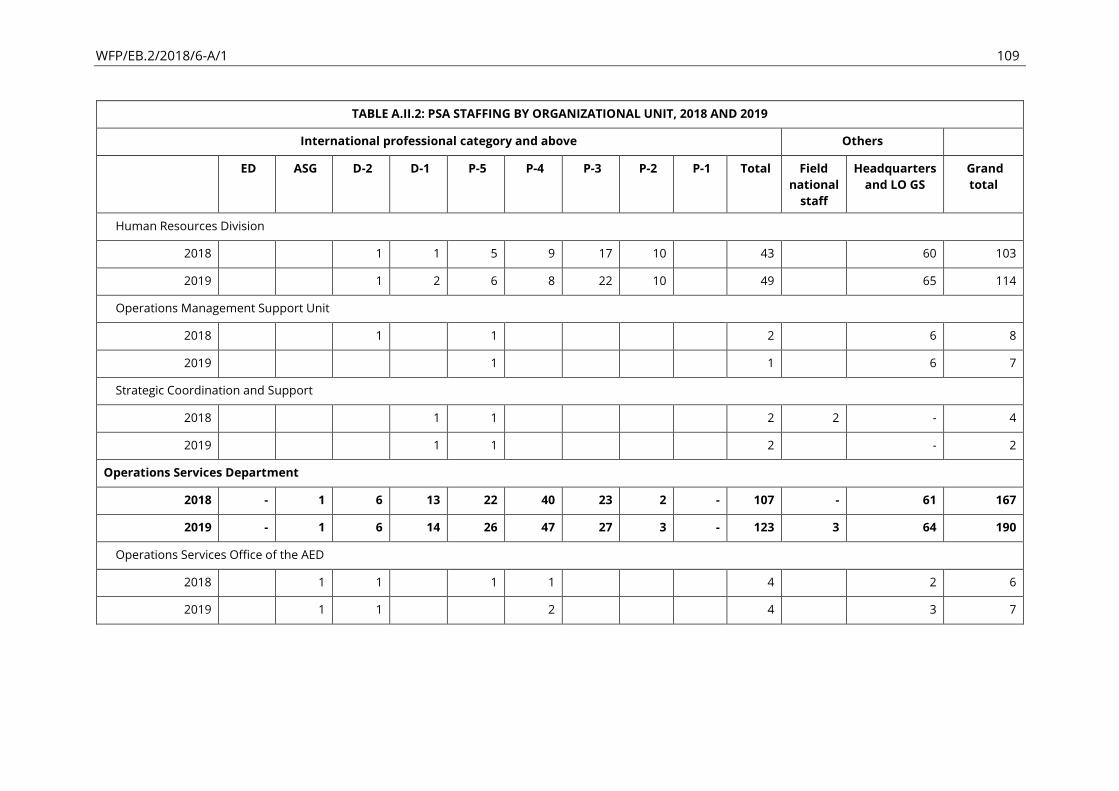
WFP/EB.2/2018/6-A/1 109
TABLE A.II.2: PSA STAFFING BY ORGANIZATIONAL UNIT, 2018 AND 2019
International professional category and above Others
ED ASG D-2 D-1 P-5 P-4 P-3 P-2 P-1 Total Field
national
staff
Headquarters
and LO GS
Grand
total
Human Resources Division
2018 1 1 5 9 17 10 43 60 103
2019 1 2 6 8 22 10 49 65 114
Operations Management Support Unit
2018
1
1
2
6 8
2019
1
1
6 7
Strategic Coordination and Support
2018
1 1
2 2 - 4
2019
1 1
2
- 2
Operations Services Department
2018 - 1 6 13 22 40 23 2 - 107 - 61 167
2019 - 1 6 14 26 47 27 3 - 123 3 64 190
Operations Services Office of the AED
2018
1 1
1 1
4
2 6
2019
1 1
2
4
3 7
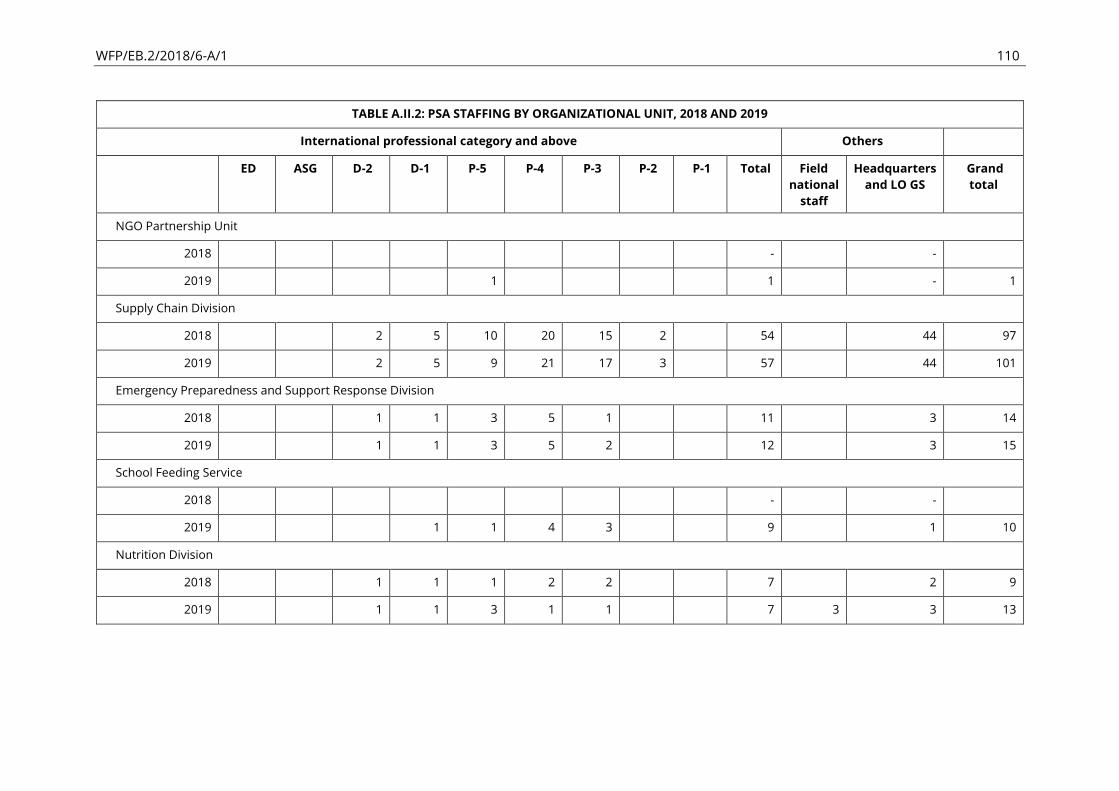
WFP/EB.2/2018/6-A/1 110
TABLE A.II.2: PSA STAFFING BY ORGANIZATIONAL UNIT, 2018 AND 2019
International professional category and above Others
ED ASG D-2 D-1 P-5 P-4 P-3 P-2 P-1 Total Field
national
staff
Headquarters
and LO GS
Grand
total
NGO Partnership Unit
2018 - -
2019 1 1 - 1
Supply Chain Division
2018
2 5 10 20 15 2
54
44 97
2019
2 5 9 21 17 3
57
44 101
Emergency Preparedness and Support Response Division
2018
1 1 3 5 1
11
3 14
2019
1 1 3 5 2
12
3 15
School Feeding Service
2018 - -
2019 1 1 4 3 9 1 10
Nutrition Division
2018
1 1 1 2 2
7
2 9
2019
1 1 3 1 1
7 3 3 13

WFP/EB.2/2018/6-A/1 111
TABLE A.II.2: PSA STAFFING BY ORGANIZATIONAL UNIT, 2018 AND 2019
International professional category and above Others
ED ASG D-2 D-1 P-5 P-4 P-3 P-2 P-1 Total Field
national
staff
Headquarters
and LO GS
Grand
total
Policy and Programme Division
2018
1 6 7 12 5
31
10 41
2019
1 6 9 14 4
34
10 44
Partnership and Governance Department
2018 - 1 4 9 13 24 26 9 - 86 2 48 136
2019 - 1 4 9 14 29 29 10 1 97 13 56 166
Partnership and Governance, Office of the AED
2018
1
1
1
3
2 5
2019
1
1 1
3
3 6
Executive Board Secretariat Division
2018
1 2 5 2
10
15 25
2019
1 2 5 3
1 12
15 27
Government Partnerships Division (Berlin, Paris, Seoul, Tokyo, UAE)
2018 - - 1 3 4 8 11 - - 27 1 16 44
2019 - - 1 3 5 9 12 1 - 31 - 16 47
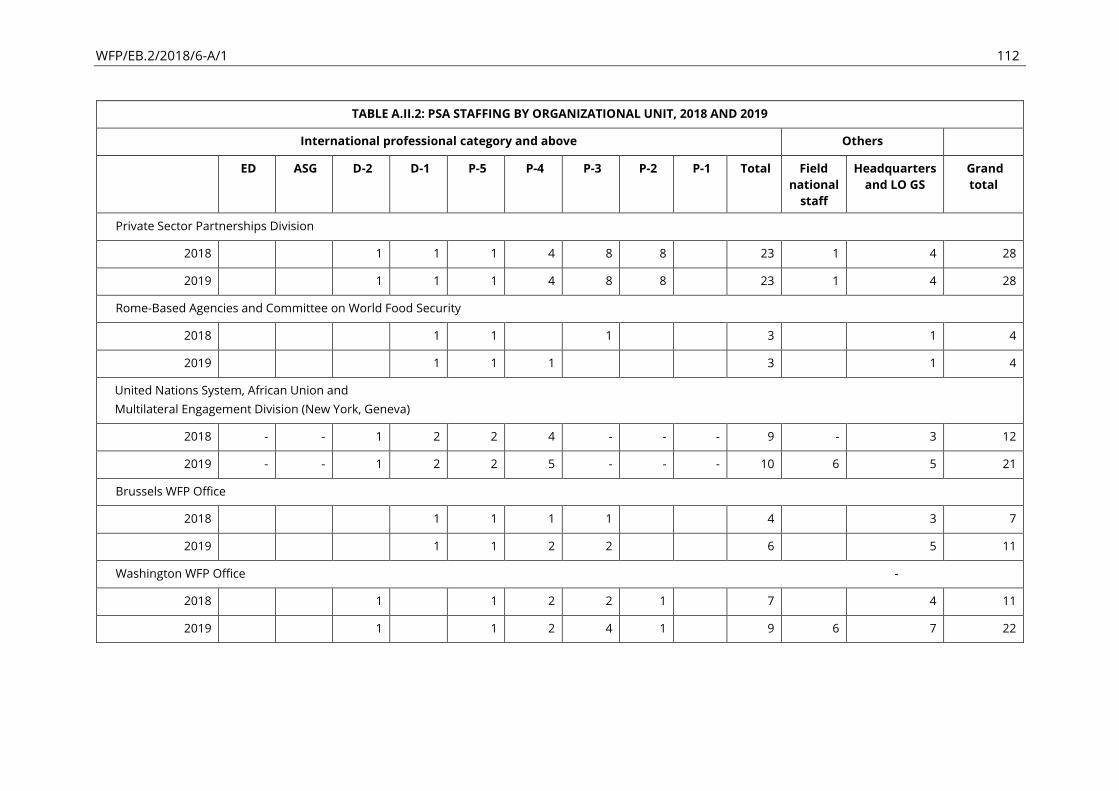
WFP/EB.2/2018/6-A/1 112
TABLE A.II.2: PSA STAFFING BY ORGANIZATIONAL UNIT, 2018 AND 2019
International professional category and above Others
ED ASG D-2 D-1 P-5 P-4 P-3 P-2 P-1 Total Field
national
staff
Headquarters
and LO GS
Grand
total
Private Sector Partnerships Division
2018
1 1 1 4 8 8
23 1 4 28
2019
1 1 1 4 8 8
23 1 4 28
Rome-Based Agencies and Committee on World Food Security
2018
1 1
1
3
1 4
2019
1 1 1
3
1 4
United Nations System, African Union and
Multilateral Engagement Division (New York, Geneva)
2018 - - 1 2 2 4 - - - 9 - 3 12
2019 - - 1 2 2 5 - - - 10 6 5 21
Brussels WFP Office
2018
1 1 1 1
4
3 7
2019
1 1 2 2
6
5 11
Washington WFP Office
-
2018
1
1 2 2 1
7
4 11
2019
1
1 2 4 1
9 6 7 22

WFP/EB.2/2018/6-A/1 113
TABLE A.II.2: PSA STAFFING BY ORGANIZATIONAL UNIT, 2018 AND 2019
International professional category and above Others
ED ASG D-2 D-1 P-5 P-4 P-3 P-2 P-1 Total Field
national
staff
Headquarters
and LO GS
Grand
total
Resource Management Department
-
2018 - 1 2 7 20 22 32 6 - 90 - 109 199
2019 - 1 2 8 20 28 30 8 - 97 2 124 223
Resource Management, Office of the CFO
-
2018
1
1
2
2 4
2019
1
1
2
2 4
Budget and Programming Division
-
2018
1 1 4 3 9
18
25 43
2019
1 1 5 3 8
18
29 47
Finance and Treasury Division (*)
-
2018
1 1 6 6 11 5
30
23 53
2019
1 2 5 7 10 5
30
23 53
Management Services Division
-
2018
1 3 1 4 1
10
22 32
2019
1 3 3 3 1
11
22 33
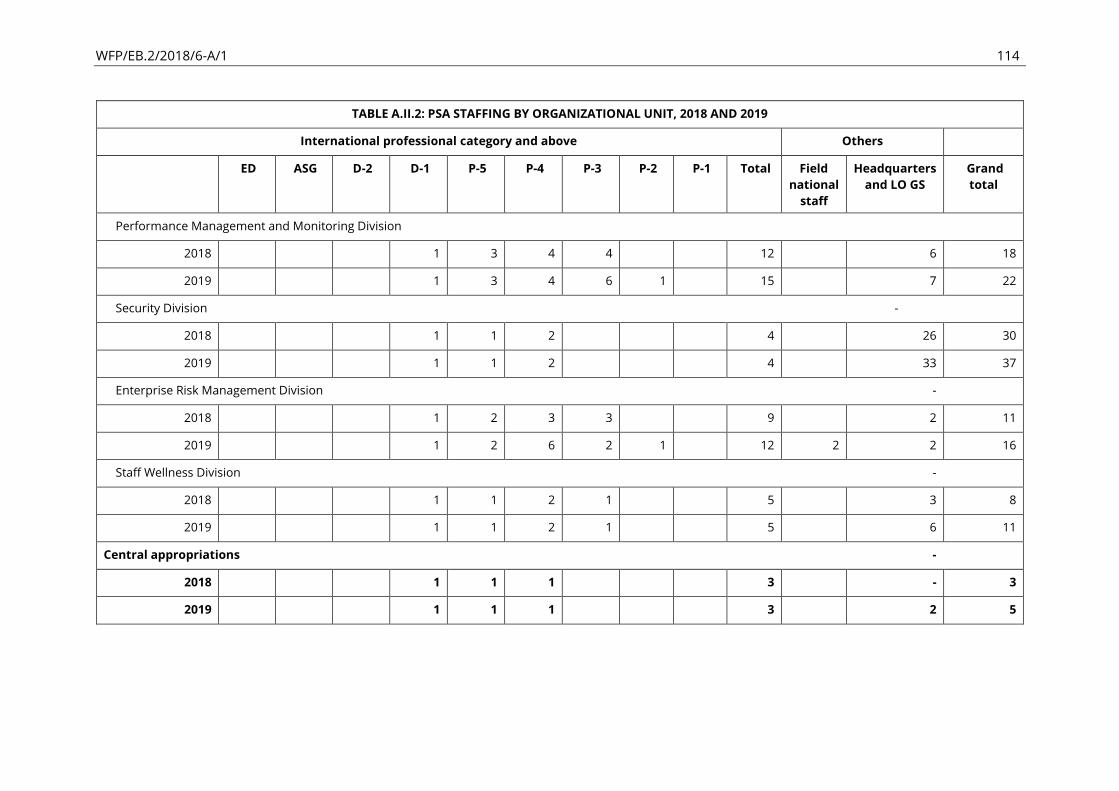
WFP/EB.2/2018/6-A/1 114
TABLE A.II.2: PSA STAFFING BY ORGANIZATIONAL UNIT, 2018 AND 2019
International professional category and above Others
ED ASG D-2 D-1 P-5 P-4 P-3 P-2 P-1 Total Field
national
staff
Headquarters
and LO GS
Grand
total
Performance Management and Monitoring Division
2018
1 3 4 4
12
6 18
2019
1 3 4 6 1
15
7 22
Security Division
-
2018
1 1 2
4
26 30
2019
1 1 2
4
33 37
Enterprise Risk Management Division
-
2018
1 2 3 3
9
2 11
2019
1 2 6 2 1
12 2 2 16
Staff Wellness Division
-
2018
1 1 2 1
5
3 8
2019
1 1 2 1
5
6 11
Central appropriations
-
2018
1 1 1
3
- 3
2019
1 1 1
3
2 5
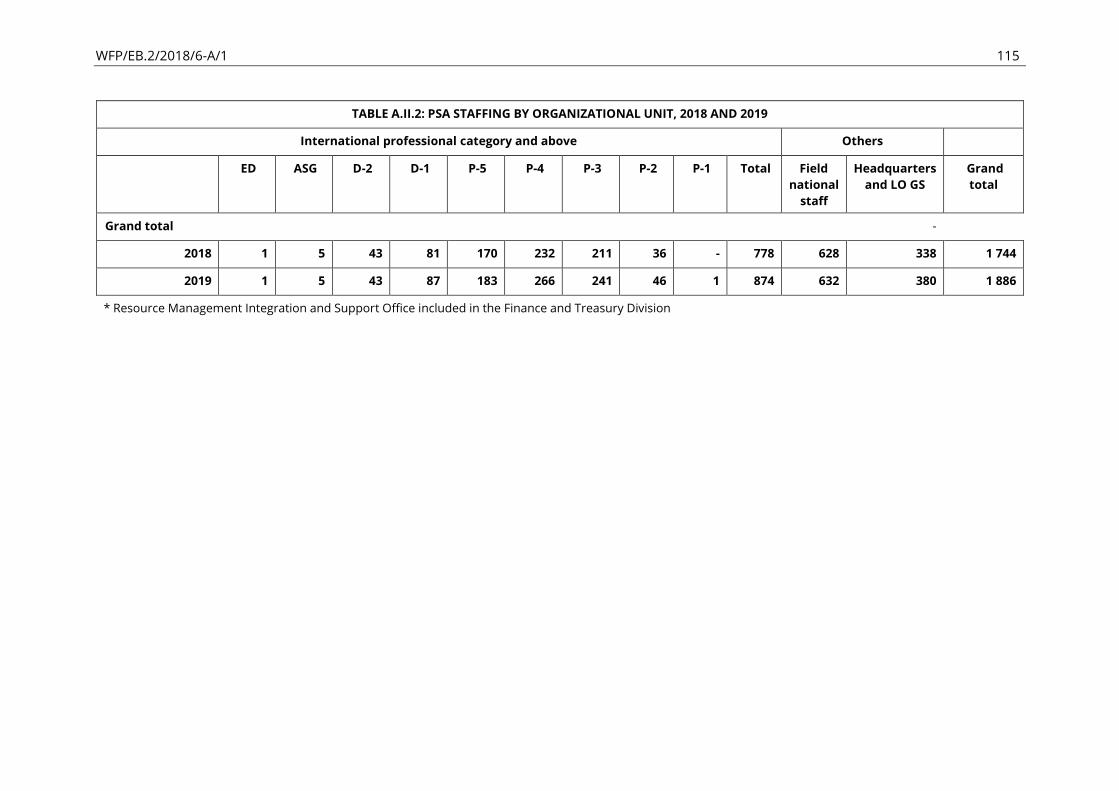
WFP/EB.2/2018/6-A/1 115
TABLE A.II.2: PSA STAFFING BY ORGANIZATIONAL UNIT, 2018 AND 2019
International professional category and above Others
ED ASG D-2 D-1 P-5 P-4 P-3 P-2 P-1 Total Field
national
staff
Headquarters
and LO GS
Grand
total
Grand total
-
2018 1 5 43 81 170 232 211 36 - 778 628 338 1 744
2019 1 5 43 87 183 266 241 46 1 874 632 380 1 886
* Resource Management Integration and Support Office included in the Finance and Treasury Division

WFP/EB.2/2018/6-A/1 116
TABLE A.II.3: PSA BUDGET BY ORGANIZATIONAL UNIT, 2018 AND 2019 (USD thousand)
Sta
ff c
ost
Lo
ca
l st
aff
Co
nsu
lta
ncy
Te
mp
. a
ssis
tan
ce
Ov
ert
ime
Du
ty t
rav
el
Tra
inin
g
Re
nta
l
Uti
liti
es,
cle
an
. a
nd
ma
int.
pre
mis
es
Off
ice
su
pp
lie
s a
nd
oth
er
off
ice
Ex
pe
nse
s
Co
mm
./IT
se
rvic
es
an
d e
qu
ipm
en
t
Insu
ran
ce
Ve
hic
le l
ea
sin
g a
nd
run
nin
g c
ost
s
Ho
spit
ali
ty
Se
rvic
es
fro
m o
the
r
ag
en
cie
s
Co
ntr
ibu
tio
n
Un
ite
d N
ati
on
s
bo
die
s
Oth
er
To
tal
oth
er
co
sts
TO
TA
L
Country offices
2018 29 963 6 000 650 750 27 1 400 100 1 200 500 650 1 000 10 750 10 450 350 34 834 48 681 78 644
2019 30 010 6 500 1 000 1 000 30 1 800 100 1 200 900 900 1 000 60 850 15 450 350 36 434 52 589 82 599
Country offices
2018 29 963 6 000 650 750 27 1 400 100 1 200 500 650 1 000 10 750 10 450 350 34 13 881 43 844
2019 30 010 6 500 1 000 1 000 30 1 800 100 1 200 900 900 1 000 60 850 15 450 350 1 234 17 389 47 399
Country offices technical adjustment
2018 0 0 0 0 0 0 0 0 0 0 0 0 0 0 0 0 34 800 34 800 34 800
2019 0 0 0 0 0 0 0 0 0 0 0 0 0 0 0 0 35 200 35 200 35 200
Regional bureaux
2018 42 321 13 713 1 638 271 62 2 454 831 1 199 701 471 1 944 51 270 25 189 72 1 003 24 893 67 215
2019 46 017 14 331 2 462 565 52 2 688 652 1 340 494 189 1 951 35 232 17 80 66 1 136 26 291 72 308
RB — Asia and the Pacific
2018 7 369 2 665 1 000 75 13 500 188 350 76 81 247 3 8 2 48 6 87 5 348 12 716
2019 7 432 2 546 1 280 0 8 701 65 379 71 60 633 3 8 3 50 6 0 5 811 13 243
RB — Middle East, North Africa, Eastern Europe and Central Asia
2018 8 666 1 534 162 76 20 311 200 220 85 0 406 7 72 8 7 10 281 3 399 12 065
2019 10 319 1 520 150 240 20 314 150 340 40 20 292 10 65 8 0 0 20 3 188 13 507

WFP/EB.2/2018/6-A/1 117
TABLE A.II.3: PSA BUDGET BY ORGANIZATIONAL UNIT, 2018 AND 2019 (USD thousand)
Sta
ff c
ost
Lo
ca
l st
aff
Co
nsu
lta
ncy
Te
mp
. a
ssis
tan
ce
Ov
ert
ime
Du
ty t
rav
el
Tra
inin
g
Re
nta
l
Uti
liti
es,
cle
an
. a
nd
ma
int.
pre
mis
es
Off
ice
su
pp
lie
s a
nd
oth
er
off
ice
Ex
pe
nse
s
Co
mm
./IT
se
rvic
es
an
d e
qu
ipm
en
t
Insu
ran
ce
Ve
hic
le l
ea
sin
g a
nd
run
nin
g c
ost
s
Ho
spit
ali
ty
Se
rvic
es
fro
m o
the
r
ag
en
cie
s
Co
ntr
ibu
tio
n
Un
ite
d N
ati
on
s
bo
die
s
Oth
er
To
tal
oth
er
co
sts
TO
TA
L
RB — West Africa
2018 8 037 1 458 96 29 10 652 343 24 56 208 353 21 44 5 43 0 175 3 513 11 550
2019 8 634 2 265 40 50 10 382 235 12 59 12 267 0 29 0 15 15 52 3 443 12 077
RB — Southern Africa
2018 5 783 3 036 35 30 10 430 100 235 314 72 350 10 70 10 0 20 100 4 822 10 605
2019 5 944 3 037 376 241 10 700 20 294 124 58 316 15 57 4 0 15 56 5 323 11 266
RB — East and Central Africa
2018 7 261 2 771 0 0 5 261 0 300 0 106 469 5 50 0 86 30 210 4 293 11 554
2019 8 393 2 952 484 4 0 235 31 300 100 30 286 5 50 0 0 20 147 4 644 13 036
RB — Latin America and the Caribbean
2018 5 206 2 250 345 61 4 300 0 71 170 5 120 5 27 0 5 6 150 3 519 8 725
2019 5 296 2 011 132 30 4 356 152 15 100 10 158 3 23 2 15 11 860 3 883 9 178
HQ
2018 130 447 1 300 14 830 4 088 297 4 128 1 610 1 265 2 790 2 031 7 639 263 207 41 190 298 3 903 44 879 175 326
2019 157 225 2 424 20 143 3 065 393 7 218 2 399 1 734 3 361 1 849 7 622 285 251 111 130 40 5 778 56 803 214 027
Executive Director and Independent Offices
2018 17 339 0 5 821 194 31 1 258 171 1 0 40 234 0 0 0 3 0 430 8 184 25 523
2019 24 663 180 5 262 203 61 1 695 350 0 28 238 787 0 0 30 3 30 319 9 186 33 849
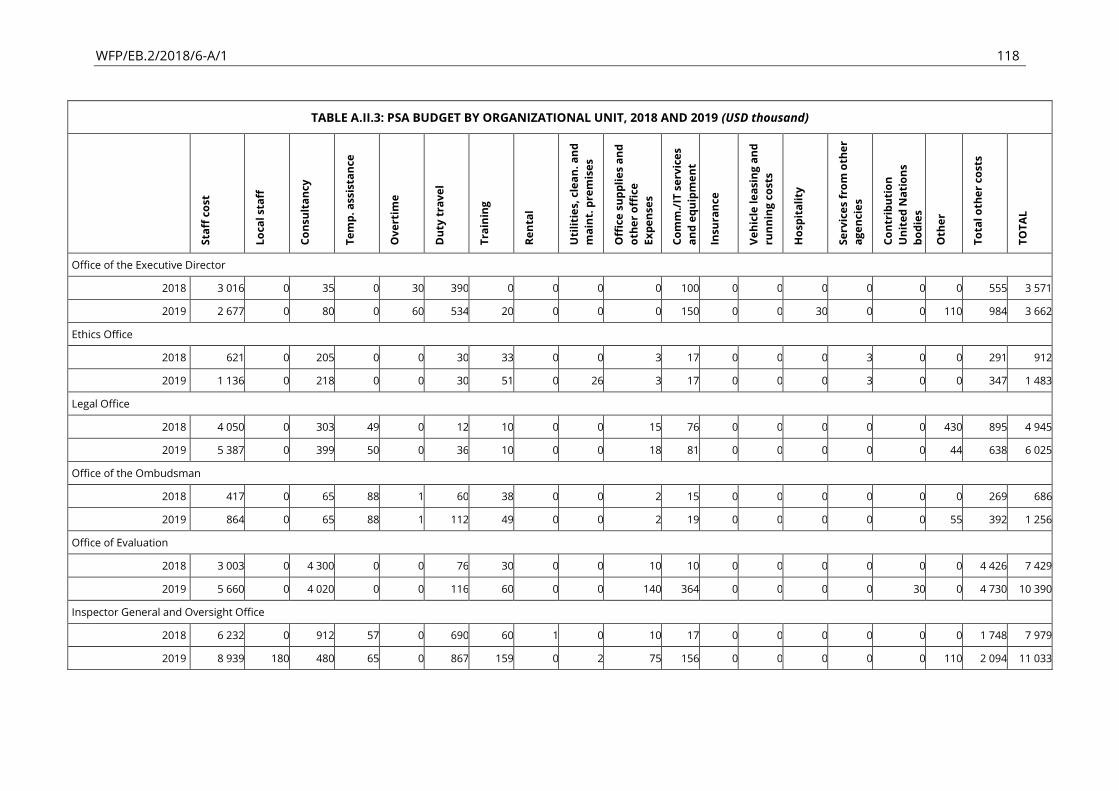
WFP/EB.2/2018/6-A/1 118
TABLE A.II.3: PSA BUDGET BY ORGANIZATIONAL UNIT, 2018 AND 2019 (USD thousand)
Sta
ff c
ost
Lo
ca
l st
aff
Co
nsu
lta
ncy
Te
mp
. a
ssis
tan
ce
Ov
ert
ime
Du
ty t
rav
el
Tra
inin
g
Re
nta
l
Uti
liti
es,
cle
an
. a
nd
ma
int.
pre
mis
es
Off
ice
su
pp
lie
s a
nd
oth
er
off
ice
Ex
pe
nse
s
Co
mm
./IT
se
rvic
es
an
d e
qu
ipm
en
t
Insu
ran
ce
Ve
hic
le l
ea
sin
g a
nd
run
nin
g c
ost
s
Ho
spit
ali
ty
Se
rvic
es
fro
m o
the
r
ag
en
cie
s
Co
ntr
ibu
tio
n
Un
ite
d N
ati
on
s
bo
die
s
Oth
er
To
tal
oth
er
co
sts
TO
TA
L
Office of the Executive Director
2018 3 016 0 35 0 30 390 0 0 0 0 100 0 0 0 0 0 0 555 3 571
2019 2 677 0 80 0 60 534 20 0 0 0 150 0 0 30 0 0 110 984 3 662
Ethics Office
2018 621 0 205 0 0 30 33 0 0 3 17 0 0 0 3 0 0 291 912
2019 1 136 0 218 0 0 30 51 0 26 3 17 0 0 0 3 0 0 347 1 483
Legal Office
2018 4 050 0 303 49 0 12 10 0 0 15 76 0 0 0 0 0 430 895 4 945
2019 5 387 0 399 50 0 36 10 0 0 18 81 0 0 0 0 0 44 638 6 025
Office of the Ombudsman
2018 417 0 65 88 1 60 38 0 0 2 15 0 0 0 0 0 0 269 686
2019 864 0 65 88 1 112 49 0 0 2 19 0 0 0 0 0 55 392 1 256
Office of Evaluation
2018 3 003 0 4 300 0 0 76 30 0 0 10 10 0 0 0 0 0 0 4 426 7 429
2019 5 660 0 4 020 0 0 116 60 0 0 140 364 0 0 0 0 30 0 4 730 10 390
Inspector General and Oversight Office
2018 6 232 0 912 57 0 690 60 1 0 10 17 0 0 0 0 0 0 1 748 7 979
2019 8 939 180 480 65 0 867 159 0 2 75 156 0 0 0 0 0 110 2 094 11 033
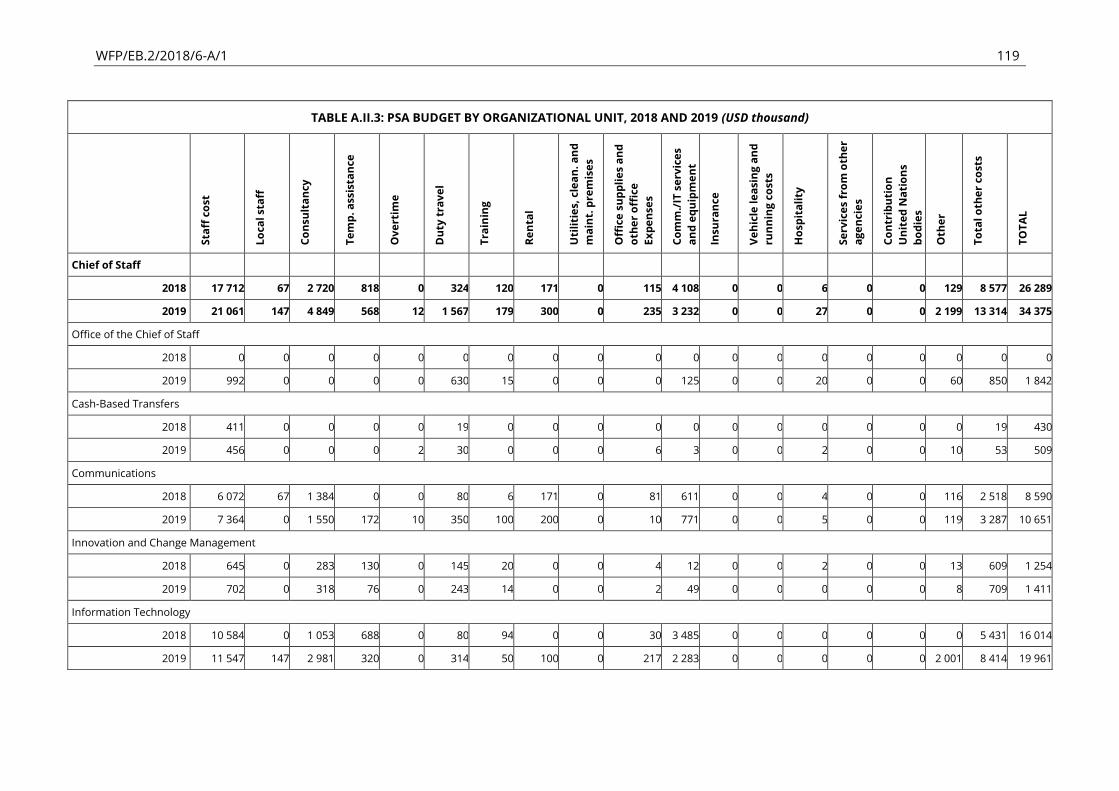
WFP/EB.2/2018/6-A/1 119
TABLE A.II.3: PSA BUDGET BY ORGANIZATIONAL UNIT, 2018 AND 2019 (USD thousand)
Sta
ff c
ost
Lo
ca
l st
aff
Co
nsu
lta
ncy
Te
mp
. a
ssis
tan
ce
Ov
ert
ime
Du
ty t
rav
el
Tra
inin
g
Re
nta
l
Uti
liti
es,
cle
an
. a
nd
ma
int.
pre
mis
es
Off
ice
su
pp
lie
s a
nd
oth
er
off
ice
Ex
pe
nse
s
Co
mm
./IT
se
rvic
es
an
d e
qu
ipm
en
t
Insu
ran
ce
Ve
hic
le l
ea
sin
g a
nd
run
nin
g c
ost
s
Ho
spit
ali
ty
Se
rvic
es
fro
m o
the
r
ag
en
cie
s
Co
ntr
ibu
tio
n
Un
ite
d N
ati
on
s
bo
die
s
Oth
er
To
tal
oth
er
co
sts
TO
TA
L
Chief of Staff
2018 17 712 67 2 720 818 0 324 120 171 0 115 4 108 0 0 6 0 0 129 8 577 26 289
2019 21 061 147 4 849 568 12 1 567 179 300 0 235 3 232 0 0 27 0 0 2 199 13 314 34 375
Office of the Chief of Staff
2018 0 0 0 0 0 0 0 0 0 0 0 0 0 0 0 0 0 0 0
2019 992 0 0 0 0 630 15 0 0 0 125 0 0 20 0 0 60 850 1 842
Cash-Based Transfers
2018 411 0 0 0 0 19 0 0 0 0 0 0 0 0 0 0 0 19 430
2019 456 0 0 0 2 30 0 0 0 6 3 0 0 2 0 0 10 53 509
Communications
2018 6 072 67 1 384 0 0 80 6 171 0 81 611 0 0 4 0 0 116 2 518 8 590
2019 7 364 0 1 550 172 10 350 100 200 0 10 771 0 0 5 0 0 119 3 287 10 651
Innovation and Change Management
2018 645 0 283 130 0 145 20 0 0 4 12 0 0 2 0 0 13 609 1 254
2019 702 0 318 76 0 243 14 0 0 2 49 0 0 0 0 0 8 709 1 411
Information Technology
2018 10 584 0 1 053 688 0 80 94 0 0 30 3 485 0 0 0 0 0 0 5 431 16 014
2019 11 547 147 2 981 320 0 314 50 100 0 217 2 283 0 0 0 0 0 2 001 8 414 19 961
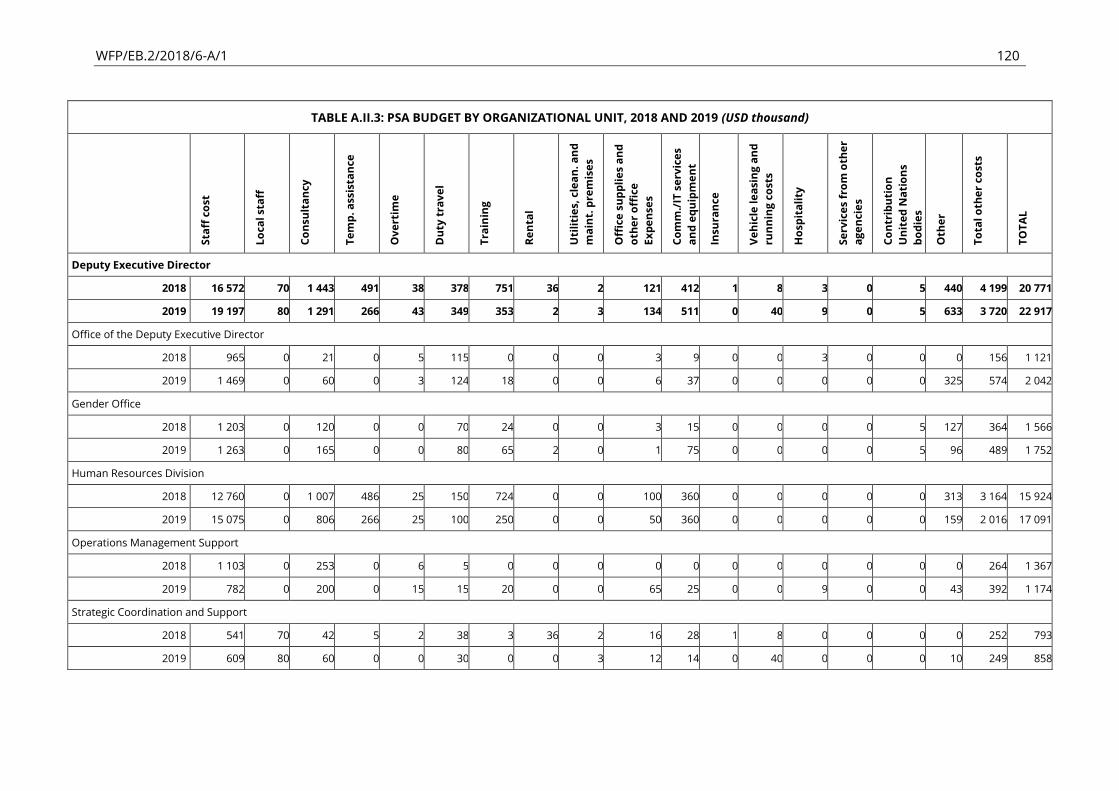
WFP/EB.2/2018/6-A/1 120
TABLE A.II.3: PSA BUDGET BY ORGANIZATIONAL UNIT, 2018 AND 2019 (USD thousand)
Sta
ff c
ost
Lo
ca
l st
aff
Co
nsu
lta
ncy
Te
mp
. a
ssis
tan
ce
Ov
ert
ime
Du
ty t
rav
el
Tra
inin
g
Re
nta
l
Uti
liti
es,
cle
an
. a
nd
ma
int.
pre
mis
es
Off
ice
su
pp
lie
s a
nd
oth
er
off
ice
Ex
pe
nse
s
Co
mm
./IT
se
rvic
es
an
d e
qu
ipm
en
t
Insu
ran
ce
Ve
hic
le l
ea
sin
g a
nd
run
nin
g c
ost
s
Ho
spit
ali
ty
Se
rvic
es
fro
m o
the
r
ag
en
cie
s
Co
ntr
ibu
tio
n
Un
ite
d N
ati
on
s
bo
die
s
Oth
er
To
tal
oth
er
co
sts
TO
TA
L
Deputy Executive Director
2018 16 572 70 1 443 491 38 378 751 36 2 121 412 1 8 3 0 5 440 4 199 20 771
2019 19 197 80 1 291 266 43 349 353 2 3 134 511 0 40 9 0 5 633 3 720 22 917
Office of the Deputy Executive Director
2018 965 0 21 0 5 115 0 0 0 3 9 0 0 3 0 0 0 156 1 121
2019 1 469 0 60 0 3 124 18 0 0 6 37 0 0 0 0 0 325 574 2 042
Gender Office
2018 1 203 0 120 0 0 70 24 0 0 3 15 0 0 0 0 5 127 364 1 566
2019 1 263 0 165 0 0 80 65 2 0 1 75 0 0 0 0 5 96 489 1 752
Human Resources Division
2018 12 760 0 1 007 486 25 150 724 0 0 100 360 0 0 0 0 0 313 3 164 15 924
2019 15 075 0 806 266 25 100 250 0 0 50 360 0 0 0 0 0 159 2 016 17 091
Operations Management Support
2018 1 103 0 253 0 6 5 0 0 0 0 0 0 0 0 0 0 0 264 1 367
2019 782 0 200 0 15 15 20 0 0 65 25 0 0 9 0 0 43 392 1 174
Strategic Coordination and Support
2018 541 70 42 5 2 38 3 36 2 16 28 1 8 0 0 0 0 252 793
2019 609 80 60 0 0 30 0 0 3 12 14 0 40 0 0 0 10 249 858
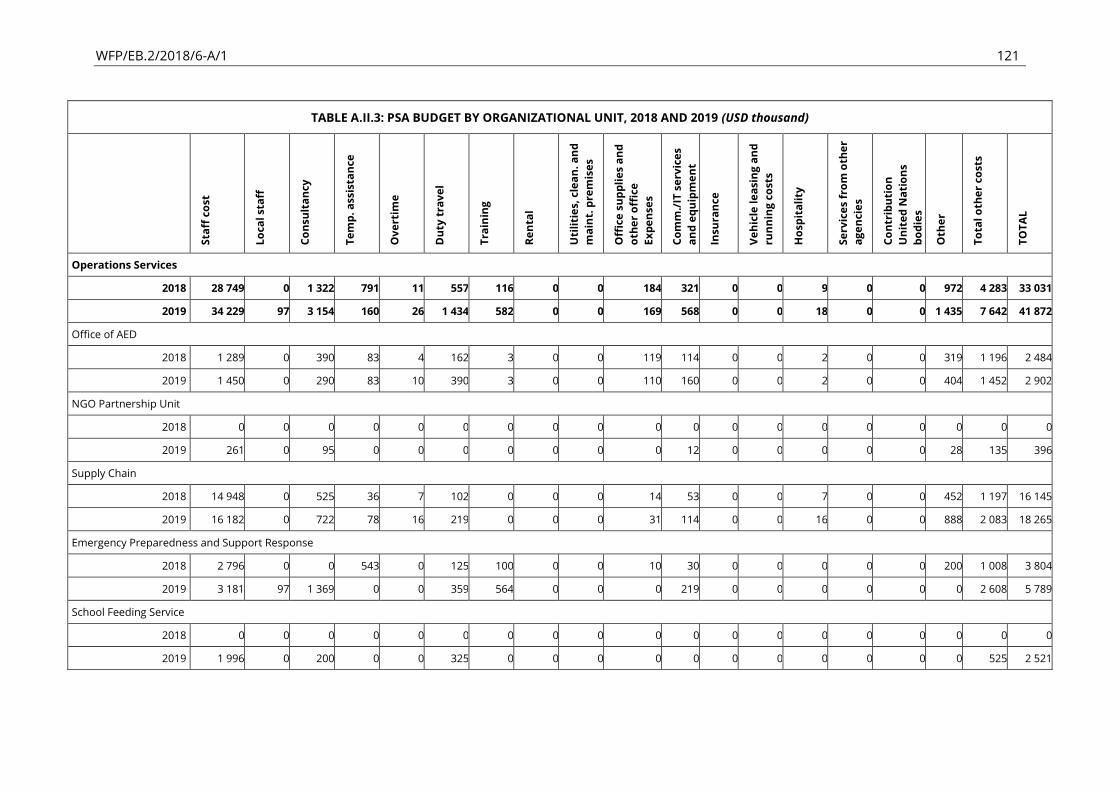
WFP/EB.2/2018/6-A/1 121
TABLE A.II.3: PSA BUDGET BY ORGANIZATIONAL UNIT, 2018 AND 2019 (USD thousand)
Sta
ff c
ost
Lo
ca
l st
aff
Co
nsu
lta
ncy
Te
mp
. a
ssis
tan
ce
Ov
ert
ime
Du
ty t
rav
el
Tra
inin
g
Re
nta
l
Uti
liti
es,
cle
an
. a
nd
ma
int.
pre
mis
es
Off
ice
su
pp
lie
s a
nd
oth
er
off
ice
Ex
pe
nse
s
Co
mm
./IT
se
rvic
es
an
d e
qu
ipm
en
t
Insu
ran
ce
Ve
hic
le l
ea
sin
g a
nd
run
nin
g c
ost
s
Ho
spit
ali
ty
Se
rvic
es
fro
m o
the
r
ag
en
cie
s
Co
ntr
ibu
tio
n
Un
ite
d N
ati
on
s
bo
die
s
Oth
er
To
tal
oth
er
co
sts
TO
TA
L
Operations Services
2018 28 749 0 1 322 791 11 557 116 0 0 184 321 0 0 9 0 0 972 4 283 33 031
2019 34 229 97 3 154 160 26 1 434 582 0 0 169 568 0 0 18 0 0 1 435 7 642 41 872
Office of AED
2018 1 289 0 390 83 4 162 3 0 0 119 114 0 0 2 0 0 319 1 196 2 484
2019 1 450 0 290 83 10 390 3 0 0 110 160 0 0 2 0 0 404 1 452 2 902
NGO Partnership Unit
2018 0 0 0 0 0 0 0 0 0 0 0 0 0 0 0 0 0 0 0
2019 261 0 95 0 0 0 0 0 0 0 12 0 0 0 0 0 28 135 396
Supply Chain
2018 14 948 0 525 36 7 102 0 0 0 14 53 0 0 7 0 0 452 1 197 16 145
2019 16 182 0 722 78 16 219 0 0 0 31 114 0 0 16 0 0 888 2 083 18 265
Emergency Preparedness and Support Response
2018 2 796 0 0 543 0 125 100 0 0 10 30 0 0 0 0 0 200 1 008 3 804
2019 3 181 97 1 369 0 0 359 564 0 0 0 219 0 0 0 0 0 0 2 608 5 789
School Feeding Service
2018 0 0 0 0 0 0 0 0 0 0 0 0 0 0 0 0 0 0 0
2019 1 996 0 200 0 0 325 0 0 0 0 0 0 0 0 0 0 0 525 2 521
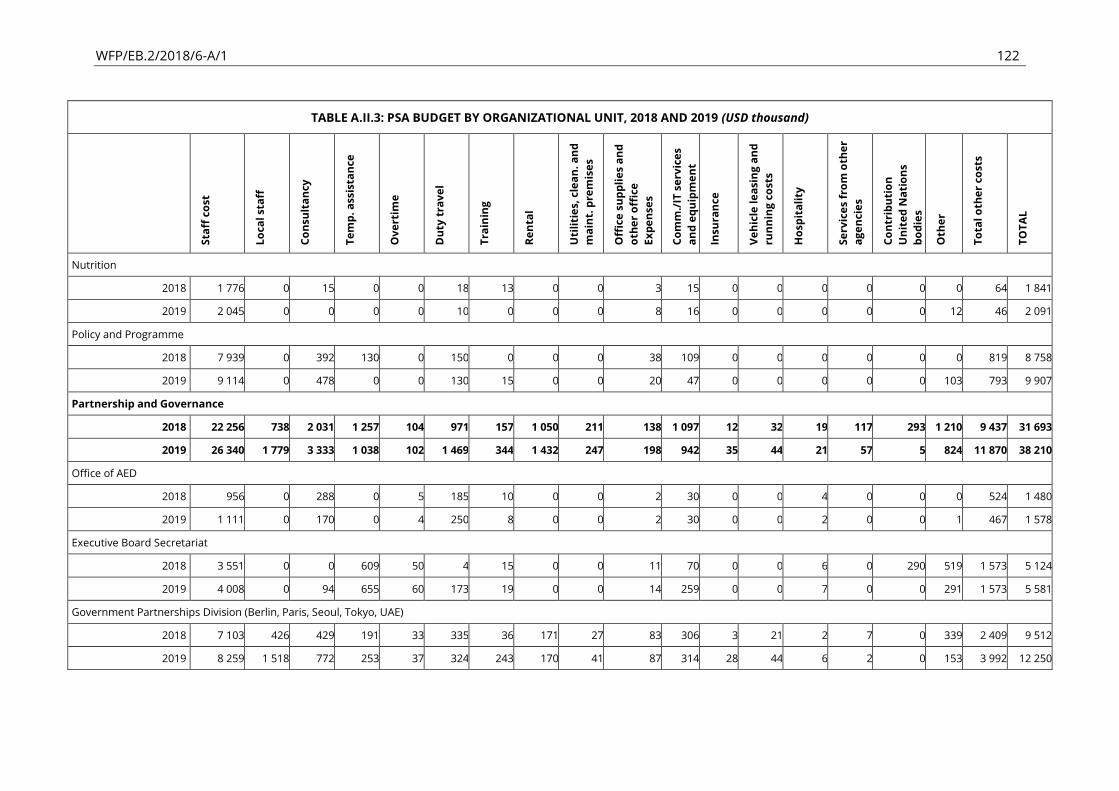
WFP/EB.2/2018/6-A/1 122
TABLE A.II.3: PSA BUDGET BY ORGANIZATIONAL UNIT, 2018 AND 2019 (USD thousand)
Sta
ff c
ost
Lo
ca
l st
aff
Co
nsu
lta
ncy
Te
mp
. a
ssis
tan
ce
Ov
ert
ime
Du
ty t
rav
el
Tra
inin
g
Re
nta
l
Uti
liti
es,
cle
an
. a
nd
ma
int.
pre
mis
es
Off
ice
su
pp
lie
s a
nd
oth
er
off
ice
Ex
pe
nse
s
Co
mm
./IT
se
rvic
es
an
d e
qu
ipm
en
t
Insu
ran
ce
Ve
hic
le l
ea
sin
g a
nd
run
nin
g c
ost
s
Ho
spit
ali
ty
Se
rvic
es
fro
m o
the
r
ag
en
cie
s
Co
ntr
ibu
tio
n
Un
ite
d N
ati
on
s
bo
die
s
Oth
er
To
tal
oth
er
co
sts
TO
TA
L
Nutrition
2018 1 776 0 15 0 0 18 13 0 0 3 15 0 0 0 0 0 0 64 1 841
2019 2 045 0 0 0 0 10 0 0 0 8 16 0 0 0 0 0 12 46 2 091
Policy and Programme
2018 7 939 0 392 130 0 150 0 0 0 38 109 0 0 0 0 0 0 819 8 758
2019 9 114 0 478 0 0 130 15 0 0 20 47 0 0 0 0 0 103 793 9 907
Partnership and Governance
2018 22 256 738 2 031 1 257 104 971 157 1 050 211 138 1 097 12 32 19 117 293 1 210 9 437 31 693
2019 26 340 1 779 3 333 1 038 102 1 469 344 1 432 247 198 942 35 44 21 57 5 824 11 870 38 210
Office of AED
2018 956 0 288 0 5 185 10 0 0 2 30 0 0 4 0 0 0 524 1 480
2019 1 111 0 170 0 4 250 8 0 0 2 30 0 0 2 0 0 1 467 1 578
Executive Board Secretariat
2018 3 551 0 0 609 50 4 15 0 0 11 70 0 0 6 0 290 519 1 573 5 124
2019 4 008 0 94 655 60 173 19 0 0 14 259 0 0 7 0 0 291 1 573 5 581
Government Partnerships Division (Berlin, Paris, Seoul, Tokyo, UAE)
2018 7 103 426 429 191 33 335 36 171 27 83 306 3 21 2 7 0 339 2 409 9 512
2019 8 259 1 518 772 253 37 324 243 170 41 87 314 28 44 6 2 0 153 3 992 12 250
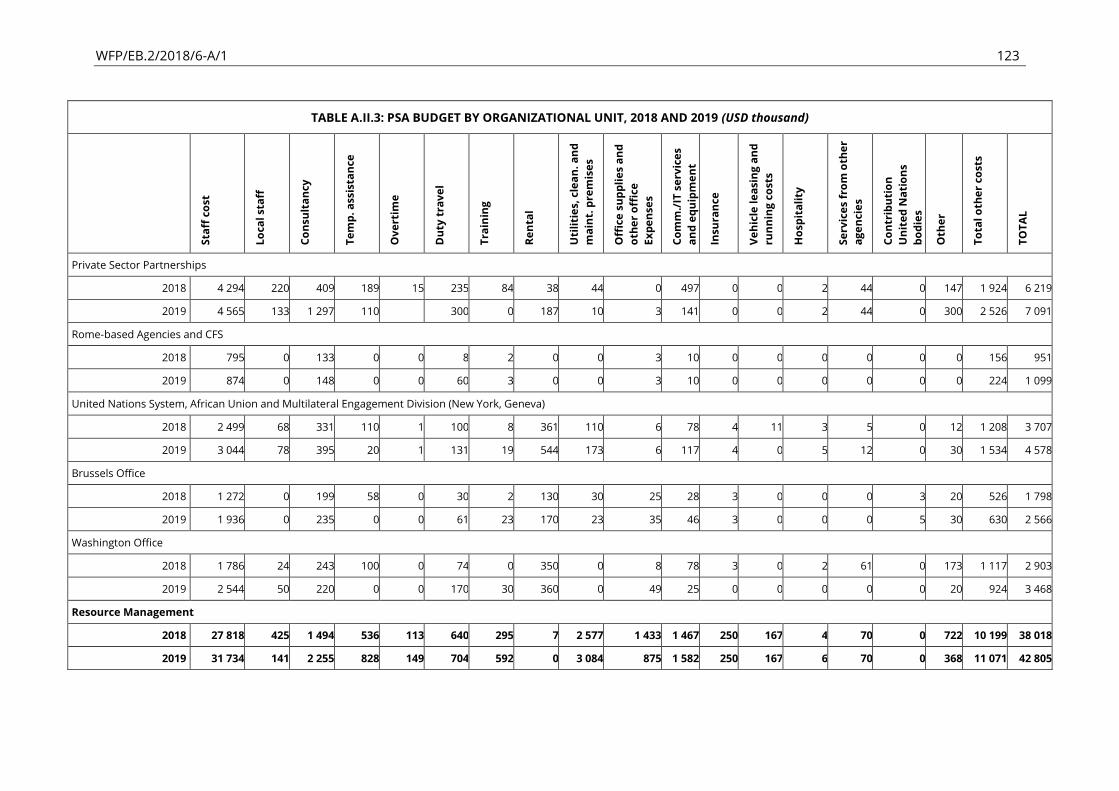
WFP/EB.2/2018/6-A/1 123
TABLE A.II.3: PSA BUDGET BY ORGANIZATIONAL UNIT, 2018 AND 2019 (USD thousand)
Sta
ff c
ost
Lo
ca
l st
aff
Co
nsu
lta
ncy
Te
mp
. a
ssis
tan
ce
Ov
ert
ime
Du
ty t
rav
el
Tra
inin
g
Re
nta
l
Uti
liti
es,
cle
an
. a
nd
ma
int.
pre
mis
es
Off
ice
su
pp
lie
s a
nd
oth
er
off
ice
Ex
pe
nse
s
Co
mm
./IT
se
rvic
es
an
d e
qu
ipm
en
t
Insu
ran
ce
Ve
hic
le l
ea
sin
g a
nd
run
nin
g c
ost
s
Ho
spit
ali
ty
Se
rvic
es
fro
m o
the
r
ag
en
cie
s
Co
ntr
ibu
tio
n
Un
ite
d N
ati
on
s
bo
die
s
Oth
er
To
tal
oth
er
co
sts
TO
TA
L
Private Sector Partnerships
2018 4 294 220 409 189 15 235 84 38 44 0 497 0 0 2 44 0 147 1 924 6 219
2019 4 565 133 1 297 110
300 0 187 10 3 141 0 0 2 44 0 300 2 526 7 091
Rome-based Agencies and CFS
2018 795 0 133 0 0 8 2 0 0 3 10 0 0 0 0 0 0 156 951
2019 874 0 148 0 0 60 3 0 0 3 10 0 0 0 0 0 0 224 1 099
United Nations System, African Union and Multilateral Engagement Division (New York, Geneva)
2018 2 499 68 331 110 1 100 8 361 110 6 78 4 11 3 5 0 12 1 208 3 707
2019 3 044 78 395 20 1 131 19 544 173 6 117 4 0 5 12 0 30 1 534 4 578
Brussels Office
2018 1 272 0 199 58 0 30 2 130 30 25 28 3 0 0 0 3 20 526 1 798
2019 1 936 0 235 0 0 61 23 170 23 35 46 3 0 0 0 5 30 630 2 566
Washington Office
2018 1 786 24 243 100 0 74 0 350 0 8 78 3 0 2 61 0 173 1 117 2 903
2019 2 544 50 220 0 0 170 30 360 0 49 25 0 0 0 0 0 20 924 3 468
Resource Management
2018 27 818 425 1 494 536 113 640 295 7 2 577 1 433 1 467 250 167 4 70 0 722 10 199 38 018
2019 31 734 141 2 255 828 149 704 592 0 3 084 875 1 582 250 167 6 70 0 368 11 071 42 805

WFP/EB.2/2018/6-A/1 124
TABLE A.II.3: PSA BUDGET BY ORGANIZATIONAL UNIT, 2018 AND 2019 (USD thousand)
Sta
ff c
ost
Lo
ca
l st
aff
Co
nsu
lta
ncy
Te
mp
. a
ssis
tan
ce
Ov
ert
ime
Du
ty t
rav
el
Tra
inin
g
Re
nta
l
Uti
liti
es,
cle
an
. a
nd
ma
int.
pre
mis
es
Off
ice
su
pp
lie
s a
nd
oth
er
off
ice
Ex
pe
nse
s
Co
mm
./IT
se
rvic
es
an
d e
qu
ipm
en
t
Insu
ran
ce
Ve
hic
le l
ea
sin
g a
nd
run
nin
g c
ost
s
Ho
spit
ali
ty
Se
rvic
es
fro
m o
the
r
ag
en
cie
s
Co
ntr
ibu
tio
n
Un
ite
d N
ati
on
s
bo
die
s
Oth
er
To
tal
oth
er
co
sts
TO
TA
L
Office of the AED and CFO
2018 763 0 0 0 4 69 0 0 0 1 9 0 0 4 0 0 0 87 850
2019 805 0 0 0 4 57 13 0 0 1 10 0 0 5 0 0 10 100 905
Budget and Programming
2018 5 918 0 105 74 22 9 0 0 0 5 15 0 0 0 0 0 0 230 6 149
2019 6 468 0 294 0 10 30 85 0 0 0 86 0 0 0 0 0 30 536 7 004
Finance and Treasury
2018 7 934 302 497 92 22 122 60 7 2 18 161 0 0 0 0 0 439 1 721 9 655
2019 8 435 0 912 428 45 105 95 0 0 30 159 0 0 0 0 0 35 1 809 10 244
Management Services
2018 3 923 123 530 329 0 100 50 0 2 575 1 394 1 130 250 167 0 70 0 0 6 718 10 641
2019 4 376 123 530 400 50 100 250 0 3 084 780 1 130 250 167 0 70 0 0 6 934 11 310
Performance Management and Monitoring
2018 3 091 0 95 41 15 45 23 0 0 8 40 0 0 0 0 0 0 267 3 358
2019 3 777 0 250 0 0 100 80 0 0 3 10 0 0 1 0 0 61 505 4 281
Security Division
2018 2 705 0 0 0 50 47 0 0 0 6 52 0 0 0 0 0 234 388 3 094
2019 3 405 18 0 0 40 71 33 0 0 61 105 0 0 0 0 0 92 421 3 826
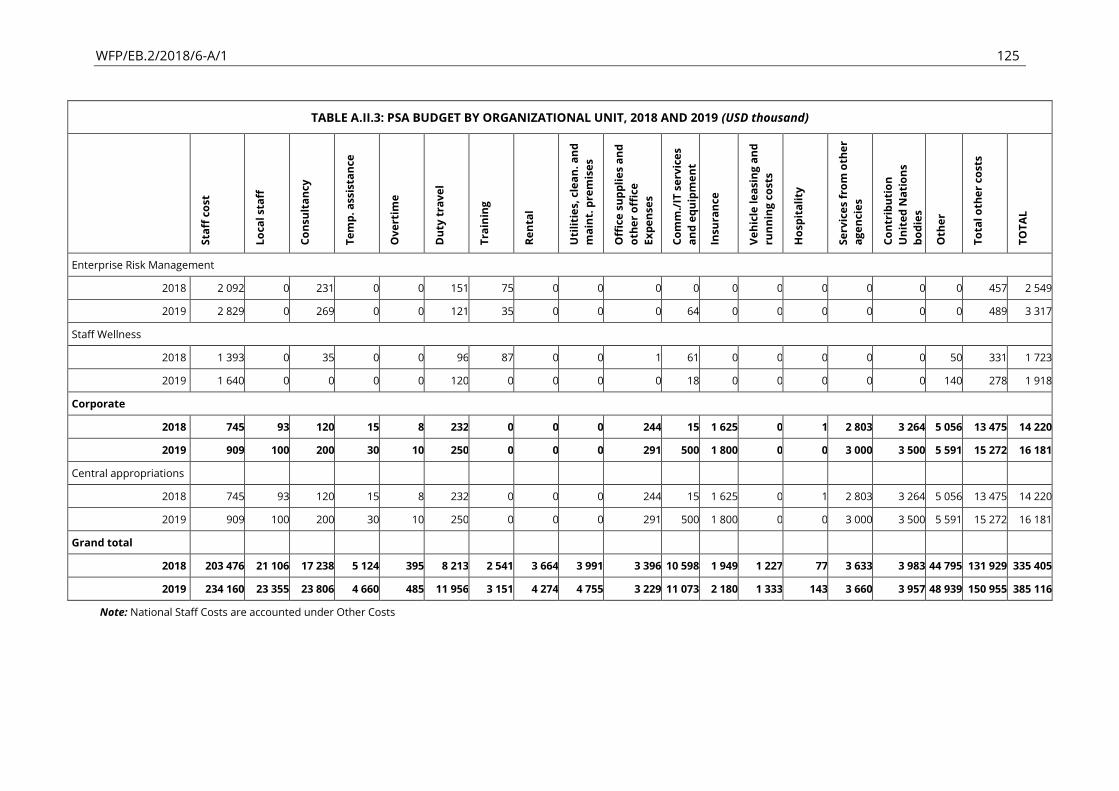
WFP/EB.2/2018/6-A/1 125
TABLE A.II.3: PSA BUDGET BY ORGANIZATIONAL UNIT, 2018 AND 2019 (USD thousand)
Sta
ff c
ost
Lo
ca
l st
aff
Co
nsu
lta
ncy
Te
mp
. a
ssis
tan
ce
Ov
ert
ime
Du
ty t
rav
el
Tra
inin
g
Re
nta
l
Uti
liti
es,
cle
an
. a
nd
ma
int.
pre
mis
es
Off
ice
su
pp
lie
s a
nd
oth
er
off
ice
Ex
pe
nse
s
Co
mm
./IT
se
rvic
es
an
d e
qu
ipm
en
t
Insu
ran
ce
Ve
hic
le l
ea
sin
g a
nd
run
nin
g c
ost
s
Ho
spit
ali
ty
Se
rvic
es
fro
m o
the
r
ag
en
cie
s
Co
ntr
ibu
tio
n
Un
ite
d N
ati
on
s
bo
die
s
Oth
er
To
tal
oth
er
co
sts
TO
TA
L
Enterprise Risk Management
2018 2 092 0 231 0 0 151 75 0 0 0 0 0 0 0 0 0 0 457 2 549
2019 2 829 0 269 0 0 121 35 0 0 0 64 0 0 0 0 0 0 489 3 317
Staff Wellness
2018 1 393 0 35 0 0 96 87 0 0 1 61 0 0 0 0 0 50 331 1 723
2019 1 640 0 0 0 0 120 0 0 0 0 18 0 0 0 0 0 140 278 1 918
Corporate
2018 745 93 120 15 8 232 0 0 0 244 15 1 625 0 1 2 803 3 264 5 056 13 475 14 220
2019 909 100 200 30 10 250 0 0 0 291 500 1 800 0 0 3 000 3 500 5 591 15 272 16 181
Central appropriations
2018 745 93 120 15 8 232 0 0 0 244 15 1 625 0 1 2 803 3 264 5 056 13 475 14 220
2019 909 100 200 30 10 250 0 0 0 291 500 1 800 0 0 3 000 3 500 5 591 15 272 16 181
Grand total
2018 203 476 21 106 17 238 5 124 395 8 213 2 541 3 664 3 991 3 396 10 598 1 949 1 227 77 3 633 3 983 44 795 131 929 335 405
2019 234 160 23 355 23 806 4 660 485 11 956 3 151 4 274 4 755 3 229 11 073 2 180 1 333 143 3 660 3 957 48 939 150 955 385 116
Note: National Staff Costs are accounted under Other Costs
WFP/EB.2/2018/6-A/1 126
ANNEX III
Details of the operational requirements and implementation plan for each country office
and, when consolidated, for the regional bureaux can be found on the WFP management
plan website.
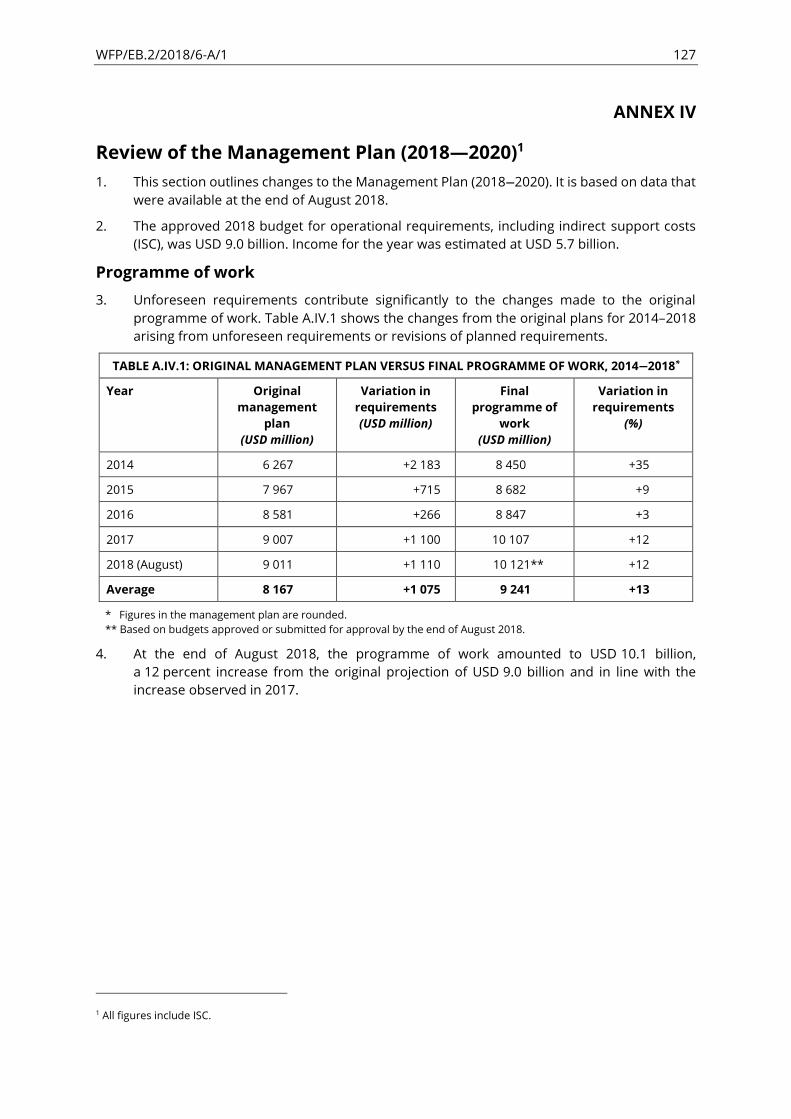
WFP/EB.2/2018/6-A/1 127
ANNEX IV
Review of the Management Plan (2018 2020)1
1. This section outlines changes to the Management Plan (2018—2020). It is based on data that
were available at the end of August 2018.
2. The approved 2018 budget for operational requirements, including indirect support costs
(ISC), was USD 9.0 billion. Income for the year was estimated at USD 5.7 billion.
Programme of work
3. Unforeseen requirements contribute significantly to the changes made to the original
programme of work. Table A.IV.1 shows the changes from the original plans for 2014 2018
arising from unforeseen requirements or revisions of planned requirements.
TABLE A.IV.1: ORIGINAL MANAGEMENT PLAN VERSUS FINAL PROGRAMME OF WORK, 2014—2018*
Year Original
management
plan
(USD million)
Variation in
requirements
(USD million)
Final
programme of
work
(USD million)
Variation in
requirements
(%)
2014 6 267 +2 183 8 450 +35
2015 7 967 +715 8 682 +9
2016 8 581 +266 8 847 +3
2017 9 007 +1 100 10 107 +12
2018 (August) 9 011 +1 110 10 121** +12
Average 8 167 +1 075 9 241 +13
* Figures in the management plan are rounded.
** Based on budgets approved or submitted for approval by the end of August 2018.
4. At the end of August 2018, the programme of work amounted to USD 10.1 billion,
a 12 percent increase from the original projection of USD 9.0 billion and in line with the
increase observed in 2017.
1 All figures include ISC.

WFP/EB.2/2018/6-A/1 128
5. Table A.IV.2 shows the changes from the original plan for 2018, by regional bureau.
TABLE A.IV.2: 2018 ORIGINAL MANAGEMENT PLAN VERSUS CURRENT PROGRAMME OF WORK,
BY REGIONAL BUREAU
Regional bureau Original
management
plan
(USD million)
Variation in
requirements
(USD million)
Current
programme of
work*
(USD million)
Variation in
requirements
(%)
Bangkok 570 +338 908 +59
Cairo 4 058 +97 4 155 +2
Dakar 1 163 +229 1 392 +20
Johannesburg 704 +109 813 +15
Nairobi 2 339 +266 2 605 +11
Panama 176 +72 248 +41
Total 9 011 +1 110 10 121 +12
* At end of August 2018.
6. The total increase of USD 1.1 billion between the original Management Plan
(2018 2020) and the current programme of work is the result primarily of unforeseen
requirements in Bangladesh, the Democratic Republic of the Congo, Ethiopia and Somalia,
with increased needs also observed in Yemen, although the increase is minor compared to
the magnitude of operational requirements in Yemen. These five countries account for
USD 687 million (62 percent) of the total increase. A notable increase also took place in
West Africa (USD 229 million), mostly because of the Sahel crisis affecting Burkina Faso,
Chad, Mali, Mauritania and the Niger. The Syrian Arab Republic registers the highest
decrease in absolute terms from the original projection, at USD 79 million or 9 percent.
7. Table A.IV.3 shows the largest increases in operational requirements in 2018.
TABLE A.IV.3: 2018 TOP FIVE INCREASES FOR UNFORESEEN REQUIREMENTS
Recipient
country
Original
management
plan
(USD million)
Variation in
requirements
(USD million)
Current
programme of
work*
(USD million)
Variation in
requirements
(%)
Bangladesh 57 +266 323 +467
Democratic
Republic of
the Congo
180 +126 306 +70
Yemen 1 084 +117 1 201 +11
Ethiopia 427 +101 528 +24
Somalia 343 +78 421 +23
Others 6 919 +423 7 342 +6
Total 9 011 +1 110 10 121 +12
* At end of August 2018.
WFP/EB.2/2018/6-A/1 129
8. The humanitarian situation in Myanmar and Bangladesh deteriorated in the second half
of 2017 (after submission of the management plans of WFP country offices) following the
outbreak of violence in Cox’s Bazar and Rakhine State, which caused widespread insecurity,
population displacement and continuous arrivals of refugees from Myanmar in Bangladesh.
The new wave of displacement led to acute food insecurity, with high humanitarian needs
on the Bangladesh side of the border. In late 2017, WFP activated a Level 3
emergency response with a view to augmenting capacity and ensuring that appropriate
resources were made available to the country offices in order to prevent a further
deterioration of the humanitarian situation.
9. The humanitarian situation in the Democratic Republic of the Congo deteriorated rapidly as
a result of conflict in the Kasai region, which caused widespread population displacement,
loss of livelihoods and the destruction of household assets, agricultural land and
community infrastructure, including health facilities. An estimated 1.4 million people were
internally displaced in Kasai and nearly 33,000 people are recorded as having fled to
neighbouring Angola as refugees. This situation led to growing food insecurity in the region,
with a resultant increase in needs. In light of this, in October 2017 WFP activated a Level 3
corporate response in order to support the scaling up of its activities, allowing
the enhancement of capacity on the ground with significant augmentation in the areas of
emergency coordination, security and supply chains.
10. The situation in the Horn of Africa, which affects primarily Ethiopia and Somalia,
has deteriorated in the course of 2018, leading to increased operational requirements.
In Ethiopia, heavy rainfall and flash floods since April 2018 in the Somali Region washed
away livestock, homes and public infrastructure, affecting an estimated 165,000 people.
In Somalia, despite a favourable rainy season in 2018, humanitarian needs remain high, with
the displacement of more than 2.6 million people more than 1 million of whom were
displaced in 2017 alone further depleting their resources and ability to withstand
further shocks.
Projected income
PSA budget
11. The Management Plan (2018 2020) was based on forecasted income of USD 5.7 billion
for 2018, which was expected to generate USD 342.9 million of ISC income at the new
ISC rate of 6.5 percent. The latest projections for contribution revenue in 2018, based on
donors’ commitments, are of USD 7.2 billion, generating USD 433.1 million in ISC income.
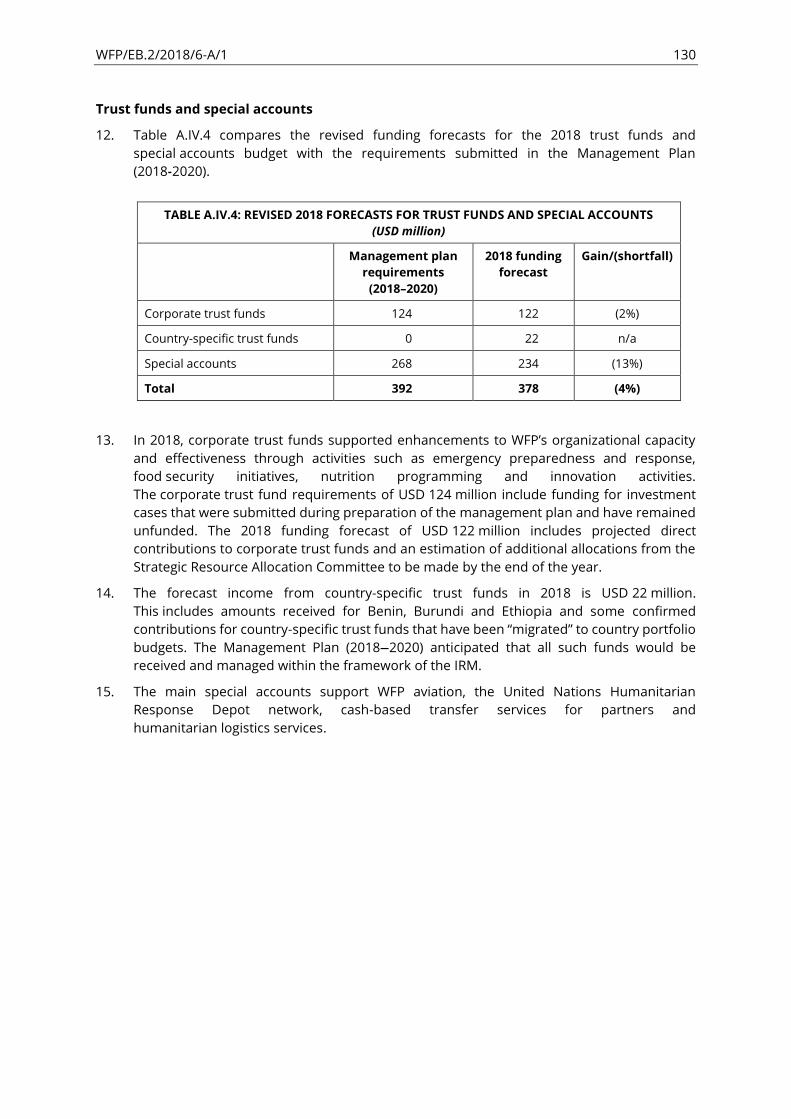
WFP/EB.2/2018/6-A/1 130
Trust funds and special accounts
12. Table A.IV.4 compares the revised funding forecasts for the 2018 trust funds and
special accounts budget with the requirements submitted in the Management Plan
(2018-2020).
TABLE A.IV.4: REVISED 2018 FORECASTS FOR TRUST FUNDS AND SPECIAL ACCOUNTS
(USD million)
Management plan
requirements
(2018 2020)
2018 funding
forecast
Gain/(shortfall)
Corporate trust funds 124 122 (2%)
Country-specific trust funds 0 22 n/a
Special accounts 268 234 (13%)
Total 392 378 (4%)
13. In 2018, corporate trust funds supported enhancements to WFP’s organizational capacity and effectiveness through activities such as emergency preparedness and response,
food security initiatives, nutrition programming and innovation activities.
The corporate trust fund requirements of USD 124 million include funding for investment
cases that were submitted during preparation of the management plan and have remained
unfunded. The 2018 funding forecast of USD 122 million includes projected direct
contributions to corporate trust funds and an estimation of additional allocations from the
Strategic Resource Allocation Committee to be made by the end of the year.
14. The forecast income from country-specific trust funds in 2018 is USD 22 million.
This includes amounts received for Benin, Burundi and Ethiopia and some confirmed
contributions for country-specific trust funds that have been migrated to country portfolio budgets. The Management Plan (2018—2020) anticipated that all such funds would be
received and managed within the framework of the IRM.
15. The main special accounts support WFP aviation, the United Nations Humanitarian
Response Depot network, cash-based transfer services for partners and
humanitarian logistics services.
WFP/EB.2/2018/6-A/1 131
ANNEX V
Office of Evaluation’s work plan 2019 2021
Introduction
1. This annex sets out the Office of Evaluation’s (OEV’s) proposed programme of work for 2019—2021. It is the third work plan to implement the corporate evaluation strategy1 that
flows from the WFP evaluation policy (2016—2021)2 and the Evaluation Charter.3 Together,
these documents establish the vision, strategic direction and normative and accountability
framework of the evaluation function. They clarify the institutional arrangements and
implementation plan for embedding evaluation in a phased approach throughout
WFP through expansion of the centralized evaluation function and its augmentation with
a demand-led decentralized evaluation function.
2. The evaluation function reflects the determination and ambition of WFP’s leadership to meet global expectations for independent evaluation that supports accountability for results,
organizational learning and evidence-based decision making throughout the organization in
the era of the 2030 Agenda.
3. Given OEV’s responsibility for overseeing the entire evaluation function, this annex begins with the estimated corporate resources required for the evaluation function, which is
followed by OEV’s divisional work plan.
Evaluation function overall requirements
4. The work plan has a three-year timeframe (2019—2021) in accordance with
WFP’s Management Plan and continues the phased approach to resourcing and
implementation laid out in the evaluation policy and the related corporate
evaluation strategy.
5. Deliverables for 2019 and the perspectives for 2020—2021 described in this document are
based on the strategic priorities set by the evaluation policy, aligned with the evaluation
requirements related to WFP’s transformative package the Integrated Road Map (IRM).4
6. In 2018 OEV was restructured in order to manage the increase in the number of
decentralized and centralized evaluations envisaged in the coverage norms of the
evaluation policy. In allocating its human and financial resources in 2019, OEV proposes to
prioritize the establishment of adequate fixed-term staff capacity and a quality assurance
mechanism in order to cover the increased volume of centralized evaluations, specifically:
1 Endorsed by the Executive Management Group, April 2016.
2 WFP/EB.2/2015/4-A/Rev.1.
3 Issued by the Executive Director, May 2016.
4 The IRM was approved by the Board at its 2016 second regular session (see decisions 2016/EB.2/2, 2016/EB.2/3,
2016/EB.2/4 and 2016/EB.2/7, in WFP/EB.2/2016/15). It comprises the WFP Strategic Plan (2017 2021), the Policy on
Country Strategic Plans, the Financial Framework Review, including country portfolio budgets, and the Corporate Results
Framework (2017 2021).

WFP/EB.2/2018/6-A/1 132
➢ a sharp increase in the number of country portfolio evaluations (CPEs) required by
WFP’s Policy on Country Strategic Plans,5 which will rise from approximately 4 per year
to between 12 and 15 per year from 2020 onwards;6
➢ increased coverage of evaluations of corporate emergency responses, as requested
by the Executive Board;
➢ an increased number of global evaluations of policies and of work in strategically
important thematic areas per year in order to make sufficient progress towards
the coverage norms; and
➢ implementation of the new impact evaluation strategy, which covers both centralized
and decentralized impact evaluations.
7. It is proposed to increase the evaluation surge capacity at regional levels in order to support
the six regional evaluation officers in meeting the increase in demand for decentralized
evaluations, which has been more rapid than expected.
8. Table A.V.1 shows the evolution of resource requirements for the evaluation function
throughout WFP from the start of the evaluation policy in 2016, and with estimates for
2019-2021. The future estimated figures are based on evaluation policy coverage norms,
current trends in regional bureaux, best assumptions and associated projections.
Plans remain very fluid, particularly in light of the approval of CSPs throughout 2018, which
has implications for the planning of CSPEs and decentralized evaluations. OEV will
endeavour to respond flexibly to trends as they emerge during implementation of the IRM
in the context of the 2030 Agenda, based on the human and financial resources available.
9. The table also highlights the diversification of funding sources for the evaluation function.
Two new sources have been included from 2019 onwards:
➢ Programme sources ([3] in the table) are funds for CSPEs that are sourced from the
country portfolio budgets.
➢ Regional investment case ([6]): In 2018, OEV coordinated the preparation of
a consolidated investment case aimed at supporting the evaluation function in
meeting the demand for decentralized evaluations in all regions. This source is
therefore pending the funding decision of WFP management.
TABLE A.V.1: ESTIMATED OVERALL RESOURCE REQUIREMENTS FOR THE EVALUATION FUNCTION
(September 2018)
Main elements Funding
source
USD million
2016 2017 2018 2019 2020 2021
OEV (centralized evaluation
(CE) and decentralized
evaluation (DE))
Resources available Requirement
OEV work plan PSA staff
costs 2.40 3.05 3.00 5.68 6.38 6.99
5 Approved by the Board at its 2016 second regular session (WFP/EB.2/2016/4-C/1/Rev.1), the CSP policy requires an
evaluation for every CSP.
6 As the scope of these evaluations will be WFP’s country strategic plans, they will be referred to as country strategic plan evaluations (CSPEs) instead of CPEs from 2019 onwards.

WFP/EB.2/2018/6-A/1 133
TABLE A.V.1: ESTIMATED OVERALL RESOURCE REQUIREMENTS FOR THE EVALUATION FUNCTION
(September 2018)
Main elements Funding
source
USD million
2016 2017 2018 2019 2020 2021
PSA other
costs 3.72 5.33 4.82 5.90 7.42 8.04
Multilateral
funding for
support to
DE system
[1]
- 0.50 0.59 0.50 0.50
Programme
sources [2] 2.84 -
Programme
sources [3] 2.00 3.25 3.25
OEV – subtotal 8.96 8.38 8.32 14.17 17.55 18.78
Established staff positions 12 15 15 29 32 32
Staff costs as % of total
OEV budget 26.79% 36.40% 36.06% 40.08% 36.35% 37.22%
Non-OEV (support to DEs)
Regional evaluation
officers PSA - 1.60 1.61 1.64 1.64 1.64
Contingency evaluation
fund [4] PSA - 1.50 1.50 1.50 1.50 1.50
Decentralized evaluations
[5]
Programme
sources 2.96 5.33 4.76 3.73 3.73
Regional investment case
[6] tbc 1.69 1.69 1.69
Outside OEV – subtotal 6.06 8.44 9.59 8.56 8.56
Total 14.44 16.76 23.76 26.11 27.34
Total as % of WFP
contributions income [7]
0.15%
0.24%
0.23%
0.35%
0.38%
0.40%
CE = centralized evaluation; DE = decentralized evaluation; PSA = programme support and administrative.
[1] Multilateral funding for supporting the decentralized evaluation system.
[2] In 2016, constituted project funds for the operation evaluations series.
[3] From 2019, constitutes programme funds for CSPEs sourced from country portfolio budgets.
[4] Top-up funding for decentralized evaluations.
[5] Costs of decentralized evaluations do not include the cost of evaluation management by WFP staff.
Figures for 2017 are based on the number of decentralized evaluations that started (preparation phase) in 2017.
Figures for 2018 are based on the number of decentralized evaluations that started or are expected to start in 2018.
Figures for 2019, 2020 and 2021 are projections based on the planned number of decentralized evaluations.
[6] Carry forward from the regional investment case for 2019 to be budgeted again based on actual needs.
[7] Figures for 2016 and 2017 are based on actual contributions income. Figure for 2018 is based on projected
contributions income as presented at the second informal consultation on the Management Plan (2019—2021)
(6 September 2018). Figures for 2019, 2020 and 2021 are based on projected contributions income of USD 6.8 million
per year, as presented at the first informal consultation on the Management Plan (2019—2021) (25 July 2018).
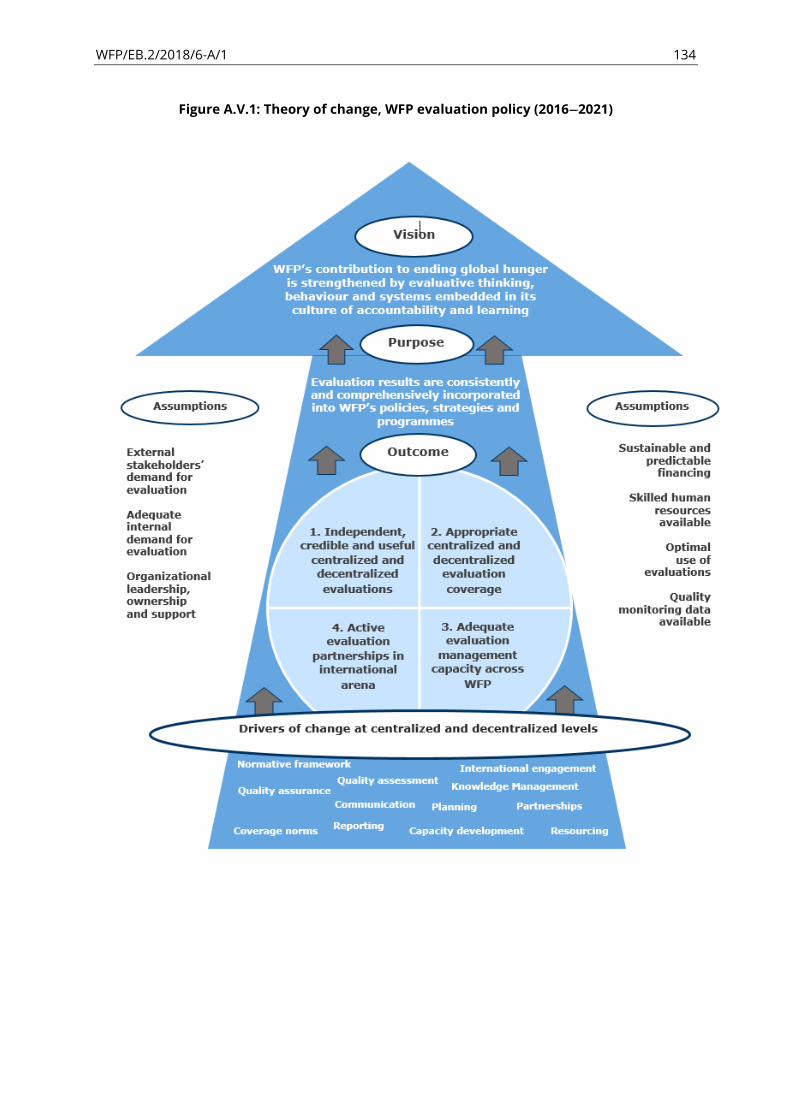
WFP/EB.2/2018/6-A/1 134
Figure A.V.1: Theory of change, WFP evaluation policy (2016—2021)
WFP/EB.2/2018/6-A/1 135
OEV’S work plan for 2019 2021: Summary
10. The remainder of this document concerns OEV’s work plan for 2019 and the outlook for OEV in 2020 2021. The outlook is provisional and will be reviewed annually to take into account
the rollout of the IRM, developments outside WFP and the resources available
for evaluation. Each of the following items is linked to one or more outcomes in the
evaluation policy theory of change (see figure A.V.1).
11. In summary, in 2019, OEV will deliver:
A. independent evidence that supports accountability and learning and is generated
through a balanced programme of complex centralized evaluations and associated
synthesis reports, selected in line with the evaluation policy’s phased approach to the application of coverage norms, priority evidence and learning needs, the capacity
of WFP to make changes recommended by evaluations and the volume of resources
available for evaluation related to outcome 1 in the policy;
B. expanded guidance, technical advice, quality support and capacity building systems
for the appropriate planning, funding and conduct of increasing numbers
of centralized and decentralized evaluations related to outcomes 1 and 2;
C. expanded rollout of the multi-year programme on developing evaluation capacity
throughout WFP, in collaboration with regional bureaux and the Human Resources
Division, and increased staffing for the evaluation function through the continuation
of a monitoring and evaluation (M&E) workforce planning exercise and the
establishment of an M&E Future International Talent (FIT) Pool, both initiated in 2018
jointly with the Performance Management and Monitoring Division and the
Human Resources Division related to outcome 3;
D. continued contribution to and shaping of the United Nations system-wide
arrangements for evaluation at the global, regional and country levels and inter-
agency humanitarian evaluations (IAHEs), in line with the Sustainable Development
Goals (SDGs) and the ongoing United Nations reform agenda led by the Secretary-
General; engagement in strategically relevant evaluation partnerships and
networks in the international arena; and provision of advice to regional bureaux and
country offices on regional and national evaluation partnerships and networks
related to outcome 4;
E. application and embedding of institutional arrangements and systems for the overall
evaluation function set by the Evaluation Charter related to all outcomes;
F. enhancement of the evaluation knowledge management system in order to promote
and facilitate the use of evaluation evidence in policy and programme design and
approval, especially the CSP process, supporting the growth of WFP’s learning and
accountability culture related to the overall purpose of the policy and a
cross-cutting work stream in the evaluation strategy; and
G. application and maintenance of information and reporting systems that enable
oversight of the entire evaluation function, both centralized and decentralized7
related to all outcomes and a cross-cutting work stream in the evaluation strategy.
7 Subject to there being no significant delays in application of the new financial framework.

WFP/EB.2/2018/6-A/1 136
Resources for OEV’s 2019 work plan 12. The total resources required by OEV for 2019 in order to ensure balanced progress towards
each of the four interdependent outcomes of WFP’s evaluation policy, with implementation phased in accordance with the corporate evaluation strategy, are currently costed at
USD 14.17 million (see table A.V.1). The total resources so far available to OEV from all
sources for the 2019 work plan are USD 12.98 million: USD 10.39 million from the
programme support and administrative (PSA) budget with a further USD 2 million from
programme sources for CSPEs, which will be sourced from country portfolio budgets and
USD 0.59 million from multilateral funding (see table A.V.2).
TABLE A.V.2: RESOURCES AVAILABLE TO OEV FOR 2019 WORK PLAN (USD million)
Main elements Funding source Comparison
2016
Comparison
2017
2018 2019
OEV work plan PSA base — total 6.12 6.88 7.43 10.39
PSA base — staff costs 2.40 3.05 3.00 5.66
PSA base — other costs 3.72 3.83 4.42 4.73
PSA equalization account
investment case (IC) [1]
- 1.50 0.40
Multilateral - 0.50 0.59
Single operation
evaluations
Programme sources 2.84 n/a n/a n/a
CPEs from CSP
budgets [2]
Programme sources 2.00
Total 8.96 8.38 8.32 12.98
[1] The source for 2017 and 2018 was the PSAEA.
[2] To be secured.
CPE = country portfolio evaluation; PSAEA = programme support and administrative equalization account.
13. The resources currently available for 2019, will allow OEV to meet expectations in the
coverage norms for CSPEs and to increase its support to the decentralized evaluation
function sustainably, subject to decisions made by the sustainable financing task force
chaired by the Budget and Programming Division and established in order to clarify, among
other issues, the mechanism by which funding will be made available to OEV in a timely
manner for conducting the CSPEs. Work will include the augmentation of OEV’s established staff in order to deliver the sustained increase in centralized evaluations envisaged in
the evaluation policy coverage norms and to meet the significant additional requirements
for evaluation coverage introduced by the CSP policy, which will result in a higher demand
for CSPEs in 2019 and the need to prepare for a significant increase in the number of CSPs
to be evaluated from 2020 onwards.
14. There is a gap of USD 1.54 million between the needs-based budget of USD 14.17 million
(see table A.V.1) and the proposed available resources of USD 12.98 million (see table A.V.2).
The work plan therefore prioritizes the most efficient activities for sustainably achieving the
WFP/EB.2/2018/6-A/1 137
goal of the evaluation policy and moving towards attainment of the coverage norms.
Fundamental recurring costs for OEV’s delivery of the required activities in the augmented evaluation function are also built into the work plan.
15. OEV has submitted an investment case for USD 1.54 million to fill this gap, subject to further
consideration by WFP management. The funding would cover two policy evaluations that
have been postponed pending management’s decision on the investment case in 2019, and
one corporate emergency evaluation of the planned WFP emergency response in Yemen,
which is subject to agreement on cost sharing with WFP management.
16. The work plan outlook for 2020 and 2021 assumes that regular progress will continue to be
made towards the evaluation policy’s target of 0.8 percent of WFP contribution income being dedicated to evaluation both centralized and decentralized8 by the end of the policy
period (2021). The target figure applies to contributions from all sources, including softly
earmarked contributions and contributions received directly as trust funds, and is in line
with the corporate evaluation strategy’s agreed resourcing arrangements.9
17. While ensuring that the quality of evaluations is maintained, OEV seeks maximum efficiency
gains in evaluation management and value-added from partnership arrangements.
Efficiencies and economies have been achieved by:
➢ using long-term agreements with a wide range of evaluation service providers for
both centralized and decentralized evaluations;10
➢ outsourcing activities, where outsourcing creates scalable services and cost savings,
while maintaining quality standards such as those in the quality support mechanism
for decentralized evaluations, the post hoc quality assessments of all evaluations and
the management information system, supporting the evaluation function’s reporting;
➢ systematically consolidating and sharing evidence from both decentralized and
centralized evaluations in order to inform the development of CSPs;
➢ consolidating regional evaluation-related needs such as funding or workforce
planning, including through joint work with the Performance Management and
Monitoring Division on strengthening the M&E workforce throughout WFP;
➢ creating synergies among evaluations by conducting them in series and producing
syntheses of findings in order to enhance the evaluations’ contribution to knowledge; and
➢ conducting evaluations jointly or in partnership wherever possible so that costs are
shared (see examples in sections A and E); this strategy offers a double win, as joint
evaluations are also increasingly important in measuring progress towards the
SDG targets from combined efforts under the 2030 Agenda and for inter-agency
evaluations of system-wide responses to Level 3 emergencies.
18. Over recent years the staffing structure has remained stable while the work plan has
expanded considerably since the adoption of the policy. In particular, as shown in
table A.V.1, for the period covered by the evaluation policy an increase in OEV’s established
8 Recognizing that the budgets for decentralized evaluations are managed by other units, not OEV.
9 The financial framework includes provisions for funding all CSPEs from country portfolio budgets, although the CSPEs
will be managed by OEV.
10 Long-term agreements provide multiple advantages, including greater administrative efficiency.
WFP/EB.2/2018/6-A/1 138
staff budget is needed from 2019 onwards in order to allow delivery of the planned outputs
and outcomes.
19. In 2019, OEV’s total required staff budget is USD 5.68 million, compared with
USD 3.00 million in 2018 and USD 3.05 million in 2017. This sharp increase is explained
mainly by the need for OEV to deliver its expanding work plan in order to meet coverage
norms in a sustainable manner. This will be achieved through the establishment of
14 fixed-term positions at various grades, replacing the current temporary consultant
positions. To date more than 50 percent of OEV staff have filled temporary positions and
this creates risks for the delivery of the programme of work and for quality standards. In
2019, the ratio will be reduced to about 20 percent, contributing to the development of a
strengthened evaluation cadre.
20. Table A.V.3 provides an overview of OEV’s plan for centralized evaluations in 2019 and the provisional outlook for 2020 and 2021. The rationale and details of these deliverables are
discussed in section A.
2018 OEV deliverables and 2019 2020 outlook
A. Centralized evaluations (outcome 2)
21. OEV’s centrally managed evaluations inform all stakeholders of the relevance, effectiveness, impact and sustainability of WFP’s policies, strategies, operations and activities and the
efficiency of their implementation. There are two main types of centralized evaluation:
global evaluations of policies, global programmes and strategic themes; and
country-specific evaluations, comprising evaluations of Level 3 humanitarian
emergency responses regional or national CSPs and the impact of WFP activities.
22. The programme of evaluations for 2019—2021 has been selected and prioritized to be of
maximum relevance in WFP’s dynamic policy and programming context and thus to optimize
OEV’s role in supporting accountability and learning in order to strengthen
WFP’s contribution to ending global hunger. The programme is designed to generate timely
and pertinent evidence for decision making, as outlined in the following paragraphs.
23. During 2018, OEV made several adjustments to the work plan for 2018 2019:
➢ Three CPEs were planned for 2018 with a view to strengthening the evidence base for
the preparation of CSPs that will be presented to the Board in late 2018 and
early 2019. However, it was possible to start only one of the planned CPEs.
➢ The choice of topics and the timelines for strategic evaluations planned for this period
were adjusted to prioritize evaluations of direct relevance to the initial phase of
IRM implementation.
➢ This influenced the selection of policy evaluations and it was decided to evaluate the
WFP people strategy (2014) instead of the school feeding policy (2013) as the latter
will be covered in the scope of the strategic evaluation of the effects of school feeding
on hunger and nutrition planned for 2019.
➢ In light of the continuing and protracted Level 3 emergencies, increased attention will
be directed to these emergencies through evaluations of emergency responses,
CSPEs and one strategic evaluation.
WFP/EB.2/2018/6-A/1 139
24. The norm governing the evaluation of WFP’s policies is set by the WFP policy formulation document approved by the Board in 2011.11 It requires that policies approved after 2011 be
evaluated from four to six years after the start of implementation in order to contribute
evaluation evidence and learning to WFP’s policy cycle. For policies approved prior to 2011,
evaluation either of the policy itself or of the theme addressed by the policy is considered
based on the criterion of continuing relevance to WFP’s work or potential to contribute to
new policy development.
25. The outlook for policy evaluations in 2019 (see table A.V.3) includes prioritization of the
planned evaluation of the gender policy. Policy evaluations initiated in 2018 and continuing
in 2019 include evaluations of WFP’s updated safety nets policy (2012) and the people strategy (2014—2017), which OEV was asked to evaluate in late 2017 after approval of its
work plan by the Board.
26. Subject to available funding in 2019, OEV will complete evaluations of the policy on
peacebuilding in transition settings (2013) and of WFP’s HIV and AIDS policy (2010 with
updates in 2015, 2017 and 2018). Additional policy evaluations are foreseen for 2020 and
2021 and OEV will consult WFP management in order to determine priorities that are
coherent with the resource outlook.
27. Strategic evaluations are forward-looking and focus on strategic themes, systemic or
emerging corporate issues and/or programmes and initiatives with global or regional
coverage. OEV’s previous plans have been updated following a review of topics of strategic
relevance and potential for contributing to organizational learning. Based on findings from
the review, OEV proposes to carry out a number of evaluations supporting core aspects of
the organizational change undertaken in order to implement WFP’s Strategic Plan (2017-2021), increase WFP’s efficiency and effectiveness and respond to the rapid changes in the internal and external contexts in which WFP works. Selected topics and timing were
discussed with the evaluation function steering group, the executive management group
and the Board.
28. The first of the strategic evaluations in this series of the pilot CSPs will be completed in
2018 with the second strategic evaluation, on resilience, being submitted for consideration
at the Board’s first regular session in 2019. These will be followed by an evaluation of
WFP’s capacity to respond to emergencies, which will examine the influence of systems
and procedures on the scale, coverage, speed and quality of WFP’s response, the roles of the coordination and humanitarian clusters and transitions into and out of
emergency response.
29. New starts in 2019, include an evaluation of the funding of WFP, which will evaluate
WFP’s ability to secure predictable and adequate resources, the use of trust funds, pooled
funds and joint fundraising approaches, and partnerships with governments and the
private sector; and an evaluation of the effects of school feeding on hunger
and nutrition, which will enable OEV to meet the coverage norm for evaluation of the
school feeding policy (2013) while expanding the scope of the evaluation to a broader
consideration of related topics such as capacity strengthening, technical assistance,
South-South and triangular cooperation and partnerships. Topics for two strategic
evaluations per year in 2020 and 2021 have been identified, subject to continued relevance
and resource availability.
11 WFP/EB.A/2011/5-B.
WFP/EB.2/2018/6-A/1 140
30. The evaluation policy and the policy on CSPs entail an evolution in the types of evaluation
carried out at the country level. Complementing the coverage of decentralized evaluations
of individual operations or parts thereof, centralized CSPEs will become a primary
accountability instrument and a learning tool, providing evidence of the strategic
positioning, performance and results of all WFP’s CSPs, which range from three to five years in duration. The first CSPEs implemented under the new framework will commence in 2019,
funded from programme resources from CSP budgets.
31. In 2018, three CPEs that had started in 2017 were completed and one was started (Ethiopia)
to be presented to the Board in 2019. A further two CPEs were planned for Malawi and
Madagascar, but unfortunately it was not possible to commission them: the agreed timeline
for preparation of the Malawi CSP proved to be too short to allow the use of CPE results;
and in Madagascar, it proved impossible to recruit a competent evaluation team able to
conduct the CPE in time to provide results for informing design of the CSP.
32. The lists of countries in table A.V.3 are based on current planning projections for the IRM:
eight CSPEs will be conducted within the IRM framework in 2019, increasing to 13 in 2020
and to between 15 and 20 per year thereafter. In 2019, OEV will continue to lay the
foundations for meeting this increased demand, adapting the CPE model to the
CSP framework, streamlining processes for optimum efficiencies and ensuring that
adequate staff resources and expertise are available through a restructuring of OEV.
33. In line with the Board’s request for increased coverage of evaluations of corporate emergency responses (Level 3 and multi-country Level 2 responses), OEV will
continue to follow its two-pronged approach: every Level 3 and multi-country Level 2
emergency response will be evaluated by OEV in an evaluation that examines
WFP’s response alone, or within a joint IAHE. The benefits of joint IAHEs over evaluations of
WFP responses on their own include cost efficient ways of achieving coverage, minimizing
the burden on United Nations country teams in challenging environments and enabling
the evaluation of WFP’s performance in broad partnerships.
34. OEV plans to start two of each of these types of evaluation in the period from 2019 to 2021.
In 2019, the evaluation of WFP’s response in northern Nigeria and the Lake Chad Basin will be completed, and two evaluations of the Yemen and Rohingya crisis responses will be
started. It is also anticipated that two IAHEs (either crisis-specific or thematic) will be
commissioned, in accordance with the revised IAHE model and subject to the capacity and
resources of the IAHE steering group. Looking ahead, evaluations of country-specific Level 2
emergency responses may also be considered, where resources permit and where the
evaluations would complement planned decentralized evaluations.
35. In 2019, a new strategy for impact evaluations will be finalized, covering both centralized
and decentralized approaches. The strategy will inform OEV’s efforts to enhance WFP’s capacity to deliver and use impact evaluations in ways that support organizational
learning. It will inform the design and implementation of new series of impact evaluations
that generate evidence and inform operational improvements in important areas. The first
of these series, entitled CBTs and gender impact evaluation series is currently under
development and will be started in 2019. A further series will be initiated in the course
of 2019. The strategy will build on experience of the strategic global partnership with the
International Initiative for Impact Evaluation (3ie) on the series of impact evaluations on
moderate acute malnutrition, conducted between 2015 and 2017,12 and on the potential for
further partnerships. Partnering provides access to the highly specialized expertise needed
12 Part of a series of wider multi-institutional evaluations of humanitarian impacts.
WFP/EB.2/2018/6-A/1 141
for delivering credible, quality impact evaluations that meet the particular methodological
challenges of humanitarian contexts.
36. Looking ahead, the increased numbers of CSPEs led by OEV from 2020 onwards in order to
meet the CSP policy’s coverage norm is expected to provide a significant body of good-
quality, country-level evaluation evidence. From this evidence, OEV plans to produce
thematic synthesis reports of global and possibly regional scope. At the same time, the
volume of decentralized evaluations will also increase, and when OEV is satisfied with the
quality of the evidence generated it should be possible to produce syntheses of evidence by
region and/or theme.
TABLE A.V.3: CENTRALIZED EVALUATION PLAN, 2019 AND OUTLOOK FOR 2020 AND 2021
(September 2018)
Type 2019 2020 2021
Policy Continued from 2018:
• Safety nets update (A/19)
• People strategy (2/19)
New starts:
• Gender (A/20)
Pending funding:
• HIV/AIDS (tbc)
• Peacebuilding in transition
settings (tbc)
Continued from 2019:
• Gender (A/20)
Pending funding:
• HIV/AIDS (tbc)
• Peacebuilding in
transition settings (tbc)
New starts:
• 2 topics to be determined
Continued from 2020:
• 2 topics to be determined
New starts:
• 4 topics to be determined
Strategic Continued from 2018:
• WFP’s capacity to respond to emergencies (1/20)
New starts:
• Funding for WFP’s work (A/20)
• Effects of school feeding on
hunger and nutrition (2/20)
Continued from 2019:
• Funding for WFP’s work (A/20)
• Effects of school feeding
on hunger and nutrition
(2/20)
New starts:
• Managing organizational
change
• Programme design in an era
of collective action
Continued from 2020:
• Managing organizational
change
• Programme design in an era
of collective action
New starts:
• WFP’s use of technology in constrained environments
• Supply chain
management strategy
Country strategic
plans
New starts:
• Bangladesh CSP
• Cameroon CSP
• Democratic Republic of the
Congo ICSP
• Lebanon CSP
• Syrian Arab Republic ICSP
• Timor-Leste CSP
• Indonesia CSP
• Islamic Republic of Iran ICSP
Continued from 2019:
• Bangladesh CSP
• Cameroon CSP
• Democratic Republic of
the Congo ICSP
• Lebanon CSP
• Syrian Arab Republic ICSP
• Timor-Leste CSP
• Indonesia CSP
• Islamic Republic of Iran ICSP
New starts:
• Afghanistan CSP
• China CSP
• Colombia CSP
Continued from 2020: tbc
New starts:
• Bolivia (Plurinational State
of) CSP
• Kyrgyzstan CSP
• Mauritania CSP
• Myanmar CSP
• Namibia CSP
• Nigeria CSP
• Pakistan CSP
• Peru CSP
• Philippines CSP
• Sri Lanka CSP
• State of Palestine CSP

WFP/EB.2/2018/6-A/1 142
TABLE A.V.3: CENTRALIZED EVALUATION PLAN, 2019 AND OUTLOOK FOR 2020 AND 2021
(September 2018)
Type 2019 2020 2021
• Ecuador CSP
• El Salvador CSP
• The Gambia CSP
• Guatemala CSP
• Honduras CSP
• Democratic People’s Republic of Korea ICSP
• Lao People’s Democratic Republic CSP
• Mozambique CSP
• United Republic of Tanzania
CSP
• Zimbabwe CSP
• Tunisia CSP
• Uganda CSP
Humanitarian
emergency
response
Continued from 2018:
• WFP response in northern Nigeria (2/19)
• IAHE topic to be determined
New starts:
• Yemen WFP emergency
response (tbc)
• Rohingya refugee crisis
(Bangladesh/Myanmar) (tbc)
• 2 IAHEs to be determined
Continued from 2019:
• Yemen response (tbc)
• Rohingya refugee crisis
(Bangladesh/Myanmar) (tbc)
• 2 IAHEs (tbc)
New starts:
• 2 WFP emergency responses
(tbc)
• 2 IAHEs (tbc)
Continued from 2020:
• 1 WFP emergency response
• 2 IAHEs (tbc)
New starts:
• 2 WFP emergency responses
(tbc)
• 2 IAHEs (tbc)
Impact Continued from 2018:
• CBTs and gender impact
evaluation series
Continued from 2019:
• CBTs and gender impact
evaluation series
• New series to be determined
Continued from 2020:
• CBTs and gender impact
evaluation series
• New series to be
determined
Syntheses • Synthesis of WFP’s country portfolio evaluations in
Africa (2016 2018) (A/19)
• Topic relevant to the WFP
strategic plan and/or based
on regional demand to be
determined
• Topic relevant to the WFP
strategic plan and/or based
on regional demand to be
determined
Letters and figures in brackets refer to the Board sessions at which the evaluations will be presented: A = annual session;
1 = first regular session; 2 = second regular session; tbc = to be confirmed. For example, A/19 refers to the 2019 annual session.
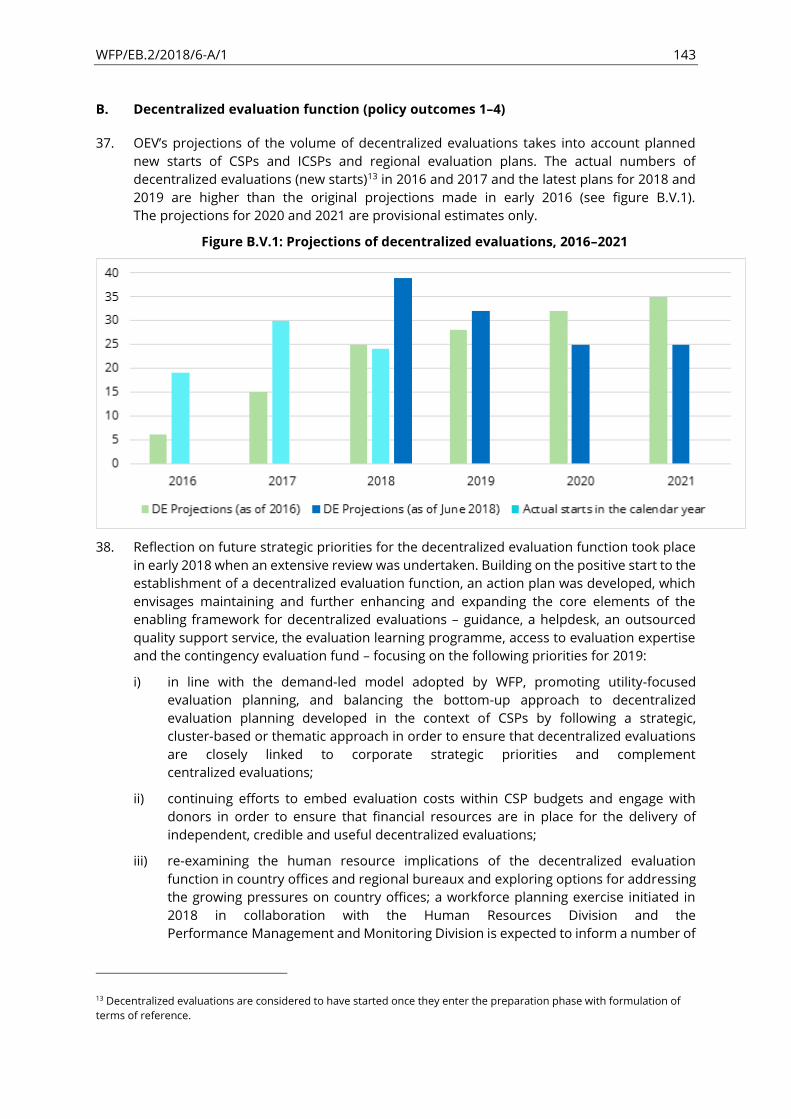
WFP/EB.2/2018/6-A/1 143
B. Decentralized evaluation function (policy outcomes 1 4)
37. OEV’s projections of the volume of decentralized evaluations takes into account planned new starts of CSPs and ICSPs and regional evaluation plans. The actual numbers of
decentralized evaluations (new starts)13 in 2016 and 2017 and the latest plans for 2018 and
2019 are higher than the original projections made in early 2016 (see figure B.V.1).
The projections for 2020 and 2021 are provisional estimates only.
Figure B.V.1: Projections of decentralized evaluations, 2016 2021
38. Reflection on future strategic priorities for the decentralized evaluation function took place
in early 2018 when an extensive review was undertaken. Building on the positive start to the
establishment of a decentralized evaluation function, an action plan was developed, which
envisages maintaining and further enhancing and expanding the core elements of the
enabling framework for decentralized evaluations guidance, a helpdesk, an outsourced
quality support service, the evaluation learning programme, access to evaluation expertise
and the contingency evaluation fund focusing on the following priorities for 2019:
i) in line with the demand-led model adopted by WFP, promoting utility-focused
evaluation planning, and balancing the bottom-up approach to decentralized
evaluation planning developed in the context of CSPs by following a strategic,
cluster-based or thematic approach in order to ensure that decentralized evaluations
are closely linked to corporate strategic priorities and complement
centralized evaluations;
ii) continuing efforts to embed evaluation costs within CSP budgets and engage with
donors in order to ensure that financial resources are in place for the delivery of
independent, credible and useful decentralized evaluations;
iii) re-examining the human resource implications of the decentralized evaluation
function in country offices and regional bureaux and exploring options for addressing
the growing pressures on country offices; a workforce planning exercise initiated in
2018 in collaboration with the Human Resources Division and the
Performance Management and Monitoring Division is expected to inform a number of
13 Decentralized evaluations are considered to have started once they enter the preparation phase with formulation of
terms of reference.
WFP/EB.2/2018/6-A/1 144
actions that will be implemented in 2019, including among others the establishment
of an M&E Future International Talent (FIT) Pool;
iv) preparing a consolidated investment case based on the resource needs of all regions
and building on experience gained with the first regional investment case developed
in 2018;
v) continuing to expand evaluation capacity and enhance professionalism by building on
the success of WFP’s evaluation learning programme (EvalPro), including through leadership in country offices and the sharing of expertise with other United Nations
agencies that work on evaluation;
vi) putting in place measures for ensuring that WFP staff who commission evaluations
understand the meaning and importance of impartiality and are able to protect it;
vii) continuing to support regional evaluation officers in the operationalization of the
six regional evaluation strategies; promoting the sharing of best practices among
regions, with particular emphasis on safeguarding the impartiality provisions and on
ethical considerations; and further enhancing evaluation quality and maximizing use;
viii) maintaining OEV’s internal decentralized evaluation helpdesk and augmenting expertise in supporting impact evaluations and decentralized evaluations
commissioned by headquarters divisions;
ix) establishing an enhanced corporate evaluation management response system that
includes decentralized evaluations and creates synergies with other
oversight functions; and
x) expanding guidance on evaluation partnerships and the development of national
evaluation capacity and providing tailor-made lesson exchanges, coaching, advice and
support to staff engaging in regional and national evaluation networks and associated
initiatives related to the 2030 Agenda.
39. OEV will continue to provide the regional bureaux with support for evaluation planning in
order to ensure that the coverage norms laid out in the evaluation policy are applied.
Decentralized evaluation plans will take into account the planned country-level coverage of
CSPEs in order to ensure maximum complementarity. While CSPEs assess the
strategic positioning, coherence and performance of WFP’s overall strategic plan in a country, decentralized evaluations cover specific themes and activities within a CSP and are
intended to address specific knowledge gaps where the evidence base is weak and/or
donors stipulate specific accountability requirements.
C. Overall evaluation function (outcomes 1 4)
40. The Evaluation Charter details the institutional arrangements and systems required to
embed evaluative thinking and behaviour throughout WFP. Although initially triggered by
needs arising from the building of a credible, quality decentralized evaluation function,
the institutional arrangements and several of the systems also apply to centralized
evaluation. They facilitate the enhancement of WFP’s entire evaluation function in pursuit of the goals of the evaluation policy.
41. In 2019, OEV will:
➢ communicate proactively with staff about the evaluation policy and
the implementation and outputs of the corporate evaluation strategy including
through the community of practice and the regular evaluation newsletter initiated
in 2018;
WFP/EB.2/2018/6-A/1 145
➢ act as secretariat to the evaluation function steering group which supports the
Executive Director in embedding evaluations in corporate processes and fostering a
culture of learning and accountability — and, in particular, provide strategic support
for the implementation of regional evaluation strategies and plans;
➢ apply to all evaluations — centralized and decentralized — the post-hoc quality
assessment system that was established in 2017;
➢ set up sustainable financing mechanisms for decentralized and centralized
evaluations in accordance with the directions set by WFP’s Strategic Plan (2017-2021)
and the updated IRM of 2018; and
➢ strengthen staffing for the evaluation function throughout WFP, building on the joint
M&E workforce planning exercise initiated in 2018 and the joint M&E FIT Pool, which
is due to come into effect in 2019 and will enable all levels of WFP to draw on a pool
of pre-qualified M&E experts in order to strengthen the monitoring and evaluation
functions in country offices, regional bureaux and headquarters units; OEV is also
collaborating intensively with the United Nations Volunteer Programme, particularly
its youth programme, with a view to exposing young professionals to M&E work in
the field.
D. Promoting the use of evaluation evidence and communications (purpose and
cross-cutting outcome of the policy)
42. WFP’s evaluation policy reaffirms the importance of ensuring that evaluations are useful to
decision makers and stakeholders by stimulating learning from and the use of evaluations
in the improvement of policies, strategies, programmes and operational decision making.
Taking into consideration resource limitations and the need for phased development of the
function with the aim of achieving the policy’s outcomes, in 2019 the priorities will be:
➢ starting implementation of the communication and knowledge management strategy
for OEV, which was developed in 2018;
➢ continuing to support the systematic use of evaluation evidence for programme and
policy planning and implementation through the consideration of evaluation evidence
and recommendations from WFP’s programme review process;
➢ continuing to conduct learning workshops during the evaluation process,
as appropriate and where resources permit, and broadening the range of webinars;
➢ regularly maintaining WFP’s upgraded evaluation intranet and internet pages in order to facilitate more effective sharing of evaluation information and evidence and to
increase the accessibility of evidence from all WFP centralized and decentralized
evaluations to internal and external users; and
➢ building on the experience gained in 2018 with the new communication tools and
improving them further based on feedback from users.
E. Engagement in the international evaluation system (policy outcome 4)
43. OEV will continue to engage in the international evaluation system, focusing on where it can
add the greatest value and on the areas of most relevance to WFP’s work. In light of the 2030 Agenda, in 2019 OEV will focus on following through on commitments to:
➢ continuing to participate in the IAHE process within the humanitarian programme
cycle of the Inter-Agency Standing Committee, subject to the availability of capacity
and resources;

WFP/EB.2/2018/6-A/1 146
➢ actively participating in the United Nations Evaluation Group’s (UNEG’s) work on ensuring that evaluations contribute to the delivery of results under the 2030 Agenda
OEV will co-convene a number of UNEG working groups, such as a working group on
professionalization of the evaluation function with the International Labour
Organization and the Organisation for the Prohibition of Chemical Weapons, which
will include engagement with the United Nations System Staff College on the
development of a basic evaluation course for all United Nations staff; a decentralized
evaluation interest group with the United Nations Population Fund; and a working
group on ethics with the United Nations Children’s Fund. OEV will also contribute to
the groups on gender and human rights and on knowledge management and the use
of evaluation, and to the humanitarian evaluation interest group;
➢ continuing to enhance collaboration among the evaluation offices of the Rome-based
agencies, focusing on joint learning and capacity building initiatives, particularly the
EvalForward community of practice for SDG 2;
➢ supporting the elements of the United Nations reform process that are related to
evaluation, particularly regarding the way forward for joint evaluations of
United Nations development assistance frameworks; and
➢ continuing to contribute to and collaborate with other international
professional networks.14
F. Evaluation function reporting (cross-cutting outcome)
44. Taking into account relevant developments in the corporate results framework, OEV will
continue to use the reporting framework for the evaluation function centralized and
decentralized evaluation that was introduced in the 2017 annual evaluation report.
45. Building on the core key performance indicators that were developed in 2016 in the
six groupings in the evaluation policy, and following completion of the first phase of the
establishment of its management information system in 2018, OEV will progressively extend
information and reporting systems in order to serve the internal monitoring
requirements of the evaluation function.
46. In addition to the continuous collection of the data needed to inform measurement of the
core key performance indicators currently available, this will require OEV to:
i) progressively introduce additional specific key performance indicators that meet
internal management information needs as WFP’s systems are enhanced; ii) complete the drafting of guidance on data collection for all
key performance indicators; and
iii) start the second phase of development of the information technology platform for
managing the collection and presentation of the new set of key performance indicators
for internal use.
47. Reporting and management information systems will continue to be developed as
necessary in order to take into account future corporate developments.
14 For example, the Active Learning Network for Accountability and Performance in Humanitarian Action (ALNAP), on which
OEV serves as a member of the steering group; and professional evaluation associations, such as the American Evaluation
Association, the European Evaluation Society and the International Development Evaluation Association.

WFP/EB.2/2018/6-A/1 147
ANNEX VI
Terminology
As far as possible, common United Nations terminology for budget preparation has been used in
this document. WFP-specific terms and definitions have been used where necessary. Those
marked with * contain the proposed text in the revised financial regulations, contained in the
Update on the Integrated Road Map .
Account
A formal record of an asset, liability, revenue or expense for which the effects of transactions are
recorded in terms of their monetary value or other unit of measurement.
Activity
Activities are actions taken or work performed through which inputs such as funds, technical
assistance and other types of resources are mobilized to produce specific outputs.
Activity category
Activities, which are described in country strategic plans, are classified in standardized groups
throughout WFP, which allows aggregation by nature of the activities. A comprehensive list of
WFP activity categories can be found in the Corporate Results Framework.
Annual performance report (APR)
A corporate-level report submitted to the Board and donors highlighting WFP’s main achievements and challenges. Reporting progress against the WFP strategic plan and management plan, the
APR reflects results-based management principles and constitutes an essential piece of
WFP’s accountability and performance management system. The report draws on
WFP’s accounting and operation management systems and on consultation with divisions,
regional bureaux, country offices and partners.
Appropriation
The amount approved by the Board for purposes specified in the programme support and
administrative (PSA) budget for a financial period, against which obligations up to the amount
approved may be incurred for those purposes.
Appropriation line
The largest subdivision of the PSA budget within which the Executive Director is authorized to
make transfers without prior approval of the Board.
Beneficiaries
Beneficiaries are individuals who benefit directly (tier 1 beneficiaries) or indirectly (tier 2,
tier 3 beneficiaries) from WFP interventions at any time during a given reporting period.
Board
The Executive Board of WFP, and its predecessors.
Capital Budgeting Facility
A revolving facility for enabling WFP to implement large-scale initiatives that improve efficiency by
reducing costs in the long term.
WFP/EB.2/2018/6-A/1 148
Contribution
A donation of appropriate commodities, non-food items, acceptable services or cash made in
accordance with procedures set out in WFP’s financial regulations. A contribution may be multilateral, directed multilateral or bilateral.
Corporate Results Framework (CRF)
The normative document approved by the Board in order to operationalize WFP’s strategic plan and policy on country strategic plans. It establishes the logic model for programme results and the
management support architecture used to guide the planning and monitoring of and the reporting
on WFP’s performance towards the achievement of strategic objectives. The CRF aligns the line of sight with indicators used to measure results. These indicators are maintained in two compendiums: the CRF programme output and outcome compendium; and the
CRF management key performance indicator compendium. Targets for results are set in the
performance cycles of country, regional and headquarters offices and reviewed by the Board in
the annual performance report.
Critical corporate initiatives
Non-recurring investments funded by allocations from the PSA equalization account and aimed at
strengthening WFP’s programming, operational and administrative capacity.
Directed multilateral contribution*
A contribution, other than a response to an appeal made by WFP for a specific emergency
operation, which a donor requests WFP to direct to a specific activity or activities initiated by WFP
or to a specific programme or programmes.
Direct support cost*
A cost which corresponds to country-level expenditures that are directly linked to the execution of
the programme as a whole but cannot be attributed to a specific activity within it.
Executive Director
The Executive Director of the World Food Programme or the official to whom
the Executive Director has delegated authority and responsibility for the matter in question.
Financial regulations
Regulations adopted pursuant to general regulations that govern the financial management of the
WFP Fund. The Board may, in exceptional circumstances, grant exemptions from the
financial regulations.
Focus areas
Mutually exclusive categories of the contexts in which WFP operations are implemented.
Focus areas appear as tags in WFP logical frameworks at the WFP strategic outcome level and are
three in number: crisis response, resilience building and response to root causes. Each strategic
outcome statement should be associated with one focus area.
Full cost recovery*
The recovery of all the costs of the activities financed by a contribution or service
provision payment.
WFP/EB.2/2018/6-A/1 149
Functional areas
Areas of expertise relevant to managing related business processes and providing internal
services for implementing operations. The functional areas are closely related to the country office
and regional bureaux structures and, to a certain extent, headquarters divisions.
General Fund*
The accounting entity established for recording, under separate accounts, indirect support
cost recoveries, miscellaneous income, operational reserve and contributions received which are
not designated to a specific programme category fund, trust fund, or special account .
Global Commodity Management Facility
A facility that enables WFP to buy food on the basis of estimated regional needs and funding
forecasts with a view to exploiting favourable market conditions and minimizing the time required
to deliver food to beneficiaries.
Implementation plan
An annual plan of prioritized and adjusted operational requirements, based on funding forecasts,
available resources and operational challenges.
Indirect support costs*
A cost which cannot be directly linked to the execution of a programme or activity.
Integrated Road Map (IRM)
The IRM defines the transformative changes required in order to implement the Strategic Plan
(2017 2021) and facilitate and demonstrate WFP’s contribution to achieving the goals of the 2030 Agenda on Sustainable Development, particularly Sustainable Development Goal (SDG) 2,
End hunger, achieve food security and improved nutrition, and promote sustainable agriculture , and SDG 17, Strengthen the means of implementation and revitalize the global partnership for
sustainable development .
Management plan
The three-year comprehensive plan of work approved by the Board each year on a rolling basis,
inclusive of planned outcomes and indicators of achievement, together with the annual
WFP budget.
Multilateral contribution*
A contribution for which WFP determines the programme or WFP activities in which the
contribution will be used and how it will be used, or a contribution made in response to
a broad-based appeal for which WFP determines, within the scope of the broad-based appeal,
the programme or WFP activities in which the contribution will be used and how it will be used,
and for which the donor will accept reports submitted to the Board as sufficient to meet the
requirements of the donor.
Operational costs*
Transfer costs and implementation costs of a programme .
Operational requirements
All direct operational needs and direct support costs related to approved programmes and
programmes that are expected to be submitted for approval.

WFP/EB.2/2018/6-A/1 150
Pillars
Five categories (A E) that describe products and services delivered by regional bureaux and
headquarters in order to support country offices in implementing their CSPs, and therefore to
align the plans and budgets of regional bureaux and headquarters offices.
Programme categories
A classification of WFP activities, established in accordance with the general rules:
➢ Country strategic plans (CSPs) describe WFP’s entire portfolio of humanitarian and development activities in a country or countries and are prepared on the basis of
country-led analyses of sustainable development.
➢ Interim country strategic plans (ICSPs) describe WFP’s entire portfolio of humanitarian and development activities in a country or countries and are prepared for countries
where country-led analyses of sustainable development have not been completed.
➢ Limited emergency operations are used to provide emergency relief in a country or
countries where WFP does not have a country strategic plan or an interim country
strategic plan.
➢ Transitional interim country strategic plans (T-ICSPs) describe WFP’s entire portfolio of humanitarian and development activities in a country and are implemented between
the end of a limited emergency operation and the start of implementation of a
country strategic plan or interim country strategic plan.
Programme of work
The total approved WFP programme requirements determined in collaboration with governments
and other partners and utilized for funding appeals.
Programme support and administrative (PSA) budget
The portion of the WFP budget allocated to indirect support for WFP’s activities.
Project
A separately identified undertaking within a programme category.
Ration
A ration is the food or cash or voucher equivalent provided daily for a beneficiary in a
targeted group; it is expressed as the weight in grams of each food type and varies in size
according to needs and available funding.
Special account
An account established by the Executive Director for a special contribution or for
monies earmarked for specific activities, the balance of which may be brought forward to the
succeeding financial period.
Strategic Objectives
The first level of support for the achievement of Strategic Goals, the five WFP Strategic Objectives
frame WFP’s programmatic and operational focus and link to national and global efforts to meet
SDG 2 and SDG 17 targets.
WFP/EB.2/2018/6-A/1 151
Strategic outcomes
Part of WFP’s programmatic results chain, strategic outcomes are statements in WFP logical frameworks that reflect the stated or implied goals of a country’s national plan and regional framework to which WFP’s assistance will contribute. Strategic outcomes contribute to
WFP Strategic Results, and below them are outputs and activities. Strategic outcomes are classified
into standard outcome categories for the purpose of aggregation throughout WFP.
Strategic Results
Supporting the Strategic Objectives, Strategic Results align WFP’s support with national efforts to achieve the SDGs. They contribute to the achievement of Strategic Objectives and frame strategic
outcomes at the country level. For more comprehensive information, consult the
WFP Strategic Plan (2017—2021).
Trust fund
An identifiable subdivision of the WFP Fund, established by the Executive Director in order to
account for a special contribution, the purpose, scope and reporting procedures of which have
been agreed with the donor.
WFP budget*
The annual budget component of the management plan approved each year by the Board
indicating estimated resources and expenditures for programmes and activities, and shall include
a Programme Support and Administrative budget.
WFP transfer modalities
➢ Commodity voucher. A paper or electronic entitlement expressed in fixed quantities of
specified goods. They are a distinct transfer modality, and are not cash-based or in-kind.
➢ Cash-based transfer. A set of transfer modalities through which beneficiaries are
provided with purchasing power in the form of cash and/or value vouchers.
➢ Cash transfer. Monetary assistance in the form of cash or electronic disbursement to a
targeted individual or household for the purchase of food.
➢ Value voucher. A paper or electronic entitlement of fixed value issued to a
targeted individual or household and redeemable at specified retailers.
Working Capital Financing Facility
An internal advance financing mechanism whose objectives are to maximize the utilization of
project resources in order to improve the timely availability of food. The facility enables projects
to receive advance funding pending confirmation of forecast contributions within established risk
management parameters.
WFP/EB.2/2018/6-A/1 152
Acronyms used in the document
APR annual performance report
ARC African Risk Capacity
BOS business operations strategy
CBF Capital Budgeting Facility
CBT cash-based transfer
CCI critical corporate initiative
CE centralized evaluation
CFO Chief Financial Officer
CFS Committee on World Food Security
COMET country office tool for managing effectively
CPE country portfolio evaluation
CRF Corporate Results Framework
CSP country strategic plan
CSPE country strategic plan evaluation
DE decentralized evaluation
DSC direct support costs
EDMF Emerging Donor Matching Fund
FAO Food and Agriculture Organization of the United Nations
FITTEST Fast Information Technology and Telecommunications Emergency Support Team
FtMA Farm to Market Alliance
GVLP Global Vehicle Leasing Programme
HQ headquarters
IAHE inter-agency humanitarian evaluation
IATI International Aid Transparency Initiative
ICSP interim country strategic plan
IFI international financial institution
IRA immediate response account
IRM Integrated Road Map
ISC indirect support cost
IT information technology
LESS Logistics Execution Support System
M&E monitoring and evaluation
NGO non-governmental organization
OED Office of the Executive Director
WFP/EB.2/2018/6-A/1 153
OEV Office of Evaluation
OIG Office of the Inspector General and Oversight Office
PSA programme support and administrative (budget)
PSAEA PSA equalization account
RB regional bureau
REACH Renewed Efforts Against Child Hunger and Undernutrition
SAFE Safe Access to Fuel and Energy
SDG Sustainable Development Goal
SOLVE Supply Optimization through Logistics, Visibility and Evolution
SPA strategic partnership agreement
SRAC Strategic Resource Allocation Committee
TEC Technology Division
T-ICSP transitional interim country strategic plan
UNCT United Nations country team
UNDSS United Nations Department of Safety and Security
UNEG United Nations Evaluation Group
UNHAS United Nations Humanitarian Air Service
UNHCR Office of the United Nations High Commissioner for Refugees
UNHRD United Nations Humanitarian Response Depot
UNICEF United Nations Children’s Fund
UN SWAP United Nations System-Wide Policy on Gender Equality and
the Empowerment of Women
ER-EB22018-16668E