Embed Size (px)
Citation preview
Food Security Assessment September 2012
1
Food Security Assessment
KYRGYZ REPUBLIC
September 2012

Food Security Assessment September 2012
i
Food Security Assessment September 2012
ii
Acknowledgements The team for this Food Security Assessment is grateful to the 2,000 households and 94 Key Informants in urban and rural areas of the Kyrgyz Republic who gave their time to answer enumerators’ questions and give information. The staff of “Rebicon” company efficiently carried out the field data collection, data entry and cleaning within a very tight timeframe. They also provided the output tables, as per the WFP plan of analysis. From the WFP Country Office in the Kyrgyz Republic, Keigo Obara (Vulnerable Analysis and Mapping Officer) and Aizhan Mamatbekova (Vulnerable Analysis and Mapping Assistant) ensured the preparation, monitored the data collection, compiled the analysis of the data, and prepared the final report, with support from SueNah Lyons (Reports Officer) and oversight from Michael Huggins (Deputy Country Director).
Food Security Assessment September 2012
iii
Abbreviations
CSI Coping Strategy Index
EFSA Emergency Food Security Assessment
EMOP Emergency Operation
FC Food Consumption
FCS Food Consumption Score
FSMS Food Security Monitoring System
GDP Gross Domestic Product
KGS Kyrgyz Som
KIHS Kyrgyz Integrated Household Survey
MT Metric Ton
PDM Post Distribution Monitoring
PRRO Protracted Relief and Recovery Operation
MB Monthly Benefit
MSB Monthly Social Benefit
VGF Vulnerable Group Feeding
WFP United Nations World Food Programme
Cover picture ©WFP/Maxim Shubovich
Food Security Assessment September 2012
iv
Table of Contents Acknowledgements ................................................................................................................. ii
Abbreviations .......................................................................................................................... iii
Table of Contents ................................................................................................................... iv
I – CONTEXT AND OBJECTIVES OF THE FOOD SECURITY ASSESSMENT IN THE KYRGYZ REPUBLIC ........................................................................................................... 1
1.1 Economic conditions .............................................................................................. 1 1.2 Food availability and access conditions ............................................................... 1 1.3 Political and policy context .................................................................................... 1 1.4 Rationale for the follow-up assessment and objectives ..................................... 2
II – METHODOLOGY ................................................................................................................ 2
2.1 Sampling and sources of information ................................................................... 2 2.2 Analysis of household food security ..................................................................... 3 2.3 Limitations ................................................................................................................ 4
III – RESULTS ........................................................................................................................... 5
3.1 Household food security and trends ..................................................................... 5 3.1.1 How many are food insecure? ................................................................................ 5 3.1.2 Where are the food insecure? ................................................................................ 6 3.1.3 Who are the food insecure? .................................................................................... 6
3.2 Key vulnerability issues and opportunities .......................................................... 7 3.2.1 Agriculture ............................................................................................................... 7 3.2.2 Livestock ................................................................................................................. 8 3.2.3 Labour migration ..................................................................................................... 9 3.2.4 Indebtedness .......................................................................................................... 9 3.2.5 Shocks and coping strategies ................................................................................. 9 3.2.6 Assistance received .............................................................................................. 11
IV – SUMMARY OF CURRENT FOOD SECURITY SITUATION AND FORECASTED DEVELOPMENT ................................................................................................................ 13
4.1 Summary of the food security situation and main factors ................................. 13 4.2 Forecasted development for the next few months ............................................... 14
V – SUGGESTIONS FOR FOOD SECURITY ASSISTANCE AND FOR WFP’S OPERATIONS .................................................................................................................... 15
5.1 Suggestions for food security assistance .......................................................... 15 5.2 Estimated number of people needing food security assistance ...................... 15
ANNEX 1 - HOUSEHOLD QUESTIONNAIRE ........................................................................ 17
ANNEX 2 – KEY INFORMANT QUESTIONNAIRE ................................................................ 22
Food
I –
1.1
1.2
1.3
1 Wo2 Nat
Security Asses
CONTEXTREPUBLIC
Economic
In June 201to reduced grow by 1%
The Consucompared t(9.4%), bre
According t2012, and months of 2increase in
Food avail
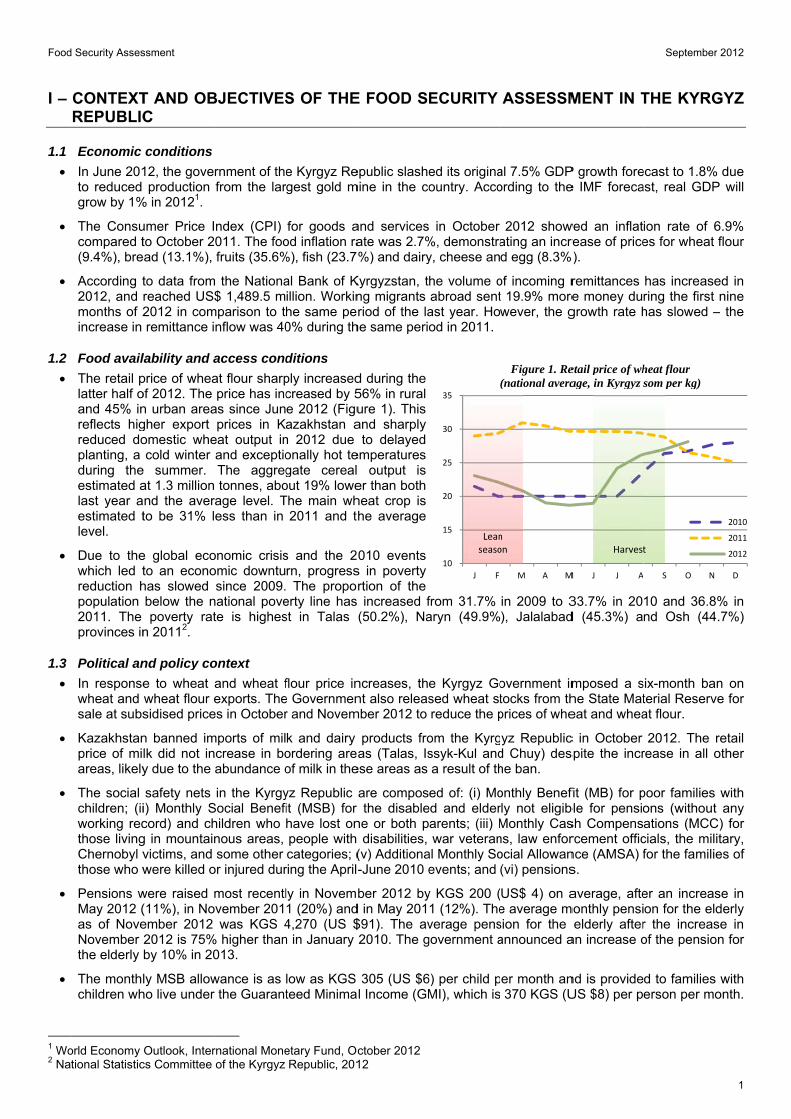
The retail platter half oand 45% inreflects higreduced doplanting, a during theestimated alast year aestimated tlevel.
Due to thewhich led treduction hpopulation 2011. The provinces in
Political an
In responsewheat and sale at subs
Kazakhstanprice of miareas, likely
The social children; (iiworking recthose livingChernobyl vthose who w
Pensions wMay 2012 (as of NoveNovember the elderly
The monthlchildren wh
orld Economy tional Statistic
ssment
T AND OBC
conditions
12, the goveproduction
% in 20121.
umer Price Ito October 2
ead (13.1%),
to data fromreached US$2012 in comremittance i
lability and a
price of wheaof 2012. The n urban areagher export omestic whecold winter
e summer. at 1.3 millionand the averto be 31% l
e global ecoto an econohas slowed below the npoverty rat
n 20112.
nd policy co
e to wheat wheat flour esidised price
n banned imlk did not iny due to the
safety nets i) Monthly Scord) and chg in mountainvictims, and were killed o
were raised m(11%), in Noember 2012 2012 is 75%by 10% in 20
ly MSB allowho live under
Outlook, Inter
cs Committee
BJECTIVES
rnment of thefrom the lar
ndex (CPI) 011. The foofruits (35.6%
m the Nationa$ 1,489.5 m
mparison to tnflow was 40
access cond
at flour sharpprice has inc
as since Junprices in K
eat output inand exceptioThe aggreg tonnes, abo
rage level. Tess than in
onomic crisisomic downtusince 2009.
national povete is highes
ontext
and wheat fexports. The
es in October
mports of milcrease in boabundance o
in the KyrgySocial Benefihildren who nous areas, some other
or injured dur
most recentlovember 201
was KGS 4% higher than013.
wance is as r the Guarant
rnational Moneof the Kyrgyz
S OF THE
e Kyrgyz Rergest gold m
for goods aod inflation ra%), fish (23.7
al Bank of Killion. Workinhe same pe0% during th
ditions
ply increasedcreased by 5e 2012 (Figuazakhstan a
n 2012 due onally hot tegate cerealout 19% loweThe main wh
2011 and t
s and the 2rn, progress The propo
erty line has st in Talas
flour price ine Governmenr and Novem
k and dairy ordering areof milk in the
yz Republic it (MSB) for have lost onpeople with categories; (
ring the April
ly in Novem1 (20%) and4,270 (US $n in January
low as KGS teed Minima
etary Fund, OcRepublic, 201
E FOOD S
epublic slashemine in the co
and servicesate was 2.7%%) and dairy
Kyrgyzstan, tng migrants riod of the la
he same peri
d during the 56% in rural ure 1). This and sharply
to delayed emperatures output is er than both heat crop is he average
010 events s in poverty rtion of the increased f(50.2%), Na
ncreases, thnt also releas
mber 2012 to
products froas (Talas, Is
ese areas as
are composthe disable
ne or both p disabilities, (v) Additiona-June 2010 e
ber 2012 byd in May 201$91). The av2010. The g
305 (US $6l Income (GM
ctober 2012 12
ECURITY
ed its originaountry. Acco
in October %, demonstray, cheese an
he volume oabroad sentast year. Hood in 2011.
from 31.7% aryn (49.9%
e Kyrgyz Gosed wheat streduce the p
om the Kyrgssyk-Kul anda result of th
ed of: (i) Moed and elderarents; (iii) Mwar veteran
al Monthly Soevents; and
y KGS 200 (1 (12%). Theverage pens
government a
6) per child pMI), which is
10
15
20
25
30
35
J F
Leanseaso
ASSESSM
al 7.5% GDPording to the
2012 showating an incred egg (8.3%
of incoming rt 19.9% morewever, the g
in 2009 to 3), Jalalabad
overnment imtocks from thprices of whe
yz Republicd Chuy) deshe ban.
onthly Benefrly not eligibMonthly Casns, law enforocial Allowan(vi) pensions
US$ 4) on ae average msion for the announced a
er month an370 KGS (U
Figure 1. Re(national avera
M A M
non
MENT IN T
P growth foree IMF foreca
wed an inflatrease of price).
remittances e money dugrowth rate h
33.7% in 20d (45.3%) a
mposed a she State Mateat and whea
c in October spite the incr
fit (MB) for pble for pensiosh Compensrcement officnce (AMSA) fs.
average, aftemonthly pensi
elderly afteran increase o
nd is provideUS $8) per p
etail price of whage, in Kyrgyz s
M J J A
Harvest
September
THE KYRG
ecast to 1.8%ast, real GDP
ion rate of 6es for wheat
has increasering the first has slowed –
10 and 36.8nd Osh (44
six-month baterial Reservat flour.
2012. The rease in all o
poor familiesons (withoutations (MCCcials, the milfor the famili
er an increason for the elr the increasof the pensio
d to familieserson per mo
heat flour som per kg)
S O N
t
r 2012
1
GYZ
% due P will
6.9% flour
ed in nine
– the
8% in 4.7%)
an on ve for
retail other
with t any C) for itary, es of
se in derly se in on for
s with onth.
D
2010
2011
2012
Food Security Assessment September 2012
2
Despite the very low amount of the benefit, many extremely poor families are reportedly excluded from the MSB. The monthly AMSA allowance is comparatively high, reaching KGS 3,700 (US $77) per month in 2011.
1.4 Rationale for the follow-up assessment and objectives
The Emergency Food Security Assessments (EFSA) undertaken in August 2010 provided an analysis of household food security after violent civil unrest in June 2010. The EFSA also provided a baseline for monitoring changes in household food security and coping mechanisms compared to 2010, reflecting harvest, food price trends and the lingering effects of the 2010 violence.
The current follow-up household food security assessment was undertaken to compare food security trends with August 2010, March 2011, August 2011 and March 2012.
II – METHODOLOGY
2.1 Sampling and sources of information
Similarly as for the August 2010 and following EFSAs, statistically representative data at national, urban and rural levels3, as well as at the oblast level in the seven oblasts4 and in Bishkek city, were obtained by adopting a two-stage cluster sampling approach to select localities (first stage) and households (second stage). In each oblast and in Bishkek city 250 households were randomly selected.5
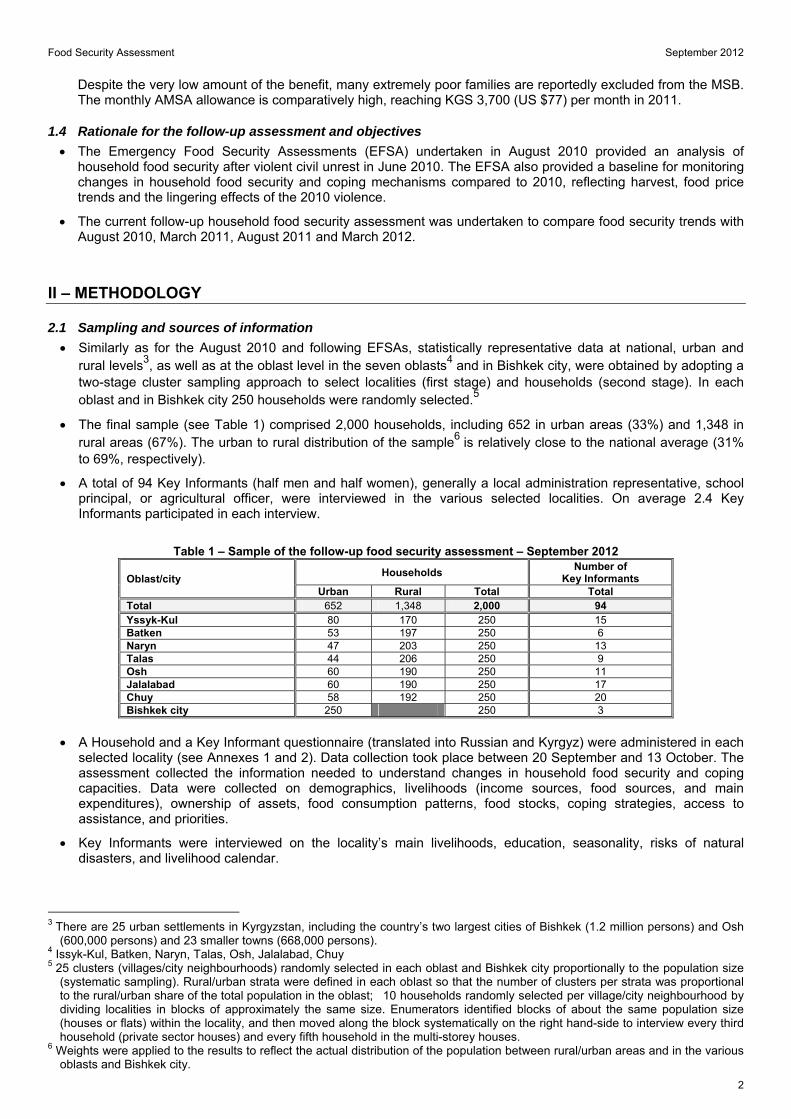
The final sample (see Table 1) comprised 2,000 households, including 652 in urban areas (33%) and 1,348 in rural areas (67%). The urban to rural distribution of the sample6 is relatively close to the national average (31% to 69%, respectively).
A total of 94 Key Informants (half men and half women), generally a local administration representative, school principal, or agricultural officer, were interviewed in the various selected localities. On average 2.4 Key Informants participated in each interview.
Table 1 – Sample of the follow-up food security assessment – September 2012
Oblast/city Households
Number of Key Informants
Urban Rural Total Total Total 652 1,348 2,000 94 Yssyk-Kul 80 170 250 15 Batken 53 197 250 6 Naryn 47 203 250 13 Talas 44 206 250 9 Osh 60 190 250 11 Jalalabad 60 190 250 17 Chuy 58 192 250 20 Bishkek city 250 250 3
A Household and a Key Informant questionnaire (translated into Russian and Kyrgyz) were administered in each
selected locality (see Annexes 1 and 2). Data collection took place between 20 September and 13 October. The assessment collected the information needed to understand changes in household food security and coping capacities. Data were collected on demographics, livelihoods (income sources, food sources, and main expenditures), ownership of assets, food consumption patterns, food stocks, coping strategies, access to assistance, and priorities.
Key Informants were interviewed on the locality’s main livelihoods, education, seasonality, risks of natural disasters, and livelihood calendar.
3 There are 25 urban settlements in Kyrgyzstan, including the country’s two largest cities of Bishkek (1.2 million persons) and Osh
(600,000 persons) and 23 smaller towns (668,000 persons). 4 Issyk-Kul, Batken, Naryn, Talas, Osh, Jalalabad, Chuy 5 25 clusters (villages/city neighbourhoods) randomly selected in each oblast and Bishkek city proportionally to the population size
(systematic sampling). Rural/urban strata were defined in each oblast so that the number of clusters per strata was proportional to the rural/urban share of the total population in the oblast; 10 households randomly selected per village/city neighbourhood by dividing localities in blocks of approximately the same size. Enumerators identified blocks of about the same population size (houses or flats) within the locality, and then moved along the block systematically on the right hand-side to interview every third household (private sector houses) and every fifth household in the multi-storey houses.
6 Weights were applied to the results to reflect the actual distribution of the population between rural/urban areas and in the various oblasts and Bishkek city.
Food Security Assessment September 2012
3
A group of researchers were contracted to: (i) identify enumerators, (ii) collect, enter and clean the data, and (iii) process output tables with the support of WFP. WFP trained the supervisors and enumerators, prepared the Plan of Analysis, and analysed and interpreted the data.
Comparisons were made between 1) urban and rural areas, 2) oblasts, and 3) household food security levels.
2.2 Analysis of household food security
The same analytical method was used to estimate the degree of food insecurity at the household level (‘severely food insecure’, ‘moderately food insecure’, and ‘food secure’) as in the previous EFSA and follow-up assessments, in order to enable comparisons. Food insecurity levels were determined by combining the WFP standard Food Consumption Score (FCS) with the level of income as the food access indicator7.
Achieving food security requires that the aggregate availability of physical supplies of food is sufficient, that households have adequate access to those food supplies through their own production, through the market or through other sources, and that the utilization of those food supplies is appropriate to meet the specific dietary needs of individuals.
Food insecurity levels were determined by combining the FCS (frequency and diversity of food intake based on seven-day recall) with the level of income as the economic food access indicator. The combination of these two indicators was needed because:
1) Food consumption patterns over the seven days prior to the survey do not indicate the sustainability of the diet, especially considering that the survey took place just after the wheat and potato harvests;
2) Household income levels complement the FCS indicator with information on the ability of households to purchase food, considering that most food consumed by Kyrgyz households must be purchased.
Combining these two indicators gives a more rigorous indicator of food insecurity8
For each indicator, groups of households were created as follows:
1) The Food Consumption Group (FCG): utilised three categories (‘poor’, ‘borderline’, ‘acceptable’) using the same threshold (28 and 42) as in previous WFP assessments in the Kyrgyz Republic:
Food Consumption Score Groups
Poor: Food Consumption Score below 28
Borderline: Food Consumption Score between 28.5-42
Acceptable: Food Consumption Score above 42
2) Three food access groups (‘poor’, ‘average’ or ‘good’), which used average monthly cash per capita from four
main income sources9, were compared to the official extreme poverty line and to the poverty line:
Food Access Groups
Poor: Less than 1,050 KGS per capita per month (extreme poverty line in 2012).
Average: Between 1,050.5 and 1,744 KGS per capita per month (poverty line in 2012)
Good: More than 1,744 KGS per capita per month.
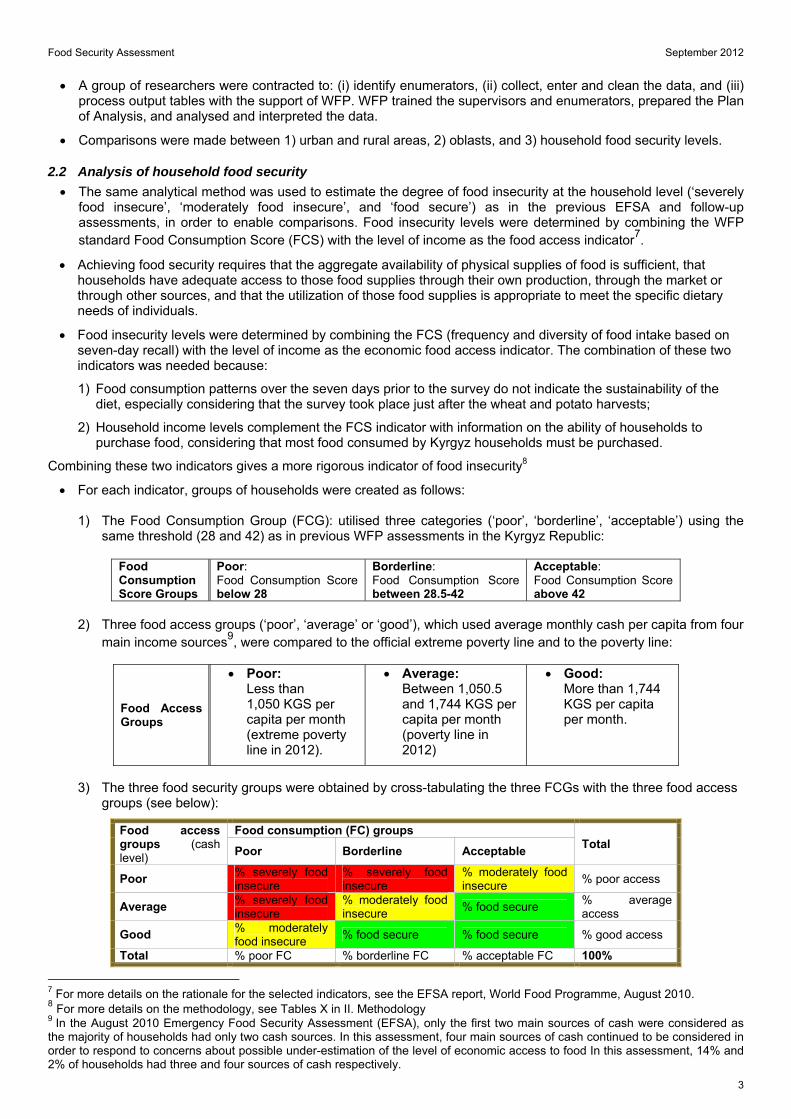
3) The three food security groups were obtained by cross-tabulating the three FCGs with the three food access
groups (see below):
Food access groups (cash level)
Food consumption (FC) groupsTotal
Poor Borderline Acceptable
Poor % severely food insecure
% severely food insecure
% moderately food insecure
% poor access
Average % severely food insecure
% moderately food insecure
% food secure % average access
Good % moderately food insecure
% food secure % food secure % good access
Total % poor FC % borderline FC % acceptable FC 100%
7 For more details on the rationale for the selected indicators, see the EFSA report, World Food Programme, August 2010. 8 For more details on the methodology, see Tables X in II. Methodology 9 In the August 2010 Emergency Food Security Assessment (EFSA), only the first two main sources of cash were considered as the majority of households had only two cash sources. In this assessment, four main sources of cash continued to be considered in order to respond to concerns about possible under-estimation of the level of economic access to food In this assessment, 14% and 2% of households had three and four sources of cash respectively.
Food Security Assessment September 2012
4
Enumerator training was completed in two days and supervision of the enumerators was ensured in all sampled locations. 41 interviewers were involved in the data collection; most of them were already familiar with WFP questionnaires as they had supported WFP monitoring in 2011 and 2012. The workload of the enumerators was deliberately light (on average 48 household questionnaires over 24 days), to allow adequate time for high-quality data gathering.
2.3 Limitations
The sampling approach that was used did not enable the identification of areas of high food insecurity below the level of oblasts, nor for individual cities in the oblasts. An additional step of analysis would be needed within each oblast to determine this.
Food Security Assessment September 2012
5
III – RESULTS
3.1 Household food security and trends
3.1.1 How many are food insecure?
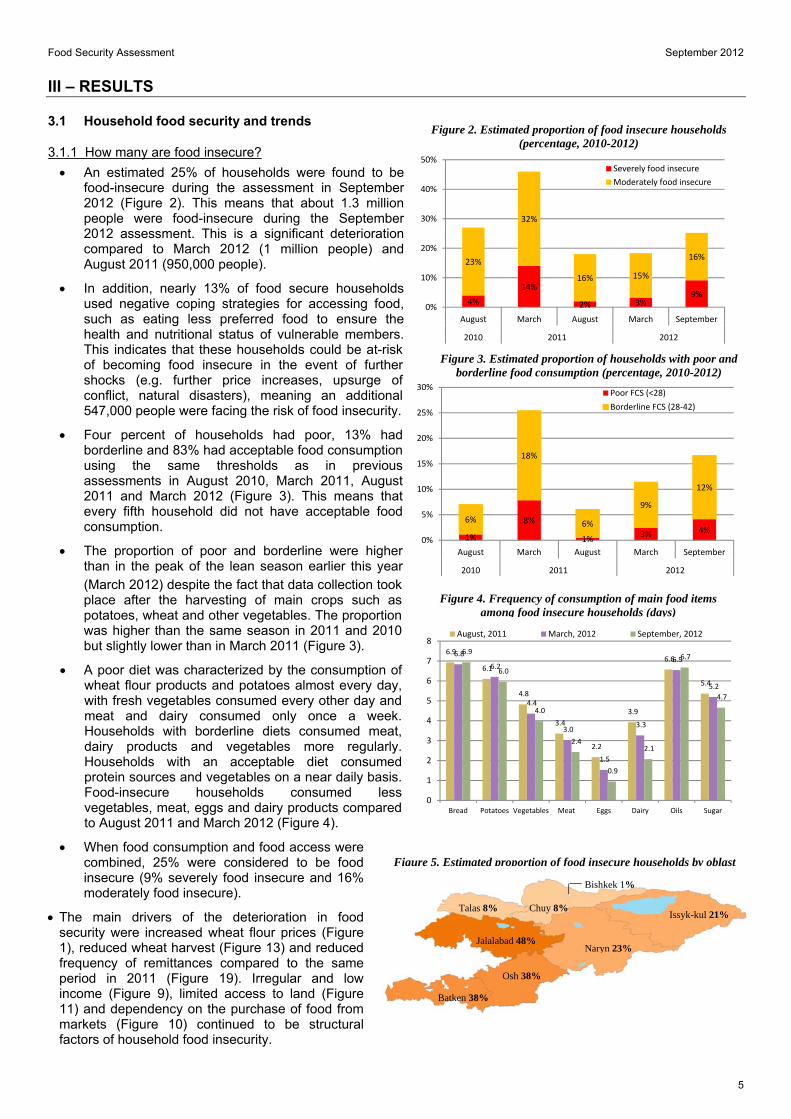
An estimated 25% of households were found to be food-insecure during the assessment in September 2012 (Figure 2). This means that about 1.3 million people were food-insecure during the September 2012 assessment. This is a significant deterioration compared to March 2012 (1 million people) and August 2011 (950,000 people).
In addition, nearly 13% of food secure households used negative coping strategies for accessing food, such as eating less preferred food to ensure the health and nutritional status of vulnerable members. This indicates that these households could be at-risk of becoming food insecure in the event of further shocks (e.g. further price increases, upsurge of conflict, natural disasters), meaning an additional 547,000 people were facing the risk of food insecurity.
Four percent of households had poor, 13% had borderline and 83% had acceptable food consumption using the same thresholds as in previous assessments in August 2010, March 2011, August 2011 and March 2012 (Figure 3). This means that every fifth household did not have acceptable food consumption.
The proportion of poor and borderline were higher than in the peak of the lean season earlier this year (March 2012) despite the fact that data collection took place after the harvesting of main crops such as potatoes, wheat and other vegetables. The proportion was higher than the same season in 2011 and 2010 but slightly lower than in March 2011 (Figure 3).
A poor diet was characterized by the consumption of wheat flour products and potatoes almost every day, with fresh vegetables consumed every other day and meat and dairy consumed only once a week. Households with borderline diets consumed meat, dairy products and vegetables more regularly. Households with an acceptable diet consumed protein sources and vegetables on a near daily basis. Food-insecure households consumed less vegetables, meat, eggs and dairy products compared to August 2011 and March 2012 (Figure 4).
When food consumption and food access were combined, 25% were considered to be food insecure (9% severely food insecure and 16% moderately food insecure).
The main drivers of the deterioration in food security were increased wheat flour prices (Figure 1), reduced wheat harvest (Figure 13) and reduced frequency of remittances compared to the same period in 2011 (Figure 19). Irregular and low income (Figure 9), limited access to land (Figure 11) and dependency on the purchase of food from markets (Figure 10) continued to be structural factors of household food insecurity.
4%
14%
2% 3%9%
23%
32%
16% 15%
16%
0%
10%
20%
30%
40%
50%
August March August March September
2010 2011 2012
Severely food insecure
Moderately food insecure
Figure 2. Estimated proportion of food insecure households (percentage, 2010-2012)
6.9
6.1
4.8
3.4
2.2
3.9
6.6
5.4
6.8
6.2
4.4
3.0
1.5
3.3
6.5
5.2
6.9
6.0
4.0
2.4
0.9
2.1
6.7
4.7
0
1
2
3
4
5
6
7
8
Bread Potatoes Vegetables Meat Eggs Dairy Oils Sugar
August, 2011 March, 2012 September, 2012
Figure 4. Frequency of consumption of main food items among food insecure households (days)
1%
8%
1%3% 4%
6%
18%
6%
9%
12%
0%
5%
10%
15%
20%
25%
30%
August March August March September
2010 2011 2012
Poor FCS (<28)
Borderline FCS (28‐42)
Figure 3. Estimated proportion of households with poor and borderline food consumption (percentage, 2010-2012)
Figure 5. Estimated proportion of food insecure households by oblast
Bishkek 1%
Chuy 8% Talas 8%Issyk-kul 21%
Naryn 23% Jalalabad 48%
Osh 38%
Batken 38%
Food Security Assessment September 2012
6
3.1.2 Where are the food insecure?
The Kyrgyz Republic has seven sub-national regions (oblasts): Chuy, Talas, Issyk-kul, Naryn, Osh, Jalalabad and Batken. The results of the assessment were statistically representative for each oblast and Bishkek, the largest city in the country. Agro-ecological or livelihoods zones were not taken into consideration for the analysis, because the livelihoods zoning exercise was not completed by the time of the survey. Considering agro-ecological diversity within some oblasts, key results of the assessment should be re-analysed for each agro-ecological or livelihoods zone.
Food insecurity was more prevalent in rural areas. Thirty-five percent of rural households were food insecure (13% severely and 22% moderately food insecure) while 9% of urban households were food insecure (3% severely and 6% moderately). The proportion was significantly higher on both a seasonal and year-on-year basis in rural areas, while there was only a slight increase from March 2012 and August 2011 in urban areas.
The highest proportion of food insecurity was found in Jalalabad (48%), Osh (38%) and Batken (38%) oblasts, followed by Naryn (23%) and Issyk-Kul (21%) oblasts (Figure 5).
The bulk of the food-insecure and at-risk population was located in Osh, Jalalabad and Batken oblasts (Figure 23) reflecting higher levels of food insecurity as well as the large population in these oblasts. The assessment identified reduced frequency of remittances, limited land available for crop production and dependency on irregular cash as potential reasons for deterioration in these areas, in addition to increased food prices.
The best food security situation continued to be in Bishkek city (1%).
3.1.3 Who are the food insecure? Demography
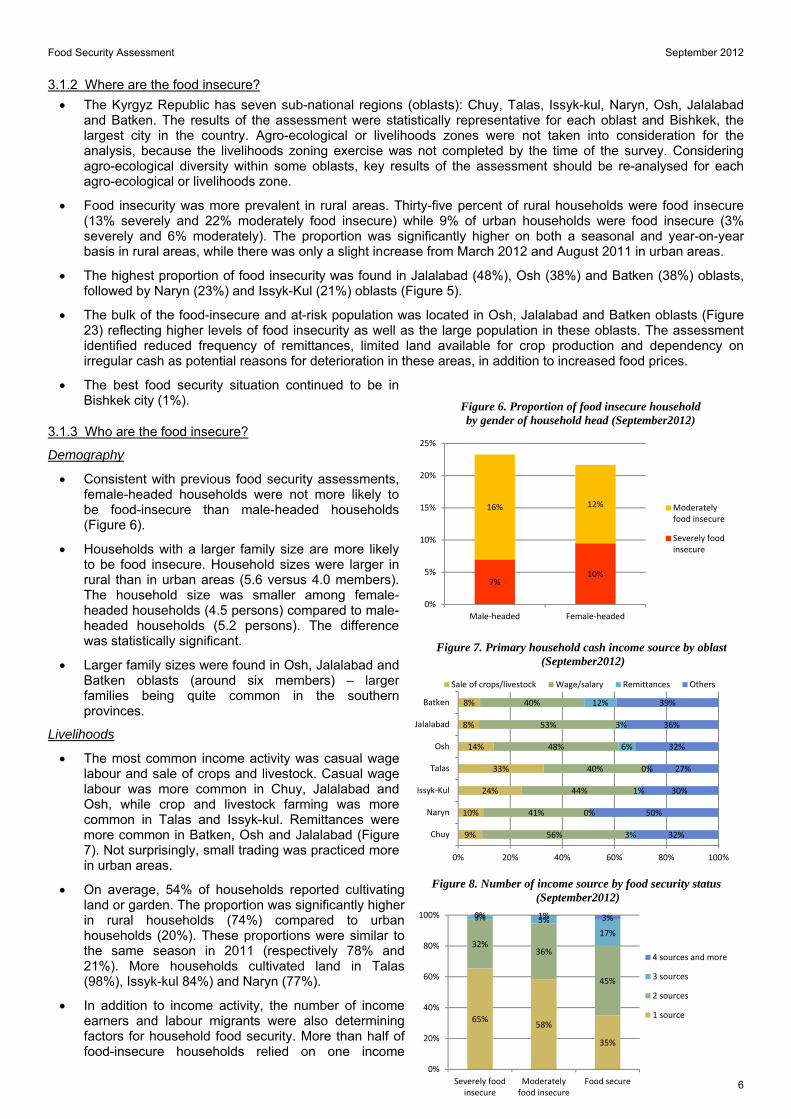
Consistent with previous food security assessments, female-headed households were not more likely to be food-insecure than male-headed households (Figure 6).
Households with a larger family size are more likely to be food insecure. Household sizes were larger in rural than in urban areas (5.6 versus 4.0 members). The household size was smaller among female-headed households (4.5 persons) compared to male-headed households (5.2 persons). The difference was statistically significant.
Larger family sizes were found in Osh, Jalalabad and Batken oblasts (around six members) – larger families being quite common in the southern provinces.
Livelihoods
The most common income activity was casual wage labour and sale of crops and livestock. Casual wage labour was more common in Chuy, Jalalabad and Osh, while crop and livestock farming was more common in Talas and Issyk-kul. Remittances were more common in Batken, Osh and Jalalabad (Figure 7). Not surprisingly, small trading was practiced more in urban areas.
On average, 54% of households reported cultivating land or garden. The proportion was significantly higher in rural households (74%) compared to urban households (20%). These proportions were similar to the same season in 2011 (respectively 78% and 21%). More households cultivated land in Talas (98%), Issyk-kul 84%) and Naryn (77%).
In addition to income activity, the number of income earners and labour migrants were also determining factors for household food security. More than half of food-insecure households relied on one income
Figure 7. Primary household cash income source by oblast (September2012)
9%
10%
24%
33%
14%
8%
8%
56%
41%
44%
40%
48%
53%
40%
3%
0%
1%
0%
6%
3%
12%
32%
50%
30%
27%
32%
36%
39%
0% 20% 40% 60% 80% 100%
Chuy
Naryn
Issyk‐Kul
Talas
Osh
Jalalabad
Batken
Sale of crops/livestock Wage/salary Remittances Others
65%58%
35%
32%36%
45%
3% 5%
17%
0% 1% 3%
0%
20%
40%
60%
80%
100%
Severely foodinsecure
Moderatelyfood insecure
Food secure
4 sources and more
3 sources
2 sources
1 source
Figure 8. Number of income source by food security status (September2012)
7%10%
16% 12%
0%
5%
10%
15%
20%
25%
Male‐headed Female‐headed
Moderatelyfood insecure
Severely foodinsecure
Figure 6. Proportion of food insecure household by gender of household head (September2012)
Food
As
3.2
3.2.
Security Asses
source, wmore than
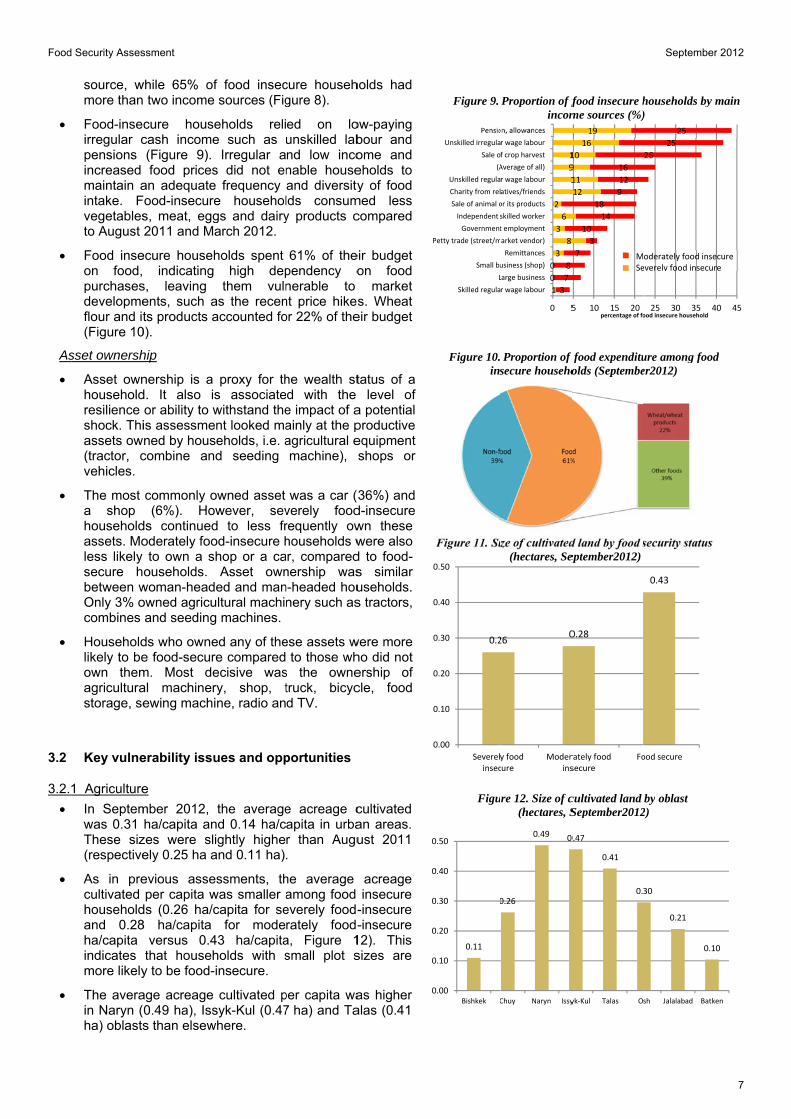
Food-inseirregular cpensions increased maintain aintake. Fvegetablesto August
Food inseon food, purchasesdevelopmeflour and it(Figure 10
sset ownersh
Asset ownhouseholdresilience shock. Thiassets ow(tractor, cvehicles.
The most a shop householdassets. Moless likely secure hbetween wOnly 3% ocombines
Householdlikely to beown themagriculturastorage, se
Key vulne
1 Agriculture
In Septemwas 0.31 These siz(respective
As in precultivated householdand 0.28ha/capita indicates more likely
The averain Naryn (ha) oblasts
ssment
while 65% of two income
cure housecash income(Figure 9). food prices
an adequateFood-insecures, meat, egg2011 and M
ecure househ indicating
s, leaving ents, such ats products a
0).
hip
nership is a d. It also isor ability to wis assessme
wned by houscombine an
commonly o(6%). Ho
ds continuedoderately foo
to own a souseholds.
woman-headowned agricuand seeding
ds who ownee food-securm. Most deal machinerewing machi
erability issu
e
mber 2012, ha/capita an
zes were slely 0.25 ha a
evious asseper capita w
ds (0.26 ha/c8 ha/capita
versus 0.4that househ
y to be food-
age acreage 0.49 ha), Isss than elsew
f food insec sources (Fig
eholds relie such as
Irregular as did not ene frequency e householgs and dairyarch 2012.
holds spent high dep
them vulnas the recenaccounted fo
proxy for ths associatewithstand the
ent looked maseholds, i.e. ad seeding
owned asset owever, sevd to less frod-insecure hhop or a caAsset own
ded and manultural machig machines.
ed any of there comparedecisive wasry, shop, tine, radio an
ues and opp
the averagend 0.14 ha/cightly highe
and 0.11 ha)
essments, thwas smaller acapita for se
for mode43 ha/capitaholds with sinsecure.
cultivated psyk-Kul (0.47
where.
cure househgure 8).
ed on lounskilled labnd low inconable houseand diversitylds consumy products c
61% of thependency onerable to nt price hikesor 22% of the
he wealth std with the e impact of aainly at the pagricultural emachine),
was a car (verely foodrequently owhouseholds w
ar, comparednership wasn-headed hounery such as
ese assets w to those wh
s the ownetruck, bicycd TV.
portunities
e acreage capita in urbar than Augu.
he average among food everely food-rately food-a, Figure 1small plot s
per capita wa7 ha) and Ta
holds had
ow-paying bour and ome and eholds to y of food
med less compared
eir budget on food
market s. Wheat
eir budget
tatus of a level of
a potential productive equipment shops or
36%) and d-insecure wn these were also d to food-s similar useholds. s tractors,
were more ho did not ership of cle, food
cultivated an areas. ust 2011
acreage insecure
-insecure -insecure
12). This sizes are
as higher alas (0.41
Figure 11. Si
0.2
0.00
0.10
0.20
0.30
0.40
0.50
Severelinsec
0.11
0
0.00
0.10
0.20
0.30
0.40
0.50
Bishkek C
Figu
Figure 10.ins
Skilled regula
L
Small bu
Petty trade (street/m
Government
Independent
Sale of animal o
Charity from rel
Unskilled regula
(A
Sale o
Unskilled irregula
Pensio
Figure 9.
ze of cultivated (hectares, Sep
260
y foodcure
Moderins
0.26
0.49 0
Chuy Naryn Issy
re 12. Size of c (hectares, S
Proportion of fsecure househo
1
0
0
3
8
3
6
2
1
9
1
3
7
8
0 5
r wage labour
Large business
usiness (shop)
Remittances
arket vendor)
t employment
skilled worker
or its products
atives/friends
r wage labour
Average of all)
f crop harvest
r wage labour
on, allowances
Proportion of fincom
d land by food september2012)
0.28
rately foodsecure
Fo
0.47
0.41
0.
yk‐Kul Talas O
cultivated land September2012
f food expendituolds (Septembe
12
11
9
10
16
19
7
3
10
14
18
9
12
16
5 10 15 20percentage of fo
food insecure hme sources (%)
MSe
September
security status
0.43
ood secure
30
0.21
0.1
sh Jalalabad Batk
by oblast 2)
ure among fooder2012)
26
25
25
25 30 35 4ood insecure household
households by )
oderately food inseeverely food insecur
r 2012
7
10
ken
d
40 45
main
ecure re
Food Security Assessment September 2012
8
0%
20%
40%
60%
80%
Bishkek Chuy Naryn Issyk‐Kul Talas Osh Jalalabad Batken
2011 August 2012 March 2012 September
Figure 17. Proportions of households who owned livestock (%, August 2011, March 2012, September 2012)
22
38
44
0
10
20
30
40
50
Severely food insecure Moderately foodinsecure
Food secure
Figure 15. Average duration of wheat stock for family consumption by food security levels (days, September 2012)
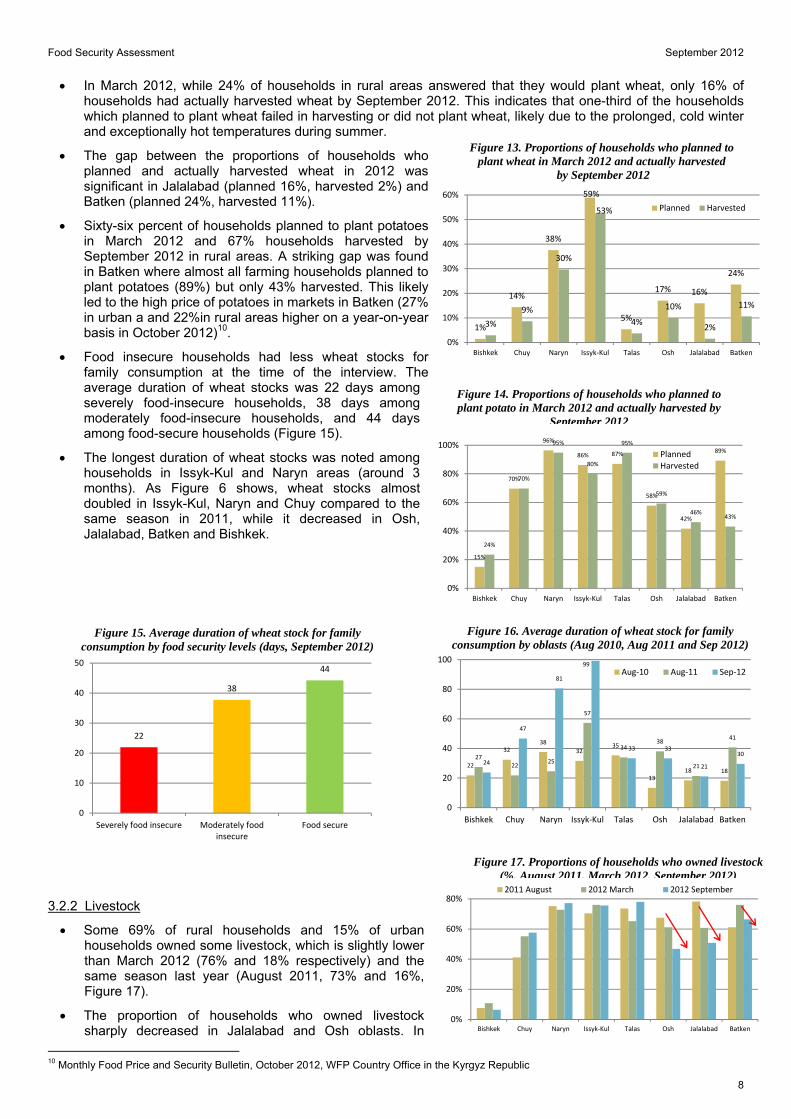
In March 2012, while 24% of households in rural areas answered that they would plant wheat, only 16% of households had actually harvested wheat by September 2012. This indicates that one-third of the households which planned to plant wheat failed in harvesting or did not plant wheat, likely due to the prolonged, cold winter and exceptionally hot temperatures during summer.
The gap between the proportions of households who planned and actually harvested wheat in 2012 was significant in Jalalabad (planned 16%, harvested 2%) and Batken (planned 24%, harvested 11%).
Sixty-six percent of households planned to plant potatoes in March 2012 and 67% households harvested by September 2012 in rural areas. A striking gap was found in Batken where almost all farming households planned to plant potatoes (89%) but only 43% harvested. This likely led to the high price of potatoes in markets in Batken (27% in urban a and 22%in rural areas higher on a year-on-year basis in October 2012)10.
Food insecure households had less wheat stocks for family consumption at the time of the interview. The average duration of wheat stocks was 22 days among severely food-insecure households, 38 days among moderately food-insecure households, and 44 days among food-secure households (Figure 15).
The longest duration of wheat stocks was noted among households in Issyk-Kul and Naryn areas (around 3 months). As Figure 6 shows, wheat stocks almost doubled in Issyk-Kul, Naryn and Chuy compared to the same season in 2011, while it decreased in Osh, Jalalabad, Batken and Bishkek.
3.2.2 Livestock
Some 69% of rural households and 15% of urban households owned some livestock, which is slightly lower than March 2012 (76% and 18% respectively) and the same season last year (August 2011, 73% and 16%, Figure 17).
The proportion of households who owned livestock sharply decreased in Jalalabad and Osh oblasts. In
10 Monthly Food Price and Security Bulletin, October 2012, WFP Country Office in the Kyrgyz Republic
1%
14%
38%
59%
5%
17% 16%
24%
3%
9%
30%
53%
4%
10%
2%
11%
0%
10%
20%
30%
40%
50%
60%
Bishkek Chuy Naryn Issyk‐Kul Talas Osh Jalalabad Batken
Planned Harvested
Figure 13. Proportions of households who planned to plant wheat in March 2012 and actually harvested
by September 2012
15%
70%
96%
86% 87%
58%
42%
89%
24%
70%
95%
80%
95%
59%
46%43%
0%
20%
40%
60%
80%
100%
Bishkek Chuy Naryn Issyk‐Kul Talas Osh Jalalabad Batken
PlannedHarvested
Figure 14. Proportions of households who planned to plant potato in March 2012 and actually harvested by
September 2012
22
3238
3235
1318 18
27
2225
57
3438
21
41
24
47
81
99
33 33
21
30
0
20
40
60
80
100
Bishkek Chuy Naryn Issyk‐Kul Talas Osh Jalalabad Batken
Aug‐10 Aug‐11 Sep‐12
Figure 16. Average duration of wheat stock for family consumption by oblasts (Aug 2010, Aug 2011 and Sep 2012)
Food Security Assessment September 2012
9
August 2011 78% in Jalalabad and 68% in Osh owned livestock, but it decreased to 51% and 47% respectively in September 2012. This indicates that 27% and 21% of households in the respective oblasts lost livestock.
While the average number of small ruminants, the most commonly owned livestock, increased on a year-on-year basis from 8.1 to 9.6 (per household) among food-secure households, the number decreased among severely food-insecure households (6.8 in August 2011 to 4.8 in September 2012).
This information can be utilized for targeting purposes and also for the design of specific livelihood programmes aiming to increase ownership of productive livelihood assets such as livestock, farming and fishing equipment.
Sale of meat was restricted in Jalalabad oblast in September 2012 due to a widespread livestock disease in the area. During the data collection, some respondents in Jalalabad mentioned that they had to reduce consumption of meat and meat products.
3.2.3 Labour migration
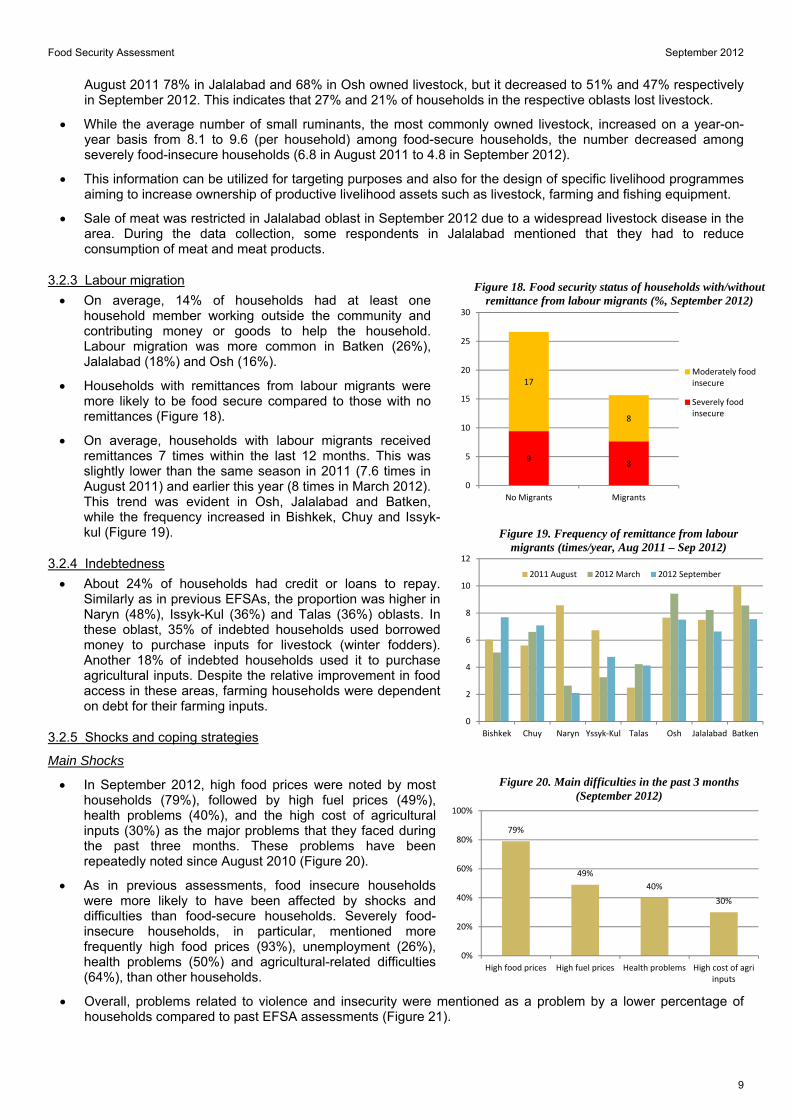
On average, 14% of households had at least one household member working outside the community and contributing money or goods to help the household. Labour migration was more common in Batken (26%), Jalalabad (18%) and Osh (16%).
Households with remittances from labour migrants were more likely to be food secure compared to those with no remittances (Figure 18).
On average, households with labour migrants received remittances 7 times within the last 12 months. This was slightly lower than the same season in 2011 (7.6 times in August 2011) and earlier this year (8 times in March 2012). This trend was evident in Osh, Jalalabad and Batken, while the frequency increased in Bishkek, Chuy and Issyk-kul (Figure 19).
3.2.4 Indebtedness
About 24% of households had credit or loans to repay. Similarly as in previous EFSAs, the proportion was higher in Naryn (48%), Issyk-Kul (36%) and Talas (36%) oblasts. In these oblast, 35% of indebted households used borrowed money to purchase inputs for livestock (winter fodders). Another 18% of indebted households used it to purchase agricultural inputs. Despite the relative improvement in food access in these areas, farming households were dependent on debt for their farming inputs.
3.2.5 Shocks and coping strategies
Main Shocks
In September 2012, high food prices were noted by most households (79%), followed by high fuel prices (49%), health problems (40%), and the high cost of agricultural inputs (30%) as the major problems that they faced during the past three months. These problems have been repeatedly noted since August 2010 (Figure 20).
As in previous assessments, food insecure households were more likely to have been affected by shocks and difficulties than food-secure households. Severely food-insecure households, in particular, mentioned more frequently high food prices (93%), unemployment (26%), health problems (50%) and agricultural-related difficulties (64%), than other households.
Overall, problems related to violence and insecurity were mentioned as a problem by a lower percentage of households compared to past EFSA assessments (Figure 21).
98
17
8
0
5
10
15
20
25
30
No Migrants Migrants
Moderately foodinsecure
Severely foodinsecure
Figure 18. Food security status of households with/without remittance from labour migrants (%, September 2012)
0
2
4
6
8
10
12
Bishkek Chuy Naryn Yssyk‐Kul Talas Osh Jalalabad Batken
2011 August 2012 March 2012 September
Figure 19. Frequency of remittance from labour migrants (times/year, Aug 2011 – Sep 2012)
79%
49%
40%
30%
0%
20%
40%
60%
80%
100%
High food prices High fuel prices Health problems High cost of agriinputs
Figure 20. Main difficulties in the past 3 months (September 2012)
Food Security Assessment September 2012
10
Coping strategies
The same questions about coping strategies which were asked in previous EFSAs were repeated in order to enable comparisons.
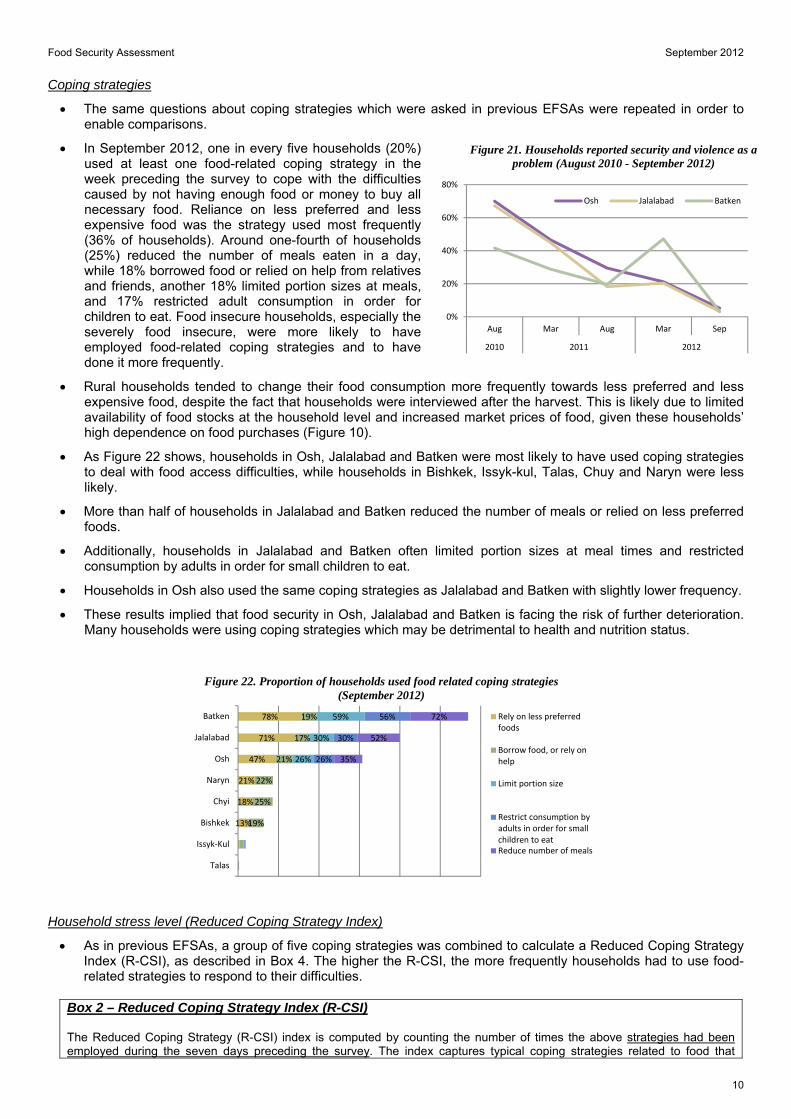
In September 2012, one in every five households (20%) used at least one food-related coping strategy in the week preceding the survey to cope with the difficulties caused by not having enough food or money to buy all necessary food. Reliance on less preferred and less expensive food was the strategy used most frequently (36% of households). Around one-fourth of households (25%) reduced the number of meals eaten in a day, while 18% borrowed food or relied on help from relatives and friends, another 18% limited portion sizes at meals, and 17% restricted adult consumption in order for children to eat. Food insecure households, especially the severely food insecure, were more likely to have employed food-related coping strategies and to have done it more frequently.
Rural households tended to change their food consumption more frequently towards less preferred and less expensive food, despite the fact that households were interviewed after the harvest. This is likely due to limited availability of food stocks at the household level and increased market prices of food, given these households’ high dependence on food purchases (Figure 10).
As Figure 22 shows, households in Osh, Jalalabad and Batken were most likely to have used coping strategies to deal with food access difficulties, while households in Bishkek, Issyk-kul, Talas, Chuy and Naryn were less likely.
More than half of households in Jalalabad and Batken reduced the number of meals or relied on less preferred foods.
Additionally, households in Jalalabad and Batken often limited portion sizes at meal times and restricted consumption by adults in order for small children to eat.
Households in Osh also used the same coping strategies as Jalalabad and Batken with slightly lower frequency.
These results implied that food security in Osh, Jalalabad and Batken is facing the risk of further deterioration. Many households were using coping strategies which may be detrimental to health and nutrition status.
Household stress level (Reduced Coping Strategy Index)
As in previous EFSAs, a group of five coping strategies was combined to calculate a Reduced Coping Strategy Index (R-CSI), as described in Box 4. The higher the R-CSI, the more frequently households had to use food-related strategies to respond to their difficulties.
Box 2 – Reduced Coping Strategy Index (R-CSI) The Reduced Coping Strategy (R-CSI) index is computed by counting the number of times the above strategies had been employed during the seven days preceding the survey. The index captures typical coping strategies related to food that
13%
18%
21%
47%
71%
78%
19%
25%
22%
21%
17%
19%
26%
30%
59%
26%
30%
56%
35%
52%
72%
0% 50% 100% 150% 200% 250% 300%
Talas
Issyk‐Kul
Bishkek
Chyi
Naryn
Osh
Jalalabad
Batken Rely on less preferredfoods
Borrow food, or rely onhelp
Limit portion size
Restrict consumption byadults in order for smallchildren to eatReduce number of meals
Figure 22. Proportion of households used food related coping strategies (September 2012)
0%
20%
40%
60%
80%
Aug Mar Aug Mar Sep
2010 2011 2012
Osh Jalalabad Batken
Figure 21. Households reported security and violence as a problem (August 2010 - September 2012)
Food Security Assessment September 2012
11
households employ when they face difficulties in meeting their food consumption requirements: rely on less preferred and less expensive food; borrow food, or rely on help from a friend or relative; limit portion size at meal times; restrict consumption by adults in order for small children to eat; reduce number of meals eaten in a day. The higher the R-CSI, the more frequently households had to use the strategies in an attempt to resolve their difficulties, thus reflecting greater hardship for these households.
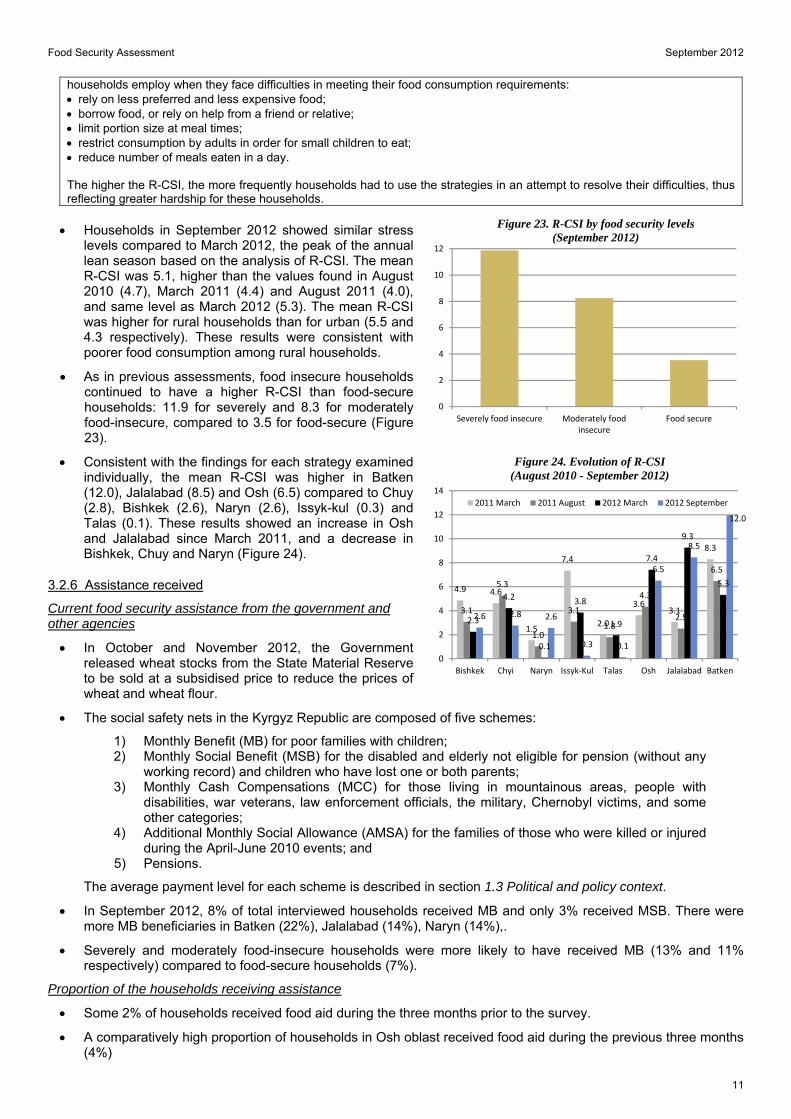
Households in September 2012 showed similar stress
levels compared to March 2012, the peak of the annual lean season based on the analysis of R-CSI. The mean R-CSI was 5.1, higher than the values found in August 2010 (4.7), March 2011 (4.4) and August 2011 (4.0), and same level as March 2012 (5.3). The mean R-CSI was higher for rural households than for urban (5.5 and 4.3 respectively). These results were consistent with poorer food consumption among rural households.
As in previous assessments, food insecure households continued to have a higher R-CSI than food-secure households: 11.9 for severely and 8.3 for moderately food-insecure, compared to 3.5 for food-secure (Figure 23).
Consistent with the findings for each strategy examined individually, the mean R-CSI was higher in Batken (12.0), Jalalabad (8.5) and Osh (6.5) compared to Chuy (2.8), Bishkek (2.6), Naryn (2.6), Issyk-kul (0.3) and Talas (0.1). These results showed an increase in Osh and Jalalabad since March 2011, and a decrease in Bishkek, Chuy and Naryn (Figure 24).
3.2.6 Assistance received
Current food security assistance from the government and other agencies
In October and November 2012, the Government released wheat stocks from the State Material Reserve to be sold at a subsidised price to reduce the prices of wheat and wheat flour.
The social safety nets in the Kyrgyz Republic are composed of five schemes:
1) Monthly Benefit (MB) for poor families with children; 2) Monthly Social Benefit (MSB) for the disabled and elderly not eligible for pension (without any
working record) and children who have lost one or both parents; 3) Monthly Cash Compensations (MCC) for those living in mountainous areas, people with
disabilities, war veterans, law enforcement officials, the military, Chernobyl victims, and some other categories;
4) Additional Monthly Social Allowance (AMSA) for the families of those who were killed or injured during the April-June 2010 events; and
5) Pensions.
The average payment level for each scheme is described in section 1.3 Political and policy context.
In September 2012, 8% of total interviewed households received MB and only 3% received MSB. There were more MB beneficiaries in Batken (22%), Jalalabad (14%), Naryn (14%),.
Severely and moderately food-insecure households were more likely to have received MB (13% and 11% respectively) compared to food-secure households (7%).
Proportion of the households receiving assistance
Some 2% of households received food aid during the three months prior to the survey.
A comparatively high proportion of households in Osh oblast received food aid during the previous three months (4%)
0
2
4
6
8
10
12
Severely food insecure Moderately foodinsecure
Food secure
4.9 4.6
1.5
7.4
2.0
3.63.1
8.3
3.1
5.3
1.0
3.1
1.8
4.3
2.5
6.5
2.3
4.2
0.1
3.8
1.9
7.4
9.3
5.3
2.6 2.8 2.6
0.3 0.1
6.5
8.5
12.0
0
2
4
6
8
10
12
14
Bishkek Chyi Naryn Issyk‐Kul Talas Osh Jalalabad Batken
2011 March 2011 August 2012 March 2012 September
Figure 24. Evolution of R-CSI (August 2010 - September 2012)
Figure 23. R-CSI by food security levels (September 2012)
Food Security Assessment September 2012
12
Other types of assistance (hygiene kits, household items, seed, fertilizer, agricultural tools, cash) were received by less than 1% of households.
WFP assistance in the past and within the next 12 months
WFP implemented two emergency operations11 (EMOPs) in the Kyrgyz Republic which were finalized in June 2011:
1) EMOP 108040 in response to high food prices and the energy crisis at the end of 2008. WFP distributed 20,978 MT of food in 2009-2010 under its Vulnerable Group Feeding programme in six oblasts.
2) EMOP 200161 in response to the June 2010 conflict in Osh and Jalalabad oblasts reached more than 550,000 conflict-affected and food insecure beneficiaries at the height of the crisis. It included targeted assistance of 17,500 MT of food distributed in Osh and Jalalabad in 2010 alone.
From July 1, 2011, WFP started implementing PRRO 200036 which was designed based on the recommendations of the March 2011 EFSA and 14,053 MT of food commodities were distributed. It includesthe following main components:
1) Vulnerable Group Feeding - To ensure adequate food consumption for families at risk of falling into acute hunger, particularly food insecure households, which typically include the elderly, children under five, and pregnant and nursing women, that meet the strict selection criteria. This assistance is provided during the winter and pre-harvest periods.
2) Food for Assets/Training - To enable communities with depleted assets to recover and restore productive capacity, protect agricultural land and improve food security. This objective is addressed through food for assets and training.
3) Food Security Monitoring System - To strengthen national capacity to assess and respond to food insecurity through improved monitoring and social protection, including FSMS. These activities correspond to Strategic Objective 5: “Strengthen the capacities of countries to reduce hunger through hand-over strategies and local purchase”.
11 EMOP 108040 “Winter Emergency Food Aid Response” 1st January 2009 to 30 June 2011 – EMOP 200161 “Food Assistance to Conflict-Affected Populations” 1st July 2010 to 30 June 2011
Food Security Assessment September 2012
13
IV – SUMMARY OF CURRENT FOOD SECURITY SITUATION AND FORECASTED DEVELOPMENT
4.1 Summary of the food security situation and main factors
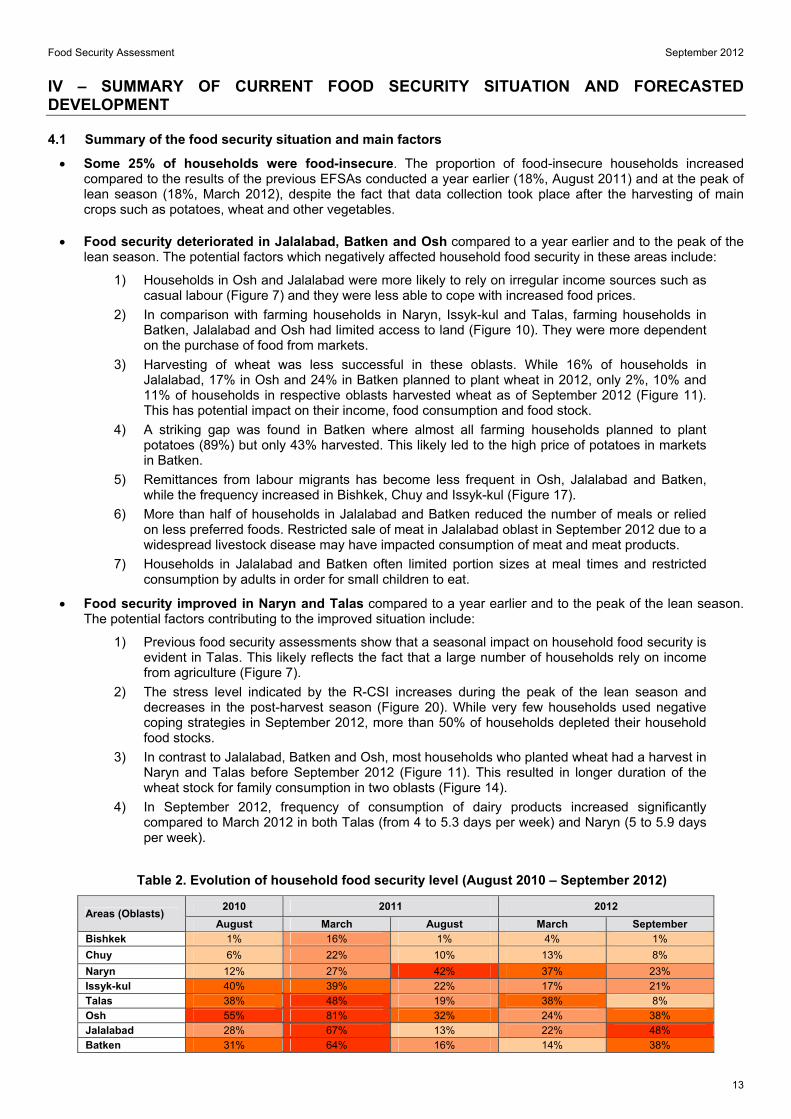
Some 25% of households were food-insecure. The proportion of food-insecure households increased compared to the results of the previous EFSAs conducted a year earlier (18%, August 2011) and at the peak of lean season (18%, March 2012), despite the fact that data collection took place after the harvesting of main crops such as potatoes, wheat and other vegetables.
Food security deteriorated in Jalalabad, Batken and Osh compared to a year earlier and to the peak of the lean season. The potential factors which negatively affected household food security in these areas include:
1) Households in Osh and Jalalabad were more likely to rely on irregular income sources such as casual labour (Figure 7) and they were less able to cope with increased food prices.
2) In comparison with farming households in Naryn, Issyk-kul and Talas, farming households in Batken, Jalalabad and Osh had limited access to land (Figure 10). They were more dependent on the purchase of food from markets.
3) Harvesting of wheat was less successful in these oblasts. While 16% of households in Jalalabad, 17% in Osh and 24% in Batken planned to plant wheat in 2012, only 2%, 10% and 11% of households in respective oblasts harvested wheat as of September 2012 (Figure 11). This has potential impact on their income, food consumption and food stock.
4) A striking gap was found in Batken where almost all farming households planned to plant potatoes (89%) but only 43% harvested. This likely led to the high price of potatoes in markets in Batken.
5) Remittances from labour migrants has become less frequent in Osh, Jalalabad and Batken, while the frequency increased in Bishkek, Chuy and Issyk-kul (Figure 17).
6) More than half of households in Jalalabad and Batken reduced the number of meals or relied on less preferred foods. Restricted sale of meat in Jalalabad oblast in September 2012 due to a widespread livestock disease may have impacted consumption of meat and meat products.
7) Households in Jalalabad and Batken often limited portion sizes at meal times and restricted consumption by adults in order for small children to eat.
Food security improved in Naryn and Talas compared to a year earlier and to the peak of the lean season. The potential factors contributing to the improved situation include:
1) Previous food security assessments show that a seasonal impact on household food security is evident in Talas. This likely reflects the fact that a large number of households rely on income from agriculture (Figure 7).
2) The stress level indicated by the R-CSI increases during the peak of the lean season and decreases in the post-harvest season (Figure 20). While very few households used negative coping strategies in September 2012, more than 50% of households depleted their household food stocks.
3) In contrast to Jalalabad, Batken and Osh, most households who planted wheat had a harvest in Naryn and Talas before September 2012 (Figure 11). This resulted in longer duration of the wheat stock for family consumption in two oblasts (Figure 14).
4) In September 2012, frequency of consumption of dairy products increased significantly compared to March 2012 in both Talas (from 4 to 5.3 days per week) and Naryn (5 to 5.9 days per week).
Table 2. Evolution of household food security level (August 2010 – September 2012)
Areas (Oblasts) 2010 2011 2012
August March August March September Bishkek 1% 16% 1% 4% 1%
Chuy 6% 22% 10% 13% 8%
Naryn 12% 27% 42% 37% 23% Issyk-kul 40% 39% 22% 17% 21% Talas 38% 48% 19% 38% 8% Osh 55% 81% 32% 24% 38% Jalalabad 28% 67% 13% 22% 48% Batken 31% 64% 16% 14% 38%
Food Security Assessment September 2012
14
Overall, the diet of the households with poor consumption was exclusively based on staples and oils (consumed 6-7 days a week) with some sugar (4-5 days a week). Consumption of animal and vegetable proteins was essentially absent. This entails serious risks of malnutrition and diseases if continued in the medium and longer term, especially for young children, pregnant and nursing women, and the elderly.
4.2 Forecasted development for the next few months
Increasing expenditures on gas, coal and firewood during winter will put further pressure on the economic capacity of the food-insecure and vulnerable households.
The situation of currently food-insecure and vulnerable households is likely to further deteriorate during winter and early spring when stocks of food are depleted and additional inputs are required for the spring planting campaign.
Price rises of basic food items over and above normal seasonal variations, which was not matched by a corresponding rise of wages, pensions and allowances, could lead to a deterioration of purchasing power. It is unlikely that the cost of the average food basket will go down significantly during the next lean season, considering the observed trend of increasing prices during the same periods in previous years.
Households in Talas and Naryn are more vulnerable to seasonal effects. Household food consumption tended to deteriorate during the pre-harvest period in these areas.
Food Security Assessment September 2012
15
V – SUGGESTIONS FOR FOOD SECURITY ASSISTANCE AND FOR WFP’S OPERATIONS
5.1 Suggestions for food security assistance
In view of limited consumption of animal protein-rich food such as meat and milk, and increasing prices of basic food items, particularly wheat flour, food and nutrition security interventions should consider improving access to basic food. The most vulnerable groups should be targeted to fill caloric needs as well as help ease the burden of increasing expenditures for basic food items. In the absence of improved household food security prior to the next harvest season, food security assistance will likely be required for the 1.3 million persons estimated to be food-insecure at the time of the survey. WFP already targets 230,000 persons in five oblasts through its Vulnerable Group Feeding winter programme and 52,220 persons under Food-for-Asset programme.
To reduce vulnerability to volatile prices of imported wheat, mid- and long- term investment in small scale farmers is required to ensure sustainable yields and resilience to natural disasters and climate change.
Considering the important role of pensions and social transfers to alleviate poverty and food insecurity, measures to strengthen the social assistance system are essential, including an expansion of the Monthly Benefit in coverage and size.
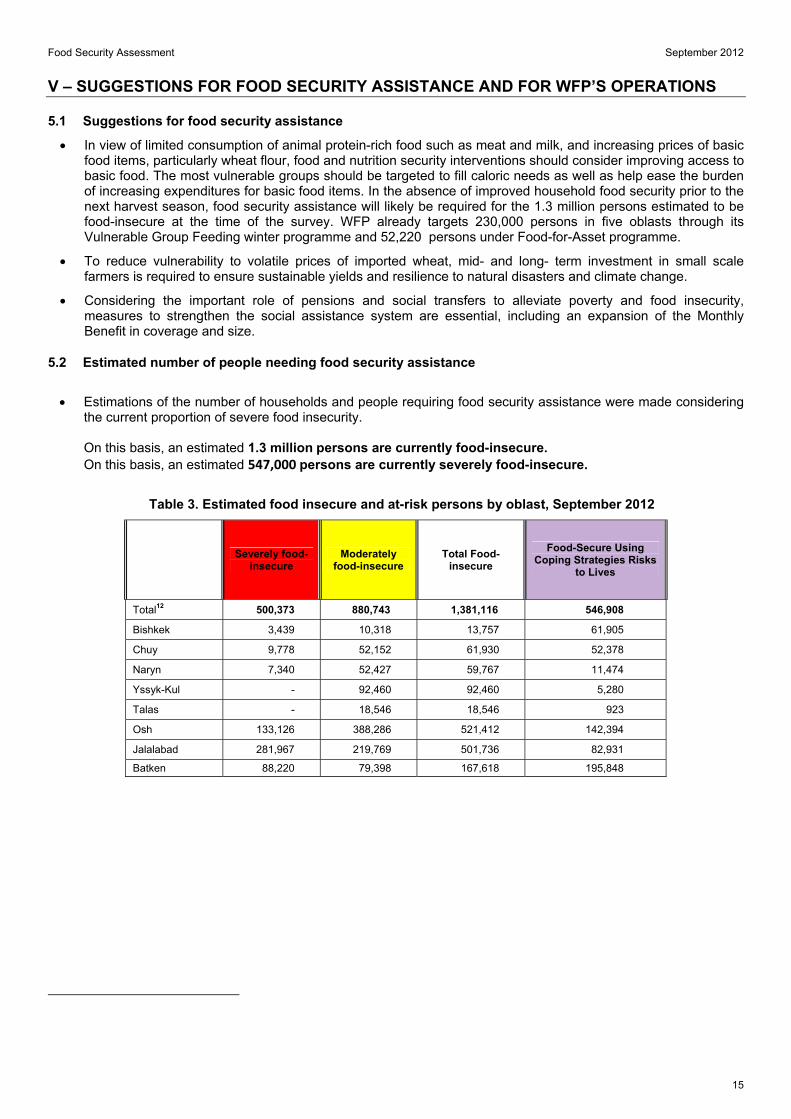
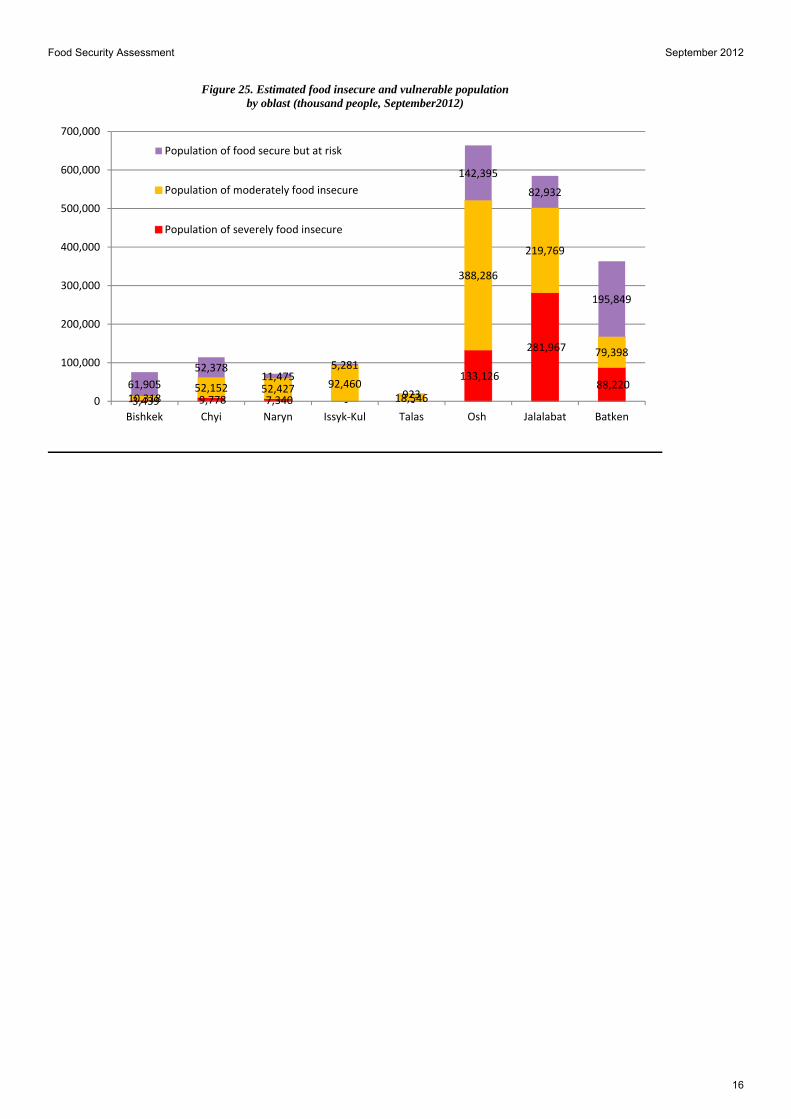
5.2 Estimated number of people needing food security assistance
Estimations of the number of households and people requiring food security assistance were made considering
the current proportion of severe food insecurity. On this basis, an estimated 1.3 million persons are currently food-insecure. On this basis, an estimated 547,000 persons are currently severely food-insecure.
Table 3. Estimated food insecure and at-risk persons by oblast, September 2012
Severely food-insecure
Moderately food-insecure
Total Food-insecure
Food-Secure Using Coping Strategies Risks
to Lives
Total12 500,373 880,743 1,381,116 546,908
Bishkek 3,439 10,318 13,757 61,905
Chuy 9,778 52,152 61,930 52,378
Naryn 7,340 52,427 59,767 11,474
Yssyk-Kul - 92,460 92,460 5,280
Talas - 18,546 18,546 923
Osh 133,126 388,286 521,412 142,394
Jalalabad 281,967 219,769 501,736 82,931
Batken 88,220 79,398 167,618 195,848
Food Security Assessment September 2012
16
3,439 9,778 7,340 ‐ ‐
133,126
281,967
88,220 10,318
52,152 52,427 92,46018,546
388,286
219,769
79,398
61,905
52,37811,475
5,281
923
142,395
82,932
195,849
0
100,000
200,000
300,000
400,000
500,000
600,000
700,000
Bishkek Chyi Naryn Issyk‐Kul Talas Osh Jalalabat Batken
Population of food secure but at risk
Population of moderately food insecure
Population of severely food insecure
Figure 25. Estimated food insecure and vulnerable population by oblast (thousand people, September2012)
Food Security Assessment September 2012
17
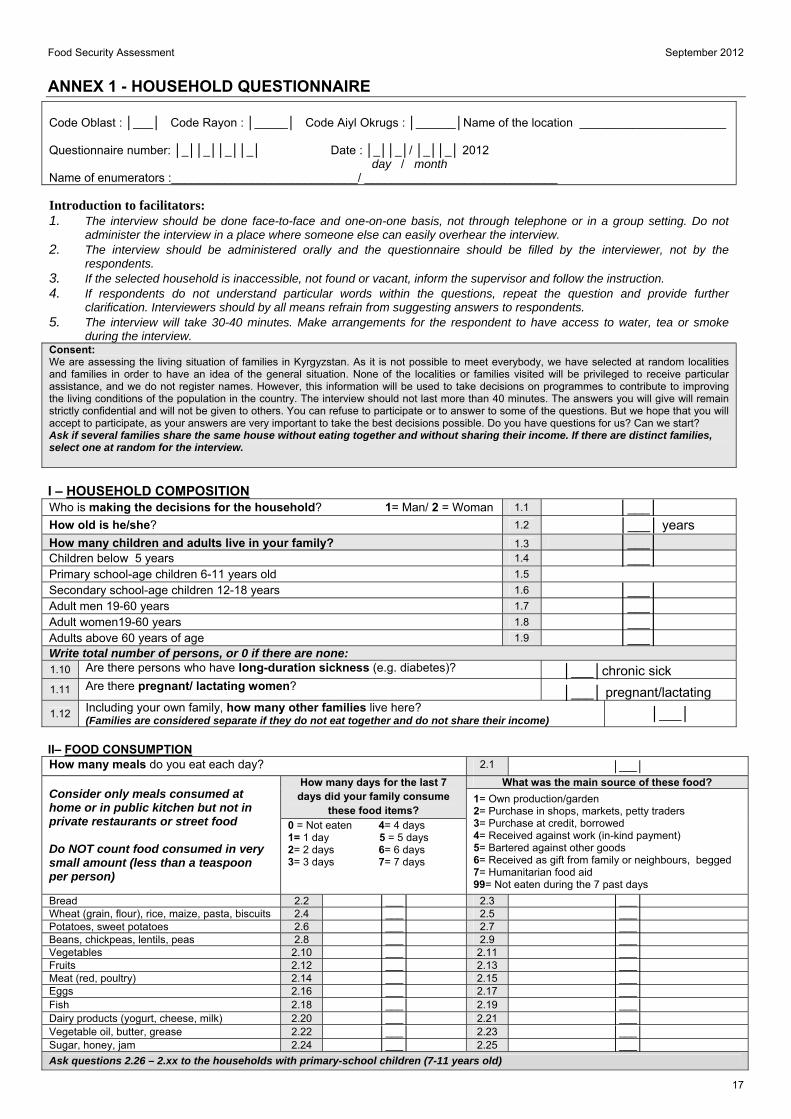
ANNEX 1 - HOUSEHOLD QUESTIONNAIRE Code Oblast : │___│ Code Rayon : │_____│ Code Aiyl Okrugs : │______│Name of the location ______________________ Questionnaire number: │_││_││_││_│ Date : │_││_│/ │_││_│ 2012 day / month Name of enumerators :____________________________/ _____________________________ Introduction to facilitators: 1. The interview should be done face-to-face and one-on-one basis, not through telephone or in a group setting. Do not
administer the interview in a place where someone else can easily overhear the interview. 2. The interview should be administered orally and the questionnaire should be filled by the interviewer, not by the
respondents. 3. If the selected household is inaccessible, not found or vacant, inform the supervisor and follow the instruction. 4. If respondents do not understand particular words within the questions, repeat the question and provide further
clarification. Interviewers should by all means refrain from suggesting answers to respondents. 5. The interview will take 30-40 minutes. Make arrangements for the respondent to have access to water, tea or smoke
during the interview. Consent: We are assessing the living situation of families in Kyrgyzstan. As it is not possible to meet everybody, we have selected at random localities and families in order to have an idea of the general situation. None of the localities or families visited will be privileged to receive particular assistance, and we do not register names. However, this information will be used to take decisions on programmes to contribute to improving the living conditions of the population in the country. The interview should not last more than 40 minutes. The answers you will give will remain strictly confidential and will not be given to others. You can refuse to participate or to answer to some of the questions. But we hope that you will accept to participate, as your answers are very important to take the best decisions possible. Do you have questions for us? Can we start? Ask if several families share the same house without eating together and without sharing their income. If there are distinct families, select one at random for the interview.
I – HOUSEHOLD COMPOSITION Who is making the decisions for the household? 1= Man/ 2 = Woman 1.1 │___│How old is he/she? 1.2 │___│ years How many children and adults live in your family? 1.3 │___│ Children below 5 years 1.4 │___│Primary school-age children 6-11 years old 1.5 Secondary school-age children 12-18 years 1.6 │___│ Adult men 19-60 years 1.7 │___│ Adult women19-60 years 1.8 │___│Adults above 60 years of age 1.9 │___│ Write total number of persons, or 0 if there are none:1.10 Are there persons who have long-duration sickness (e.g. diabetes)? │___│chronic sick 1.11 Are there pregnant/ lactating women? │___│ pregnant/lactating
1.12 Including your own family, how many other families live here? (Families are considered separate if they do not eat together and do not share their income)
│___│
II– FOOD CONSUMPTION How many meals do you eat each day? 2.1 │___│
Consider only meals consumed at home or in public kitchen but not in private restaurants or street food Do NOT count food consumed in very small amount (less than a teaspoon per person)
How many days for the last 7 days did your family consume
these food items?
What was the main source of these food?
1= Own production/garden 2= Purchase in shops, markets, petty traders 3= Purchase at credit, borrowed 4= Received against work (in-kind payment) 5= Bartered against other goods 6= Received as gift from family or neighbours, begged 7= Humanitarian food aid 99= Not eaten during the 7 past days
0 = Not eaten 4= 4 days 1= 1 day 5 = 5 days 2= 2 days 6= 6 days 3= 3 days 7= 7 days
Bread 2.2 │___│ 2.3 │___│ Wheat (grain, flour), rice, maize, pasta, biscuits 2.4 │___│ 2.5 │___│ Potatoes, sweet potatoes 2.6 │___│ 2.7 │___│ Beans, chickpeas, lentils, peas 2.8 │___│ 2.9 │___│ Vegetables 2.10 │___│ 2.11 │___│ Fruits 2.12 │___│ 2.13 │___│ Meat (red, poultry) 2.14 │___│ 2.15 │___│ Eggs 2.16 │___│ 2.17 │___│ Fish 2.18 │___│ 2.19 │___│ Dairy products (yogurt, cheese, milk) 2.20 │___│ 2.21 │___│ Vegetable oil, butter, grease 2.22 │___│ 2.23 │___│ Sugar, honey, jam 2.24 │___│ 2.25 │___│
Ask questions 2.26 – 2.xx to the households with primary-school children (7-11 years old)
Food Security Assessment September 2012
18
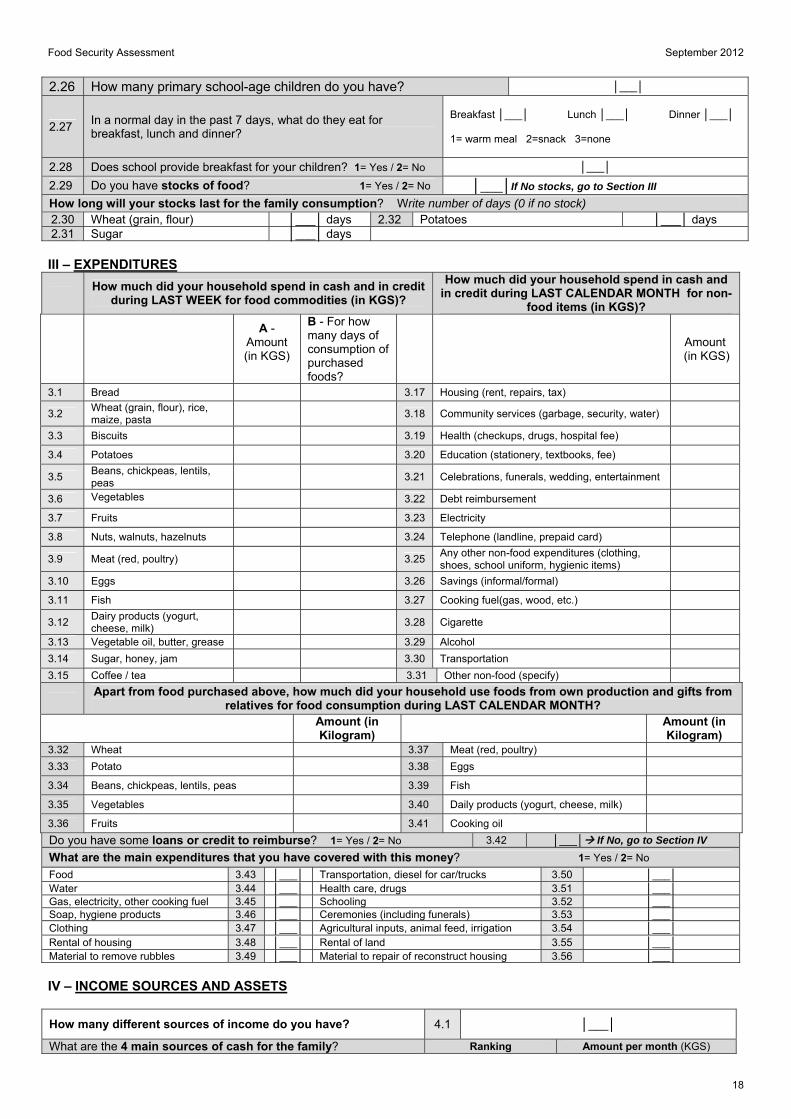
2.26 How many primary school-age children do you have? │___│
2.27 In a normal day in the past 7 days, what do they eat for breakfast, lunch and dinner?
Breakfast │___│ Lunch │___│ Dinner │___│ 1= warm meal 2=snack 3=none
2.28 Does school provide breakfast for your children? 1= Yes / 2= No │___│
2.29 Do you have stocks of food? 1= Yes / 2= No │___│If No stocks, go to Section III How long will your stocks last for the family consumption? Write number of days (0 if no stock) 2.30 Wheat (grain, flour) │___│ days 2.32 Potatoes │___│ days 2.31 Sugar │___│ days III – EXPENDITURES
How much did your household spend in cash and in credit
during LAST WEEK for food commodities (in KGS)?
How much did your household spend in cash and in credit during LAST CALENDAR MONTH for non-
food items (in KGS)?
A - Amount (in KGS)
B - For how many days of consumption of purchased foods?
Amount
(in KGS)
3.1 Bread 3.17 Housing (rent, repairs, tax)
3.2 Wheat (grain, flour), rice, maize, pasta 3.18 Community services (garbage, security, water)
3.3 Biscuits 3.19 Health (checkups, drugs, hospital fee) 3.4 Potatoes 3.20 Education (stationery, textbooks, fee) 3.5
Beans, chickpeas, lentils, peas 3.21 Celebrations, funerals, wedding, entertainment
3.6 Vegetables 3.22 Debt reimbursement 3.7 Fruits 3.23 Electricity 3.8 Nuts, walnuts, hazelnuts 3.24 Telephone (landline, prepaid card) 3.9 Meat (red, poultry) 3.25
Any other non-food expenditures (clothing, shoes, school uniform, hygienic items)
3.10 Eggs 3.26 Savings (informal/formal) 3.11 Fish 3.27 Cooking fuel(gas, wood, etc.) 3.12
Dairy products (yogurt, cheese, milk) 3.28 Cigarette
3.13 Vegetable oil, butter, grease 3.29 Alcohol 3.14 Sugar, honey, jam 3.30 Transportation 3.15 Coffee / tea 3.31 Other non-food (specify)
Apart from food purchased above, how much did your household use foods from own production and gifts from
relatives for food consumption during LAST CALENDAR MONTH?
Amount (in Kilogram)
Amount (in Kilogram)
3.32 Wheat 3.37 Meat (red, poultry) 3.33 Potato 3.38 Eggs 3.34 Beans, chickpeas, lentils, peas 3.39 Fish 3.35 Vegetables 3.40 Daily products (yogurt, cheese, milk) 3.36 Fruits 3.41 Cooking oil Do you have some loans or credit to reimburse? 1= Yes / 2= No 3.42 │___│ If No, go to Section IV
What are the main expenditures that you have covered with this money? 1= Yes / 2= No
Food 3.43 │___│ Transportation, diesel for car/trucks 3.50 │___│Water 3.44 │___│ Health care, drugs 3.51 │___│Gas, electricity, other cooking fuel 3.45 │___│ Schooling 3.52 │___│Soap, hygiene products 3.46 │___│ Ceremonies (including funerals) 3.53 │___│Clothing 3.47 │___│ Agricultural inputs, animal feed, irrigation 3.54 │___│Rental of housing 3.48 │___│ Rental of land 3.55 │___│Material to remove rubbles 3.49 │___│ Material to repair of reconstruct housing 3.56 │___│
IV – INCOME SOURCES AND ASSETS
How many different sources of income do you have? 4.1 │___│
What are the 4 main sources of cash for the family? Ranking Amount per month (KGS)
Food Security Assessment September 2012
19
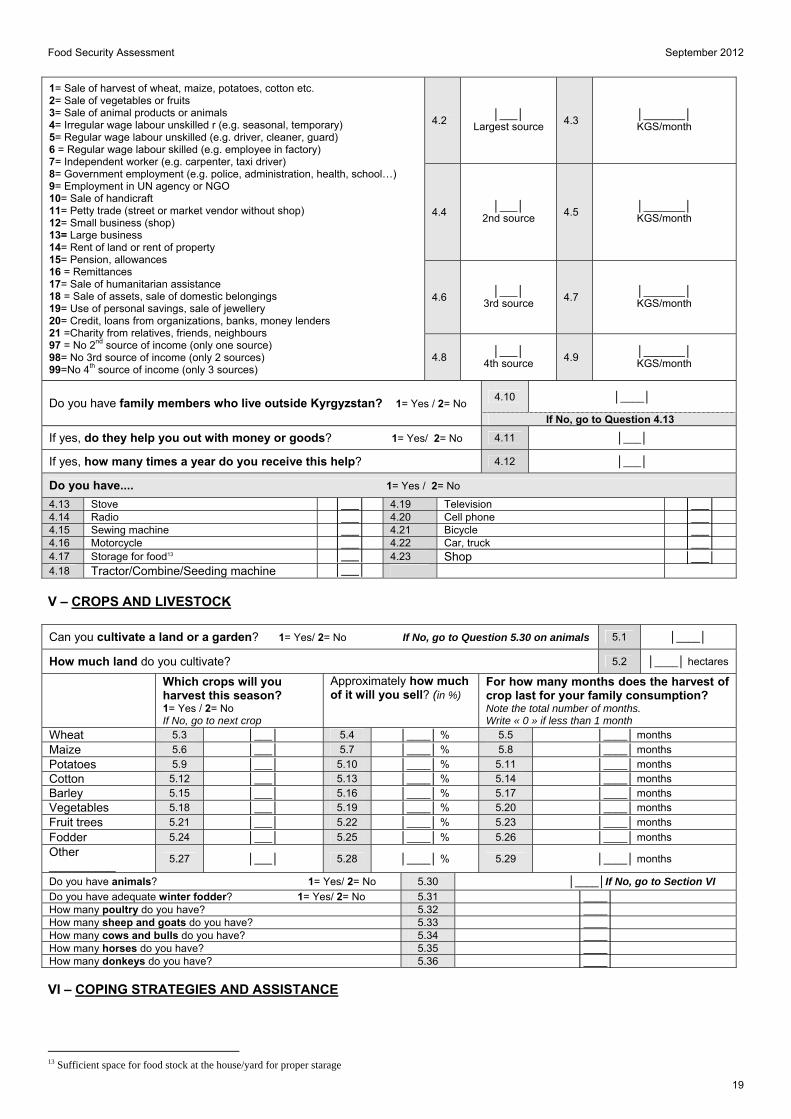
1= Sale of harvest of wheat, maize, potatoes, cotton etc. 2= Sale of vegetables or fruits 3= Sale of animal products or animals 4= Irregular wage labour unskilled r (e.g. seasonal, temporary) 5= Regular wage labour unskilled (e.g. driver, cleaner, guard) 6 = Regular wage labour skilled (e.g. employee in factory) 7= Independent worker (e.g. carpenter, taxi driver) 8= Government employment (e.g. police, administration, health, school…) 9= Employment in UN agency or NGO 10= Sale of handicraft 11= Petty trade (street or market vendor without shop) 12= Small business (shop) 13= Large business 14= Rent of land or rent of property 15= Pension, allowances 16 = Remittances 17= Sale of humanitarian assistance 18 = Sale of assets, sale of domestic belongings 19= Use of personal savings, sale of jewellery 20= Credit, loans from organizations, banks, money lenders 21 =Charity from relatives, friends, neighbours 97 = No 2nd source of income (only one source) 98= No 3rd source of income (only 2 sources) 99=No 4th source of income (only 3 sources)
4.2 │___│
Largest source 4.3
│_______│ KGS/month
4.4 │___│
2nd source 4.5
│_______│ KGS/month
4.6 │___│
3rd source 4.7
│_______│ KGS/month
4.8 │___│
4th source 4.9
│_______│ KGS/month
Do you have family members who live outside Kyrgyzstan? 1= Yes / 2= No 4.10 │____│
If No, go to Question 4.13
If yes, do they help you out with money or goods? 1= Yes/ 2= No 4.11 │___│
If yes, how many times a year do you receive this help? 4.12 │___│
Do you have.... 1= Yes / 2= No
4.13 Stove │___│ 4.19 Television │___│4.14 Radio │___│ 4.20 Cell phone │___│4.15 Sewing machine │___│ 4.21 Bicycle │___│4.16 Motorcycle │___│ 4.22 Car, truck │___│4.17 Storage for food13 │___│ 4.23 Shop │___│4.18 Tractor/Combine/Seeding machine │___│
V – CROPS AND LIVESTOCK
Can you cultivate a land or a garden? 1= Yes/ 2= No If No, go to Question 5.30 on animals 5.1 │____│
How much land do you cultivate? 5.2 │____│ hectares
Which crops will you harvest this season? 1= Yes / 2= No If No, go to next crop
Approximately how much of it will you sell? (in %)
For how many months does the harvest of crop last for your family consumption? Note the total number of months. Write « 0 » if less than 1 month
Wheat 5.3 │___│ 5.4 │____│ % 5.5 │____│ months
Maize 5.6 │___│ 5.7 │____│ % 5.8 │____│ months
Potatoes 5.9 │___│ 5.10 │____│ % 5.11 │____│ months
Cotton 5.12 │___│ 5.13 │____│ % 5.14 │____│ months
Barley 5.15 │___│ 5.16 │____│ % 5.17 │____│ months
Vegetables 5.18 │___│ 5.19 │____│ % 5.20 │____│ months
Fruit trees 5.21 │___│ 5.22 │____│ % 5.23 │____│ months
Fodder 5.24 │___│ 5.25 │____│ % 5.26 │____│ months
Other __________
5.27 │___│ 5.28 │____│ % 5.29 │____│ months
Do you have animals? 1= Yes/ 2= No 5.30 │____│If No, go to Section VI
Do you have adequate winter fodder? 1= Yes/ 2= No 5.31 │____│ How many poultry do you have? 5.32 │____│ How many sheep and goats do you have? 5.33 │____│ How many cows and bulls do you have? 5.34 │____│ How many horses do you have? 5.35 │____│ How many donkeys do you have? 5.36 │____│ VI – COPING STRATEGIES AND ASSISTANCE
13 Sufficient space for food stock at the house/yard for proper starage
Food Security Assessment September 2012
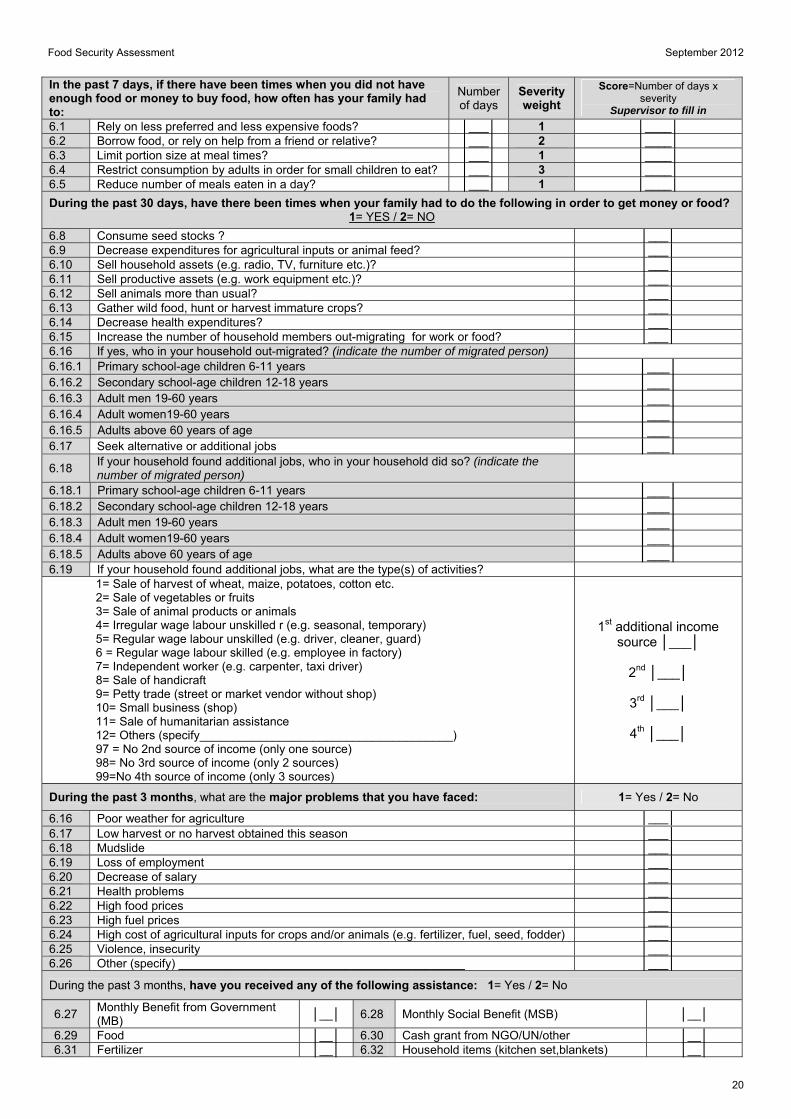
20
In the past 7 days, if there have been times when you did not have enough food or money to buy food, how often has your family had to:
Number of days
Severity weight
Score=Number of days x severity
Supervisor to fill in
6.1 Rely on less preferred and less expensive foods? │___│ 1 │____│6.2 Borrow food, or rely on help from a friend or relative? │___│ 2 │____│6.3 Limit portion size at meal times? │___│ 1 │____│6.4 Restrict consumption by adults in order for small children to eat? │___│ 3 │____│6.5 Reduce number of meals eaten in a day? │___│ 1 │____│
During the past 30 days, have there been times when your family had to do the following in order to get money or food? 1= YES / 2= NO
6.8 Consume seed stocks ? │___│6.9 Decrease expenditures for agricultural inputs or animal feed? │___│6.10 Sell household assets (e.g. radio, TV, furniture etc.)? │___│6.11 Sell productive assets (e.g. work equipment etc.)? │___│6.12 Sell animals more than usual? │___│6.13 Gather wild food, hunt or harvest immature crops? │___│6.14 Decrease health expenditures? │___│6.15 Increase the number of household members out-migrating for work or food? │___│6.16 If yes, who in your household out-migrated? (indicate the number of migrated person) 6.16.1 Primary school-age children 6-11 years │___│ 6.16.2 Secondary school-age children 12-18 years │___│6.16.3 Adult men 19-60 years │___│ 6.16.4 Adult women19-60 years │___│6.16.5 Adults above 60 years of age │___│ 6.17 Seek alternative or additional jobs │___│
6.18 If your household found additional jobs, who in your household did so? (indicate the number of migrated person)
6.18.1 Primary school-age children 6-11 years │___│ 6.18.2 Secondary school-age children 12-18 years │___│6.18.3 Adult men 19-60 years │___│ 6.18.4 Adult women19-60 years │___│6.18.5 Adults above 60 years of age │___│ 6.19 If your household found additional jobs, what are the type(s) of activities?
1= Sale of harvest of wheat, maize, potatoes, cotton etc. 2= Sale of vegetables or fruits 3= Sale of animal products or animals 4= Irregular wage labour unskilled r (e.g. seasonal, temporary) 5= Regular wage labour unskilled (e.g. driver, cleaner, guard) 6 = Regular wage labour skilled (e.g. employee in factory) 7= Independent worker (e.g. carpenter, taxi driver) 8= Sale of handicraft 9= Petty trade (street or market vendor without shop) 10= Small business (shop) 11= Sale of humanitarian assistance 12= Others (specify______________________________________) 97 = No 2nd source of income (only one source) 98= No 3rd source of income (only 2 sources) 99=No 4th source of income (only 3 sources)
1st additional income source │___│
2nd │___│
3rd │___│
4th │___│
During the past 3 months, what are the major problems that you have faced: 1= Yes / 2= No
6.16 Poor weather for agriculture │___│6.17 Low harvest or no harvest obtained this season │___│6.18 Mudslide │___│6.19 Loss of employment │___│6.20 Decrease of salary │___│6.21 Health problems │___│6.22 High food prices │___│6.23 High fuel prices │___│6.24 High cost of agricultural inputs for crops and/or animals (e.g. fertilizer, fuel, seed, fodder) │___│6.25 Violence, insecurity │___│6.26 Other (specify) ___________________________________________ │___│
During the past 3 months, have you received any of the following assistance: 1= Yes / 2= No
6.27 Monthly Benefit from Government (MB)
│__│ 6.28 Monthly Social Benefit (MSB) │__│
6.29 Food │__│ 6.30 Cash grant from NGO/UN/other │__│ 6.31 Fertilizer │__│ 6.32 Household items (kitchen set,blankets) │__│
Food Security Assessment September 2012
21
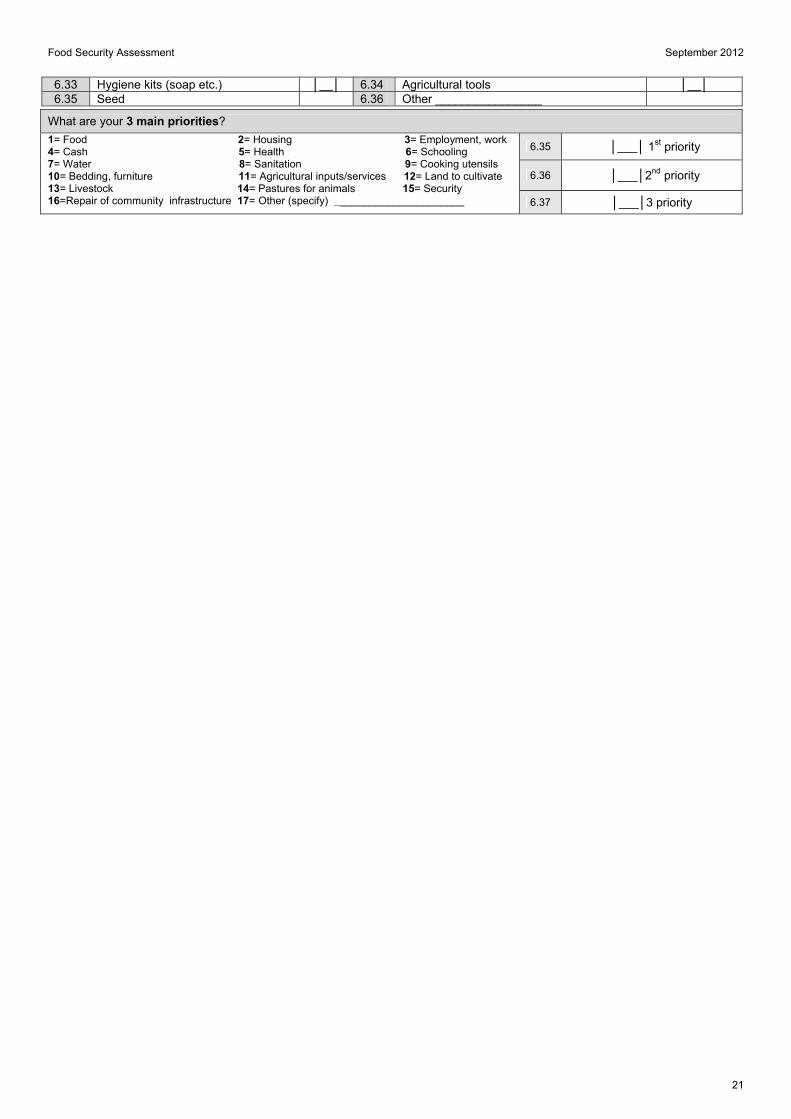
6.33 Hygiene kits (soap etc.) │__│ 6.34 Agricultural tools │__│ 6.35 Seed 6.36 Other ________________
What are your 3 main priorities?
1= Food 2= Housing 3= Employment, work 4= Cash 5= Health 6= Schooling 7= Water 8= Sanitation 9= Cooking utensils 10= Bedding, furniture 11= Agricultural inputs/services 12= Land to cultivate 13= Livestock 14= Pastures for animals 15= Security 16=Repair of community infrastructure 17= Other (specify) ______________________
6.35 │___│ 1st priority
6.36 │___│2nd priority
6.37 │___│3 priority
Food Security Assessment September 2012
22
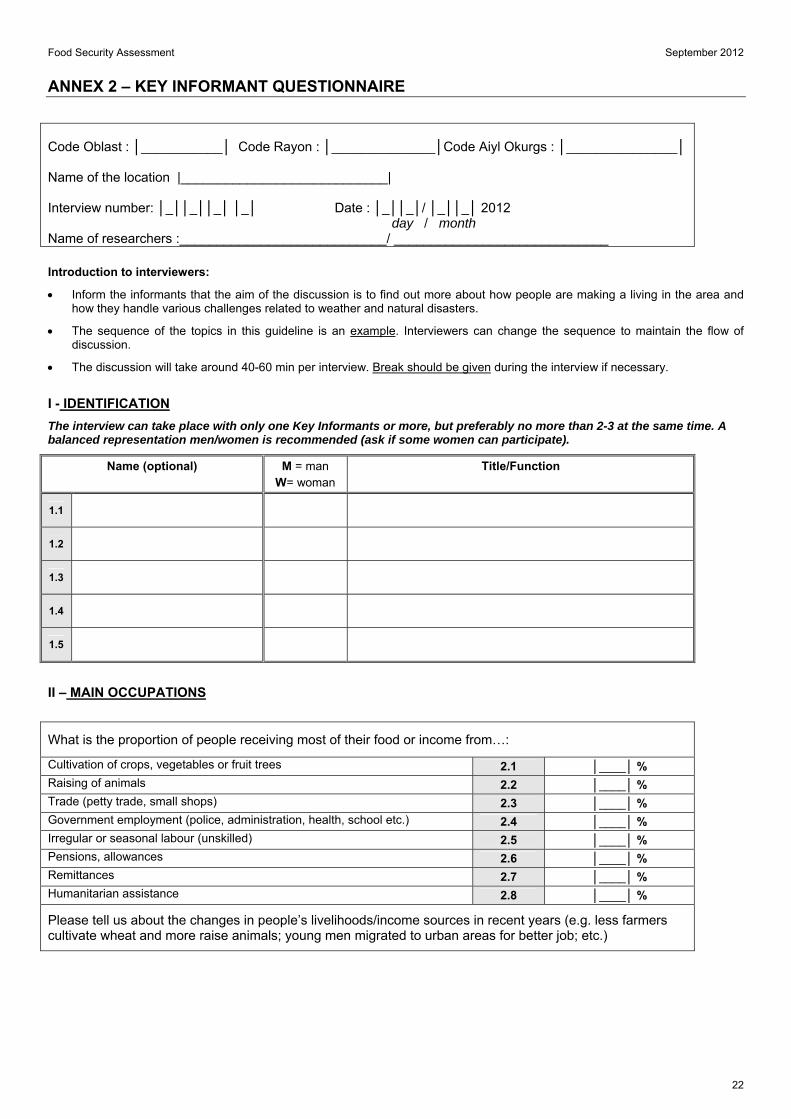
ANNEX 2 – KEY INFORMANT QUESTIONNAIRE
Code Oblast : │___________│ Code Rayon : │______________│Code Aiyl Okurgs : │_______________│ Name of the location |____________________________| Interview number: │_││_││_│ │_│ Date : │_││_│/ │_││_│ 2012 day / month Name of researchers :____________________________/ _____________________________ Introduction to interviewers:
Inform the informants that the aim of the discussion is to find out more about how people are making a living in the area and how they handle various challenges related to weather and natural disasters.
The sequence of the topics in this guideline is an example. Interviewers can change the sequence to maintain the flow of discussion.
The discussion will take around 40-60 min per interview. Break should be given during the interview if necessary.
I - IDENTIFICATION
The interview can take place with only one Key Informants or more, but preferably no more than 2-3 at the same time. A balanced representation men/women is recommended (ask if some women can participate).
Name (optional) M = man W= woman
Title/Function
1.1
1.2
1.3
1.4
1.5
II – MAIN OCCUPATIONS
What is the proportion of people receiving most of their food or income from…:
Cultivation of crops, vegetables or fruit trees 2.1 │____│ % Raising of animals 2.2 │____│ % Trade (petty trade, small shops) 2.3 │____│ % Government employment (police, administration, health, school etc.) 2.4 │____│ % Irregular or seasonal labour (unskilled) 2.5 │____│ % Pensions, allowances 2.6 │____│ % Remittances 2.7 │____│ % Humanitarian assistance 2.8 │____│ %
Please tell us about the changes in people’s livelihoods/income sources in recent years (e.g. less farmers cultivate wheat and more raise animals; young men migrated to urban areas for better job; etc.)
Food Security Assessment September 2012
23
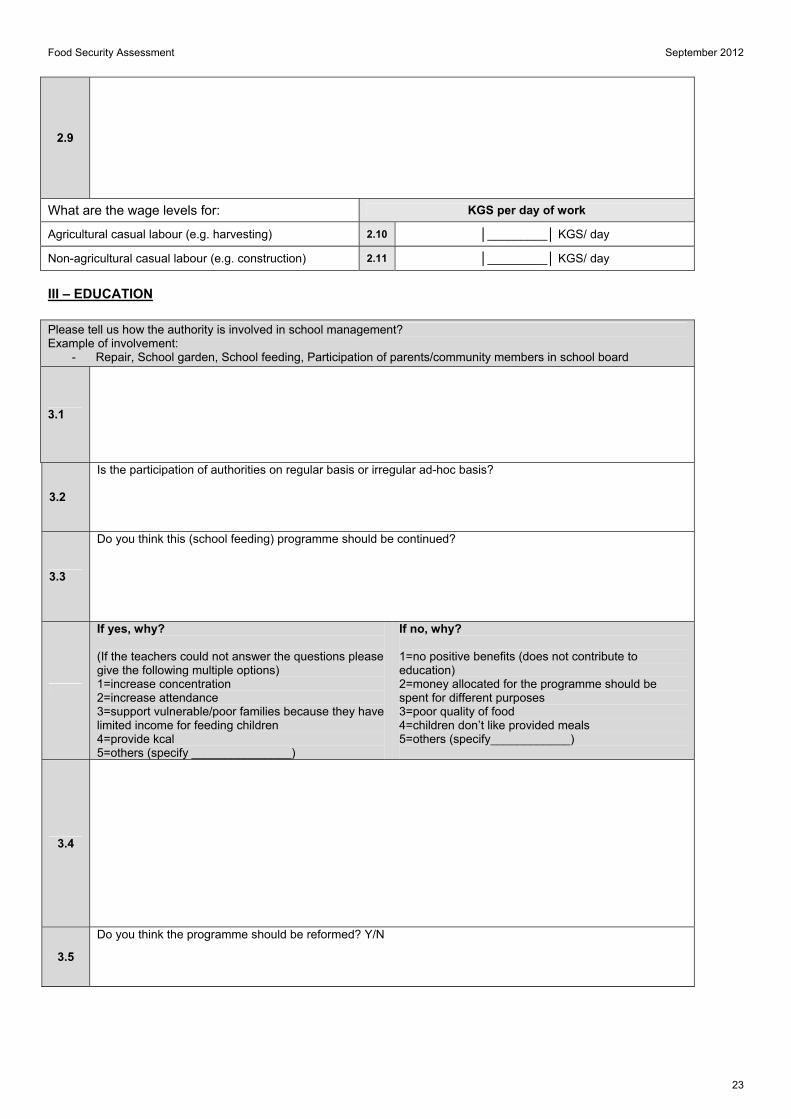
2.9
What are the wage levels for: KGS per day of work
Agricultural casual labour (e.g. harvesting) 2.10 │_________│ KGS/ day
Non-agricultural casual labour (e.g. construction) 2.11 │_________│ KGS/ day III – EDUCATION Please tell us how the authority is involved in school management? Example of involvement:
- Repair, School garden, School feeding, Participation of parents/community members in school board
3.1
3.2
Is the participation of authorities on regular basis or irregular ad-hoc basis?
3.3
Do you think this (school feeding) programme should be continued?
If yes, why? (If the teachers could not answer the questions please give the following multiple options) 1=increase concentration 2=increase attendance 3=support vulnerable/poor families because they have limited income for feeding children 4=provide kcal 5=others (specify _______________)
If no, why? 1=no positive benefits (does not contribute to education) 2=money allocated for the programme should be spent for different purposes 3=poor quality of food 4=children don’t like provided meals 5=others (specify____________)
3.4
3.5
Do you think the programme should be reformed? Y/N
Food Security Assessment September 2012
24
If YES, what aspects of the programme should be reformed? (If the teachers could not answer the questions please give the following multiple options) 1=transparent tendering process 2=decision making by parents and schools on school feeding programme (incl. management of resources) 3=more use of local foods 4=diversity of meals/types of products 5=quality of products 6=cooking and canteen facility 7=water and sanitation 5=others (specify _______________)
3.6
3.7
What could local authorities and communities do for improving school feeding with current means? (For example: help with water supply, repair, co-financing etc.)
IV – LIVELIHOOD CHALENDAR Section IV and V involves core issues of this interview. Please allocate sufficient time to extract meaningful information and record the interview well.
The interviewer shows the livelihood calendar (1 page, attached) and explains that 1) this calendar attempts to illustrate key livelihood activities, events and hazards; 2) this helps people outside of this region to understand when people are facing risks; 3) this is still a draft developed by researchers in Bishkek and foreign consultant; therefore we need your views on this.
4.1 Please review the calendar carefully and revise it if needed and add any missing information (Note: Note: allocate sufficient time for the informant to review the calendar).)
(write on the livelihood calendar)
Is there any areas in the Oblast where the pattern is very different from this? How are they different? (describe in below box)
4.2
V – NATURAL DISASTERS
Food Security Assessment September 2012
25
Do you have any record of disasters in the past several years? If you have is it possible for us to have a photocopy/scan?
5.1
If the record is not available, what are the key disasters in the past several years? Please tell us year, season, areas, impact and how the affected tried to cope with these disasters.
5.2

Food Security Assessment September 2012
26