Embed Size (px)
Citation preview

WFP CORPORATE RESULTS
FRAMEWORK (2017–2021)
Informal Consultation
25 July 2016
World Food Programme
Rome, Italy
2
Introduction
1. WFP is committed to attaining the highest standards of accountability. This means optimizing its
performance management system to realize the most effective and efficient use of resources and
support project level and corporate reporting. WFP’s current performance management system
is based on two results frameworks: the Management Results Framework and the Strategic
Results Framework. They operationalize the WFP Strategic Plan and capture WFP’s results and
performance throughout the project cycle of planning, implementation, monitoring and reporting.
2. A challenge with the present system has been the disconnect between the two frameworks,
particularly how the allocation of resources contributes to the efficient and effective attainment
of the Strategic Objectives. Integrating the two will improve the relationship and clarity of how
results are achieved and at what cost.
3. The alignment of the new Strategic Plan with the Sustainable Development Goals (SDGs) and
the revision of WFP’s financial framework present an opportunity to integrate strategic results
and management results into a single Corporate Results Framework (CRF).
4. The key conceptual change is that the strategic results of WFP – linked to SDG 2 and 17 – become
the principal focus of WFP’s performance. Under the present system, management results are
presented at the same level of the results hierarchy as strategic results. Recognizing the primacy
of the global agenda and accountability to the people we serve, the new CRF puts the emphasis
on the results that drive WFP. Commitment to management excellence remains but is recognized
as a means to achieve the strategic results. Organizational performance is conceptualized in terms
of measures that capture the effectiveness, efficiency and economy of achieving the strategic
results. At the corporate level this will be represented in a much simpler format. At the country
level it will be represented through an enhanced country-level reporting structure that will more
clearly align financing with results.
5. The consolidated CRF streamlines and simplifies WFP’s corporate reporting structure. Building
around the new financial framework and results chain, the revised structure will simplify
performance management at the country office level. It will support effective, efficient and
economic management of operations while enhancing accountability and transparency.
6. This is the fourth draft of the CRF and is the result of considerable deliberation and consultation.
It will, however, continue to evolve and be refined as the consultative process proceeds, both
internally among management and with the Board.
Development of the Corporate Results Framework
7. The CRF builds on WFP’s results chain, starting with the Strategic Plan, and the new financial
framework. Technical elements are being developed through four work steams:
i) Theories of change. Theories of change have been developed for key programme areas.
The theories of change provided a foundation for formulating CRF outcome categories,
output categories and indicators.
ii) Preparation of outcome, output and activity categories. A draft set of strategic outcome,
output and activity categories has been formulated for each programme area included in the
CRF. These will form the basis for the formulation of strategic outcome, output and activity
statements by country offices.
iii) Development of programme indicators. The CRF will include indicators for each
Strategic Result: cross-cutting, strategic outcome and output. The current set of SRF
indicators has been reviewed along with indicators used by other United Nations agencies
to ensure alignment with other agencies and the globally agreed indicators used to measure
and report national-government progress against the SDGs.
iv) Indicators for organizational performance. The CRF will include a number of standard
corporate indicators that demonstrate organizational performance. They will follow WFP’s
concept of value for money and reflect effectiveness, efficiency and economy. Indicators
1

3
are being determined after review of existing WFP indicators (including under the
Evaluability Assessment of the Strategic Plan) and those used by other United Nations
agencies and selected governments. WFP will maintain an indicator compendium to support
structured functional management and oversight of organizational performance.
Structure
8. The CRF is built around two Strategic Goals based on SDG 2 and SDG 17, supported by
five Strategic Objectives and eight Strategic Results, as set out in the WFP Strategic Plan
(2017–2021). The five Strategic Objectives frame WFP’s programmatic and operational focus,
and link to country and global efforts under relevant SDG 2 and SDG 17 targets. Below the
eight Strategic Results are WFP’s strategic outcomes, outputs and activities. The strategic
outcome, output and activity statements will be formulated at country level in alignment with
standardized strategic outcome, output and activity categories included in the CRF. Figure 1
illustrates how the standardized strategic outcome, output and activity categories included in the
CRF will be used to inform the formulation of free-text strategic outcome, output and activity
statements at country level.
9. Ensuring the free-text strategic outcome, output and activity statements are aligned with the
standardized categories included in the CRF is important for monitoring, reporting and
performance management purposes as it allows WFP to link CRF indicators to the categories and
aggregate achievement values in relation to the standardized categories. Moreover, through
alignment of the strategic outcome, output and activity categories and the new Country Portfolio
Budget structure, WFP will be able to simultaneously view and analyse performance information
and expenditure data across the various categories.
Figure 1: Corporate Results Framework and the results chain
10. The CRF strategic outcome, output and activity categories linked to SDG 2/WFP Strategic
Goal 1 are listed in pages 3 to 8. Those linked to SDG 17/ WFP Strategic Goal 2 are
listed in pages 9 to 10. Page 11 lists the cross-cutting results and related indicators that
cut across all SDG 2 categories, while pages 12 and 13 list the output indicators linked
to the output categories. In total there are 16 unique outcome categories 13 output
categories, 12 activity categories, 3 cross-cutting results, 4 cross-cutting indicators,
25 outcome indicators and 36 output indicators included in the draft CRF.
Output indicators
Agreed OSZ-RMP summary model
Country office activity
Activitycategory
- aligned to -
Formulated at country level
Standardizedcategories
Country office output
Outputcategory
- aligned to -
Strategic outcome
Strategicoutcomecategory
- aligned to -
Strategic result
Outcomeindicators
- measured by - - measured by -
Standardizedindicators

4
WFP Corporate Results Framework (2017–2021)
Strategic Goal 1: Support countries to achieve zero hunger
Strategic Objective 1: End hunger by protecting access to food
Strategic Result 1: Everyone has access to food (SDG target 2.1)
Relevant SDG indicators
- Prevalence of undernourishment
- Food Insecurity Experience Scale (FIES)
Strategic outcome categories Outcome indicators Output categories
1.1 Stabilized/improved food
consumption
1.1.1 Food Consumption Score1
1.1.2 Coping Strategy Index2
A1. Unconditional resources
transferred
A.2 Conditional resources transferred
B. Nutrition products provided
1.2 Improved access to social
safety nets
1.2.1 Gross enrolment rate of boys and girls
1.2.2 Retention rate of boys and girls
1.2.3 Gender ratio (girl–boy ratio in primary
school)
1.2.4 Attendance rate3
A1. Unconditional resources
transferred
A2. Conditional resources transferred
B. Nutrition products provided
C. Advocacy and education delivered
1.3 Improved/maintained access
to livelihood assets
1.3.1 Food Consumption Score
1.3.2 Coping Strategy Index4
1.3.3 Proportion of households and individuals
reporting benefits from an enhanced
livelihood asset base
A1. Unconditional resources
transferred
A2 Conditional resource transferred
B. Nutrition products provided
D. Assets created
1.4 Improved dietary intake
through nutrition-sensitive
programming
1.4.1 Minimum Dietary Diversity - Women
1.4.2 Food Consumption Score - Nutrition
A1. Unconditional resources
transferred
A2. Conditional resources transferred
B. Nutrition products provided
C. Training and technical support
provided
E. Advocacy and education delivered
1.5 Strengthened national/local
capacity, including for
emergency preparedness and
response
1.5.1 Zero Hunger Capacity Scorecard5
1.5.2 Emergency Preparedness Capacity Index
C. Training and technical support
provided
Activity categories
Unconditional/conditional resource transfers to support access to food
Asset creation and livelihood support
School meals
Individual capacity strengthening
Institutional capacity strengthening
Emergency preparedness
1 Can be Food Consumption Score (FCS) and/or FCS – Nutrition along with Food Expenditure Share
2 Coping Strategy Index (Food)
3 Including % of pupils with 80% attendance rate
4 Coping Strategy Index (Food CSI and/or Livelihood CSI)
5 Progress towards positive change in capacity will be measured annually as the proportion of capacity-strengthening process
milestones achieved

5
Strategic Goal 1: Support countries to achieve zero hunger
Strategic Objective 2: Improve nutrition
Strategic Result 2: No one suffers from malnutrition (SDG target 2.2)
Relevant SDG indicators
- Prevalence of stunting among children under 5 years of age
- Prevalence of malnutrition among children under 5, disaggregated by type (wasting and overweight)
Strategic outcome categories Outcome indicators Output categories
2.1 Improved consumption of
high-quality, nutrient-dense
foods6
2.1.1 Proportion of eligible population that
participates in programme (coverage)
2.1.2 Proportion of target population that
participates in an adequate number of
distributions (adherence)
2.1.3 Proportion of target groups that consume a
minimum acceptable diet
2.1.4 Moderate acute malnutrition (MAM)
treatment performance: recovery, mortality,
default and non-response rate7
2.1.5 Minimum Dietary Diversity - Women
A1. Unconditional resources
transferred
A2. Conditional
resources transferred
B. Nutrition products provided
C. Training and technical support
provided
E. Advocacy and education delivered
2.2 Improved dietary intake
through nutrition-sensitive
programming
2.2.1 Minimum Dietary Diversity - Women
2.2.2 Food Consumption Score - Nutrition
A1. Unconditional resources
transferred
A2. Conditional resources transferred
B. Nutrition products provided
C. Training and technical support
provided
E. Advocacy and education delivered
2.3 Strengthened
national/local capacity for
nutrition solutions
2.3.1 Zero Hunger Capacity Scorecard C. Training and technical support
provided
Activity categories
Unconditional/conditional resource transfers to support access to food
School meals
Individual capacity strengthening
Institutional capacity strengthening
Nutrition treatment
Malnutrition prevention
6 Indicators for MAM treatment programmes: MAM (recovery, mortality, default and non-response rate) and Proportion of
eligible population that participates in programme (coverage); for MAM prevention programmes: Proportion of eligible
population that participates in programme (coverage) and Proportion of target population that participates in an adequate
number of distributions (adherence); for micronutrient programmes: Proportion of eligible population that participates in
programme (coverage) and Proportion of target population that participates in an adequate number of distributions (adherence);
for stunting prevention programmes: Proportion of eligible population that participates in programme (coverage), Proportion
of target population that participates in an adequate number of distributions (adherence), Proportion of target groups that
consumes a minimum acceptable diet, and Minimum Dietary Diversity - Women.
7 This indicator includes default rate of clients from anti-retroviral therapy (ART), tuberculosis-directly observed treatment,
short course (TB-DOTS) treatment and prevention of mother-to-child transmission (PMTCT) of HIV programmes and
ART/TB nutrition programmes.
5

6
Strategic Goal 1: Support countries to achieve zero hunger
Strategic Objective 3: Achieve food security
Strategic Result 3: Smallholders have improved food security and nutrition
(SDG target 2.3)
Relevant SDG indicators
- Volume of production per labour unit by class of farming/pastoral/forestry enterprise size
- Average income of small-scale food producers by sex and indigenous status
Strategic outcome
categories
Outcome indicators Output categories
3.1 Increased smallholder
production and sales
3.1.1 Percentage of WFP food procured from pro-
smallholder farmer aggregation systems,
disaggregated by sex and type of programmes
3.1.2 Percentage of targeted smallholder farmers
reporting increase in marketable surplus,
disaggregated by sex
3.1.3 Percentage of targeted smallholder farmers selling
through pro-smallholder farmer aggregation
systems, disaggregated by sex
3.1.4 Percentage of default rate of WFP pro-smallholder
farmer procurement contracts, disaggregated by
reason and aggregation system
3.1.5 Percentage of targeted smallholder farmers
reporting increased production of nutritious crops
A2. Conditional resources
transferred
B. Nutrition products provided
C. Training and technical support
provided
F. Purchases from smallholders
completed
3.2 Improved/maintained
access to livelihood assets
3.2.1 Food Consumption Scorecard
3.2.2 Coping Strategy Index8
3.2.3 Proportion of household and individuals reporting
an increased benefits from an enhanced livelihoods
asset base
3.2.4 Proportion of the population in targeted
communities reporting benefits from an enhanced
livelihood asset base
A. Conditional resources
transferred
B. Nutrition products provided
D. Assets created
3.3 Improved dietary intake
through nutrition-sensitive
programming
3.3.1 Minimum Dietary Diversity - Women
3.3.2 Food Consumption Score - Nutrition
A1. Unconditional resources
transferred
A2. Conditional resources
transferred
B. Nutrition products provided
C. Training and technical support
provided
E. Advocacy and education
delivered
3.4 Strengthened
national/local capacity
3.4.1Zero Hunger Capacity Scorecard C. Training and technical support
provided
Activity categories
Unconditional/conditional resource transfers to support access to food
Individual capacity strengthening
Institutional capacity strengthening
Smallholder agricultural market support
Asset creation and livelihood support
8 Food and Livelihood Coping Strategy Index

7
Strategic Goal 1: Support countries to achieve zero hunger
Strategic Objective 3: Achieve food security
Strategic Result 4: Food systems are sustainable (SDG target 2.4)
Relevant SDG indicators
- Proportion of agricultural area under productive and sustainable agriculture
Strategic outcome categories Outcome indicators Output categories
4.1 Improved adaptation to
climate shocks/change
4.1.1 Coping Strategy Index9 F. Access to services that
increase risk thresholds
facilitated
4.2 Improved/ maintained
access to livelihood assets
4.2.1 Food Consumption Score
4.2.2 Coping Strategy Index10
4.2.3 Proportion of households and individuals reporting
benefits from an enhanced livelihoods asset base
4.2.4 Post-harvest losses
A. Conditional resources
transferred
B. Nutrition products
provided
D. Assets created
4.3 Improved dietary intake
through nutrition-sensitive
programming
4.3.1 Minimum Dietary Diversity - Women
4.3.2 Food Consumption Score - Nutrition
A1. Unconditional
resources transferred
A2. Conditional resources
transferred
B. Nutrition products
provided
C. Training and technical
support provided
E. Advocacy and
education delivered
4.4 Strengthened national/
local capacity, including for
disaster risk reduction
4.4.1 Zero Hunger Capacity Scorecard
4.4.2 Emergency Preparedness Capacity Index
C. Training and technical
support provided
Activity categories
Unconditional/conditional resource transfers to support access to food
Climate adaptation and risk management
Individual capacity strengthening
Institutional capacity strengthening
Asset creation and livelihood support
9 Livelihood Coping Strategy Index
10 Food and Livelihood Coping Strategy Index
7
8
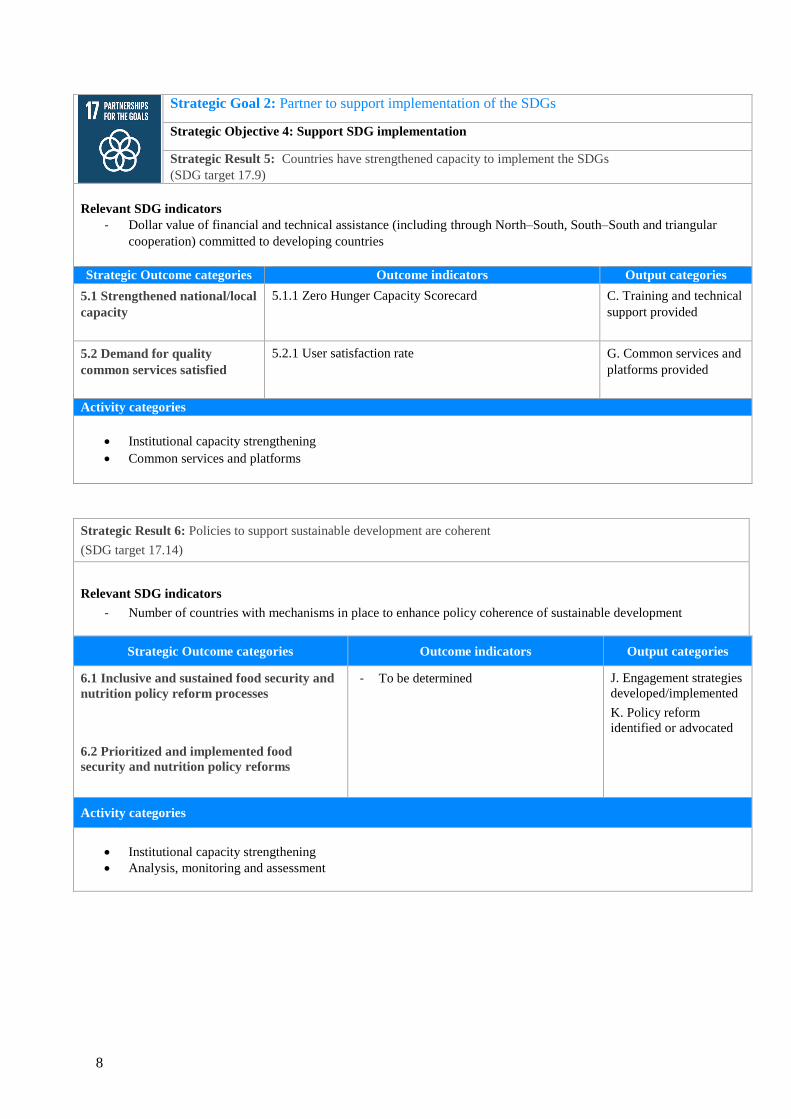
Strategic Goal 2: Partner to support implementation of the SDGs
Strategic Objective 4: Support SDG implementation
Strategic Result 5: Countries have strengthened capacity to implement the SDGs
(SDG target 17.9)
Relevant SDG indicators
- Dollar value of financial and technical assistance (including through North–South, South–South and triangular
cooperation) committed to developing countries
Strategic Outcome categories Outcome indicators Output categories
5.1 Strengthened national/local
capacity
5.1.1 Zero Hunger Capacity Scorecard C. Training and technical
support provided
5.2 Demand for quality
common services satisfied
5.2.1 User satisfaction rate G. Common services and
platforms provided
Activity categories
Institutional capacity strengthening
Common services and platforms
Strategic Result 6: Policies to support sustainable development are coherent
(SDG target 17.14)
Relevant SDG indicators
- Number of countries with mechanisms in place to enhance policy coherence of sustainable development
Strategic Outcome categories Outcome indicators Output categories
6.1 Inclusive and sustained food security and
nutrition policy reform processes
6.2 Prioritized and implemented food
security and nutrition policy reforms
- To be determined J. Engagement strategies
developed/implemented
K. Policy reform
identified or advocated
Activity categories
Institutional capacity strengthening
Analysis, monitoring and assessment

9
Strategic Goal 2: Partner to support implementation of the SDGs
Strategic Objective 5: Partner for SDG results
Strategic Result 7: Developing countries access a range of financial resources for development
investment (SDG Target 17.3)
Relevant SDG indicators
- Foreign direct investments, official development assistance and South–South cooperation as a proportion of total
domestic budget
- Volume of remittances (in US dollars) as a proportion of total GDP
Strategic outcome categories Outcome indicators Output categories
7.1 Inclusive financial services
7.2 Private-sector financing of food
security and nutrition
- TBD
- TBD
H. Domestic/external resources
mobilized
Activity categories
To be determined
Strategic result 8: Sharing of knowledge, expertise and technology strengthen global partnership support to country
efforts to achieve the SDGs (SDG Target 17.16)
Relevant SDG indicators
- Number of countries reporting progress in multi-stakeholder development effectiveness monitoring frameworks
that support the achievement of the SDGs
Strategic outcome categories Outcome indicators Output categories
8.1 Humanitarian cluster coordination
8.1.1User satisfaction rate G. Common services and
platforms provided
L. Partnerships supported
Activity categories
Common services and platforms

10
Strategic Goal 1: Support countries to achieve zero hunger
Cross-cutting results
Result Indicators
Affected populations are able to hold WFP and partners
accountable for meeting their hunger needs in a manner
that reflects their views and preferences
Proportion of assisted people informed about the
programme (who is included, what people will receive,
length of assistance)
Affected populations are able to benefit from WFP
programmes in a manner that ensures and promotes their
safety, dignity and integrity
Proportion of targeted people accessing assistance
without protection challenges
Improved gender equality and women’s empowerment
among WFP-assisted population
Proportion of households where women, men, or both
women and men make decisions on the use of
food/cash/vouchers
Proportion of women and men in food assistance
decision-making entities (committees, boards, teams,
etc.)

11
Strategic Goal 1: Support countries to achieve zero hunger
Strategic Goal 2: Partner to support implementation of the SDGs
Output categories and indicators
Output categories Indicators11
A1. Unconditional resources transferred
A2. Conditional resources transferred
- Number of women, men, boys and girls receiving food/cash-based
transfers/commodity vouchers
- Quantity of food provided
- Total amount of cash transferred to targeted beneficiaries
- Total value of vouchers (expressed in food/cash) redeemed by targeted
beneficiaries
- Quantity of non-food items distributed
- Number of institutional sites assisted
- Number of retailers participating in cash-based transfer programmes
- Number of rations provided
B. Nutrition products provided - Quantity of fortified food provided
- Quantity of specialized nutritional foods provided
C. Training and technical support provided - Number of people trained
- Number of training activities provided
- Number of technical support activities provided
D. Assets created - Number of assets built, restored or maintained by targeted households
and communities, by type and unit of measure
E. Advocacy and education provided - Number of targeted caregivers (male and female) receiving three key
messages delivered through WFP-supported messaging and
counselling
- Number of people exposed to WFP-supported nutrition messaging
- Number of people receiving WFP-supported nutrition counselling
F. Purchases from smallholders completed - Number of smallholder farmers supported/trained
- Quantity of fortified foods, complementary foods and special nutrition
products purchased from local suppliers
G. Access to services that increase risk thresholds
facilitated - To be determined
H. Domestic/external resources mobilized - Number of people obtaining an insurance policy through insurance-
for-assets mechanisms or by paying in cash
- Total premiums paid, by access modality (insurance for assets or cash)
- Total sum insured, by access modality (insurance for assets or cash)
11 Indicators will be disaggregated, where relevant, by criteria such as activity, sex, age, beneficiary category, commodity type,
focus of training, etc., and reported as % of planned.

12
Strategic Goal 1: Support countries to achieve zero hunger
Strategic Goal 2: Partner to support implementation of the SDGs
Output categories and indicators
Output categories Indicators11
I. Common services and platforms provided - Number of shared/common services provided, by type
- Number of WFP-led clusters operational, by type
- Number of engineering works completed, by type
- Total volume of cargo transported
- % of cargo capacity offered against total capacity requested
- % of payload delivered against available capacity
- Total number of passengers transported
- Number of emergency telecoms and information and communications
technology (ICT) systems established, by type
- Number of camps and sites installed/maintained
- Number of humanitarian workers provided health services, by agency
and type
- Number of agencies using common cash-based transfer platforms
J. Policy engagement strategies
developed/implemented - Number of policy engagement strategies developed/implemented
K. Policy reform identified/advocated - Number of policy reforms identified/advocated
L. Partnerships supported - Number of partners supported
C-14600E-WFP Corporate Results Framework