Embed Size (px)
Citation preview
7/31/2019 WF Special Issue-2010
http://slidepdf.com/reader/full/wf-special-issue-2010 1/28
WATER
FIGURES
www.iwmi.org
SPECIAL ISSUE
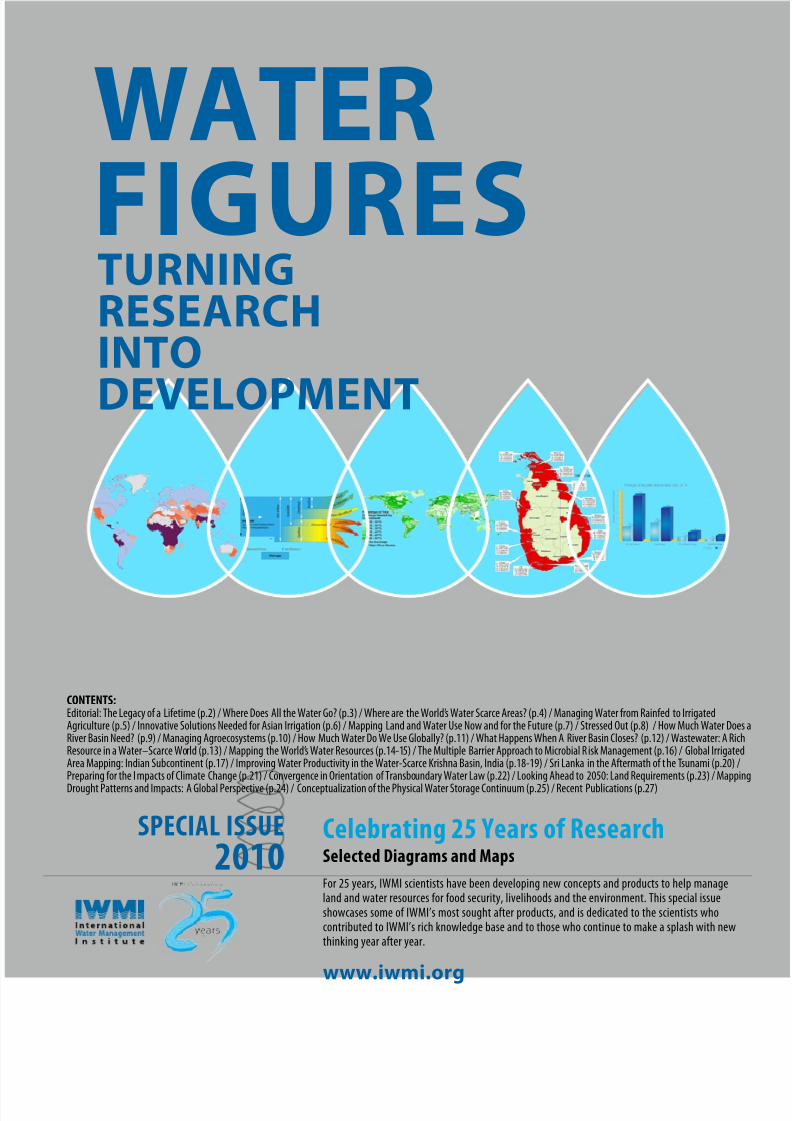
2010Celebrating 25 Years o ResearchSelected Diagrams and Maps
For 25 years, IWMI scientists have been developing new concepts and products to help manageland and water resources or ood security, livelihoods and the environment. This special issueshowcases some o IWMI’s most sought ater products, and is dedicated to the scientists whocontributed to IWMI’s rich knowledge base and to those who continue to make a splash with newthinking year ater year.
TURNINGRESEARCHINTO
DEVELOPMENT
CONTENTS:Editorial: The Legacy o a Lietime (p.2) / Where Does All the Water Go? (p.3) / Where are the World’s Water Scarce Areas? (p.4) / Managing Water rom Rained to IrrigatedAgriculture (p.5) / Innovative Solutions Needed or Asian Irrigation (p.6) / Mapping Land and Water Use Now and or the Future (p.7) / Stressed Out (p.8) / How Much Water Does aRiver Basin Need? (p.9) / Managing Agroecosystems (p.10) / How Much Water Do We Use Globally? (p.11) / What Happens When A River Basin Closes? (p.12) / Wastewater: A RichResource in a Water–Scarce World (p.13) / Mapping the World’s Water Resources (p.14-15) / The Multiple Barrier Approach to Microbial R isk Management (p.16) / Global IrrigatedArea Mapping: Indian Subcontinent (p.17) / Improving Water Productivity in the Water-Scarce Krishna Basin, India (p.18-19) / Sri Lanka in the Atermath o the Tsunami (p.20) /Preparing or the Impacts o Climate Change (p.21) / Convergence in Orientation o Transboundary Water Law (p.22) / Looking Ahead to 2050: Land Requirements (p.23) / MappingDrought Patterns and Impacts: A Global Perspective (p.24) / Conceptualization o the Physical Water Storage Continuum (p.25) / Recent Publications (p.27)

7/31/2019 WF Special Issue-2010
http://slidepdf.com/reader/full/wf-special-issue-2010 2/28
EDITORIALWATER FIGURES SPECIAL ISSUE, 2010
WATER FIGURES | Special Issue | 2010 | 2
The Legac of a Lifetime
For many people, a 25th anniversary means a multitude o things. It means a better
grasp o lie’s issues. It marks a period gone by and a uture ahead. It is also a time
or connecting with the tangible things that revive the glory moments o their past.
Treasured photos, letters, trophies and the people they’ve known through the
years come to mind. For the International Water Management Institute (IWMI), the
tools, the maps and charts, the tables, the diagrams and models that the Institute
has created are “trophies“ o past achievements. They are also IWMI’s legacy or the
uture.
Maps, tools and tables are more than scientic outputs. They help us digest the
realities o our world almost instantly. We study a map and see at a glance where
water is scarce in the world. We examine a graph and understand how rainall is
aecting ood production. A diagram shows us where all the water in a river basin
goes and who is using it the most. A model helps us “see” into the uture and predict
a drought. Yet, we oten miss the big picture.
Behind every great product is a scientist or team o scientists. Behind the scenes,
they’ve spent weeks and months or even years collecting and putting together all
the data that makes the picture come alive or us. They take hours or days or months
to perect a tool. They go out to the eld, most oten under tough conditions,gathering inormation, searching…analyzing. That’s the lie o a researcher. There is
no record o the obstacles they’ve aced or the sacrices they’ve made. We only see
their nished work.
There’s an even bigger picture. Somewhere out there, a child in Arica, a armer in
Asia or a community in a drought-prone land has beneted because IWMI’s research
has helped guide policymakers, development specialists or donors in making more
inormed decisions or investments or their welare. Because o the research, issues
have been addressed and action has been taken. The impacts are like ripples that go
on gathering momentum. Each o the products have been endowed with a lie o
their own by the scientist who created them. A lie that reaches out and gives to the
world, and continues to reap a harvest.
This issue o Water Figures celebrates this “harvest” o research and tells its story.
Above all, it honors the men and women behind the research: the scientists o IWMI
and its partners. As you go through each page, you will see some o IWMI’s most
popular and most requested “mementos” showcased here. There are many more
products that have been produced. This is just a sampling.
Dawn RodriguezEditor
INTERNATIONAL WATER MANAGEMENT INSTITUTE
EVENTS
Upcoming events/international das
Februar 2: World Wetlands Da
Wetlands and Forests is the theme or WorldWetlands Day 2011
This was especially chosen because 2011 is also theUnited Nations International Year o Forests
March 22: World Water Da
Urban Water Management is the theme or WorldWater Day 2011
PRODUCTION CREDITS
EDITOR Dawn Rodriguez - [email protected]
LAyOUT Manoj Jayasuriya - [email protected]
IWMIHeadquarters - 127 Sunil Mawatha, Pelawatte,Battaramulla, Sri Lanka
MAILING ADDRESS:P.O. Box 2075, Colombo, Sri Lanka.
Telephone: +94-11-2880000Fax: +94-11-2786854
EMAIL: [email protected]
7/31/2019 WF Special Issue-2010
http://slidepdf.com/reader/full/wf-special-issue-2010 3/28
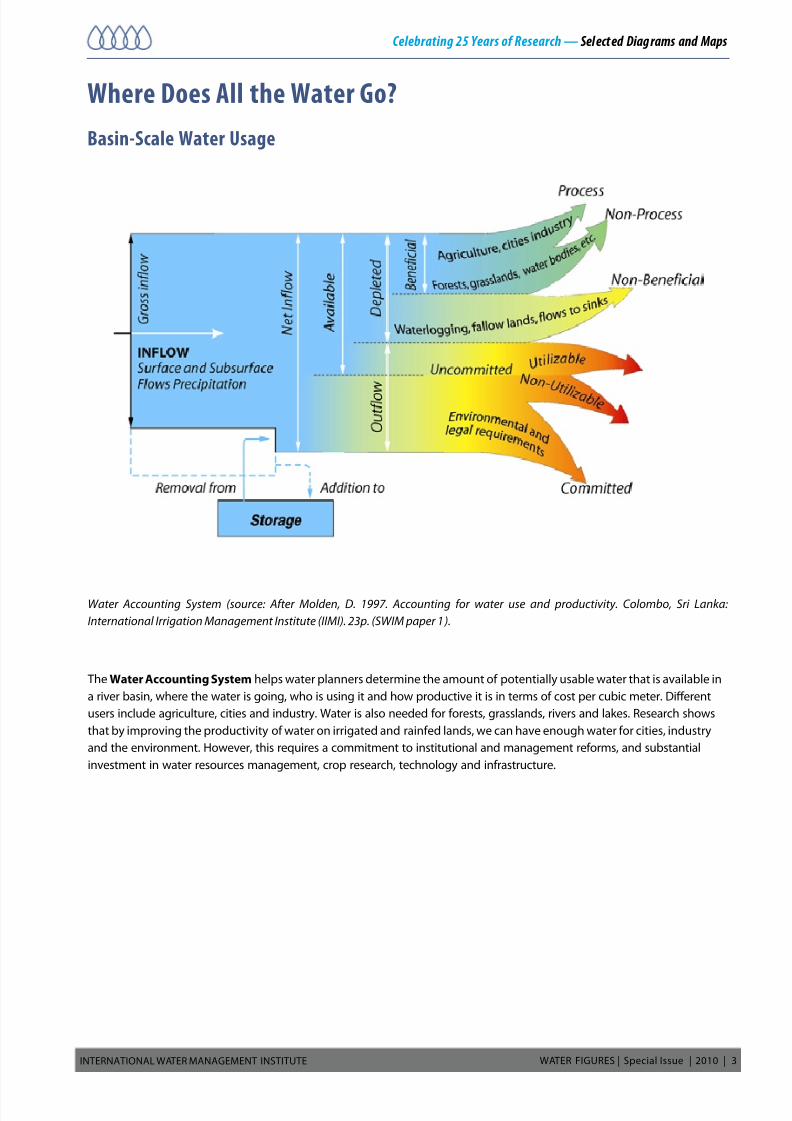
Water Accounting System (source: After Molden, D. 1997. Accounting for water use and productivity. Colombo, Sri Lanka:
International Irrigation Management Institute (IIMI). 23p. (SWIM paper 1).
The Water Accounting Sstem helps water planners determine the amount o potentially usable water that is available in
a river basin, where the water is going, who is using it and how productive it is in terms o cost per cubic meter. Dierent
users include agriculture, cities and industry. Water is also needed or orests, grasslands, rivers and lakes. Research shows
that by improving the productivity o water on irrigated and rained lands, we can have enough water or cities, industry
and the environment. However, this requires a commitment to institutional and management reorms, and substantial
investment in water resources management, crop research, technology and inrastructure.
Where Does All the Water Go? Basin-Scale Water Usage
WATER FIGURES | Special Issue | 2010 | 3INTERNATIONAL WATER MANAGEMENT INSTITUTE
Celebrating 25 Years of Research — Select ed Diag rams and Maps
7/31/2019 WF Special Issue-2010
http://slidepdf.com/reader/full/wf-special-issue-2010 4/28
Where are the World’s Water Scarce Areas?
Global Water Scarcity Map
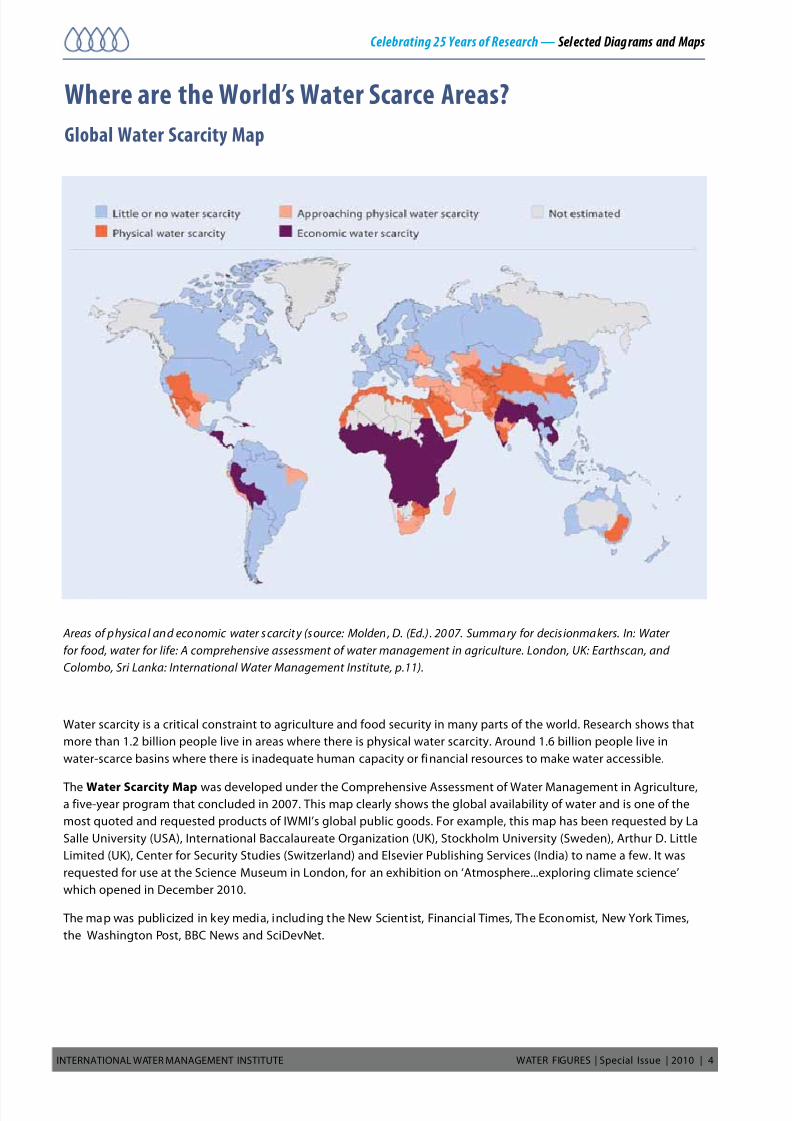
Areas of physical and economic water s carcit y (source: Molden , D. (Ed.). 2007. Summary for decisionmakers. In: Water
for food, water for life: A comprehensive assessment of water management in agriculture. London, UK: Earthscan, and
Colombo, Sri Lanka: International Water Management Institute, p.11).
Water scarcity is a critical constraint to agriculture and ood security in many parts o the world. Research shows that
more than 1.2 billion people live in areas where there is physical water scarcity. Around 1.6 billion people live in
water-scarce basins where there is inadequate human capacity or inancial resources to make water accessible.
The Water Scarcit Map was developed under the Comprehensive Assessment o Water Management in Agriculture,a ive-year program that concluded in 2007. This map clearly shows the global availability o water and is one o the
most quoted and requested products o IWMI’s global public goods. For example, this map has been requested by La
Salle University (USA), International Baccalaureate Organization (UK), Stockholm University (Sweden), Arthur D. Little
Limited (UK), Center or Security Studies (Switzerland) and Elsevier Publishing Services (India) to name a ew. It was
requested or use at the Science Museum in London, or an exhibition on ‘Atmosphere...exploring climate science’
which opened in December 2010.
The map was publicized in key media, including the New Scientist, Financial Times, The Economist, New York Times,
the Washington Post, BBC News and SciDevNet.
WATER FIGURES | Special Issue | 2010 | 4INTERNATIONAL WATER MANAGEMENT INSTITUTE
Celebrating 25 Years of Research — Selec ted Diag rams and Maps
7/31/2019 WF Special Issue-2010
http://slidepdf.com/reader/full/wf-special-issue-2010 5/28
Managing Water from Rainfed to Irrigated Agriculture
Exploring a Spectrum of Options
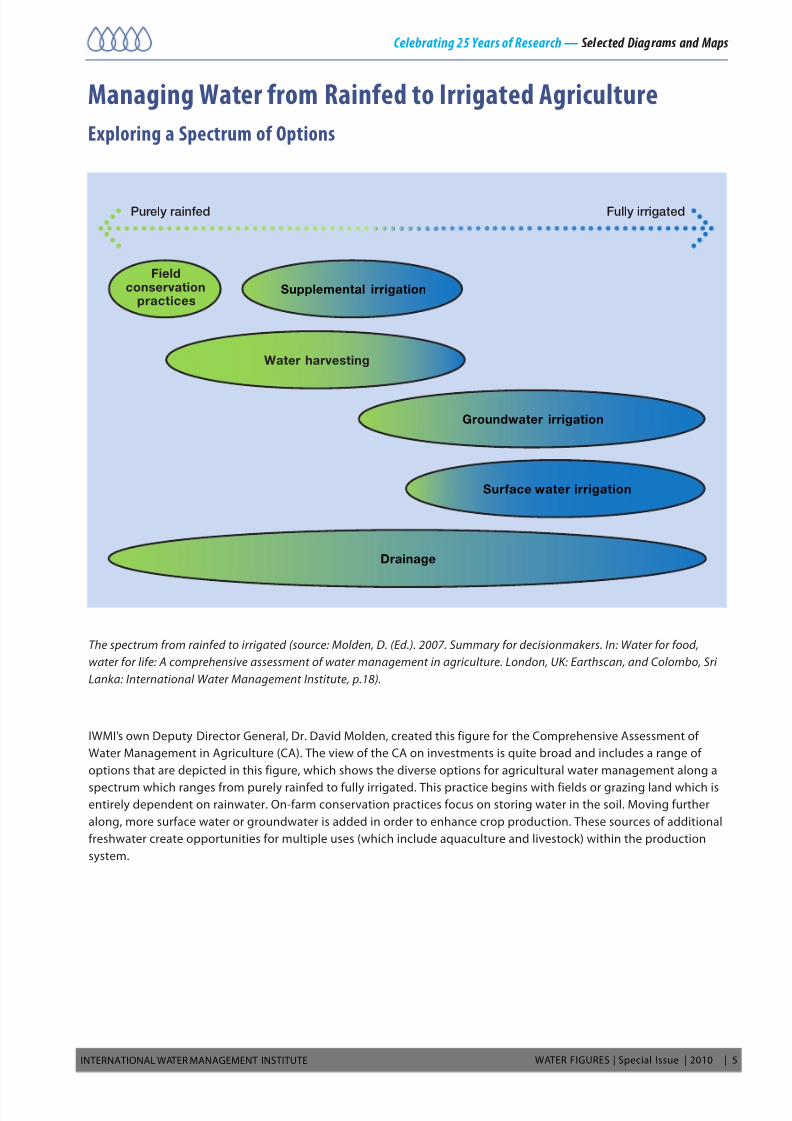
The spectrum from rainfed to irrigated (source: Molden, D. (Ed.). 2007. Summary for decisionmakers. In: Water for food,
water for life: A comprehensive assessment of water management in agriculture. London, UK: Earthscan, and Colombo, Sri
Lanka: International Water Management Institute, p.18).
IWMI’s own Deputy Director General, Dr. David Molden, created this figure for the Comprehensive Assessment of
Water Management in Agriculture (CA). The view of the CA on investments is quite broad and includes a range of
options that are depicted in this figure, which shows the diverse options for agricultural water management along a
spectrum which ranges from purely rainfed to fully irrigated. This practice begins with fields or grazing land which isentirely dependent on rainwater. On-farm conservation practices focus on storing water in the soil. Moving further
along, more surface water or groundwater is added in order to enhance crop production. These sources of additional
freshwater create opportunities for multiple uses (which include aquaculture and livestock) within the production
system.
WATER FIGURES | Special Issue | 2010 | 5INTERNATIONAL WATER MANAGEMENT INSTITUTE
Fieldconservation
practicesSupplemental irrigation
Groundwater irrigation
Water harvesting
Surface water irrigation
Drainage
Purely rainfed Fully irrigated
Celebrating 25 Years of Research — Selec ted Diagrams and Maps

7/31/2019 WF Special Issue-2010
http://slidepdf.com/reader/full/wf-special-issue-2010 6/28
WATER FIGURES | Special Issue | 2010 | 6INTERNATIONAL WATER MANAGEMENT INSTITUTE
Innovative Solutions Needed or Asian Irrigation
Changes in Irrigated Area in Asia, 1961-2003 (source: Mukherji, A.; Facon, T.; Burke, J.; de Fraiture, C.; Faurès, J.-M.; Füleki, B.;
Giordano, M.; Molden, D.; Shah, T. 2009. Revitalizing Asia’s irrigation: To sustainably meet tomorrow’s food needs. Colombo,
Sri Lanka: International Water Management Institute (IWMI); Rome, Italy: Food and Agriculture Organization of the United
Nations (FAO). p.10).
Asia accounts or 70% o the world’s irrigated area. Between 1961 and 2003 the extent o irrigated land has more
than doubled, with South Asia accounting or the bulk o irrigated land. Following the Green Revolution, most Asian
economies became sel-suicient in ood. Large-scale irrigation projects increased productivity and helped rural
communities escape poverty. However, these positive gains came at a cost to the environment, resulting in loss
o ertility, soil and water pollution, salinization and waterlogging, and declining groundwater tables. Upstream
irrigation also had negative impacts on downstream users. Future irrigation development needs to adopt innovative
methods and technologies to reverse the degradation that has occurred in the past, and soil and water productivity
must be improved to meet the uture ood demand o the region’s growing population.
Celebrating 25 Years of Research — Sele cted Di agra ms a nd Maps

7/31/2019 WF Special Issue-2010
http://slidepdf.com/reader/full/wf-special-issue-2010 7/28
WATER FIGURES | Special Issue | 2010 | 7INTERNATIONAL WATER MANAGEMENT INSTITUTE
Mapping Land and Water Use Now and or the Future
Land and water use today and in the future under different scenarios (source: Molden, D. (Ed.). 2007. Summary for
decisionmakers. In: Water for food, water for life: A comprehensive assessment of water management in agriculture.
London, UK: Earthscan, and Colombo, Sri Lanka: International Water Management Institute, p.15).
This igure shows projected amounts o land and water requirements under dierent scenarios, and was created by
Dr. Charlotte de Fraiture or the Comprehensive Assessment o Water Management in Agriculture (CA). This graphicshows how much more water would be needed based on dierent scenarios. We can meet uture ood and iber
demand with existing land and water resources by investing to increase production in rained agriculture, investing
in irrigation, conducting agricultural trade within and between countries, and inally reducing gross ood demand by
inluencing diets, reducing post-harvest losses, and including industrial and household waste.
Evapotranspiration by irrigation
Without productivity improvement (worst case)
Evapotranspiration by rainfall Dierence (pessimistic – optimistic)
Cubic kilometers
Crop evapotranspiration and irrigation withdrawals
0 2,000 4,000 6,000 8,000 10,000 12,000 14,000
Without productivityimprovement
Comprehensive Assessmentscenario
Trade scenario
Irrigation scenario
Rainfed scenario
Today
Irrigation withdrawals
Celebrating 25 Years of Research — Selec ted Diag rams and Maps

7/31/2019 WF Special Issue-2010
http://slidepdf.com/reader/full/wf-special-issue-2010 8/28
WATER FIGURES | Special Issue | 2010 | 8INTERNATIONAL WATER MANAGEMENT INSTITUT E
Stressed Out
Map o the World Showing Water Stress
in the Earth’s River Catchments
A map of a water stress ind icator which takes into account EWR ( source: Sm akhtin, V. U.; Revenga, C.; D öll, P. 2004.
Taking into account environmental water requirements in global-scale water resources assessments. Colombo, Sri Lanka:
International Water Management Institute (IWMI), 29p. (Comprehensive Assessment of Water Management in Agriculture
Research Report 002).
Physical water scarcity puts pressure on planners and managers to develop better ways o managing existing water
resources. This map highlights basins where there is insuicient water to meet Environmental Water Requirements
(EWR) and is the irst global picture o environmental water scarcity at the basin level. Areas shown in red are those
where EWR may not be met under current water use. Over 1.4 billion people already live in such water-stressed
basins. There are also areas which are approaching the same stress level. This study was widely cited and the
map o environmental water stress has been requested by the National Geographic magazine, International Rice
Research Institute (IRRI); the World Wildlie Fund (WWF), UK; Wageningen University; and the Food and Agriculture
Organization’s (FAO’s) Aquaculture Management and Conservation Service (FIMA) or projects on land and water use
in aquaculture, to name a ew.
Water Stress Indicator
< 0.3
0.3 0.4
0.4 0.5
0.5 0.6
0.6 0.7
Major River Basins
No discharge
0.7 0.80.8 0.9
0.9 1>= 1
Low
High
Celebrating 25 Years of Research — Sele cted Di agra ms a nd Maps

7/31/2019 WF Special Issue-2010
http://slidepdf.com/reader/full/wf-special-issue-2010 9/28
WATER FIGURES | Special Issue | 2010 | 9INTERNATIONAL WATER MANAGEMENT INSTITUTE
How Much Water Does a River Basin Need? Map o Environmental Flows
Map of Environmental Flows (source: Smakhtin, V. U.; Revenga, C.; Döll, P. 2004. Taking into account environmental
water requirements in global-scale water resources assessments. Colombo, Sri Lanka: International Water Management
Institute (IWMI), 29p. (Comprehensive Assessment of Water Management in Agriculture Research Report 002).
Research shows that in many parts o the world not enough water is being let in the environment to sustain
the useul ecosystem services rivers, lakes and aquiers provide to society. The environment needs water.
Excessive withdrawals o water or irrigation and other uses can cause rivers to dry up beore they reach the sea,
jeopardizing the l ivelihoods o armers, ishers and downstream users as well as the bird, animal, ish and plant
species that depend on reshwater. Overexploitation o aquiers can lower the water table. Water planners need
to allocate water or the environment. For example, the amount o water needed by a river to keep it relatively
healthy ranges rom 20 to 50% o its mean annual low. The above map and data showing the total discharge
needed by the environment has recently been requested by the Global Water System Project; the National
Geographic magazine; World Wildlie Fund (WWF), UK; BASF – The Chemical Company, Germany; LimnoTech
Consulting Firm, USA (www.limno.com/); and Ecoys consulting Firm, Berlin, Germany (www.ecoys.com/).
Celebrating 25 Years of Research — Selec ted Diag rams and Maps
Percentage of TotalDischarge Needed byEnvironment
20 - 25 %
25 - 30 %
30 - 35 %35 - 40 %
40 - 45 %
45 - 50 %
No discharge
Major River Basins

7/31/2019 WF Special Issue-2010
http://slidepdf.com/reader/full/wf-special-issue-2010 10/28
WATER FIGURES | Special Issue | 2010 | 10INTERNATIONAL WATER MANAGEMENT INSTITUTE
Managing Agroecosystems
Comparison of intensive agricultural systems managed for the generation of one ecosystem service and multifunctionality
in agroecosystems (source: Molden, D. (Ed.). 2007. Agriculture, water and ecosystems: avoiding the costs of going too far.
Chapter 6 in: Water for food, water for life: A comprehensive assessment of water management in agriculture. London, UK:
Earthscan, and Colombo, Sri Lanka: International Water Management Institute, p. 260).
Many agricultural water management systems have evolved into diverse agroecosystems, rich in biodiversity and
ecosystem services ar beyond ood production. For example, areas o paddy rice cultivation are seminatural wetlands
that support biodiversity. Croplands or natural ecosystems also provide services that help regulate water balance and
soil ertility while providing other services like recreation or isheries. Diversity is good or ecosystem and economic
prosperity. A way to maintain diversity is to manage agroecosystems to mimic as closely as possible their natural
character and state, or example, by releasing environmental lows with a pattern close to the original. This diagram,
developed by Line Gordon, one o the coordinating lead authors o this chapter, has been requested by the Food and
Agriculture Organization o the United Nations (FAO), Rome, Italy, and others.
Celebrating 25 Years of Research — Select ed Diag rams and Maps
Source: Adapted from Foley and others 2005; chapters 14 and 15 in this volume.
Fuelwood
Recreation
Pestcontrol
Soilformation
Regulationof waterbalance
Nutrientcycling
Cropproduction
Climateregulation
Fuelwood
Recreation
Pestcontrol
Soilformation
Regulationof waterbalance
Nutrientcycling
Cropproduction
Climateregulation
Provisioning services Regulating s ervices Supporting s ervices Cultural s ervices
Cardamomseed
Fertility transferto other systems
Soil fertilityimprovement
Watershedconservation
Fodder forlivestock
Soilconservation
Commercial timberand fuel wood
Nitrogenxation
Natural ecosystem Intensive cropland
Multifunctionality in rice elds Alder-cardamom system
FishReligious land-scape values
Water storage,lowering ofpeak oods,groundwaterrecharge
Climateair temperature
Ducks,frogs,snails
Biodiversityenhancement
in human-dominatedlandscapes
Riceproduction
Prevention ofsoil erosion

7/31/2019 WF Special Issue-2010
http://slidepdf.com/reader/full/wf-special-issue-2010 11/28
WATER FIGURES | Special Issue | 2010 | 11INTERNATIONAL WATER MANAGEMENT INSTITUTE
How Much Water Do We Use Globally?
Water use in rainfed and irrigated agriculture (source: Molden, D. (Ed.). 2007. Summary for decisionmakers. In: Water
for food, water for life: A comprehensive assessment of water management in agriculture. London, UK: Earthscan, and
Colombo, Sri Lanka: International Water Management Institute, p. 6).
This illustration shows how water is used globally and the services each use provides. The main source o water is
rain alling on the Earth’s land surace (10,000 cubic kilometers (km3)). The arrows express the magnitude o wateruse as a percentage o total rainall and the services provided. For example, 56% o rainwater is evapotranspired by
various landscape uses that support bioenergy, orest products, livestock grazing lands and biodiversity, and 4.5% is
evapotranspired by rained agriculture supporting crops and livestock. Globally, about 39% o rainall (43,500 km3)
contributes to blue water sources, important or supporting biodiversity, isheries and aquatic ecosystems. Blue
water (surace water) withdrawals are about 9% o total blue water sources (3,800 km 3), with 70% o withdrawals
going to irrigation (2,700 km3). Total evapotranspiration by irrigated agriculture is about 2,200 km3 (2% o rainall)
o which 650 km3 is directly rom rainall (green water) and the remainder rom irrigation water. Cities and industries
withdraw 1,200 km3 but return more than 90% to blue water, oten with degraded quality. The remainder lows to the
sea, where it supports coastal ecosystems. The variation across basins is huge. In some cases, people withdraw and
deplete so much water that little remains to low to the sea.
Celebrating 25 Years of Research — Selec ted Diag rams and Maps
Rainfall(thousands
of cubickilometersper year)110
100%
Bioenergyforest
productsgrazing landsbiodiversity
Landscape56% Crops
livestock
Rainfedagriculture
4.5%
1.3%
Openwater
evaporation
Waterstorageaquatic
biodiversitysheries
Cropslivestock
aquaculture
Irrigatedagriculture0.6% 1.4%
Cities andindustries0.1%
Blue waterGreen water
Rivers
Wetlands
Lakes
Groundwater
Blue
water
Soil
moisture
from rain
Green
water

7/31/2019 WF Special Issue-2010
http://slidepdf.com/reader/full/wf-special-issue-2010 12/28
WATER FIGURES | Special Issue | 2010 | 12INTERNATIONAL WATER MANAGEMENT INSTITUTE
What Happens When A River Basin Closes?
The Basin Perspective
Closing and closed basins - rivers under stress (source: Molden, D. (Ed.). 2007. River basin development and management.
Chapter 16 in: Water for food, water for life: A comprehensive assessment of water management in agriculture. London, UK:
Earthscan, and Colombo, Sri Lanka: International Water Management Institute, p. 590).
As renewable water resources in a river basin decline and competition among users increases, the appropriate ocus
or water management is the basin level, not the ield, arm or even the irrigation system level. This concept is linked to
the idea o “open”, “closing” and “closed” basins. In “open” basins there are unused or unallocated lows out o the basin.
A basin is deined as “closed “when all water is used or human consumption or environmental needs and there is no
usable water leaving the basin. This concept helps in determining which management strategies would work best or a
particular basin.
Celebrating 25 Years of Research — Select ed Diagrams and Maps
Open basin
Closing basin
Closed basin
C o m m i t t e d outow
W a t e r o w s
Time ( one yea r)
D e p l e t e d
w a t e r
O u t o w
W a t e r o w s
Time ( one yea r)
W a t e r o w s
Time ( one yea r)
T o t a l b a s i n r u n o
7/31/2019 WF Special Issue-2010
http://slidepdf.com/reader/full/wf-special-issue-2010 13/28
WATER FIGURES | Special Issue | 2010 | 13INTERNATIONAL WATER MANAGEMENT INSTITUTE
Wastewater: A Rich Resource in a Water–Scarce World
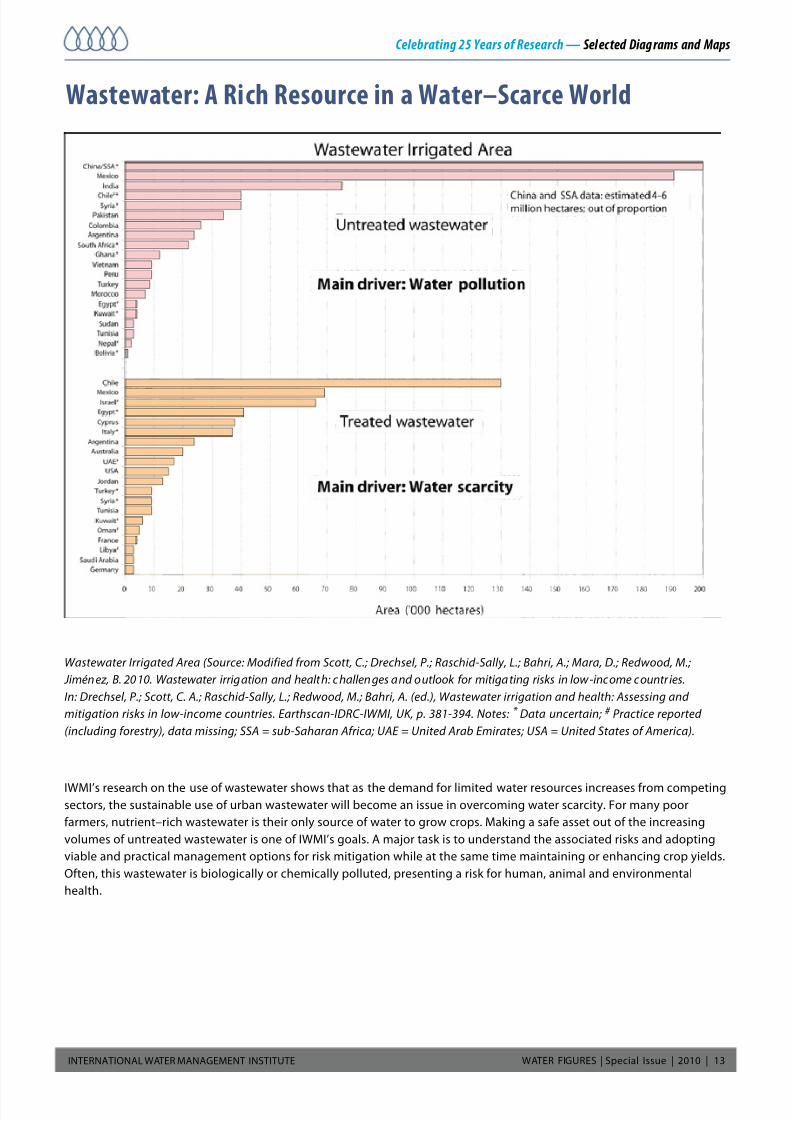
Wastewater Irrigated Area (Source: Modified from Scott, C.; Drechsel, P.; Raschid-Sally, L.; Bahri, A.; Mara, D.; Redwood, M.;
Jimén ez, B. 2010. Wastewater irrigation and health: challen ges and outlook for mitiga ting risks in low-income countr ies.
In: Drechsel, P.; Scott, C. A.; Raschid-Sally, L.; Redwood, M.; Bahri, A. (ed.), Wastewater irrigation and health: Assessing and
mitigation risks in low-income countries. Earthscan-IDRC-IWMI, UK, p. 381-394. Notes: * Data uncertain; # Practice reported
(including forestry), data missing; SSA = sub-Saharan Africa; UAE = United Arab Emirates; USA = United States of America).
IWMI’s research on the use o wastewater shows that as the demand or limited water resources increases rom competingsectors, the sustainable use o urban wastewater will become an issue in overcoming water scarcity. For many poor
armers, nutrient–rich wastewater is their only source o water to grow crops. Making a sae asset out o the increasing
volumes o untreated wastewater is one o IWMI’s goals. A major task is to understand the associated risks and adopting
viable and practical management options or risk mitigation while at the same time maintaining or enhancing crop yields.
Oten, this wastewater is biologically or chemically polluted, presenting a risk or human, animal and environmental
health.
Celebrating 25 Years of Research — Selec ted Diag rams and Maps

7/31/2019 WF Special Issue-2010
http://slidepdf.com/reader/full/wf-special-issue-2010 14/28
WATER FIGURES | Special Issue | 2010 | 14INTERNATIONAL WATER MANAGEMENT INSTITUTE
Mapping the World’s Water Resources
Global Irrigated and Rainfed Area Map (Source: GIAM Core Team: Thenkabail, P. S.; Biradar, C. M.; Turral, H.; Noojipady, P.; Cai, X. L.; Li, Y. J.; V
IWMI’s Global Irrigated Area Mapping (GIAM) or the year 2000 was the irst o its kind. Multiple satellite sensor data were used to pro
across the world. The map distinguishes types o irrigated areas, providing distinct classes o irrigation. This detailed analysis and deg
resources better and reduce hunger. For more details visit www.iwmigiam.org
Celebrating 25 Years of Research — Select ed Diag rams and Maps

7/31/2019 WF Special Issue-2010
http://slidepdf.com/reader/full/wf-special-issue-2010 15/28
WATER FIGURES | Special Issue | 2010 | 15INTERNATIONAL WATER MANAGEMENT INSTITUTE
ri, M.; Vithanage, J.; Dheeravath, V.; Schull, M.; Dutta, R.; Gumma, M. K.; Biggs, T.; and Parthasaradhi, G. R. (IWMI). 2006).
a map at a 10 kilometer (km) scale, showing the extent o land and water resources committed to irrigated agriculture
o accuracy will strengthen eorts to make agriculture more productive and sustainable, manage crucial environmental
Celebrating 25 Years of Research — Selec ted Diag rams and Maps
7/31/2019 WF Special Issue-2010
http://slidepdf.com/reader/full/wf-special-issue-2010 16/28
WATER FIGURES | Special Issue | 2010 | 16INTERNATIONAL WATER MANAGEMENT INSTITUTE
The Multiple Barrier Approach to Microbial Risk Management
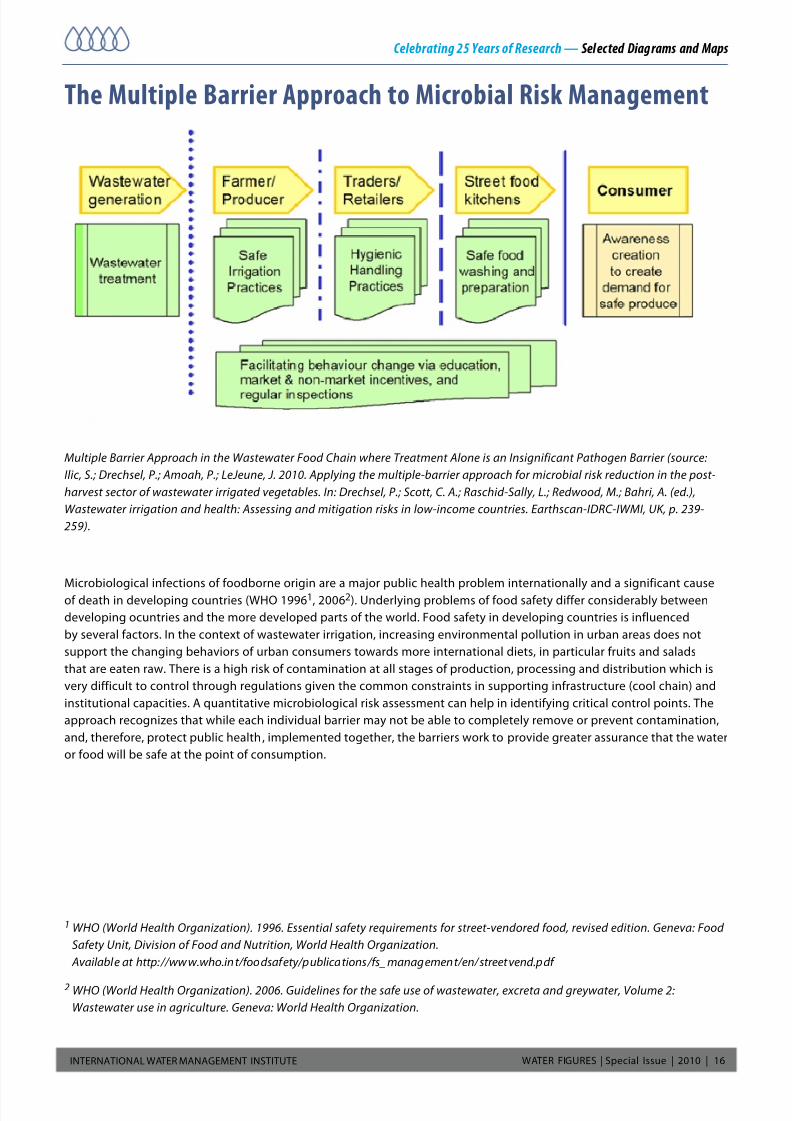
Multiple Barrier Approach in the Wastewater Food Chain where Treatment Alone is an Insignificant Pathogen Barrier (source:
Ilic, S.; Drechsel, P.; Amoah, P.; LeJeune, J. 2010. Applying the multiple-barrier approach for microbial risk reduction in the post-
harvest sector of wastewater irrigated vegetables. In: Drechsel, P.; Scott, C. A.; Raschid-Sally, L.; Redwood, M.; Bahri, A. (ed.),
Wastewater irrigation and health: Assessing and mitigation risks in low-income countries. Earthscan-IDRC-IWMI, UK, p. 239-
259).
Microbiological inections o oodborne origin are a major public health problem internationally and a signiicant causeo death in developing countries (WHO 19961, 20062). Underlying problems o ood saety dier considerably between
developing ocuntries and the more developed parts o the world. Food saety in developing countries is inluenced
by several actors. In the context o wastewater irrigation, increasing environmental pollution in urban areas does not
support the changing behaviors o urban consumers towards more international diets, in particular ruits and salads
that are eaten raw. There is a high risk o contamination at all stages o production, processing and distribution which is
very diicult to control through regulations given the common constraints in supporting inrastructure (cool chain) and
institutional capacities. A quantitative microbiological risk assessment can help in identiying critical control points. The
approach recognizes that while each individual barrier may not be able to completely remove or prevent contamination,
and, thereore, protect public health, implemented together, the barriers work to provide greater assurance that the water
or ood will be sae at the point o consumption.
1 WHO (World Health Organization). 1996. Essential safety requirements for street-vendored food, revised edition. Geneva: Food
Safety Unit, Division of Food and Nutrition, World Health Organization.
Available at http://ww w.who.in t/foodsafety/publications/fs_management/en/street vend.pdf
2 WHO (World Health Organization). 2006. Guidelines for the safe use of wastewater, excreta and greywater, Volume 2:
Wastewater use in agriculture. Geneva: World Health Organization.
Celebrating 25 Years of Research — Selec ted Diagrams and Maps
7/31/2019 WF Special Issue-2010
http://slidepdf.com/reader/full/wf-special-issue-2010 17/28
WATER FIGURES | Special Issue | 2010 | 17INTERNATIONAL WATER MANAGEMENT INSTITUTE
Global Irrigated Area Mapping: Indian Subcontinent
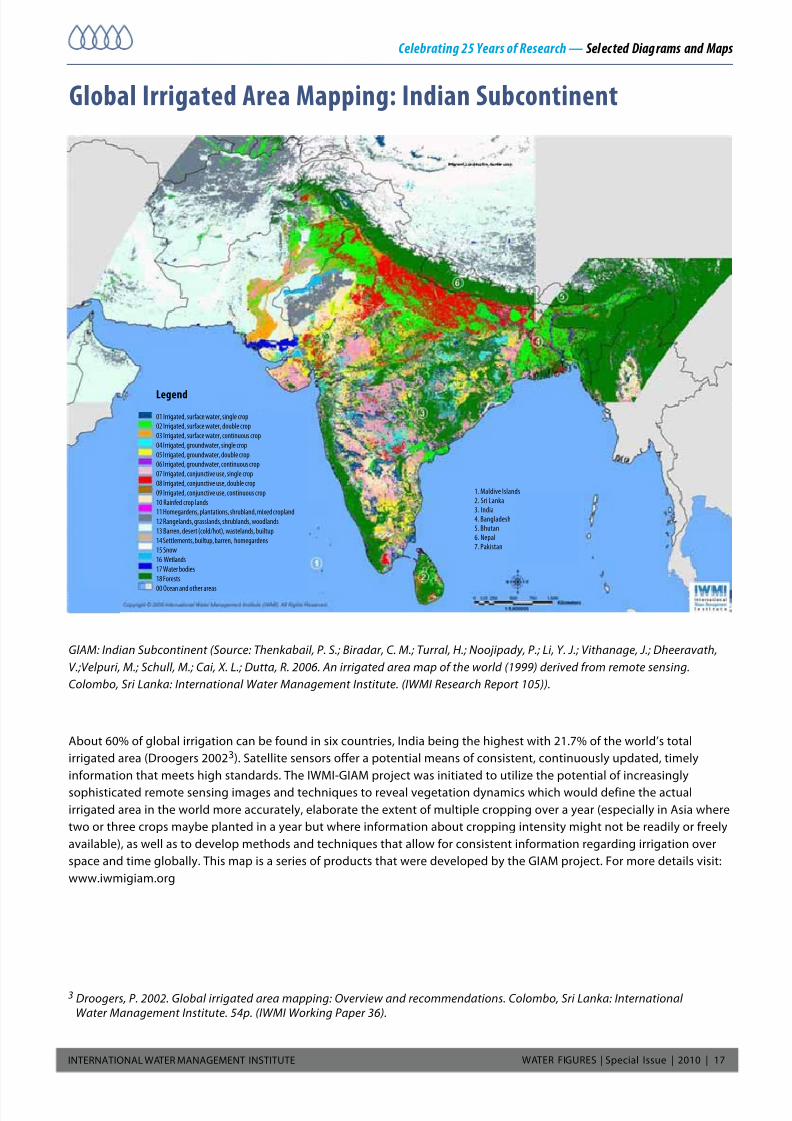
GlAM: Indian Subcontinent (Source: Thenkabail, P. S.; Biradar, C. M.; Turral, H.; Noojipady, P.; Li, Y. J.; Vithanage, J.; Dheeravath,
V.;Velpuri, M.; Schull, M.; Cai, X. L.; Dutta, R. 2006. An irrigated area map of the world (1999) derived from remote sensing.
Colombo, Sri Lanka: International Water Management Institute. (IWMI Research Report 105)).
About 60% o global irrigation can be ound in six countries, India being the highest with 21.7% o the world’s total
irrigated area (Droogers 20023). Satellite sensors oer a potential means o consistent, continuously updated, timely
inormation that meets high standards. The IWMI-GIAM project was initiated to utilize the potential o increasingly
sophisticated remote sensing images and techniques to reveal vegetation dynamics which would deine the actual
irrigated area in the world more accurately, elaborate the extent o multiple cropping over a year (especially in Asia where
two or three crops maybe planted in a year but where inormation about cropping intensity might not be readily or reely
available), as well as to develop methods and techniques that allow or consistent inormation regarding irrigation over
space and time globally. This map is a series o products that were developed by the GIAM project. For more details visit:
www.iwmigiam.org
3 Droogers, P. 2002. Global irrigated area mapping: Overview and recommendations. Colombo, Sri Lanka: International Water Management Institute. 54p. (IWMI Working Paper 36).
Celebrating 25 Years of Research — Selec ted Diag rams and Maps
Legend
01 Irrigated, surace water, single crop
02 Irrigated, surace water, double crop
03 Irrigated, surace water, continuous crop
04 Irrigated, groundwater, single crop
05 Irrigated, groundwater, double crop
06 Irrigated, groundwater, continuous crop
07 Irrigated, conjunctive use, single crop
08 Irrigated, conjunctive use, double crop
09 Irrigated, conjunctive use, continuous crop
10 Rained crop lands
11 Homegardens, plantations, shrubland, mixed cropland
12 Rangelands, grasslands, shrublands, woodlands
13 Barren, desert (cold/hot), wastelands, builtup
14 Settlements, builtup, barren, homegardens
15 Snow
16 Wetlands
17 Water bodies
18 Forests
00 Ocean and other areas
1. Maldive Islands
2. Sri Lanka
3. India
4. Bangladesh
5. Bhutan
6. Nepal
7. Pakistan

7/31/2019 WF Special Issue-2010
http://slidepdf.com/reader/full/wf-special-issue-2010 18/28
WATER FIGURES | Special Issue | 2010 | 18INTERNATIONAL WATER MANAGEMENT INSTITUTE
Improving Water Productivity in the Water-Scarce Krishna Basin, In
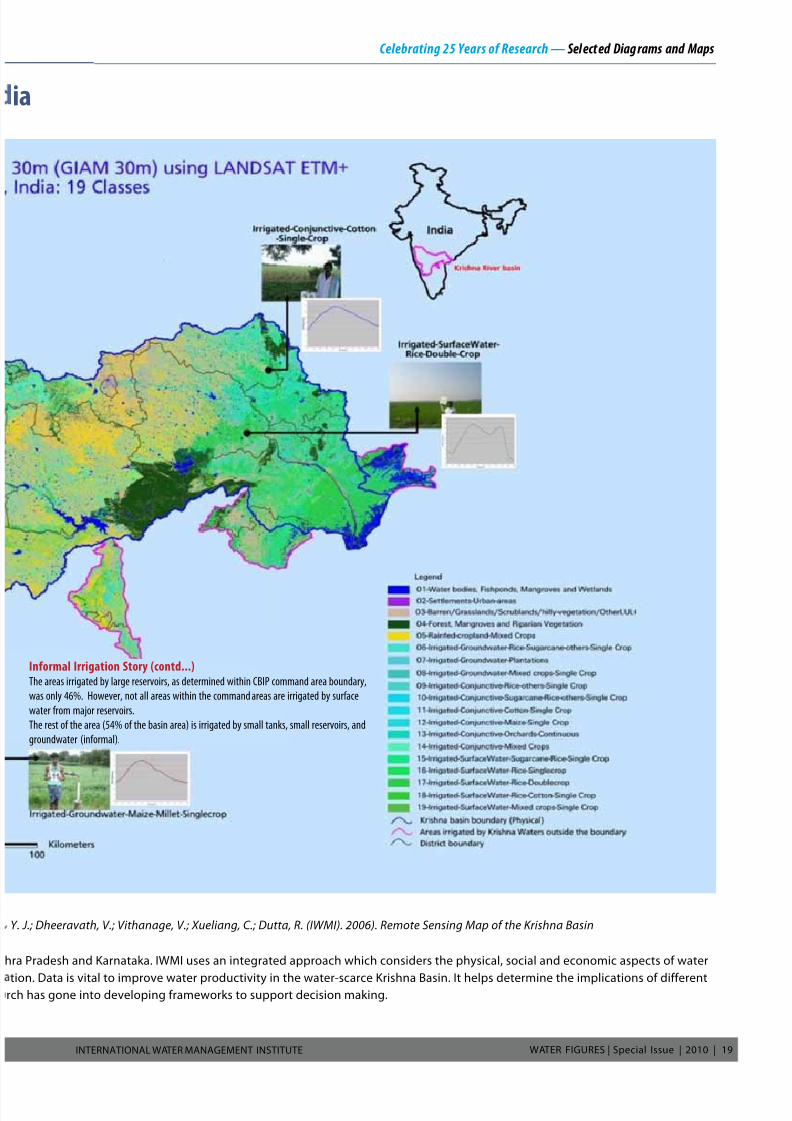
Remote sensing map of the Krishna Basin (Source: Velpuri, N. M.; Gumma, M. K.; Thenkabail, P. S.; Biradar, C. M.; Noojipady, P.; Turral, H.; Li
The map shows irr igated areas in the Krishna Basin in India. The Krishna River lows through three riparian states, Maharashtra, And
resources management and provides policymakers with essential inormation needed to make decisions on national resource allocwater allocation scenarios or uture allocation options, ood production and long-term resource sustainability. A lot o IWMI’s rese
Introduction
This is an irrigated area map o the Krishna river basin, India.
The map Is produced using:
(A) Landsat ETM+ 30 m data or normal year 2000;
(B) MODIS monthly normalized dierence vegetation index maximum
value composite (NDVI MVC) or 2001–2003, and
(C) SRTM 90 m digital elevation data.
The overarching goal was to produce irrigated area maps and statistics at
various administrative units using satellite sense or data. The study is backed
by extensive groundtruth data, very high resolution in Google Earth Data, and
numerous secondary (e.g., rainall, temperature) rom various sources.
The data and products are made available through the International Water
Management Institute’s (IWMI’s) global irrigated area mapping (GIAM) web
Irrigated Area Statistics or the Krishna River Basin
Total targeted Irrigated Area 9.4 Mha
Surace Water Irrig. 3.9 M ha (48%)
Ground Water Irrig. 5.2 M ha ( 52%)
Krishna River Basin
• Krishna river basin is located in the south central part o India.
• It extends over an area o 258,948 km2 which is nearly 8% o the total geographical area o the Country.
• The basin covers three states o Karnataka, Andhra Pradesh and Maharashtra in India.
• The basin has marked diversity in topography. It raises in the Western Ghat hills at an elevation o about 1,337 m and
travels about 1300 km beore it ows into the Bay o Bengal.
Inormal Irrigation Story
The Krishna river is a hydrologic ally closing basins (i.e., the outow o water to ocean is insignicant duringnormal years). Generally, it is thought that the 12 major reservoirs (e.g., Nagarj un Sagar, Tungabhadra) are themain causes or this.Our study has shown that the cause could be elsewhere. Inormal irrigation (e.g., groundwater, tanks,minor reservoirs) is highly signicant or even staggering in Krishna as it is in most o the places in India.
There are about 6100 small tanks and reservoirs in the Krishna basis, which when combined have nearly equal waterspread area as that o the 12 odd major reservoirs.}
Traditionally, irrigation statistics are limited to the command areas o major reservoirs. The global irrigated area mapping(GIAM) project’s 30 m work accounts or all the irrigated areas rom the tanks and small reservoirs. In addition, it also accountsor groundwater irrigation in the Krishna basin at the end o the last millennium to be 9.4 M ha. (35% o the total basin area). O this, 52% is rom groundwater and 48% rom surace water.
Copyright © 2006 International Management Institute (IWMI). All Rights Reserved.
7/31/2019 WF Special Issue-2010
http://slidepdf.com/reader/full/wf-special-issue-2010 19/28
WATER FIGURES | Special Issue | 2010 | 19INTERNATIONAL WATER MANAGEMENT INSTITUTE
a
.; Dheeravath, V.; Vithanage, V.; Xueliang, C.; Dutta, R. (IWMI). 2006). Remote Sensing Map of the Krishna Basin
Pradesh and Karnataka. IWMI uses an integrated approach which considers the physical, social and economic aspects o water
n. Data is vital to improve water productivity in the water-scarce Krishna Basin. It helps determine the implications o dierenthas gone into developing rameworks to support decision making.
Celebrating 25 Years of Research — Select ed Diag rams and Maps
Inormal Irrigation Story (contd...)The areas irrigated by large reservoirs, as determined within CBIP command area boundary,
was only 46%. However, not all areas within the command areas are irrigated by surace
water rom major reservoirs.
The rest o the area (54% o the basin area) is irrigated by small tanks, small reservoirs, and
groundwater (inormal).

7/31/2019 WF Special Issue-2010
http://slidepdf.com/reader/full/wf-special-issue-2010 20/28
WATER FIGURES | Special Issue | 2010 | 20INTERNATIONAL WATER MANAGEMENT INSTITUTE
Sri Lanka in the Atermath o the Tsunami
Afected Persons Situation Map
Affected Persons Situation Map ( Source: Data sourced from CNO, Ministry of Women Em powerm ent and Social Welfare. IWMI.
MapAction UK. 2005).
In the days immediately ollowing the 2004 tsunami, IWMI worked with MapAction UK at the Centre or National
Operations (CNO). IWMI and MapAction worked around the clock to provide detailed maps o tsunami-aected areas,
displaced persons and other relevant data or the government and other organizations involved in the relie eort.
A unique eature o the activity was the physical mapping o the Tsunami Aected Boundary Line (TABL) using Global
Positioning System (GPS) technology, to identiy and assess the eects o the tsunami on villages.
The Ramsar Tsunami Reerence Group was also established involving Wetlands International, World Wildlie Fund
(WWF), International Union or Conservation o Nature (IUCN), BirdLie International and IWMI to combine resources,
share inormation and produce timely advice when needed. The highest and immediate priority o this group was tocoordinate rapid assessment o the aected areas with the involvement and assistance o all remote sensing specialists,
interested agencies and organizations.
Celebrating 25 Years of Research — Selec ted Diag rams and Maps
7/31/2019 WF Special Issue-2010
http://slidepdf.com/reader/full/wf-special-issue-2010 21/28
WATER FIGURES | Special Issue | 2010 | 21INTERNATIONAL WATER MANAGEMENT INSTITUTE
Preparing or the Impacts o Climate Change
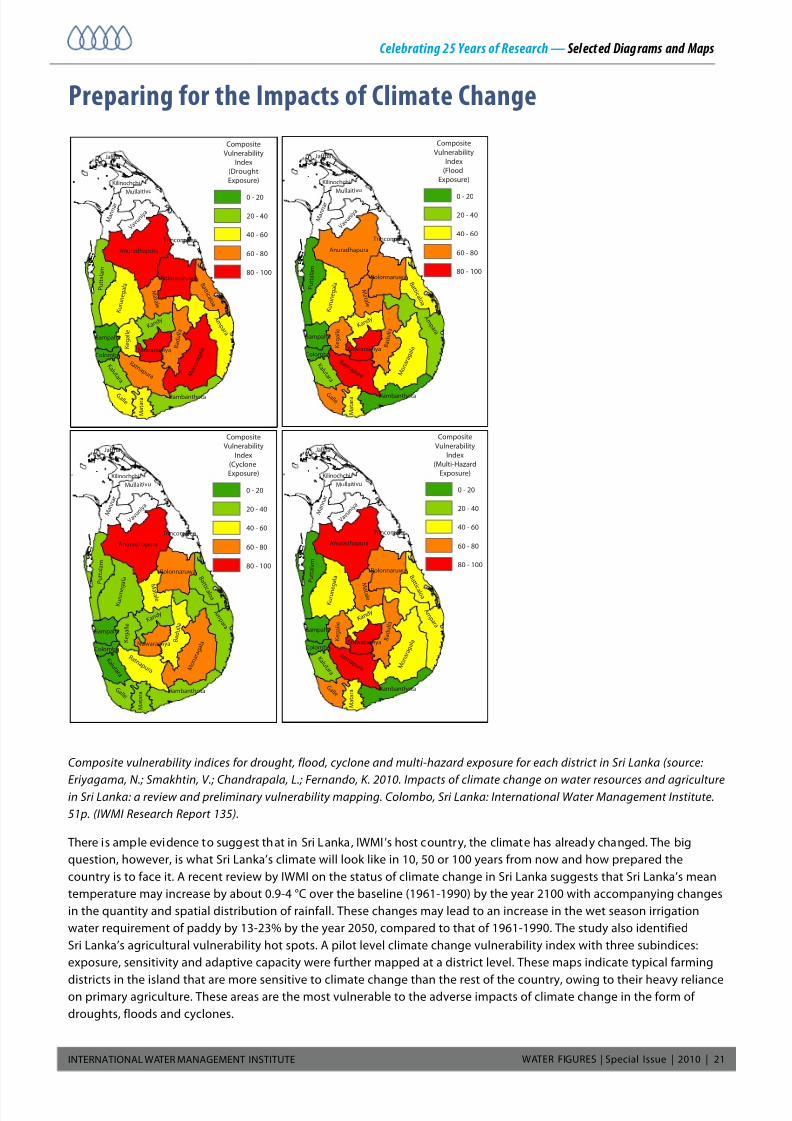
Composite vulnerability indices for drought, flood, cyclone and multi-hazard exposure for each district in Sri Lanka (source:
Eriyagama, N.; Smakhtin, V.; Chandrapala, L.; Fernando, K. 2010. Impacts of climate change on water resources and agriculturein Sri Lanka: a review and preliminary vulnerability mapping. Colombo, Sri Lanka: International Water Management Institute.
51p. (IWMI Research Report 135).
There is ample evidence to suggest that in Sri Lanka, IWMI’s host country, the climate has already changed. The big
question, however, is what Sri Lanka’s climate will look like in 10, 50 or 100 years rom now and how prepared the
country is to ace it. A recent review by IWMI on the status o climate change in Sri Lanka suggests that Sri Lanka’s mean
temperature may increase by about 0.9-4 °C over the baseline (1961-1990) by the year 2100 with accompanying changes
in the quantity and spatial distribution o rainall. These changes may lead to an increase in the wet season irrigation
water requirement o paddy by 13-23% by the year 2050, compared to that o 1961-1990. The study also identiied
Sri Lanka’s agricultural vulnerability hot spots. A pilot level climate change vulnerability index with three subindices:
exposure, sensitivity and adaptive capacity were urther mapped at a district level. These maps indicate typical arming
districts in the island that are more sensitive to climate change than the rest o the country, owing to their heavy relianceon primary agriculture. These areas are the most vulnerable to the adverse impacts o climate change in the orm o
droughts, loods and cyclones.
Celebrating 25 Years of Research — Select ed Diag rams and Maps
A m p a r a
Anuradhapura
M o n a r a g
a l a
K u r u n e g a
l a
B a
d u l l a
P u t t a
l a m
M a t a l e
R a t n a p u r a
G a l l e
K a n d y
Mullaitivu
M a n n a r
B a t t i c
a l o a
K e g a
l l e
V a v u
n i y a
K a l u
t a r a
M a t a r a
Polonnaruwa
Trincomalee
Hambanthota
Gampaha
Nuwaraeliya
Kilinochchi
Jaffna
Colombo
Composite
Vulnerability
Index
(Flood
Exposure)
0 - 20
20 - 40
40 - 60
60 - 80
80 - 100
A m p a r a
Anuradhapura
M o n a r a g
a l a
K u r u n e g a
l a
B a
d u l l a
P u t t a
l a m
M a t a l e
R a t n a p u r a
G a l l e
K a n d y
Mullaitivu
M a n n a r
B a t t i c a
l o a
K e g a
l l e
V a v u
n i y a
K a l u
t a r a
M a t a r a
Polonnaruwa
Trincomalee
Hambanthota
Gampaha
Nuwaraeliya
Kilinochchi
Jaffna
Colombo
Composite
Vulnerability
Index
(Cyclone
Exposure)
0 - 20
20 - 40
40 - 60
60 - 80
80 - 100
A m p a r a
Anuradhapura
M o n a r a g
a l a
K u r u n e
g a
l a
B a
d u l l a
P u t t a
l a m
M a t a l e
R a t n a p u r a
G a l l e
K a n d y
Mullaiti vu
M a n n a r
B a t t
i c a l o
a
K e g a
l l e
V a v u
n i y a
K a l u
t a r a
M a t a r a
Polonnaruwa
Trincomalee
Hambanthota
Gampaha
Nuwaraeliya
Kilinochchi
Jaffna
Colombo
Composite
Vulnerability
Index
(Multi-Hazard
Exposure)
0 - 20
20 - 40
40 - 60
60 - 80
80 - 100
A m p a r a
Anuradhapura
M o n a r a g
a l a
K u r u n e g a
l a
B a
d u l l a
P u t t a
l a m
M a t a l e
R a t n a p u r a
G a l l e
K a n d y
Mullaitivu
M a n n a r
B a t t i c
a l o
a
K e g a
l l e
V a v u
n i y a
K a l u
t a r a
M a t a r a
Polonnaruwa
Trincomalee
Hambanthota
Gampaha
Nuwaraeliya
Kilinochchi
Jaffna
Colombo
Composite
Vulnerability
Index
(Drought
Exposure)
0 - 20
20 - 40
40 - 60
60 - 80
80 - 100

7/31/2019 WF Special Issue-2010
http://slidepdf.com/reader/full/wf-special-issue-2010 22/28
WATER FIGURES | Special Issue | 2010 | 22INTERNATIONAL WATER MANAGEMENT INSTITUTE
Convergence in Orientation o Transboundary Water Law
Convergence in Orientation of Transboundary Law (Source: Lautze, J., and Giordano, M. 2007. Demanding Supply Management
and Supplying Demand Management: Transboundary Waters in Sub-Saharan Africa. Journal of Environment and Development
16(3): 290-306).
The emphasis o the world’s transboundary water law has gradually shited in the past hal century rom water resources
development to water resources management and environmental protection. Sub-Saharan Arica’s (SSA’s) levels o water
resources development, economic prosperity and ood security are signiicantly lower than any other region in the world.
Somewhat surprisingly, then, this igure/graph indicates that the orientation o transboundary water law in SSA ollows
the global transition rom water resources development to management. This inding suggests that the nature o SSA’s
transboundary water law may be largely “handed down” rom other parts o the world with dierent realities than those
present in SSA. Recognizing this relationship calls or more tailoring o river basin agreements to the conditions o SSA,
and more circumspect policy guidance rom international development agencies and developed countries. This graphhas been requested and used by (a) sta o the World Bank, in helping to reorient their approach to water resources
management and development in Arica; (b) Council on Foreign Relations, to understand issues related to water resources
in Arica; and (c) research/researchers, on international waters and international waters in Arica.
Celebrating 25 Years of Research — Select ed Diagrams and Maps
7/31/2019 WF Special Issue-2010
http://slidepdf.com/reader/full/wf-special-issue-2010 23/28
WATER FIGURES | Special Issue | 2010 | 23INTERNATIONAL WATER MANAGEMENT INSTITUTE
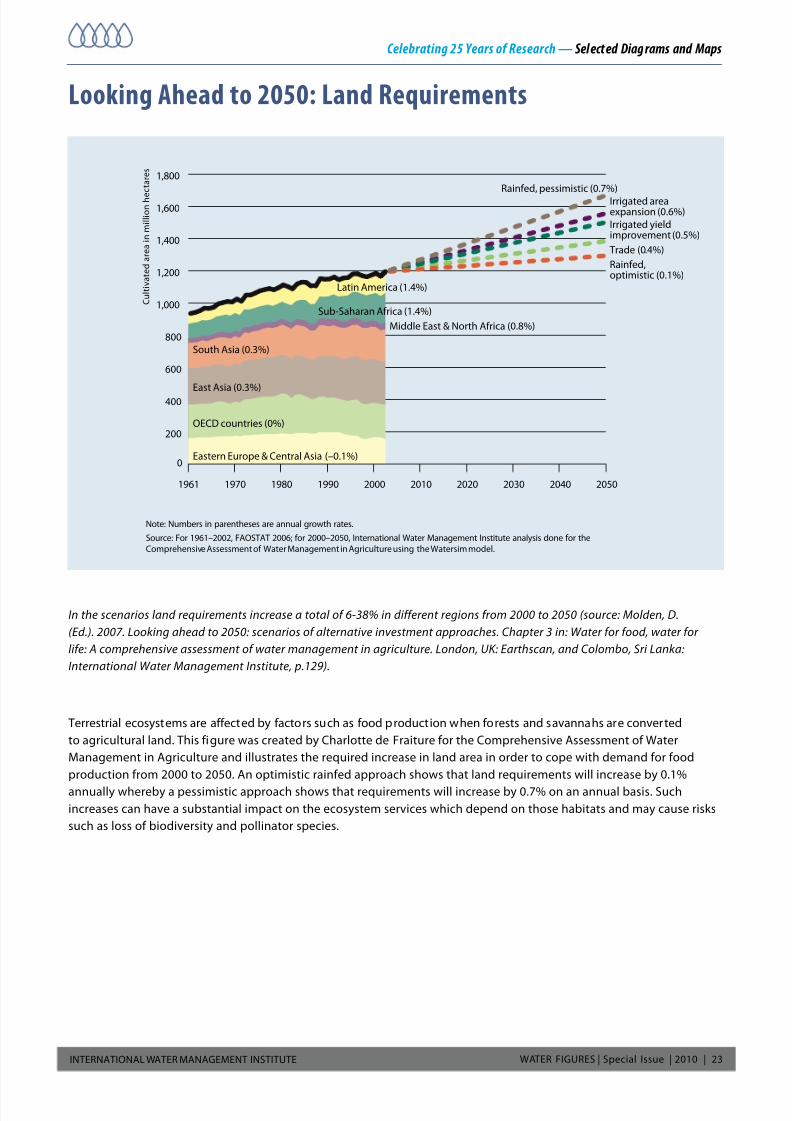
In the scenarios land requirements increase a total of 6-38% in different regions from 2000 to 2050 (source: Molden, D.
(Ed.). 2007. Looking ahead to 2050: scenarios of alternative investment approaches. Chapter 3 in: Water for food, water for
life: A comprehensive assessment of water management in agriculture. London, UK: Earthscan, and Colombo, Sri Lanka:
International Water Management Institute, p.129).
Terrestrial ecosystems are aected by actors such as ood production when orests and savannahs are converted
to agricultural land. This igure was created by Charlotte de Fraiture or the Comprehensive Assessment o Water
Management in Agriculture and illustrates the required increase in land area in order to cope with demand or ood
production rom 2000 to 2050. An optimistic rained approach shows that land requirements will increase by 0.1%
annually whereby a pessimistic approach shows that requirements will increase by 0.7% on an annual basis. Such
increases can have a substantial impact on the ecosystem services which depend on those habitats and may cause risks
such as loss o biodiversity and pollinator species.
Looking Ahead to 2050: Land Requirements
Celebrating 25 Years of Research — Select ed Diag rams and Maps
2050204020302020201020001990198019701961
0
200
400
600
800
1,000
1,200
1,400
1,600
1,800Rainfed, pessimistic (0.7%)
Latin America (1.4%)
Sub-Saharan Africa (1.4%)
Middle East & North Africa (0.8%)
South Asia (0.3%)
East Asia (0.3%)
Eastern Europe & Central Asia (–0.1%)
OECD countries (0%)
Irrigated yieldimprovement (0.5%)
Trade (0.4%)
Irrigated areaexpansion (0.6%)
Rainfed,optimistic (0.1%)
C u l t i v a t e d a r e a i n m i l l i o n h e
c t a r e s
Note: Numbers in parentheses are annual growth rates.
Source: For 1961–2002, FAOSTAT 2006; for 2000–2050, International Water Management Institute analysis done for the
Comprehensive Assessment of Water Management in Agriculture using the Watersim model.
7/31/2019 WF Special Issue-2010
http://slidepdf.com/reader/full/wf-special-issue-2010 24/28
WATER FIGURES | Special Issue | 2010 | 24INTERNATIONAL WATER MANAGEMENT INSTITUTE
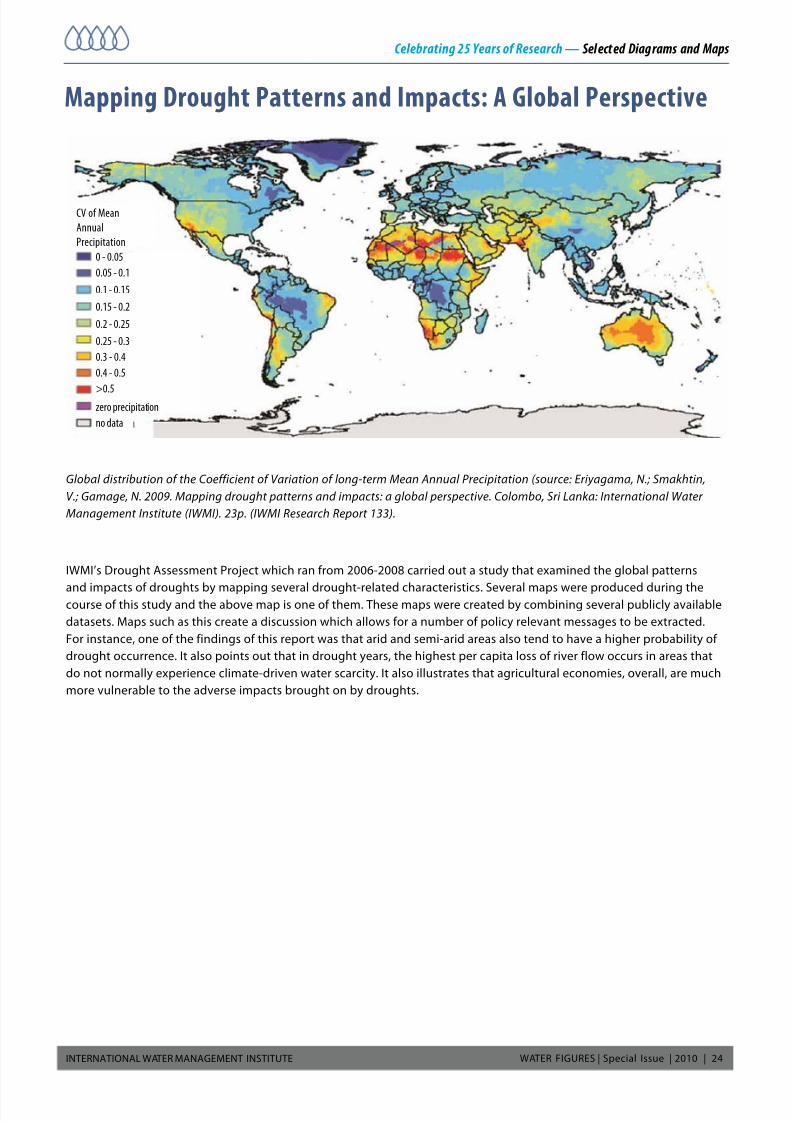
Mapping Drought Patterns and Impacts: A Global Perspective
Global distribution of the Coefficient of Variation of long-term Mean Annual Precipitation (source: Eriyagama, N.; Smakhtin,
V.; Gamage, N. 2009. Mapping drought patterns and impacts: a global perspective. Colombo, Sri Lanka: International Water
Management Institute (IWMI). 23p. (IWMI Research Report 133).
IWMI’s Drought Assessment Project which ran rom 2006-2008 carried out a study that examined the global patterns
and impacts o droughts by mapping several drought-related characteristics. Several maps were produced during thecourse o this study and the above map is one o them. These maps were created by combining several publicly available
datasets. Maps such as this create a discussion which allows or a number o policy relevant messages to be extracted.
For instance, one o the indings o this report was that arid and semi-arid areas also tend to have a higher probability o
drought occurrence. It also points out that in drought years, the highest per capita loss o river low occurs in areas that
do not normally experience climate-driven water scarcity. It also illustrates that agricultural economies, overall, are much
more vulnerable to the adverse impacts brought on by droughts.
Celebrating 25 Years of Research — Select ed Diagrams and Maps
CV o Mean
Annual
Precipitation
0 - 0.05
0.05 - 0.1
0.1 - 0.15
0.15 - 0.2
0.2 - 0.25
0.25 - 0.3
0.3 - 0.4
0.4 - 0.5
>0.5zero precipitation
no data

7/31/2019 WF Special Issue-2010
http://slidepdf.com/reader/full/wf-special-issue-2010 25/28
WATER FIGURES | Special Issue | 2010 | 25INTERNATIONAL WATER MANAGEMENT INSTITUTE
Conceptualization o the Physical Water Storage Continuum Exploring Dierent Water Storage Options
Diagram of water storage continuum (Source: McCartney, M.; Smakhtin, V. 2010. Water storage in an era of climate change: Addressing the challenge of increas ing rainfal l variabilit y. Blue Paper. Colombo, Sri Lanka: Internation al Water Manag ement
Institute).
One o the impacts o climate change will be erratic rainall, oten leading to extreme weather conditions like drought
or loods. IWMI has been exploring a range o water storage options which can make use o this surplus water and
also provide a buer against times o water scarcity. While large dams are just one o a range o possible water storage
options, others include natural wetlands, enhanced soil moisture, groundwater aquiers and ponds or small tanks. This
water storage continuum was highlighted in a blue paper launched by IWMI during World Water Week in Stockholm in
September 2010 and the visual conceptualization o the water storage continuum is one o IWMI’s latest products. For
each option, the way water is accessed and who can access it varies. Not all storage types suit all purposes but each hasan important role to play and under the right circumstances can contribute to ood security and poverty reduction. IWMI
recommends a range o water storage options rather than a single option. I one option does not work, armers then
have other options to provide them with a steady supply o water.
Celebrating 25 Years of Research — Selec ted Diagrams and Maps

7/31/2019 WF Special Issue-2010
http://slidepdf.com/reader/full/wf-special-issue-2010 26/28
WATER FIGURES | Special Issue | 2010 | 26INTERNATIONAL WATER MANAGEMENT INSTITUTE
Recent Publications
Research Reports
Eriyagama, N.; Smakhtin, V.; Chandrapala, L.; Fernando, K. 2010. Impacts of climate change on water resources and agriculture in Sri Lanka: a review and preliminary vulnerability mapping. Colombo, Sri Lanka: International Water Management Institute (IWMI). 43p. (IWMI Research Repor t 135)
www.iwmi.org/Publications/IWMI_Research_Reports/PDF/PUB135/RR135.aspx
McCartney, M.; Alemayehu, T.; Shieraw, A.; Awulachew, S. B. 2010. Evaluation of current and future water resources development in the Lake Tana Basin, Ethiopia. Colombo, Sri Lanka:International Water Management Institute (IWMI). 31p. (IWMI Research Report 134).www.iwmi.org/Publications/IWMI_Research_Reports/PDF/PUB134/RR134.pd
Books
Chartres, C.; Varma, S. 2010. Out of water: from abundance to scarcity and how to solve the world’s water problems. Upper Saddle River, NJ, USA: FT Press. 230p.www.iwmi.org/OutOWater/
Drechsel, P.; Scott, C. A.; Raschid-Sally, L.; Redwood, M.; Bahri, A. (Eds.). 2010. Wastewater irrigation and health: assessing and mitigating risk in low-income countries. Colombo, SriLanka: International Water Management Institute (IWMI); London, UK: Earthscan; Ottawa, Canada: International Development Research Centre (IDRC). 404p.www.iwmi.org/Publications/books/pd/Wastewater_Irrigation_and_Health_book.pd
Hoanh, C. T.; Szuster, B. W.; Kam, S. P.; Ismail, A. M; Noble, A. D. (Eds.). 2010. Tropical deltas and coastal zones: food production, communities and environment at the land-water interface.Wallingord, UK: CABI; Colombo, Sri Lanka: International Water Management Institute (IWMI); Penang, Malaysia: WorldFish Center; Los Banos, Philippines: InternationalRice Research Institute (IRRI); Bangkok, Thailand: FAO Regional Ofce or Asia and the Pacic; Colombo, Sri Lanka: CGIAR Challenge Program on Water and Food (CPWF). 477p.(Comprehensive Assessment o Water Management in Agriculture Series 9)www.iwmi.org/Publications/CABI_Publications/CA_CABI_Series/Coastal_Zones/protected/9781845936181.pd
Wegerich, K. ; Warner, J. (Eds.). 2010. The politics of water: a survey. London, UK: Routledge. 393p.
Book Chapters
Evans, A.; Raschid-Sally, L.; Coe, O. O. 2010. Multi-stakeholder processes or managing wastewater use in agriculture. In: Drechsel, P.; Scott, C. A.; Raschid-Sally, L.; Redwood, M.;Bahri, A. (Eds.). Wastewater irrigation and health: assessing and mitigating risk in low-income countries. London, UK: Ear thscan; Ottawa, Canada: International Development ResearchCentre (IDRC); Colombo, Sri Lanka: International Water Management Institute (IWMI). pp.355-377.http://publications.iwmi.org/pd/H042618.pd
Lautze, J.; Giordano, M.; Kloos, H. 2010. Water resources development and management in Sub-Saharan Arica: overview and global context. In: Kloos, H.; Legesse, W. (Eds.). Water resources management in Ethiopia: implications for the Nile Basin. Amherst, NY, USA: Cambria Press. pp.1-29.
Mukherji, A.; Giordano, M. 2010. Common pool resources. In War, B. (Ed.), Encyclopedia of geography. London, UK: Sage.www.sage-ereerence.com/geography/Article_n194.html.
Mukherji, A. 2010. Common property resource management. In: War, B., (Ed.), Encyclopedia of geography . London, UK: Sage.www.sage-ereerence.com/geography/Article_n195.html.
Mukherji, A.; Shah, T.; Verma, S. 2010. Electricity reorms and its impact on groundwater use: evidence rom India. In: Martinez-Cortina, L.; Garrido, A.; Lopez-Gunn, E. (Eds.). Re-thinking Water and Food Security: Fourth Botin Foundation Water Workshop. London, UK: CRC Press. pp.299-306.
Rebelo, L-M. 2010. Mapping wetlands in Arica to improve understanding o wetland-livelihood interactions Lake Urema, Mozambique. In: Rosenqvist, A.; Shimada, M. (Eds.). Global
environmental monitoring by ALOS PALSAR: science results from the ALOS Kyoto and Carbon Initiative . Tsukuba, Ibaraki, Japan: Japan Aerospace Exploration Agency. pp.60-61.www.eorc.jaxa.jp/ALOS/en/kyoto/re/KC-Booklet_2010_comp.pd
Journal Articles
Bossio, D. A.; Geheb, K.; Critchley, W. 2010. Managing water by managing land: addressing land degradation to improve water productivity and rural livelihoods. Agricultural Water Management 97(4): 536-542 (special issue with contributions by IWMI authors).
de Fraiture, C.; Molden, D.; Wichelns, D. 2010. Investing in water or ood, ecosystems, and livelihoods: an overview o the comprehensive assessment o water management inagriculture. Agricultural Water Management 97(4): 495-501 (special issue with contributions by IWMI authors).
de Fraiture, C.; Wichelns, D. 2010. Satisying uture water demands or agriculture. Agricultural Water Management 97(4): 502-511 (Special issue with contributions by IWMIauthors).
Drechsel, P.; Evans, A. 2010. Wastewater use in irrigated agriculture. Irrigation and Drainage Systems 24(1-2): 1-3 (special issue with contributions by IWMI authors).www.springerlink.com/content/u0377506v1282585/ulltext.pd
Celebrating 25 Years of Research — Selec ted Diag rams and Maps
7/31/2019 WF Special Issue-2010
http://slidepdf.com/reader/full/wf-special-issue-2010 27/28
WATER FIGURES | Special Issue | 2010 | 27INTERNATIONAL WATER MANAGEMENT INSTITUTE
Celebrating 25 Years of Research — Selec ted Diagrams and Maps
International Water Management Institute (IWMI). 2010. Water Figures: Newsletter o the International Water Management
Institute (IWMI). Special Issue. 28p. doi:10.5337 / 2010.236
Copyright ©2010, by International Water Management Institute (IWMI). All rights reserved. IWMI encourages the use o itsmaterial provided that the organization is acknowledged and kept inormed in all such instances.

7/31/2019 WF Special Issue-2010
http://slidepdf.com/reader/full/wf-special-issue-2010 28/28
I W M I
H e a d q u a r t e r s
127 Sunil Mawatha
Pelawatte, BattaramullaColombo, Sri Lanka
Mailing Address:
P. O. Box 2075, Colombo, Sri Lanka
Telephone: +94 11 2880000, 2784080
Fax: +94 11 2786854
E-mail: [email protected]
Website: www.iwmi.org
I W M I O i c e s
S o u t h A s i a
IWMI Regional Ofce or South Asia
IWMI Hyderabad Ofce, India
C/o ICRISAT, Building #401/5,
Patancheru 502 324,
Andhra Pradesh, India
Telephone: +91 40 30713071/
30 713036/30 713039
Fax: +91 40 30713074/5
E-mail: [email protected]
IWMI New Delhi Ofce, India
2nd Floor, Ofce Block B
NASC Complex
DPS Marg, Pusa,
New Delhi 110 012, India
Telephone: +91 11 25840811/2, 65976151
Fax: +91 11 25842075
E-mail: [email protected]
IWMI Lahore Ofce, Pakistan
12KM Multan Road, Chowk
Thokar Niaz Baig,
Lahore 53700, Pakistan
Telephone: +92 42 35410050 -53
Fax: +92 42 35410054
E-mail: [email protected]
S o u t h e a s t & C e n t r a l A s i a
IWMI Regional Ofce or Southeast Asia
IWMI Vientiane Ofce, Lao PDRC/o National Agriculture and
Forestry Research Institute (NAFRI)
Ministry o Agriculture and Forestry
P.O. Box: 4199, Ban Nongviengkham,
Xaythany District,
Vientiane, Lao PDR
Telephone: 856 21 771438
Telephone/Fax: +856 21 770076
Email: [email protected]
IWMI Regional Ofce or Central Asia
IWMI Tashkent Ofce, Uzbekistan
Apartment No. 123, BuildingNo. 6 Osiyo Street
Tashkent 100000, Uzbekistan
Telephone: +998 71 2370445/2372173Fax: +998 71 2370317
E-mail: [email protected]
A f r i c a
IWMI Regional Ofce or Arica
IWMI Accra Ofce, Ghana
C/o CSIR Campus
Martin Odei Block,Airport Res. Area
Accra , Ghana
Mailing Address:
IWMI GhanaPMB CT 112, Cantonments
Accra, Ghana Telephone: (+233) 30 2 784752/3/4Fax: (+233) 30 2 784752
E-mail: [email protected]
IWMI East Arica & Nile Basin Ofce
IWMI Addis Ababa Ofce, Ethiopia
C/o ILRI-Ethiopia Campus,Wereda 17
Kebele 21Addis Ababa, Ethiopia
Mailing Address:
P. O. Box 5689
Addis Ababa , Ethiopia
Telephone: +251 11 6457222/3 or6172000 (Ext 2200 or 2190)
Fax: +251 11 6172001E-mail: [email protected]
IWMI Southern Arica Ofce
IWMI Pretoria Ofce, South Arica
Private Bag X813 Silverton 0127
Pretoria, South Arica
Mailing Address:
141 Cresswell StreetWeavind Park 0184
Pretoria, South Arica Telephone: +27 87 1511364
Fax: +27 12 80406397
E-mail: [email protected]
I W M IS a t e l l i t e O i c e s
IWMI Kathmandu Ofce, Nepal
C/o. Department o IrrigationRoom # 153 & 154
Jawalakhel, LalitpurGPO 8975 EPC 416
Kathmandu, Nepal Telephone: +977 1 5542306
Fax: +977 1 5535743
Email: [email protected]
IWMI Hanoi Ofce, Vietnam
C/o Soil and Fertilizer Institute (SFI)Vietnam Academy orAgricultural Science (VAAS)Dong Ngac, Tu Liem District
Hanoi, Vietnam Telephone: +84 4 37543257Fax: +84 4 38389924E-mail: [email protected]
IWMI Kumasi Ofce, Ghana
C/o Kwame Nkrumah University o Science and Technology (KNUST)KNUST Post BoxKumasi, Ghana Telephone: +233 3220 60206
IWMI Ouagadougou Ofce, Burkina Faso
IWMI, s/c CILSS, 03 BP 7049,Ouagadougou 03, Burkina Faso
Telephone: + 226 50 374132Fax: +226 50 374132E-mail: [email protected]
I W M IR e p r e s e n t a t i v e sl o c a t e d a t :
Aleppo, Syria
C/o International Center orAgricultural Research inthe Dry Areas (ICARDA)P.O. Box 5466Aleppo, Syria Telephone: +963 21 2213433
Fax: +963 21 2213490E-mail: [email protected]
Anand, India
INREMBeside Smruti ApartmentsBehind IRMA, MangalpuraAnand 388 001, India Telephone/Fax: +91 2692 263817E-mail: [email protected]
Washington, DC, USA
USAID, EGAT/NRM/WRRB, Rm. 3.81300 Pennsylvania Avenue NWWashington, DC 20523-3800, USA
Telephone: +1703909 5395E-mail: [email protected]
Maputo, Mozambique
MozSAKSS, Ministério da AgriculturaEscritorios: IIAM, Avenida das FPLMMavalaneMailing Address:
P.O. Box 2698Maputo Cidade,Maputo, MozambiqueE-mail: [email protected]
IWMI Contact Inormation