Embed Size (px)
Citation preview
Wetlands influencing river
biogeochemistry: the case study of the
Zambezi and the Kafue Rivers
AFRIVAL Project (African River Basins)
http://ees.kuleuven.be/project/afrival/
EGU General Assembly 2014, Vienna
Cristian R. Teodoru1, Frank C. Nyoni2, Imasiku Nyambe2, Alberto V. Borges3, and
Steven Bouillon1
1 K.U. Leuven, Belgium; 2 University of Zambia, IWRM Center, Zambia, 3 University of Liege, Belgium
2nd International Conference “Water Resources and Wetlands”
Tulcea, 11-13 Sept, 2014
Introduction: AFRIVAL project (2009-2014)
AFRIVAL – ‘African river basin: catchment scale carbon fluxes and
transformation” (http://ees.kuleuven.be/project/afrival/)
� joint European Research Council Starting Grant project hosted at the Department
of Earth & Environmental Sciences (K.U. Leuven, Belgium) and the Chemical
Oceanography Unit (Université de Liège, Belgium)
� 5-year funding to explore the role of African rivers in carbon cycling
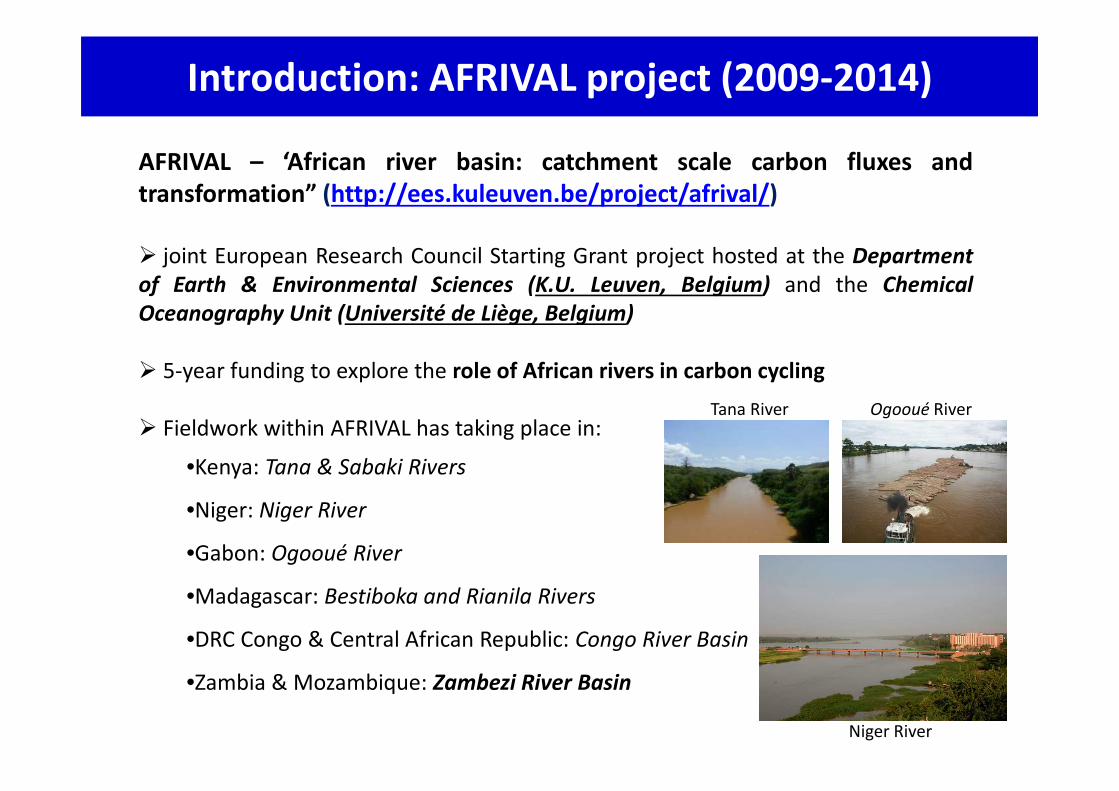
� Fieldwork within AFRIVAL has taking place in:
•Kenya: Tana & Sabaki Rivers
•Niger: Niger River
•Gabon: Ogooué River
•Madagascar: Bestiboka and Rianila Rivers
•DRC Congo & Central African Republic: Congo River Basin
•Zambia & Mozambique: Zambezi River Basin
Tana River Ogooué River
Niger River
Study site: the Zambezi River
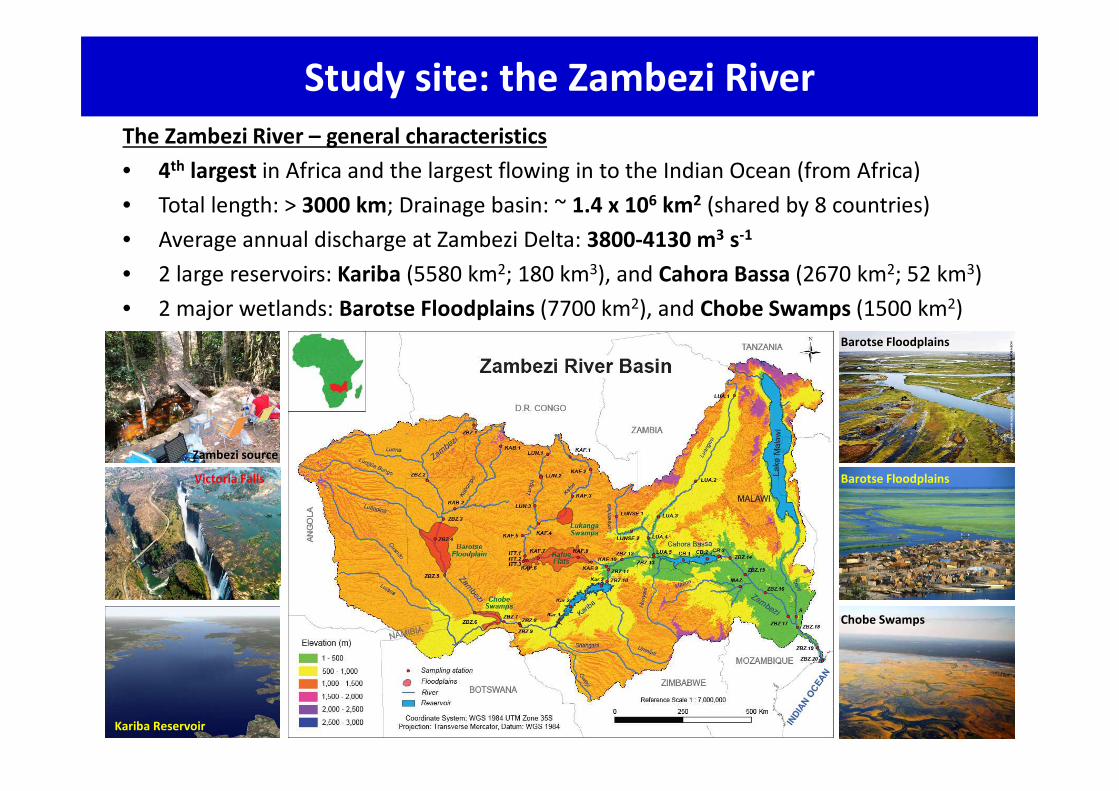
The Zambezi River – general characteristics
• 4th largest in Africa and the largest flowing in to the Indian Ocean (from Africa)
• Total length: > 3000 km; Drainage basin: ~ 1.4 x 10⁶ km2 (shared by 8 countries)
• Average annual discharge at Zambezi Delta: 3800-4130 m3 s-1
• 2 large reservoirs: Kariba (5580 km2; 180 km3), and Cahora Bassa (2670 km2; 52 km3)
• 2 major wetlands: Barotse Floodplains (7700 km2), and Chobe Swamps (1500 km2)
Kariba Reservoir
Victoria Falls
Zambezi source
Barotse Floodplains
Chobe Swamps
Barotse Floodplains
Study site: the Kafue River
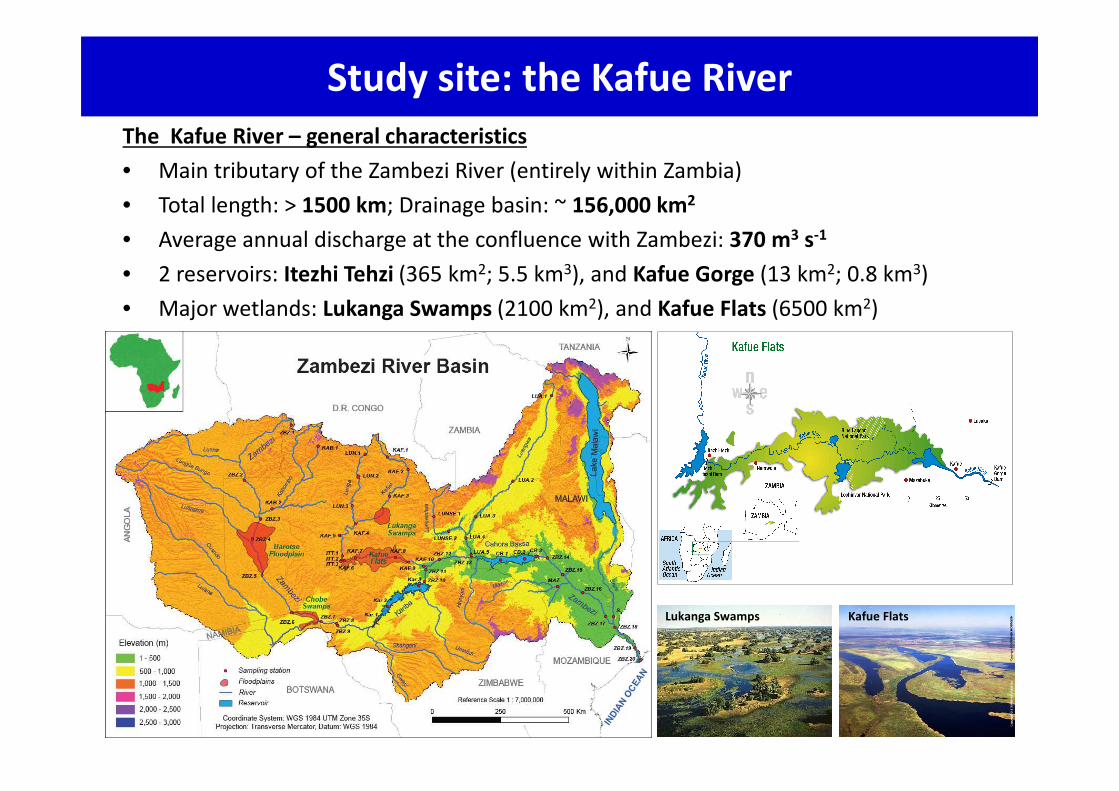
The Kafue River – general characteristics
• Main tributary of the Zambezi River (entirely within Zambia)
• Total length: > 1500 km; Drainage basin: ~ 156,000 km2
• Average annual discharge at the confluence with Zambezi: 370 m3 s-1
• 2 reservoirs: Itezhi Tehzi (365 km2; 5.5 km3), and Kafue Gorge (13 km2; 0.8 km3)
• Major wetlands: Lukanga Swamps (2100 km2), and Kafue Flats (6500 km2)
Lukanga Swamps Kafue Flats
General characteristics: Climate & Rainfall
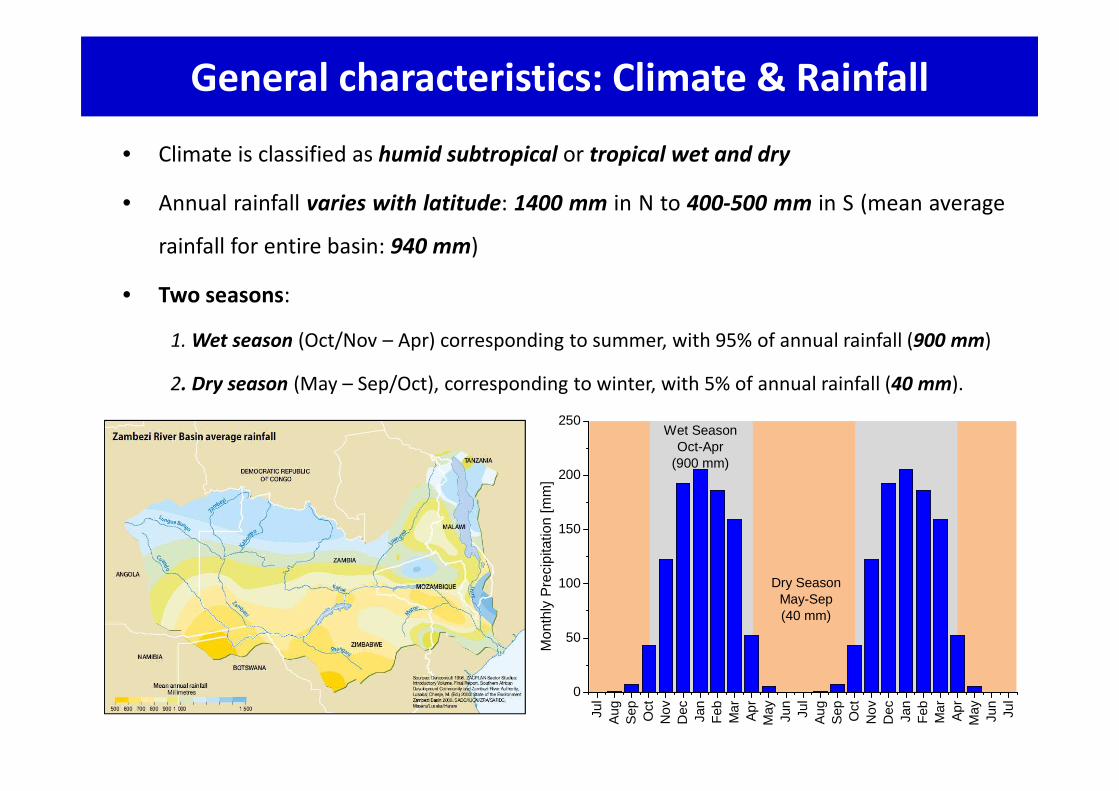
• Climate is classified as humid subtropical or tropical wet and dry
• Annual rainfall varies with latitude: 1400 mm in N to 400-500 mm in S (mean average
rainfall for entire basin: 940 mm)
• Two seasons:
1. Wet season (Oct/Nov – Apr) corresponding to summer, with 95% of annual rainfall (900 mm)
2. Dry season (May – Sep/Oct), corresponding to winter, with 5% of annual rainfall (40 mm).
Jul
Aug
Sep Oct
Nov
Dec Jan
Feb
Mar
Apr
May Jun
Jul
Aug
Sep Oct
Nov
Dec Jan
Feb
Mar
Apr
May Jun
Jul0
50
100
150
200
250
Dry SeasonMay-Sep(40 mm)
Mon
thly
Pre
cipi
tatio
n [m
m]
Wet SeasonOct-Apr
(900 mm)
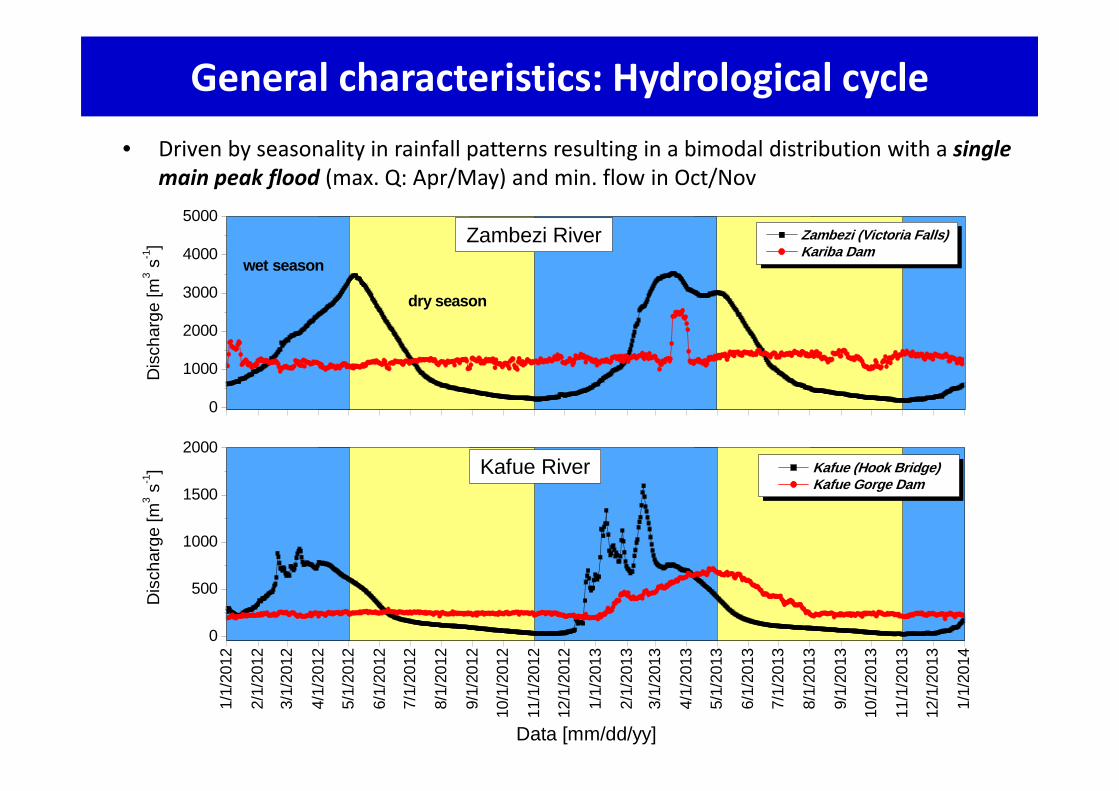
General characteristics: Hydrological cycle
• Driven by seasonality in rainfall patterns resulting in a bimodal distribution with a single
main peak flood (max. Q: Apr/May) and min. flow in Oct/Nov
1/1/
2012
2/1/
2012
3/1/
2012
4/1/
2012
5/1/
2012
6/1/
2012
7/1/
2012
8/1/
2012
9/1/
2012
10/1
/201
2
11/1
/201
2
12/1
/201
2
1/1/
2013
2/1/
2013
3/1/
2013
4/1/
2013
5/1/
2013
6/1/
2013
7/1/
2013
8/1/
2013
9/1/
2013
10/1
/201
3
11/1
/201
3
12/1
/201
3
1/1/
2014
0
500
1000
1500
2000
dry season
Kafue (Hook Bridge) Kafue Gorge Dam
Dis
char
ge [m
3 s-1]
Data [mm/dd/yy]
Zambezi River
Kafue River
wet season
0
1000
2000
3000
4000
5000 Zambezi (Victoria Falls) Kariba Dam
Dis
char
ge [m
3 s-1]
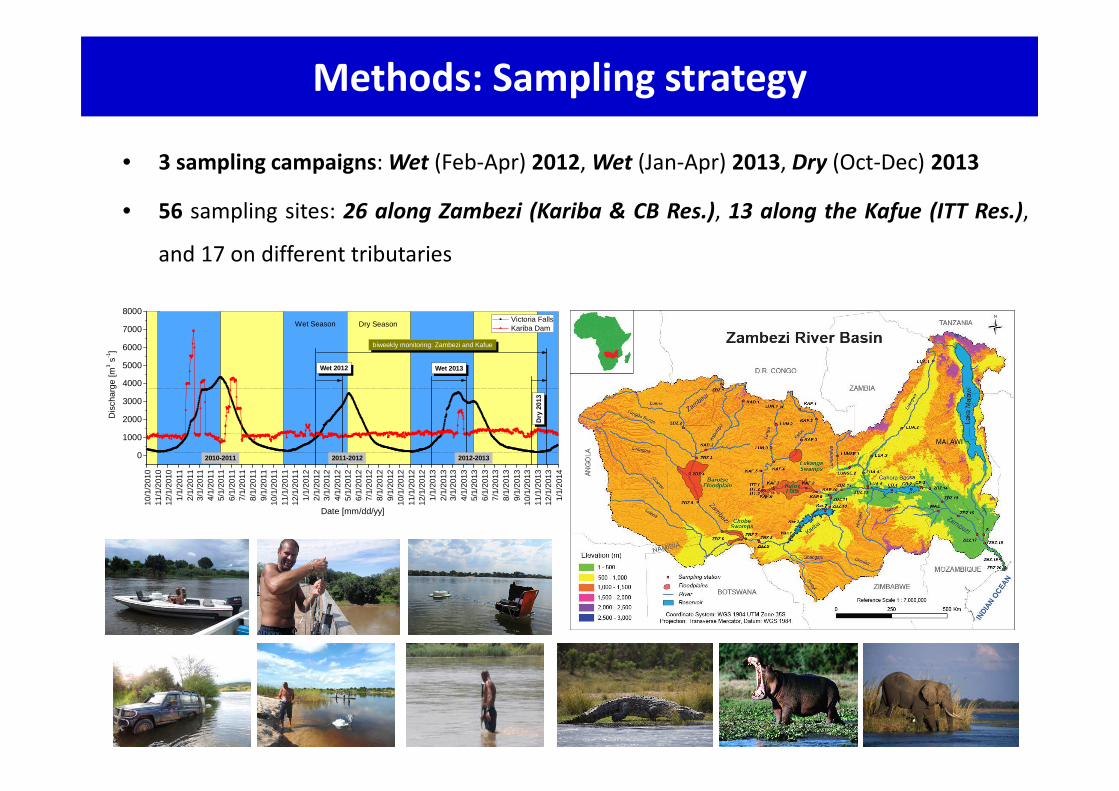
Methods: Sampling strategy
• 3 sampling campaigns: Wet (Feb-Apr) 2012, Wet (Jan-Apr) 2013, Dry (Oct-Dec) 2013
• 56 sampling sites: 26 along Zambezi (Kariba & CB Res.), 13 along the Kafue (ITT Res.),
and 17 on different tributaries
10/1
/201
011
/1/2
010
12/1
/201
01/
1/20
112/
1/20
113/
1/20
114/
1/20
115/
1/20
116/
1/20
117/
1/20
118/
1/20
119/
1/20
1110
/1/2
011
11/1
/201
112
/1/2
011
1/1/
2012
2/1/
2012
3/1/
2012
4/1/
2012
5/1/
2012
6/1/
2012
7/1/
2012
8/1/
2012
9/1/
2012
10/1
/201
211
/1/2
012
12/1
/201
21/
1/20
132/
1/20
133/
1/20
134/
1/20
135/
1/20
136/
1/20
137/
1/20
138/
1/20
139/
1/20
1310
/1/2
013
11/1
/201
312
/1/2
013
1/1/
2014
0
1000
2000
3000
4000
5000
6000
7000
8000
2010-2011
Wet Season
Dis
char
ge [m
3 s-1]
Date [mm/dd/yy]
Victoria Falls Kariba DamDry Season
biweekly monitoring: Zambezi and Kafue
Wet 2012
Dry
201
3
2011-2012 2012-2013
Wet 2013
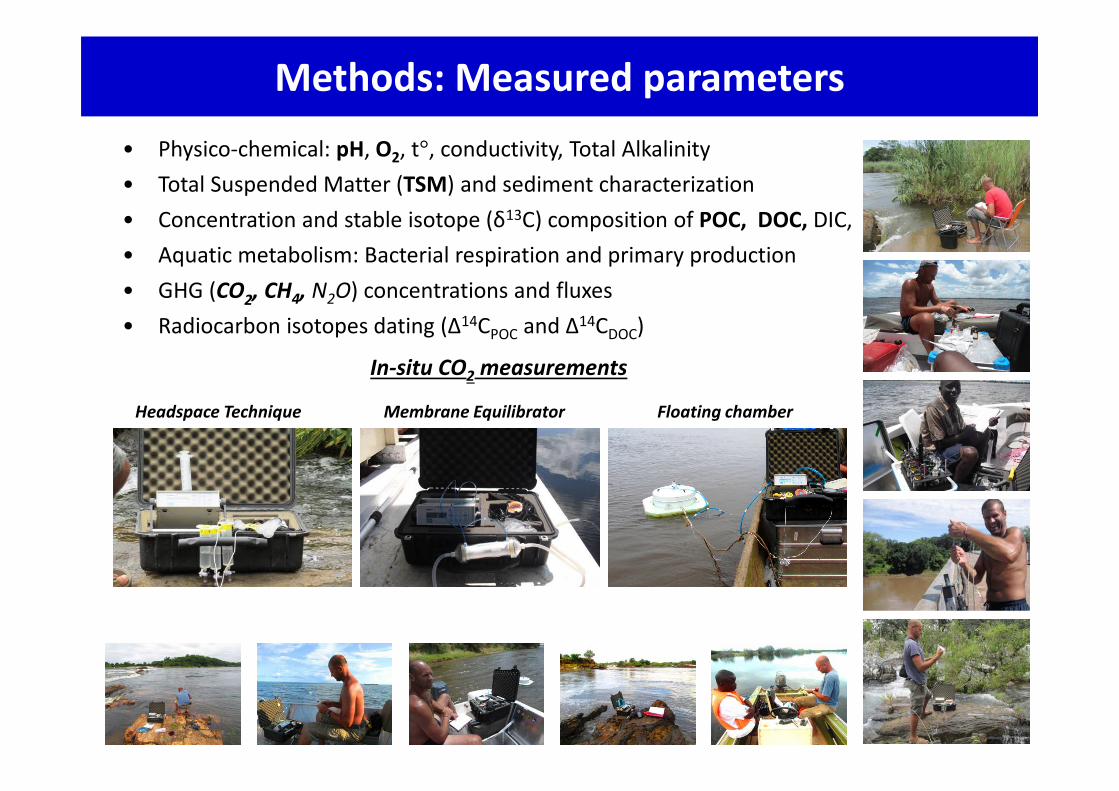
Methods: Measured parameters
• Physico-chemical: pH, O2, t°, conductivity, Total Alkalinity
• Total Suspended Matter (TSM) and sediment characterization
• Concentration and stable isotope (δ13C) composition of POC, DOC, DIC,
• Aquatic metabolism: Bacterial respiration and primary production
• GHG (CO2, CH4, N2O) concentrations and fluxes
• Radiocarbon isotopes dating (Δ14CPOC and Δ14CDOC)
Headspace Technique Membrane Equilibrator
In-situ CO2 measurements
Floating chamber
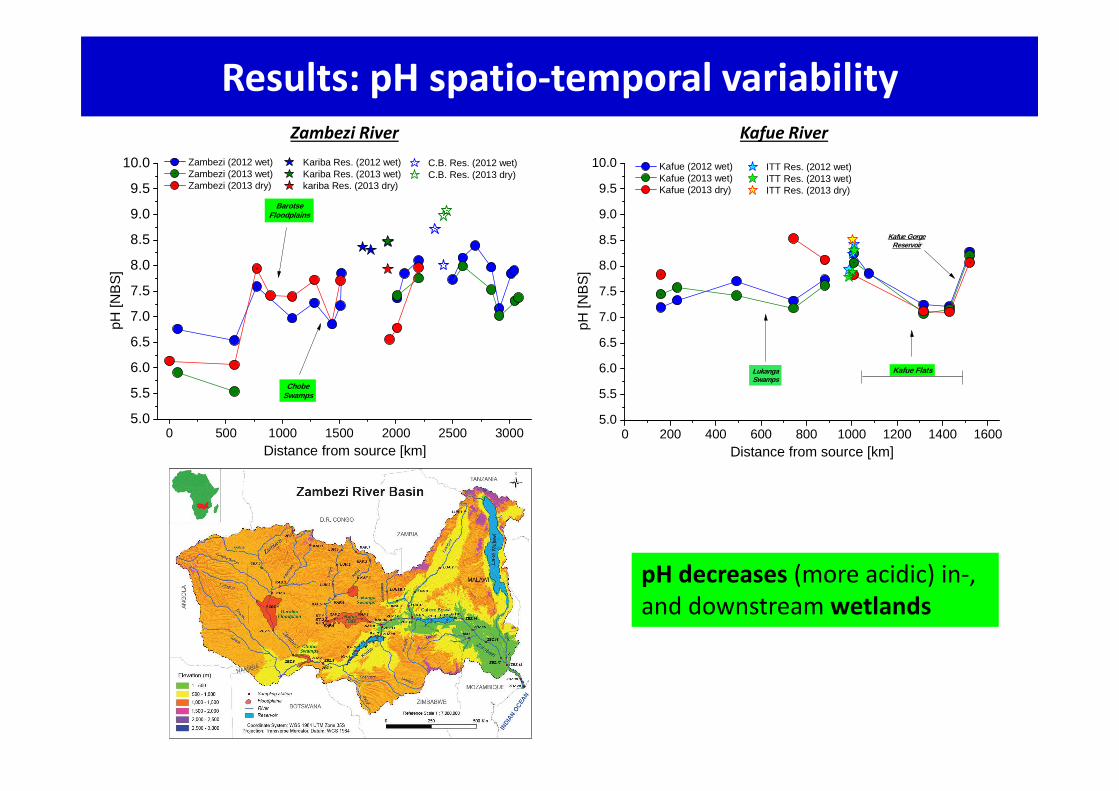
Results: pH spatio-temporal variability
0 500 1000 1500 2000 2500 30005.0
5.5
6.0
6.5
7.0
7.5
8.0
8.5
9.0
9.5
10.0 C.B. Res. (2012 wet) C.B. Res. (2013 dry)
Kariba Res. (2012 wet) Kariba Res. (2013 wet) kariba Res. (2013 dry)
pH [N
BS
]
Distance from source [km]
Zambezi (2012 wet) Zambezi (2013 wet) Zambezi (2013 dry)
BarotseFloodplains
ChobeSwamps
0 200 400 600 800 1000 1200 1400 16005.0
5.5
6.0
6.5
7.0
7.5
8.0
8.5
9.0
9.5
10.0
Kafue GorgeReservoir
ITT Res. (2012 wet) ITT Res. (2013 wet) ITT Res. (2013 dry)
LukangaSwamps
pH [N
BS
]
Distance from source [km]
Kafue (2012 wet) Kafue (2013 wet) Kafue (2013 dry)
Kafue Flats
Zambezi River Kafue River
pH decreases (more acidic) in-,
and downstream wetlands
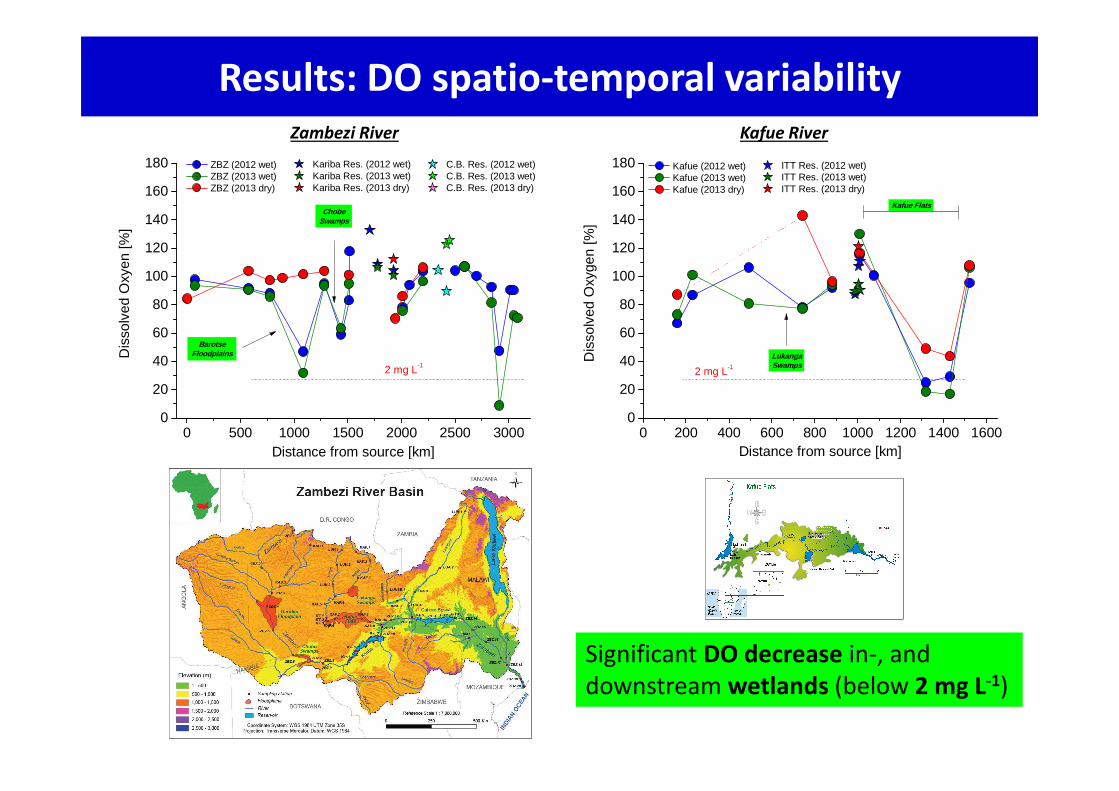
Results: DO spatio-temporal variabilityZambezi River Kafue River
Significant DO decrease in-, and
downstream wetlands (below 2 mg L-1)
0 500 1000 1500 2000 2500 30000
20
40
60
80
100
120
140
160
180 Kariba Res. (2012 wet) Kariba Res. (2013 wet) Kariba Res. (2013 dry)
C.B. Res. (2012 wet) C.B. Res. (2013 wet) C.B. Res. (2013 dry)
Dis
solv
ed O
xyen
[%]
Distance from source [km]
ZBZ (2012 wet) ZBZ (2013 wet) ZBZ (2013 dry)
BarotseFloodplains
ChobeSwamps
2 mg L-1
0 200 400 600 800 1000 1200 1400 16000
20
40
60
80
100
120
140
160
180 ITT Res. (2012 wet) ITT Res. (2013 wet) ITT Res. (2013 dry)
Dis
solv
ed O
xyge
n [%
]
Distance from source [km]
Kafue (2012 wet) Kafue (2013 wet) Kafue (2013 dry)
Kafue Flats
LukangaSwamps
2 mg L-1
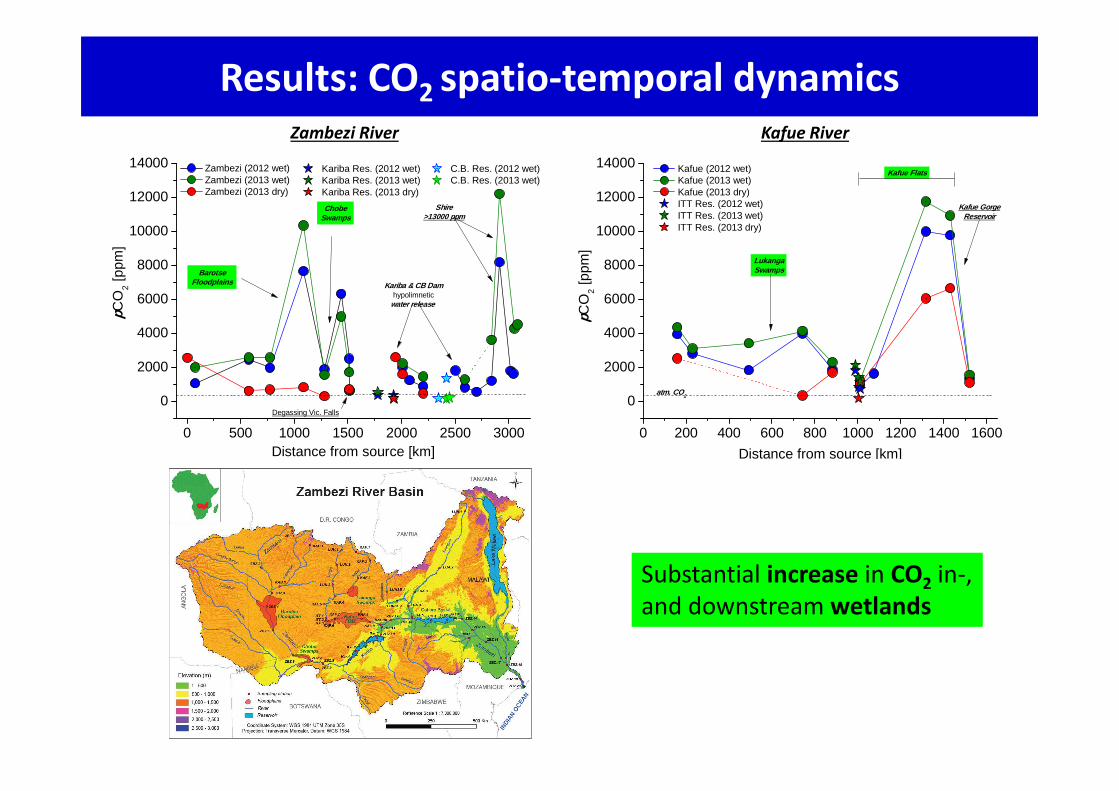
Results: CO2 spatio-temporal dynamics
0 500 1000 1500 2000 2500 3000
0
2000
4000
6000
8000
10000
12000
14000 C.B. Res. (2012 wet) C.B. Res. (2013 wet)
Kariba Res. (2012 wet) Kariba Res. (2013 wet) Kariba Res. (2013 dry)
pCO
2 [ppm
]
Distance from source [km]
Zambezi (2012 wet) Zambezi (2013 wet) Zambezi (2013 dry)
BarotseFloodplains
ChobeSwamps
Kariba & CB Damhypolimnetic
water release
Shire>13000 ppm
Degassing Vic. Falls
0 200 400 600 800 1000 1200 1400 1600
0
2000
4000
6000
8000
10000
12000
14000
LukangaSwamps
atm. CO2
pCO
2 [p
pm]
Distance from source [km]
Kafue (2012 wet) Kafue (2013 wet) Kafue (2013 dry) ITT Res. (2012 wet) ITT Res. (2013 wet) ITT Res. (2013 dry)
Kafue Flats
Kafue GorgeReservoir
Zambezi River Kafue River
Substantial increase in CO2 in-,
and downstream wetlands
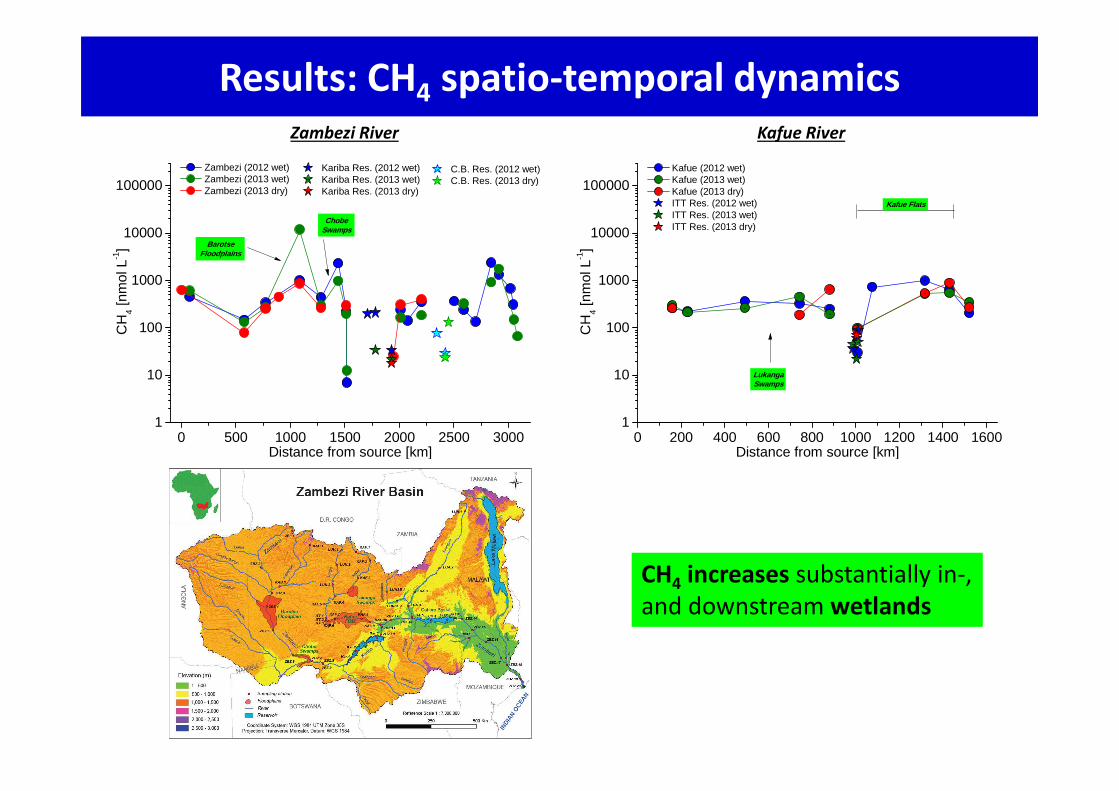
Results: CH4 spatio-temporal dynamics
0 500 1000 1500 2000 2500 30001
10
100
1000
10000
100000 C.B. Res. (2012 wet) C.B. Res. (2013 dry)
Kariba Res. (2012 wet) Kariba Res. (2013 wet) Kariba Res. (2013 dry)
Zambezi (2012 wet) Zambezi (2013 wet) Zambezi (2013 dry)
CH
4 [n
mol
L-1]
Distance from source [km]
BarotseFloodplains
ChobeSwamps
0 200 400 600 800 1000 1200 1400 16001
10
100
1000
10000
100000
CH
4 [n
mol
L-1]
Distance from source [km]
Kafue (2012 wet) Kafue (2013 wet) Kafue (2013 dry) ITT Res. (2012 wet) ITT Res. (2013 wet) ITT Res. (2013 dry)
LukangaSwamps
Kafue Flats
Zambezi River Kafue River
CH4 increases substantially in-,
and downstream wetlands
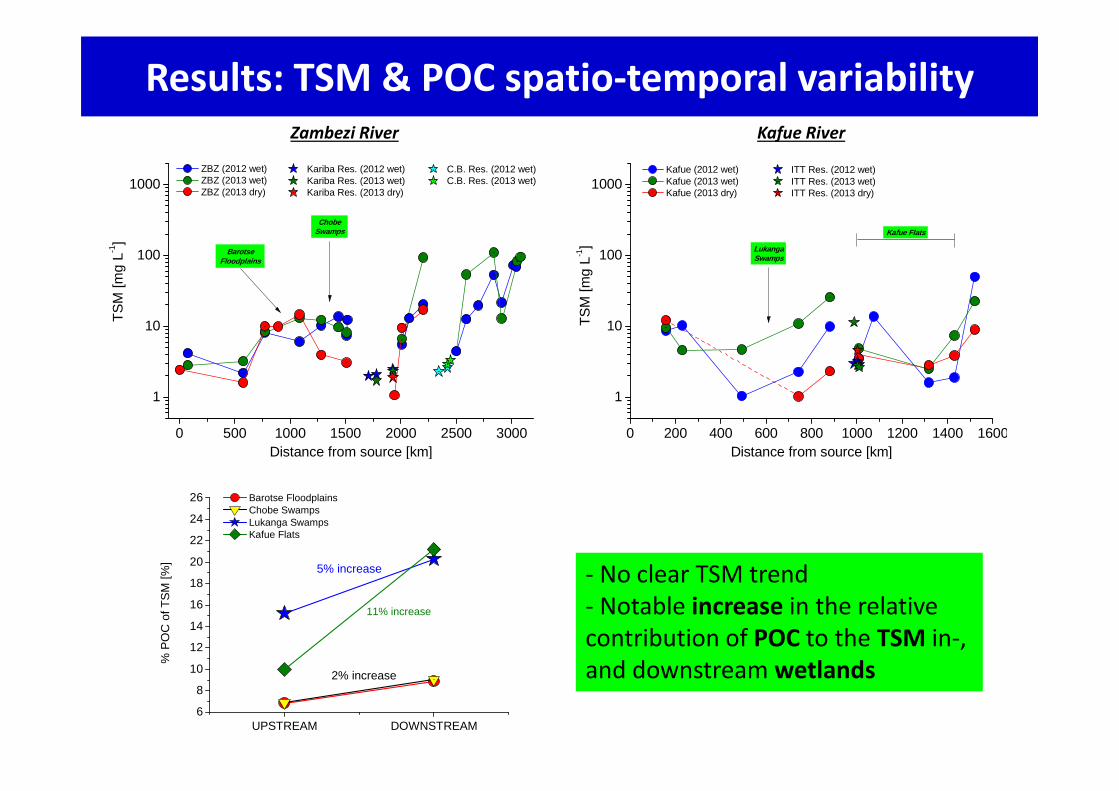
Results: TSM & POC spatio-temporal variability
0 200 400 600 800 1000 1200 1400 1600
1
10
100
1000 ITT Res. (2012 wet) ITT Res. (2013 wet) ITT Res. (2013 dry)
TS
M [m
g L-1
]
Distance from source [km]
Kafue (2012 wet) Kafue (2013 wet) Kafue (2013 dry)
Kafue Flats
LukangaSwamps
0 500 1000 1500 2000 2500 3000
1
10
100
1000 C.B. Res. (2012 wet) C.B. Res. (2013 wet)
Kariba Res. (2012 wet) Kariba Res. (2013 wet) Kariba Res. (2013 dry)
ZBZ (2012 wet) ZBZ (2013 wet) ZBZ (2013 dry)
TS
M [m
g L-1
]
Distance from source [km]
BarotseFloodplains
ChobeSwamps
Zambezi River Kafue River
UPSTREAM DOWNSTREAM6
8
10
12
14
16
18
20
22
24
26
% P
OC
of T
SM
[%]
Barotse Floodplains Chobe Swamps Lukanga Swamps Kafue Flats
2% increase
5% increase
11% increase
- No clear TSM trend
- Notable increase in the relative
contribution of POC to the TSM in-,
and downstream wetlands
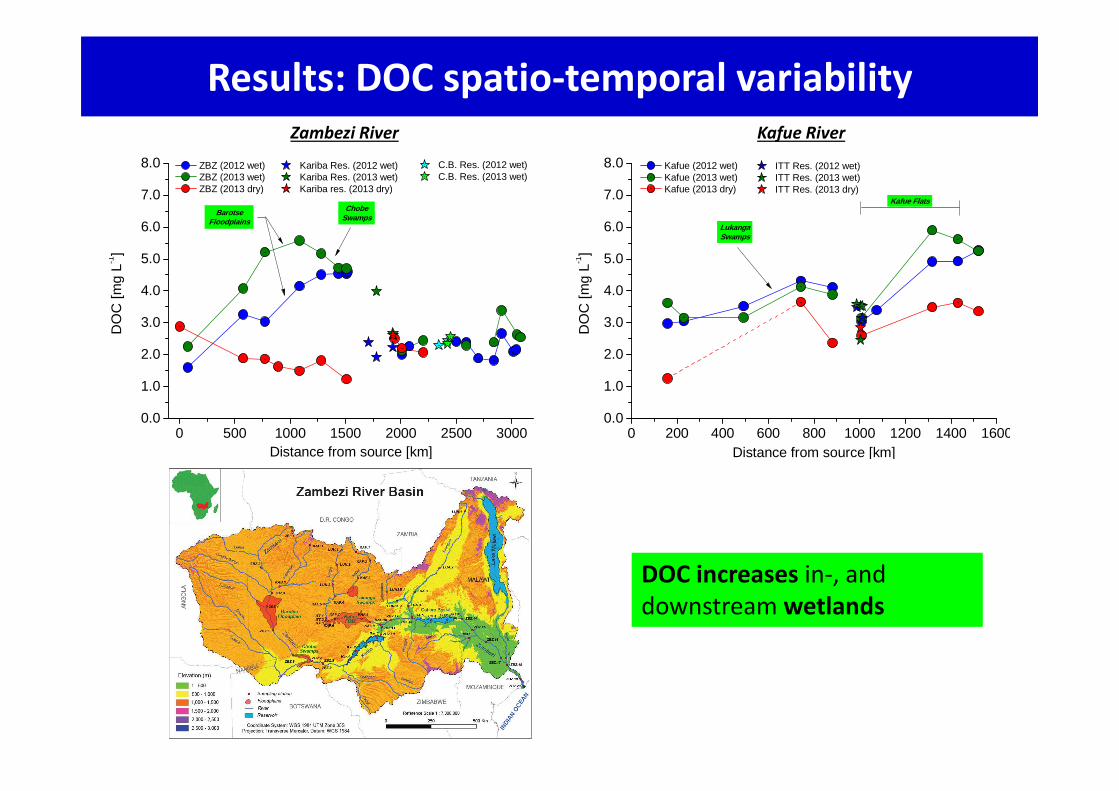
Results: DOC spatio-temporal variability
0 500 1000 1500 2000 2500 30000.0
1.0
2.0
3.0
4.0
5.0
6.0
7.0
8.0 C.B. Res. (2012 wet) C.B. Res. (2013 wet)
Kariba Res. (2012 wet) Kariba Res. (2013 wet) Kariba res. (2013 dry)
ZBZ (2012 wet) ZBZ (2013 wet) ZBZ (2013 dry)
DO
C [m
g L-1
]
Distance from source [km]
BarotseFloodplains
ChobeSwamps
Zambezi River Kafue River
DOC increases in-, and
downstream wetlands
0 200 400 600 800 1000 1200 1400 16000.0
1.0
2.0
3.0
4.0
5.0
6.0
7.0
8.0
LukangaSwamps
ITT Res. (2012 wet) ITT Res. (2013 wet) ITT Res. (2013 dry)
DO
C [m
g L-1
]
Distance from source [km]
Kafue (2012 wet) Kafue (2013 wet) Kafue (2013 dry)
Kafue Flats
River / Reservoir Area CO2 flux CH4 flux CO2 load CH4 load Emission Deposition
[km2] [mg C m-2 d-1] [kt C yr-1]Kafue River without reservoirs 287 2962 20.0 310 2.1 312 -
Itezhi Tezhi Reservoir 364 1102 18.1 146 2.4 149 16Kafue Gorge Reservoir 13 956 17.4 5 0.1 5 1**
Kafue River with reservoirs 664 1903* 18.9* 461 4.6 466 17
Zambezi River without reservoirs 1879 4291 45.0 2943 30.8 2974 -Kariba Reservoir 5364 -191 4.8 -374 9.3 -364 120
Cahora Bassa Reservoir 2670 -356 1.4 -347 1.4 -346 60**
Zambezi River with reservoirs 9913 614* 11.5* 2222 41.5 2264 180
Zambezi & Kafue Rivers with reservoirs 10576 695* 12.0* 2683 46.1 2729 196
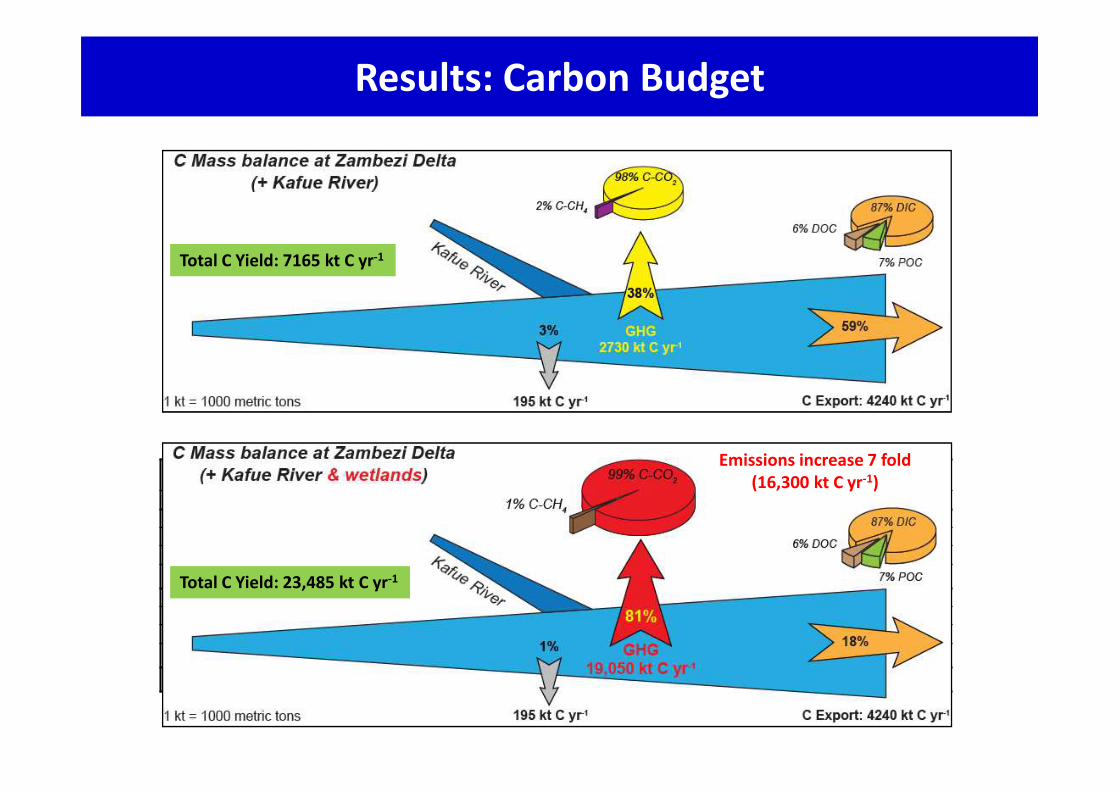
Results: Carbon Budget
Total C Yield: 7165 kt C yr-1
Total C Yield: 23,485 kt C yr-1
Emissions increase 7 fold
(16,300 kt C yr-1)
Concluding remarks
� Wetlands/floodplains have large influence on river biogeochemisty:
� Decreasing the pH and Dissolved Oxygen concentrations
� Increasing the Temperature and Evaporation
� Increasing CO2 and CH4, DOC and POC concentrations
� Highly productive ecosystems, wetlands are essential elements of carbon
cycle, capable of shifting significantly the balance between Emissions,
Storage and Transport components of carbon budgets.
� Further research (more quantitative data) are needed to better constrain
the role of wetlands in both regional and global C budgets, which so far has
been largely overlooked.
Thank you for your attention!
“Pirates of the Zambezi”
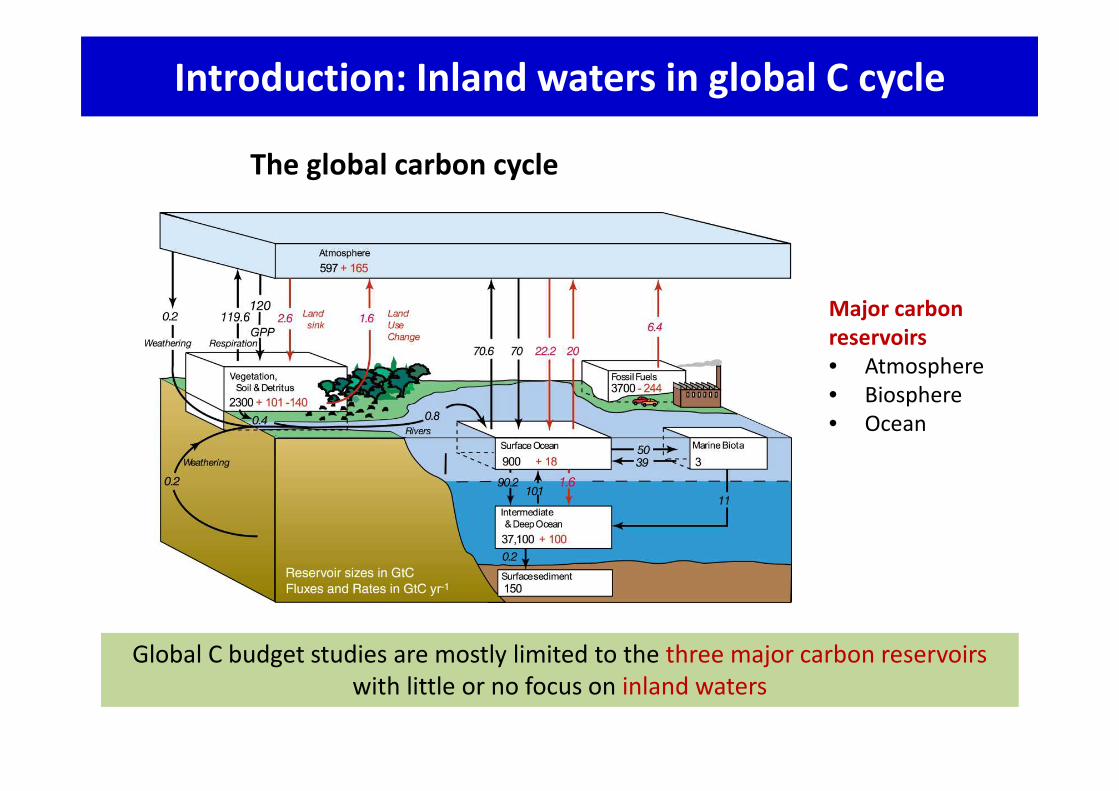
The global carbon cycle
Global C budget studies are mostly limited to the three major carbon reservoirs
with little or no focus on inland waters
Major carbon
reservoirs
• Atmosphere
• Biosphere
• Ocean
Introduction: Inland waters in global C cycle
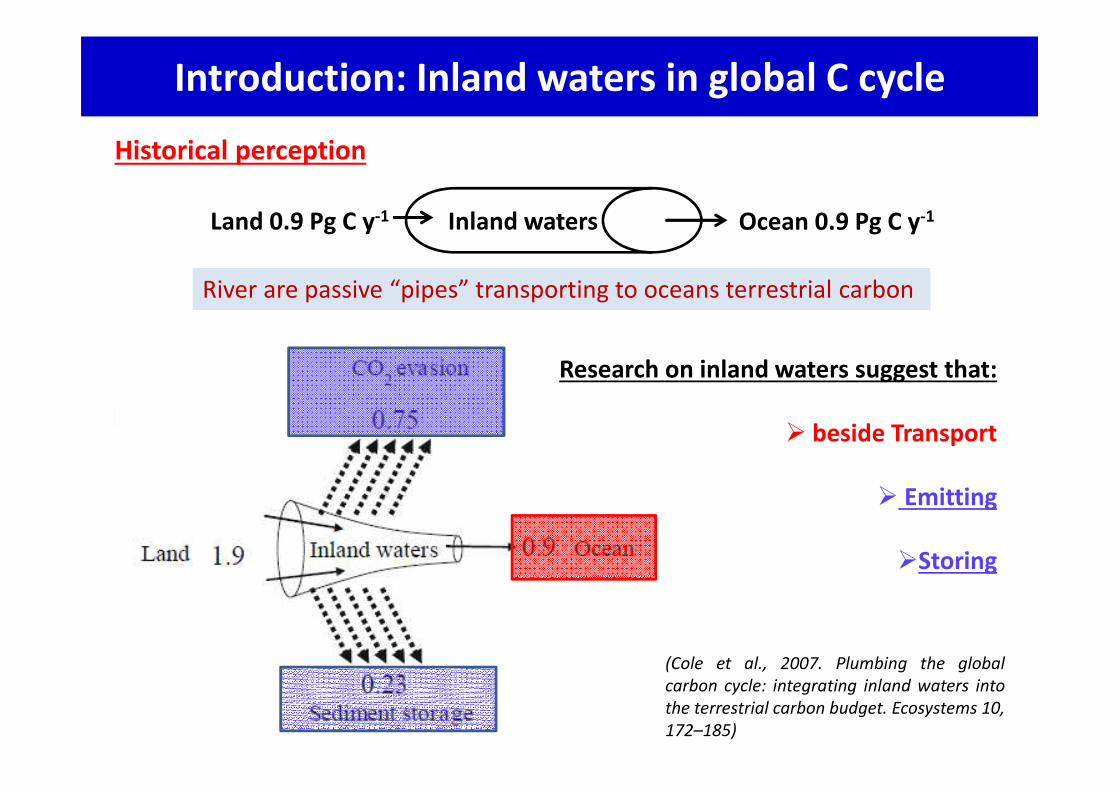
Historical perception
Land 0.9 Pg C y-1 Ocean 0.9 Pg C y-1Inland waters
River are passive “pipes” transporting to oceans terrestrial carbon
(Cole et al., 2007. Plumbing the global
carbon cycle: integrating inland waters into
the terrestrial carbon budget. Ecosystems 10,
172–185)
Introduction: Inland waters in global C cycle
Research on inland waters suggest that:
� beside Transport
� Emitting
�Storing
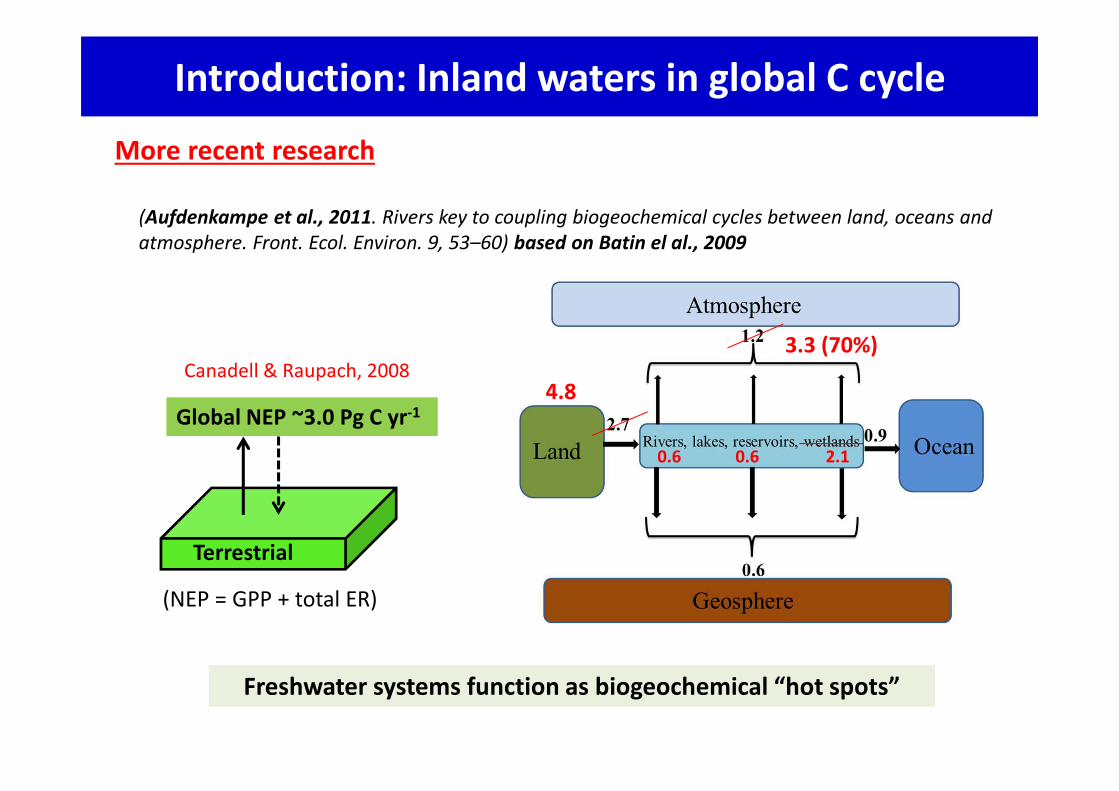
Canadell & Raupach, 2008
Global NEP ~3.0 Pg C yr-1
Terrestrial
Freshwater systems function as biogeochemical “hot spots”
(Aufdenkampe et al., 2011. Rivers key to coupling biogeochemical cycles between land, oceans and
atmosphere. Front. Ecol. Environ. 9, 53–60) based on Batin el al., 2009
3.3 (70%)
4.8
0.6 0.6 2.1
Introduction: Inland waters in global C cycle
More recent research
(NEP = GPP + total ER)
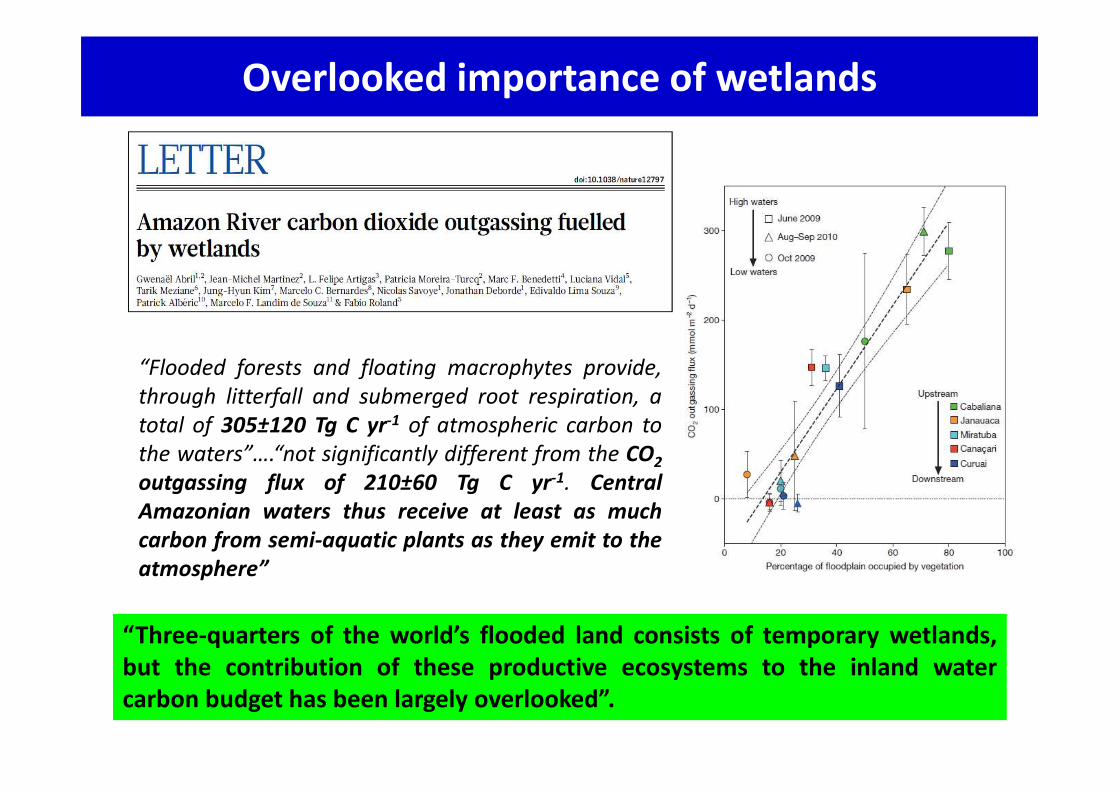
Overlooked importance of wetlands
“Three-quarters of the world’s flooded land consists of temporary wetlands,
but the contribution of these productive ecosystems to the inland water
carbon budget has been largely overlooked”.
“Flooded forests and floating macrophytes provide,
through litterfall and submerged root respiration, a
total of 305±120 Tg C yr-1 of atmospheric carbon to
the waters”….“not significantly different from the CO2
outgassing flux of 210±60 Tg C yr-1. Central
Amazonian waters thus receive at least as much
carbon from semi-aquatic plants as they emit to the
atmosphere”


![Microbial mediated arsenic biotransformation in wetlands · 4 wetlands, it is micro-scale biogeochemistry, which includes desorption, dissolution 5 [14] Vand microbial mediated As](https://img.pdfslide.us/doc/110x75/5ed59954f7202b0d823964ac/microbial-mediated-arsenic-biotransformation-in-wetlands-4-wetlands-it-is-micro-scale.jpg)