Embed Size (px)
Citation preview
WETLAND RESTORATION TECHNIQUES AND ASSOCIATED COSTS IN
SOUTHEASTERN NORTH DAKOTA
A Thesis
Submitted to the Graduate Faculty
of the
North Dakota State University
of Agriculture and Applied Science
By
Travis Gene Strehlow
In Partial Fulfillment of the Requirements
for the Degree of
MASTER OF SCIENCE
Major Program:
Natural Resources Management
April 2015
Fargo, North Dakota
North Dakota State University Graduate School
Title
Wetland Restoration Techniques and Associated Costs in Southeastern
North Dakota
By
Travis Gene Strehlow
The Supervisory Committee certifies that this disquisition complies with
North Dakota State University’s regulations and meets the accepted
standards for the degree of
MASTER OF SCIENCE
SUPERVISORY COMMITTEE:
Dr. Edward S. DeKeyser
Chair
Dr. Jack E. Norland
Dr. Gary K. Clambey
Dr. Christina L. Hargiss
Approved:
4/2/2015 Dr. Edward S. DeKeyser
Date Department Chair

iii
ABSTRACT
Degraded wetlands are a common occurrence throughout the Prairie Pothole Region of
the United States. Many restoration attempts have been conducted to restore these unique
ecosystems to their previous conditions. However, many restored wetlands fail to regain the
appearance and functions of natural wetlands. Two studies were completed in southeastern North
Dakota to determine if restoration of these areas is possible. Research objectives were to; (1)
determine if one year of glyphosate application is enough to impact a soil seedbank of a
previously cultivated wetland, and (2) estimate costs of three different vegetation restoration
methods to better understand cost/benefit ratios of restoration methods. Seedbank analysis
showed significant differences with one year of glyphosate application, and restoration costs
were determined for the different techniques. These results will be utilized to help aid restoration
efforts in the future to make them more time and cost effective.

iv
ACKNOWLEDGEMENTS
I would like to extend my deepest gratitude to the following people for their assistance
and encouragement during my time at NDSU:
My advisor, Dr. Edward Shawn DeKeyser for all the help and motivation he has given
me over the past 3 years. Without his help this project would not have been able to be completed
and I would not be able to be where I am today.
My graduate committee, including Jack Norland, Gary Clambey, and Christina Hargiss
for all the help and support along the way and the valuable insight I gained through completing
their coursework.
Carl Piper for assisting us with preparation of the restoration site and everything involved
with the use of your equipment for burning, spraying and planting.
Dennis Whitted, Lindsey Meyers, Austin Link, Jonathan Quast, Katherine Kral, and
David Renton for all of your assistance collecting and transplanting soil plugs and burning.
Dakota Suko for the countless hours spent in the greenhouse preparing seed bank trays
and pulling and counting seedlings.
The USDA NRCS Conservation Innovation Grant for the funding to make this research
possible.
Jay Volk and BNI Coal for donating the native seed needed to make this restoration
attempt possible.
My parents, Terry and Lena Strehlow for giving me the motivation I needed to complete
this thesis and helping me become the man I am today through all their love and support.
v
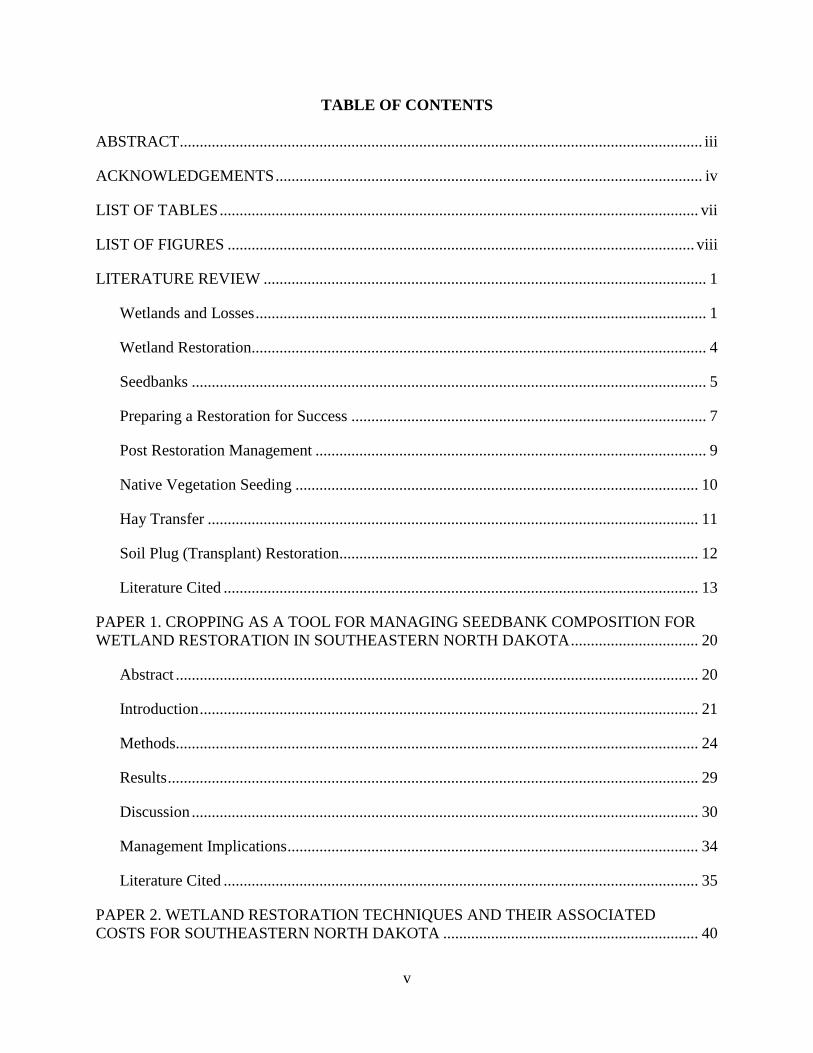
TABLE OF CONTENTS
ABSTRACT ................................................................................................................................... iii
ACKNOWLEDGEMENTS ........................................................................................................... iv
LIST OF TABLES ........................................................................................................................ vii
LIST OF FIGURES ..................................................................................................................... viii
LITERATURE REVIEW ............................................................................................................... 1
Wetlands and Losses ................................................................................................................. 1
Wetland Restoration.................................................................................................................. 4
Seedbanks ................................................................................................................................. 5
Preparing a Restoration for Success ......................................................................................... 7
Post Restoration Management .................................................................................................. 9
Native Vegetation Seeding ..................................................................................................... 10
Hay Transfer ........................................................................................................................... 11
Soil Plug (Transplant) Restoration.......................................................................................... 12
Literature Cited ....................................................................................................................... 13
PAPER 1. CROPPING AS A TOOL FOR MANAGING SEEDBANK COMPOSITION FOR
WETLAND RESTORATION IN SOUTHEASTERN NORTH DAKOTA ................................ 20
Abstract ................................................................................................................................... 20
Introduction ............................................................................................................................. 21
Methods................................................................................................................................... 24
Results ..................................................................................................................................... 29
Discussion ............................................................................................................................... 30
Management Implications ....................................................................................................... 34
Literature Cited ....................................................................................................................... 35
PAPER 2. WETLAND RESTORATION TECHNIQUES AND THEIR ASSOCIATED
COSTS FOR SOUTHEASTERN NORTH DAKOTA ................................................................ 40
vi
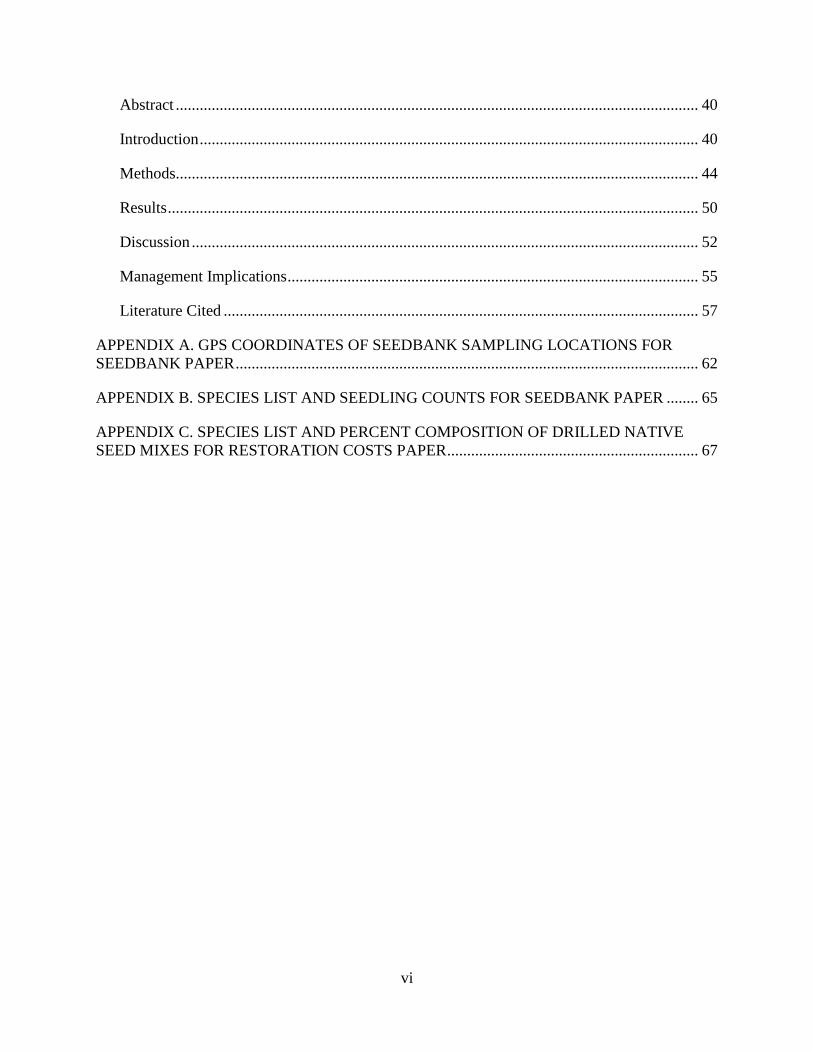
Abstract ................................................................................................................................... 40
Introduction ............................................................................................................................. 40
Methods................................................................................................................................... 44
Results ..................................................................................................................................... 50
Discussion ............................................................................................................................... 52
Management Implications ....................................................................................................... 55
Literature Cited ....................................................................................................................... 57
APPENDIX A. GPS COORDINATES OF SEEDBANK SAMPLING LOCATIONS FOR
SEEDBANK PAPER .................................................................................................................... 62
APPENDIX B. SPECIES LIST AND SEEDLING COUNTS FOR SEEDBANK PAPER ........ 65
APPENDIX C. SPECIES LIST AND PERCENT COMPOSITION OF DRILLED NATIVE
SEED MIXES FOR RESTORATION COSTS PAPER ............................................................... 67

vii
LIST OF TABLES
Table Page
1: Costs associated with the seeding, hay mulch, and soil transplant treatments applied to
the wetland restoration in southeastern North Dakota. ......................................................... 51
viii
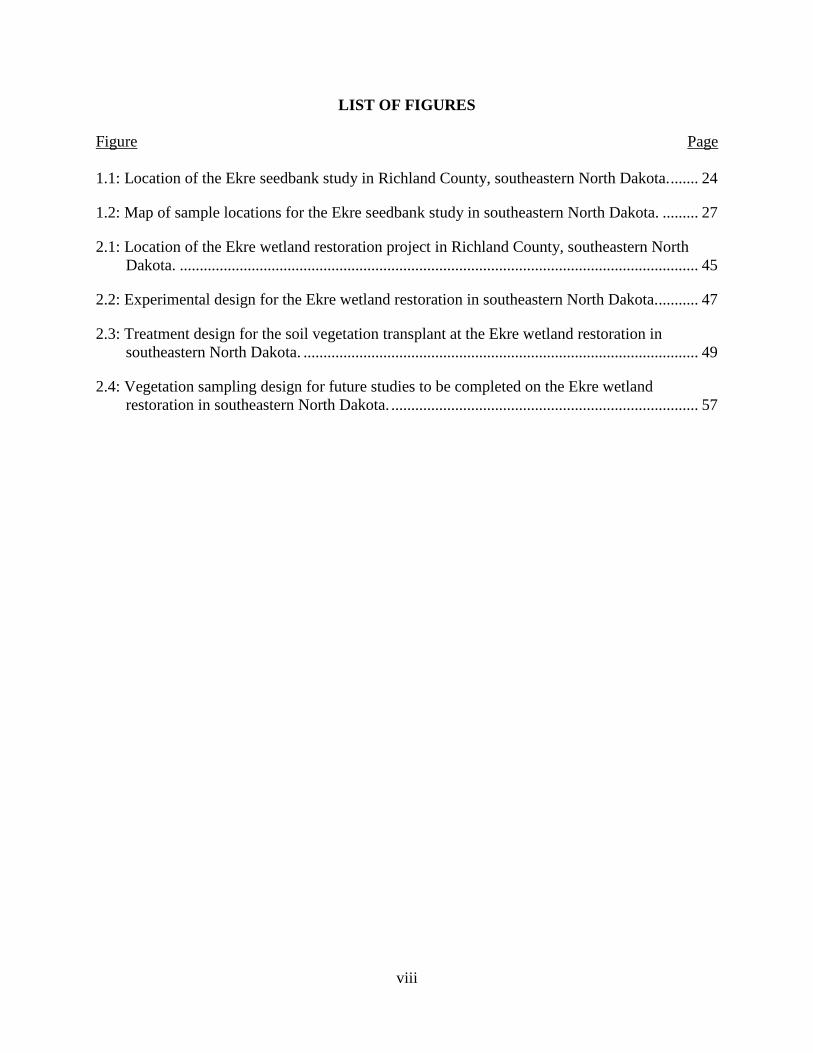
LIST OF FIGURES
Figure Page
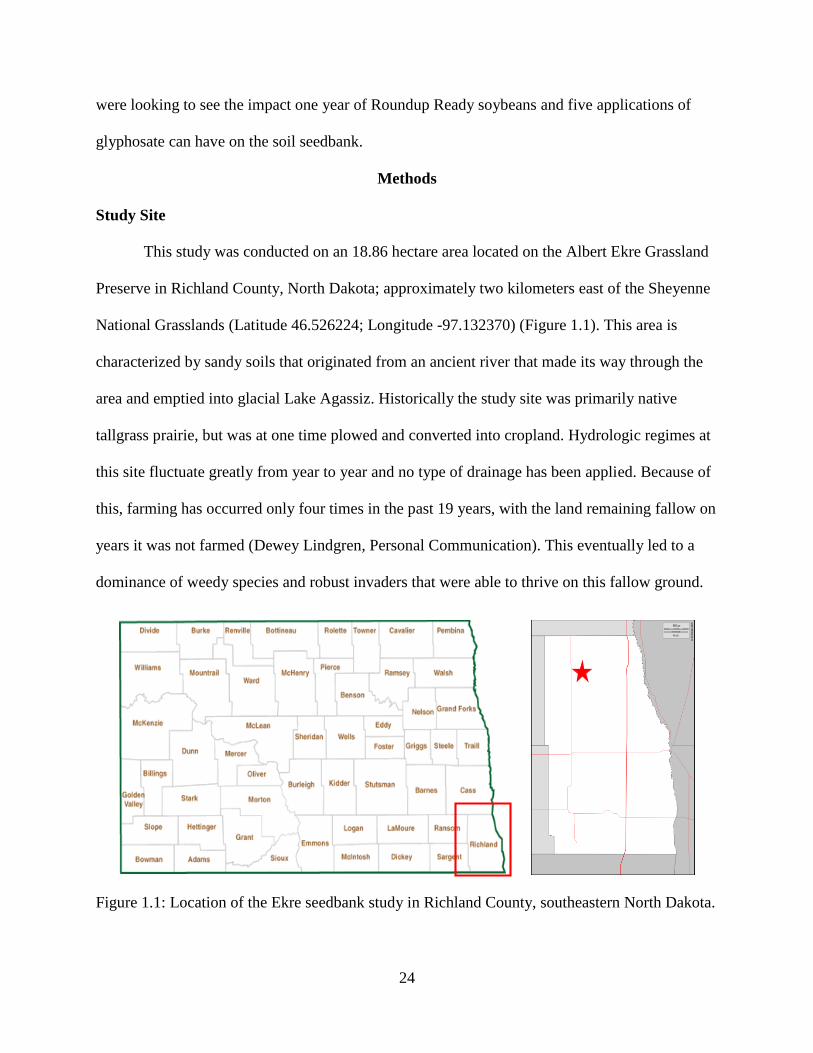
1.1: Location of the Ekre seedbank study in Richland County, southeastern North Dakota. ....... 24
1.2: Map of sample locations for the Ekre seedbank study in southeastern North Dakota. ......... 27
2.1: Location of the Ekre wetland restoration project in Richland County, southeastern North
Dakota. .................................................................................................................................. 45
2.2: Experimental design for the Ekre wetland restoration in southeastern North Dakota........... 47
2.3: Treatment design for the soil vegetation transplant at the Ekre wetland restoration in
southeastern North Dakota. ................................................................................................... 49
2.4: Vegetation sampling design for future studies to be completed on the Ekre wetland
restoration in southeastern North Dakota. ............................................................................. 57
1
LITERATURE REVIEW
Wetlands and Losses
Wetlands are among the most important ecosystems on earth (Mitsch and Gosselink
2007). They provide numerous ecological functions to both humans and wildlife. These include
shelter and habitat, food, protection from catastrophic flooding, irrigation, and carbon
sequestration (Bobbink et al. 2006). Wetlands have been proven to aid in the filtration and
purification of water as well as the recharge of underground aquifers (Mitsch and Gosselink
2007). Despite all the obvious values provided by the conservation of wetlands, it is difficult to
get the general public to fully recognize their value without their benefits given a monetary
value. This is an extremely difficult and highly subjective way to analyze wetlands because
many of the services they provide are “invaluable,” such as carbon sequestration and aesthetic
values. The ecosystem services provided by wetlands around the globe have also been estimated
and valued at $14,785 /hectare (ha) yr in 1994 (Costanza et al. 1997). At the present rate of
inflation this value increases to $23,315.51 /ha yr (Bureau of Labor Statistics 2015).
As of 1991, there had been a net loss of 53% of the wetlands once found in the
conterminous United States (Dahl 1990). Wetland losses from the 1950’s to 1970’s are estimated
at 3.7 million ha, or approximately 185,000 ha per year during that period (Frayer et al. 1983).
Most recent estimates (2004-2009) put wetland losses at a rate of 5,590 ha per year (Dahl 2011),
which is a significant increase in loss compared to the previous estimates of a net gain of 12,900
ha per year in wetlands from 1998-2004 (Dahl 2006). However, Dahl (2006) commented in his
report that despite this increases in acreage, the quality of those wetlands was not determined.
The rate of wetland loss has decreased significantly in the past few decades, but overall wetland
area is still being lost, as can be concluded from the most recent report on wetland status and
2
trends (Dahl 2011). The greatest wetland losses are intertidal wetlands found along the coastal
areas of Texas and Louisiana. A majority of these losses are not directly from human influence
though, which shows an increase in protection from governmental and state agencies (Dahl
2000). The greatest impacts to these wetlands have been attributed to mostly oceanic influences,
including land subsidence, coastal storms, and sea level rise. However, human related activities
such as water, oil, and natural gas extraction have been shown to be a contributing factor of land
subsidence (Dokka 2006). The largest contributors to freshwater wetland losses are from urban
and rural development, and forested freshwater wetlands were impacted the most by silviculture
operations (Dahl 2011).
The conversion of wetlands to agricultural land continues to be a major cause of wetland
losses (Mitsch and Gosselink 2007). From the 1900’s to the mid 1980’s, wetland drainage in the
United States (US) due to farms occurred at a rate of approximately 490,000 ha/yr (Office of
Technology Assessment 1984). With the rising prices of grains in response to both the growing
demand for food worldwide and the mounting need for biofuels, wetlands are still being
converted to agricultural uses (Johnson 2013; Wright and Wimberly 2013). This problem is even
more prevalent in the Prairie Pothole Region (PPR) of the North Central US and Canada.
Seventy one percent of the wetlands found in the Canadian portion of the PPR are estimated to
have been lost (National Wetlands Working Group 1988). According to Mitsch and Gosselink
(2007), only 10% of the original wetlands once found in the region still exist since modern
human settlement began, and more than half of these wetlands have been drained or altered
primarily for agriculture. The PPR is known for its extremely fertile soils and substantial
agricultural productivity. One contributing factor to that productivity is the abundance of water
found in the numerous wetlands of the region (Winter 1989). However, in order for the land to
3
be of utilized for agriculture, the water must be drained so crops can be planted. In some places,
agricultural drainage networks are so vast and intense that they have potentially irreversibly
altered the regional hydrology (Dahl 2014). Agriculture near wetlands can also have indirect
impacts that aren’t immediately noticeable or have immediate consequences. One such
consequence is the application of pesticides onto crops and its potential impacts on invertebrates
found in these wetlands, and its effects further up the food chain on waterfowl (Beyersbergen et
al. 2004).
From 1997 to 2009, total wetland area in the PPR declined by 30,100 ha, or 2,510 ha/yr.
Emergent wetlands and shrub wetlands in this area had the greatest declines (36,250 ha and
18,660 ha, respectively), but some of these losses were offset by an increase of 24,810 ha in
forested wetlands (Dahl 2014).
While these recent statistics may provide evidence of a potentially bleak future, there is
still hope for the remaining wetlands present around the country. Many different forms of
legislation have been passed in the past half century to prevent the destruction of these systems,
and also to provide the possibility of replacement for lost systems. Private organizations such as
Ducks Unlimited and The Nature Conservancy, in addition to governmental agencies like the
United States Fish and Wildlife Service (USFWS), have been purchasing high quality land to
protect these wetland systems. Through the purchase of these high quality areas, the USFWS can
designate these areas Waterfowl Production Areas (WPA), and prevent them from being drained
or lost. Since its initiation, more than 274,000 hectares (677,000 acres) have been protected in
nearly 7,000 WPA’s across the country, with many of these falling in the PPR (USFWS 2007).
4
Wetland Restoration
The initiation of the “no net loss” federal policy by George H.W. Bush in 1989 was a
major step towards the protection of our nation’s wetlands. The goal of this policy was to
achieve no overall loss of the nation’s wetlands, or if the destruction of a wetland was
unavoidable, the creation or restoration of a different wetland to mitigate the damage (National
Wetlands Policy Forum 1988). While this policy allows for the mitigation of wetland alteration,
these laws do not fully take into account the impacts that destruction of a wetland can have on an
ecosystem. According to Mitsch and Gosselink (2007), “… the most common alterations to
wetlands have been: (1) draining, dredging, and filing of wetlands; (2) modification of the
hydrologic regime; (3) highway construction; (4) mining and mineral extraction; and (5) water
pollution.” This mitigation process allows the party destroying a wetland to replace or improve a
wetland at another location. They have the option to create a new wetland where none existed,
restore a lost wetland, increase the size of a functioning wetland, or enhance a poorly functioning
wetland. Because wetlands are very unique habitats, they are very difficult to restore or replace
once degraded or lost. It was once believed wetlands were easy to replace, but, even after 20
years post restoration, it has been shown that restored wetlands do not function to support the
plant diversity of natural wetlands (Aronson and Galatowitsch 2008). Often wetland creation
results in the production of a wetland that resembles the previous wetland, but lacks the
functioning necessary to replace it. In order for a wetland mitigation to be deemed successful, the
restored wetland must resemble and function like the original (Galatowistch and van der Valk
1994).
There are many barriers to overcome in order for a wetland restoration to be successful.
Mitsch and Jørgensen (2004) outline seven key principles essential for success including
5
designing the wetland system for function not form, and to conform the project to what the
environment allows, among others. Once these principles have been addressed, the wetland
creation or restoration has an improved chance of succeeding, although nothing in nature is
guaranteed. Even the most carefully planned restorations have a chance of failure if any aspect is
overlooked or unpredictable natural events, such as flooding occurs.
One of the greatest threats to a restoration is the chance of invasion by non-native
species. Some non-native species are considered invasive species, and are described as species
that quickly and efficiently take over an area following their introduction into a new location
(Rejmanek and Richardson 1996). One reason restorations are so susceptible to invasive species
is due to the large disruptions occurring to the plant communities at restoration sites. For
example, the reflooding of a drained wetland results in a new environment being established, and
thus a vegetation change from upland plants to more wetland species. This shift in the plant
community generally results in upland species dying out and the presence of bare ground for
recolonization by wetland species. Invasive species are generally fast colonizers and great
competitors, often being well established in the new soil by the time native species begin to
emerge and try to compete for resources. According to Galatowitsch et al. (1999), “Once
established, invaders are difficult to remove, lowering the quality of existing wetlands, and
reducing the effectiveness of restoration efforts.” These invasive species generally create a
monoculture and prevent desired native species from becoming established (Odum 1988).
Seedbanks
The seedbank of any area is one of the key components when determining the vegetation.
A soil seedbank is described as a collection of all viable seeds in the soil that have not yet
germinated (Roberts 1981). Seeds found in the soil are usually products of the vegetation found
6
in the area, but may not necessarily reflect the present aboveground vegetation (Thompson and
Grime 1979; Cardina and Sparrow 1996). It may also contain seeds from species no longer
present in the above ground cover. The seeds of different plant species are highly variable in the
amount of time they can remain viable in the seedbank, as well as the amount of time it takes
them to germinate and begin to grow. Because of this, wetlands that appear similar may have
drastically different plant communities. Also different types of wetlands (permanent vs.
temporary) have different seedbanks due to different environmental conditions.
The presence or absence of surface water in a wetland is the determining factor of the
type of vegetation found in that area (Weiher and Keddy 1998). Water is the key to the
establishment of plants from a seedbank. Seedbanks may consist of persistent seedbanks with
long-lived seeds and/or transient seedbanks with short-lived seeds (Thompson et al. 1997).
Persistent seedbanks generally consist of seeds that can survive multiple growing seasons or
wetting and drying events and remain viable to germinate when the conditions are right,
generally when there is minimal competition. Transient seedbanks contain seeds which are
viable only one growing season and germinate at their first opportunity. Temporary wetlands
which dry rapidly and wet again following each successive rainfall favor persistent seedbanks
while semi-permanent and permanent wetlands tend to favor transient seedbanks, due to
predictable water regimes (Brock 2011). Seeds which do not germinate at their first opportunity
continue to remain viable in the soil, and contribute to the residual seedbank of an area. This
residual seedbank will continue to fluctuate as time goes on and as the reproductive success of
present plants and germination of seeds vary (Bonis et al. 1995; Brock 1998; Leck and Brock
2000).
7
Planning a restoration based on recruitment from a present seedbank (i.e. natural
revegetation) is often very difficult. Since many restorations are currently occurring on lands that
were previously used for agriculture, seedbanks of these areas are often greatly reduced from
years of herbicide, drainage, tillage, and grazing when compared to natural systems (Wienhold
and van der Valk 1989; Kline 1997; Lunt 2003). These areas often have few native species left to
help propagate restoration efforts. The effects of these missing native species from the ecosystem
can be seen as a positive feedback loop between native species present and their ability to
disperse. The fewer present, the less dispersal ability they have. Tilman (1997) found native
species’ abundance and richness were limited by recruitment and local biotic interactions.
Recruitment limitation has been shown to have significant impacts on community composition in
numerous studies (Menge and Sutherland 1987; Rejmánek 1989; Robinson et al. 1995). In
addition to this lack of dispersal and recruitment, it has been shown that invasive species produce
greater leaf area with reduced costs (Baruch and Goldstein 1999), but there is not significant
evidence to conclude that overall native species grow slower (Daehler 2003). Because of this
dispersal limitation and often limited reproductive success, seed stocking is helpful to increasing
plant composition and abundance, and eventually, the seedbank when recruitment limitation is
overcome (Tilman 1997).
Preparing a Restoration for Success
Many different methods have been utilized to prepare an area for restoration. In an
analysis of restoration techniques from 38 restoration managers, Rowe (2010) found the most
common practice was to plant the site into corn or soybeans for 2-3 years using conventional
techniques. These lands were leased to local farmers to plant, and it helped considerably with
alleviating costs, which can often be a driving factor in restoration. Many of these projects were
8
fallow, previously farmed croplands. Wilson and Partel (2003) found that these fields are often
dominated by introduced grasses, and these grasses can be difficult to control. The cropping
process reduces perennial and annual weed abundance, as well as their seedbanks through
disking (Farkas 2002), tilling (Gendron and Wilson 2007), and herbicide application (Schreiber
1992).
Fire has also been utilized as a technique to prepare for restoration. In areas where tilling
or cropping are not applicable, fire can be utilized. Rowe (2010) found fire to be nearly
universally applied in all restoration studies she looked at. C4 plants have been shown to increase
growth with spring burning (Robocker and Miller 1955), and the repetition of these burns on an
annual or biennial basis can lead to a trend in the dominance of a native, warm season plant
community (DiTomaso et al. 2006). However, only utilizing burning requires native species to
still be present in the community. If there are shrubs or woody species present, frequent fire
(every 1-2 years) is an effective tool to reduce their presence and prevent their future
encroachment (Hartnett and Fay 1998; Peterson and Reich 2008).
Reestablishing the hydrologic function of a wetland is also necessary for its restoration.
Much of the area that was previously tallgrass prairie has undergone extensive hydrological
alteration due to agriculture (Urban 2005). The causes of these alterations can be twofold. The
primary cause of these altered regimes is due to filling and draining of these sites to make the
land accessible for agriculture (Mitsch and Gosselink 2007). Other contributing factors to this
alteration can be lowered water tables or altered stream flows due to agricultural use (Rowe
2010). Undoing these alterations can be harder than initially thought. Removing drainage tiles
from a field is a relatively simple process, but legislation can impede this process. Rowe (2010)
found through communication with restoration managers that local regulations can often prevent
9
the alteration or removal of these drainage tiles or ditches. With no way to remove these tiles, it
can be impossible to restore hydrology to an area, even if the landowner wishes it.
Post-Restoration Management
In order for a restoration to remain successful past its initiation, some sort of management
plan must be put in place to ensure continued progression towards the originally desired goals. It
is important to identify the objective of a wetland restoration prior to starting the project so
progress of the wetland towards its desired state can be tracked (Mitsch and Gosselink 2007).
Most early wetland restorations were completed with no attempt at long term management
because it was originally believed restoring hydrologic conditions to a wetland would bring
native plants back. However, recent research has shown this idea to be incorrect. Mulhouse and
Galatowitsch (2003) visited sites with no predetermined management plan ten years after
restoration, and found these sites dominated mostly by invasive plant species. It was found in
restorations in the PPR that a majority of the flora found in restored wetlands will colonize in the
first 12 years following restoration (Aronson and Galatowitsch 2008). Because of this, long-term
monitoring of restored sites is necessary to ensure the restored area continues to progress towards
the desired goal. Current monitoring for restorations due to mitigation is normally limited to 3-5
years to ensure the original conditions are met through the restoration (Mitsch and Wilson 1996).
This, however, is not enough time. According to Jørgensen (1994), the further away a system is
at its beginning state from the desired condition, the longer it will take for that system to reach
the desired state. This means the amount of time necessary to monitor a restoration is highly
variable, and depends entirely on the condition of the area prior to any restoration action.
Severely degraded wetlands may take several decades to return to a desirable condition, while a
minimally disturbed site may only take a few years. With no absolute quantity on the amount of
10
time required to ensure the success of a restoration, each site will have to be evaluated
individually and evaluators will have to design a management plan for each wetland
independently.
Native Vegetation Seeding
Many early wetland restoration attempts in the PPR were initiated under the assumption
that native vegetation would return if the water regime was restored, however, many studies have
been conducted that show this often is not the case (Galatowitsch and van der Valk 1996a;
1996b; Aronson and Galatowitsch 2008). Decades after hydrologic function has been restored,
many native species are still absent from the landscape. Studies of the seedbanks in these
restored wetlands show that many of the native species found in natural undisturbed wetlands are
absent from restored sites (van der Valk 2013). These missing species from the seedbank require
supplementation in order to reestablish in restoration attempts.
Seeding of native species has been shown to greatly increase native diversity in
restoration attempts (Kiehl et al. 2006). This seed addition allows native species to establish
quickly, although often management is also needed to prevent interference from invasive species.
For example, Phalaris arundinacea (reed canarygrass) is a major threat to many restoration
attempts in the PPR (Adams and Galatowitsch 2006). By seeding these restored areas, native
perennial vegetation can become established, and therefore limit the area available for reed
canarygrass to infiltrate (Lindig-Cisneros and Zedler 2002). The quality of the seed to be used is
also important to take into consideration. High diversity seed mixtures have been shown to be
more effective at producing diverse communities than low diversity mixes (Leps et al. 2007).
11
Hay Transfer
The use of hay transfer to aid in restoration seeding is a relatively new practice that is
being implemented more often. However, in many of the trials in which it was utilized, it aided
the establishment of planted seed. According to a study done by Török et al. (2012), the use of
hay transfer, in addition to seed planting, worked well for the suppression of weed cover, and
also led to a decrease in weed species richness and overall biomass. This suppression of early
weeds in a project is a typical goal of a restoration manager. The reasons a hay layer is
potentially beneficial by suppressing weeds include the following: first, it acts to protect the soil
surface from desiccation allowing native seeds (usually longer germination period than weeds)
greater chance to germinate (Fowler 1988); second, it buffers the soil from fluctuations in
temperature which is a germination signal for several weed species (Foster and Gross 1998);
third, it may exhibit some allelopathic effect (Ruprecht et al. 2010); fourth, it can act as a
physical barrier for wind dispersed weeds (Wedin and Tilman 1993); and last, it decreases the
amount of light reaching the soil surface and available to weeds (Foster and Gross 1998).
The process of hay transfer can do more than just prevent the establishment of weedy
species during a restoration. It can also be utilized as an additional or primary source of seed.
Since many native and desirable plants have limited dispersal capabilities (Galatowitsch and van
der Valk 1996a) the use of hay can help overcome this limitation by putting the seed in place.
When using hay transfer as a form of seeding, the quality of the hay and timing of hay cutting are
important. In order to maximize the potential success of the hay transfer, hay must be collected
when the target species seeds are ripe and from an area where there is a high density of the target
species (Kiehl et al. 2006; Rasran et al. 2006). Managers can manipulate sites using hay transfer
12
to increase selected species richness by including them in the selected hay. Doing this inhibits
the colonization of restored sites from other seed sources and relies almost entirely on
contributions from the existing seedbank and the added hay for colony establishment
(Klimkowska et al. 2010).
Soil Plug (Transplant) Restoration
The use of transplanted soil plugs as a restoration technique has been practiced for a
considerable time, but published information utilizing these methods is minimal. There have
been a few studies in both prairies (Christianson and Landers 1969; Clarke and Bragg 1994) and
wetlands (Davis and Short 1997) that utilized soil transplanting as a method for restoration, but
no simple, cheap, or consistent transplanting method has been discovered yet. The costs are often
the primary limiting factor to the lack of soil transplant restorations. Despite the labor and cost
intensive process required to transplant wetland vegetation, it is still highly encouraged in
addition to naturally occurring vegetation and native inter-seeding (Williard et al. 1990). Various
methods have been used to remove whole cores with vegetation and plants intact including plugs
(Amon et al. 2006), tractor mounted tree spades (Fraser and Kindscher 2001), hand tools (Bragg
1988; Davis and Short 1997), and PVC pipe (Phillips 1990). Transplanted vegetation, in addition
to seeding, has been shown to increase the native species richness, diversity, and quality of a
restoration project when compared to areas that were seeded only (Middleton et al. 2010).
While the use of soil plugs for restoration has great potential, there are also drawbacks.
Davis and Short (1997) mention the drastic impacts soil plug removal can have on the donor site.
The removal of soil plugs leaves holes in the healthy donor sites, and thus can create areas for
possible invasion or erosion if this impact is not addressed. One way to alleviate these effects can
be the use of smaller plugs. By using many small plugs in an area there is less impact than
13
removal of a large plug. By using small plugs, there is less continuous exposed area prone to
invasion, and greater edge distance around the plug holes to allow surrounding native species to
recolonize the removed area. Another way to minimize effects of transplants is to target
vegetation removal from wetlands that will be removed due to mitigation projects to prevent a
total loss of the wetland area (Fraser and Kindscher 2001).
Literature Cited
Adams, C. R. and S. M. Galatowitsch. 2006. Increasing the effectiveness of reed canary grass
(Phalaris arundinacea L.) control in wet meadow restorations. Restoration Ecology
14:441-451.
Amon, J. P., C. S. Jacobson and M. L. Shelley. 2006. Construction of fens with and without
hydric soils. Ecological Engineering 24:341-357.
Aronson, M. F. J. and S. M. Galatowitsch. 2008. Long-term vegetation development of restored
prairie pothole wetlands. Wetlands 28:883-895.
Baruch, Z. and G. Goldstein. 1999. Leaf construction cost, nutrient concentration, and net CO2
assimilation of native and invasive species in Hawaii. Oecologia 121:183-192.
Beyersbergen, G. W., N. D. Niemuth and M. R. Norton. 2004. Northern Prairie and Parkland
Waterbird Conservation Plan. Prairie Pothole Joint Venture, U.S. Fish and Wildlife
Service, Denver, CO. 183 pp.
Bobbink, R., B. Beltman, J. T. A. Verhoeven and D. Whigham. 2006. Wetlands: Functioning,
Biodiversity Conservation, and Restoration. Springer-Verlag.
Bonis, A., J. Lepart and P. Grillas. 1995. Seed bank dynamics and coexistence of annual
macrophytes in a temporary and variable habitat. Oikos 74:81-92.
Bragg, T. B. 1988. Prairie transplants: preserving ecological diversity. In: Proceedings of the
Tenth North American Prairie Conference, Lincoln, Nebraska, USA, pp. 214-219.
Brock, M. A. 1998. Are temporary wetlands resilient? Evidence from seed banks of Australian
and South African wetlands, pp. 193-206. In A. J. McComb & J. A. Davis (eds.)
Wetlands for the Future. Gleneagles Publishing, Adelaide, Australia.
Brock, M. A. 2011. Persistence of seed banks in Australian temporary wetlands. Freshwater
Biology 56:1312-1327.
14
Bureau of Labor Statistics. 2015. CPI Inflation Calculator. Available at:
http://www.bls.gov/data/inflation_calculator.htm. Accessed 3/2/2015.
Cardina, J. and D. H. Sparrow. 1996. A comparison of methods to predict weed seedling
populations from the soil seedbank. Weed Science 44:46-51.
Christianson, P. A. and R. Q. Landers. 1969. Notes on prairie species in Iowa. II. Establishment
by sod and seedling transplants. The Proceedings of the Iowa Academy of Science
76:94–104.
Clarke, W. M. and T. B. Bragg. 1994. Movement of tallgrass prairie plant species from sod
transplant into adjacent reestablished grassland. Prairie Naturalist 26:67-81.
Costanza, R., R. d’Arge, R. de Groot, S. Farber, M. Grasso, B. Hannon, K. Limburg, S. Naeem,
R. V. O’Neill, J. Paruelo, R. G. Raskin, P. Sutton and M. van den Belt. 1997. The value
of the world’s ecosystem services and natural capital. Nature 387:253-260.
Daehler, C. C. 2003. Performance comparisons of co-occuring native and alien plants:
Implications for conservation. Annual Review of Ecology, Evolution, and Systematics
34:183-211
Dahl, T. E. 1990. Wetland losses in the United States, 1780s to 1980s. U.S. Department of
Interior, Fish and Wildlife Service, Washington, DC. 22 pp.
Dahl, T. E. 2000. Status and Trends of Wetlands in the Conterminous United States 1986 to
1997. U.S. Department of Interior, Fish and Wildlife Service, Washington, DC. 82 pp.
Dahl, T. E. 2006. Status and Trends of Wetlands in the Conterminous United States 1998 to
2004. U.S. Department of Interior, Fish and Wildlife Service, Washington, DC. 112 pp.
Dahl, T. E. 2011. Status and Trends of Wetlands in the Conterminous United States 2004 to
2009. U.S. Department of Interior, Fish and Wildlife Service, Washington, DC. 108 pp.
Dahl, T.E. 2014. Status and trends of prairie wetlands in the United States 1997 to 2009. U.S.
Department of the Interior; Fish and Wildlife Service, Ecological Services, Washington,
D.C. 67 pp.
Davis, R. C. and F. T. Short. 1997. Restoring eelgrass, Zostera marina L., habitat using a new
transplanting technique: The horizontal rhizome method. Aquatic Botany. 59:1-15.
DiTomaso, J. M., M. L. Brooks, E. B. Allen, R. Minnich, P. M. Rice and G. B. Kyser. 2006.
Control of invasive weeds with prescribed burning. Weed Technology 20:535-548.
Dokka, R. K. 2006. Modern-day tectonic subsidence in coastal Louisiana. Geology 34:281-284.
15
Farkas, A. 2002. Evaluation of tilling systems from the point of view of weed control on brown
forest soil in Godollo. Novenytermeles 51:513-528.
Foster, B. L. and K. L. Gross. 1998. Species richness in a successional grassland: effects of
nitrogen enrichment and plant litter. Ecology 79:2593-2602.
Fowler, N. L. 1988. What is a safe site? Neighbor, litter, germination date, and patch effects.
Ecology 69:947-961.
Fraser, A. and K. Kindscher. 2001. Tree spade transplanting of Spartina pectinata (Link) and
Eleocharis macrostachya (Britt.) in a prairie wetland restoration site. Aquatic Botany
71:297-304.
Frayer, W. E., T. J. Monahan, D. C. Bowden and F. A. Graybill. 1983. Status and trends of
wetlands and deepwater habitat in the conterminous United States, 1950s to 1970s.
Department of Forest and Wood Sciences, Colorado State University, Fort Collins. 32 pp.
Galatowitsch, S. M. and A. G. van der Valk. 1994. Restoring Prairie Wetlands: An Ecological
Approach. Iowa State University Press, Ames, IA, USA.
Galatowitsch, S. M. and A. G. van der Valk. 1996a. The vegetation of restored and natural
prairie wetlands. Ecological Applications 6:102-112.
Galatowitsch, S. M. and A. G. van der Valk. 1996b. Characteristics of recently restored wetlands
in the prairie pothole region. Wetlands 16:75-83.
Galatowitsch, S. M., N. O. Anderson and P. D. Ascher. 1999. Invasiveness in wetland plants in
temperate North American Wetlands 19:733-755.
Gendron, F. and S. D. Wilson. 2007. Responses to fertility and disturbance in a low-diversity
grassland. Plant Ecology 191:199-207.
Hartnett, D. C. and P. A. Fay. 1998. Plant populations patterns and processes. Pages 81-100 in A.
K. Knapp, J. M. Briggs, D. C. Hartnett and S. L. Collins, editors. Grassland dynamics:
long-term ecological research in tallgrass prairie. Oxford University Press, New York.
Johnston, C. A. 2013. Wetland losses due to row crop expansion in the Dakota Prairie Pothole
Region. Wetlands 33:175-182.
Jørgensen, S. E. 1994. Fundamentals of ecological modeling. 2nd edition. Elsevier, Amsterdam,
The Netherlands.
Kiehl, K. K., A. Thormann and J. Pfadenhauer. 2006. Evaluation of initial restoration measures
during restoration of calcareous grasslands on former arable fields. Restoration Ecology
14:148-156.
16
Klimkowska, A., W. Kotowski, R. Van Diggelen, A. P. Grootjans, P. Dzierza and K. Brzezińska.
2010. Vegetation re-development after fen meadow restoration by topsoil removal and
hay transfer. Restoration Ecology 18:924-933.
Kline, V. M. 1997. Planning a restoration. Pages 31-46 in S. Packard and C. F. Mutel, editors.
The Tallgrass Restoration Handbook for Prairies, Savannas, and Woodlands. Island
Press, Washington, D. C.
Leck, M. A. and M. A. Brock. 2000. Ecological and evolutionary trends in wetlands: evidence
from seeds and seed banks in New South Wales, Australia and New Jersey, USA. Plant
Species Biology 15:97-112.
Leps, J., J. Dolezal, T. M. Bezemer, V. K. Brown, K. Hedlund, M. Igual Arroyo, H. B.
Jörgensen, C. S. Lawson, S. R. Mortimer, A. Peix Geldart, C. Rodríguez Barrueco, I.
Santa Regina, P. Smilauer and W. H. van der Putten. 2007. Long-term effectiveness of
sowing high and low diversity seed mixtures to enhance plan community development on
ex-arable fields. Applied Vegetation Science 10:97-110.
Lindig-Cisneros, R. and J. B. Zedler. 2002. Phalaris arundinacea seedling establishment: effects
of canopy complexity in fen, mesocosm, and restoration experiments. Canadian Journal
of Botany 80:617-24.
Lunt, I. 2003. A protocol for integrated management, monitoring, and enhancement of degraded
Themeda triandra grasslands based on plantings of indicator species. Restoration
Ecology 11:223-230.
Menge, B. A. and J. P. Sutherland. 1987. Community regulation: variation in disturbance,
competition, and predation in relation to environmental stress recruitment. American
Naturalist 130:730-757.
Middleton, E. L., J. D. Bever and P. A. Schultz. 2010. The effect of restoration methods on the
quality of the restoration and resistance to invasion by exotics. Restoration Ecology
18:181-187.
Mitsch, W. J. and J. G. Gosselink. 2007. Wetlands. 4th edition. John Wiley and Sons, Hoboken.
Mitsch, W. J. and R. F. Wilson. 1996. Improving the success of wetland creation and restoration
with know-how, time, and self-design. Ecological Applications 6:77-83.
Mitsch, W. J. and S. E. Jørgensen. 2004. Ecological Engineering and Ecosystem Restoration.
John Wiley & Sons, Hoboken, NJ.
Mulhouse, J. M. and S. M. Galatowistch. 2003. Revegetation of prairie pothole wetlands in the
mid-continential US: Twelve years post-reflooding. Plant Ecology 169:143-159.
17
National Wetlands Policy Forum. 1988. Protecting America’s Wetlands: An Action Agenda.
Conservation Foundation, Washington, DC. 69 pp.
National Wetlands Working Group. 1988. Wetlands of Canada. Ecological and Classification
Series 24, Environment Canada, Ottawa, Ontario, and Polyscience Publications,
Montreal, Quebec. 452 pp.
Odum, W. E. 1988. Predicting ecosystem development following creation and restoration of
wetlands, pp. 67-70. In J. Zelazny & J. S. Feierabend (eds.) Increasing our Wetland
Resources. National Wildlife Federation Conference Proceedings, Washington, DC,
USA.
Office of Technology Assessment. 1984. Wetlands: Their Use and Regulation. Report O-206,
Office of Technology Assessment, U.S. Congress, Washington, DC. 208 pp.
Peterson, D. W. and P. B. Reich. 2008. Fire frequency and tree canopy structure influence plant
species diversity in a forest-grassland ecotone. Plant Ecology 194:5-16.
Phillips, R. C. 1990. Transplant methods. In: Phillips, R.C., McRoy, C.P. (Eds.), Seagrass
Research Methods. UNESCO, Paris, pp. 51-54.
Rasran, L., K. Vogt and K. Jensen. 2006. Seed content and conservation evaluation of hay
material of fen grasslands. Journal for Nature Conservation 14:34-45.
Rejmánek, M. 1989. Invasibility of plant communities, pp. 369-388 in J. A. Drake, F. DiCastri,
R. H. Groves, F. J. Kruger, H. A. Mooney, M. Rejma´nek, and M. H. Williamson,
editors. Biological invasions: a global perspective. Wiley, New York, New York, USA.
Rejmánek, M. and D. M. Richardson. 1996. What attributes make some plant species more
invasive? Ecology 77:1655-1660.
Roberts, H. A. 1981. Seed banks in soil. Advanced Applied Biology 6:1-55.
Robinson, G. R., J. F. Quinn and M. L. Stanton. 1995. Invasibility of experimental habitat
islands in a California winter annual grassland. Ecology 76:786-794.
Robocker, W. C., and B. J. Miller. 1955. Effects of clipping, burning and competition on
establishment and survival of some native grasses in Wisconsin. Journal of Range
Management 8:117-120.
Rowe, H. I. 2010. Tricks of the trade: Techniques and opinions from 38 experts in tallgrass
prairie restoration. Restoration Ecology 18 No. 2:253-262.
Ruprecht, E., J. Józsa, T. B. Ölvedi and J. Simon. 2010. Differential effects of several “litter”
types on the germination of dry grassland species. Journal of Vegetation Science
21:1069-1081.
18
Schreiber, M. M. 1992. Influence of tillage, crop-rotation, and weed management on Giant
Foxtail (Setaria faberi) population-dynamics and corn yield. Weed Science 40:645-653.
Thompson, K., J. P. Bakker and R. M. Bekker. 1997. The Soil Seed Banks of North West
Europe: Methodology, Density, and Longevity. Cambridge University Press, Cambridge,
United Kingdom. 276 pp.
Thompson, K. and J. P. Grime. 1979. Seasonal variation in the seed banks of herbaceous species
in ten contrasting habitats. Journal of Ecology 67:893-921.
Tilman, D. 1997. Community invasibility, recruitment limitation, and grassland biodiversity.
Ecology 78:81-92.
Török, P., T. Miglécz, O. Valkó, A. Kelemen, K. Tóth, S. Lengyel and B. Tóthmérész. 2012.
Fast restoration of grassland vegetation by a combination of seed mixture sowing and
low-diversity hay transfer. Ecological Engineering 44:133-138.
United States Fish and Wildlife Service. USFWS. 2007. Waterfowl Production Areas: Prairie
Jewels of the National Wildlife Refuge System. U.S. Department of Interior, Fish and
Wildlife Service, Washington, DC. 2 pp.
Urban, M. A. 2005. An uninhabited waste: transforming the Grand Prairie in nineteenth century
Illinois, USA. Journal of Historical Geography 31:647-665.
van der Valk, A. G. 2013. Seed banks of drained floodplain, drained palustrine, and undrained
wetlands in Iowa, USA. Weltands 33:183-190.
Wedin, D. A. and D. Tilman. 1993. Competition among grasses along a nitrogen gradient: Initial
conditions and mechanisms of competition. Ecological Monographs 63:199-229.
Weiher, E. and P. A. Keddy. 1998. The assembly of wetland plant communities. Oikos 73:323-
335.
Wienhold, C. E. and A. G. van der Valk. 1989. The impact of duration of drainage on the seed
banks of northern prairie wetlands. Canadian Journal of Botany 67:1878-1884.
Willard, D. E., V. M. Finn, D. A. Levine and J. E. Klarquist. 1990. Creation and restoration of
riparian wetlands in the agricultural midwest. In: Kusler, J.A., Kentula, M.E. (Eds.),
Wetland Creation and Restoration, the Status of the Science. Island Press, Washington,
DC.
Wilson, S. D. and M. Partel. 2003. Extirpation or coexistence? Management of a persistent
introduced grass in a prairie restoration. Restoration Ecology 11:410-416.
Winter, T. C. 1989. Hydrologic studies of wetlands in the northern prairie. In Northern Prairie
Wetlands, ed. A. G. van der Valk, 16-54. Ames: Iowa State University Press.

19
Wright, C. K. and M. C. Wimberly. 2013. Recent land use change in the Western Corn Belt
threatens grasslands and wetlands. Proceedings of the National Academy of Science
110:4134-4139.
20
PAPER 1. CROPPING AS A TOOL FOR MANAGING SEEBANK COMPOSITION FOR
WETLAND RESTORATION IN SOUTHEASTERN NORTH DAKOTA
Abstract
The process of restoring a degraded wetland to natural conditions is time consuming,
tedious, and often an expensive process with variable results. Many restoration attempts involve
restoration of the water regime and then allow the wetland to reestablish primarily through
natural succession from its seedbank. However, after decades of disturbance the seedbanks of
these wetlands can be severely depleted, often containing few, if any, native plants. This
seedbank depletion is especially prevalent in wetlands that have been drained and/or utilized as
hydric cropland. Prolonged cropping can severely impact a seedbank through commonly utilized
agriculture practices such as herbicide treatment, fertilization, and tillage, and often leads to a
transition to weedy, annual species and also provides an area for perennial invasive plant species
to become established. Prior to initiation of a wetland restoration project it is important to
determine if desirable species are still present in the seedbank. A seedbank study is one of the
most effective methods to determine which species are present and viable in a seedbank. In this
study we completed a seedbank study of a degraded wetland that was previously farmed and
allowed to sit fallow for parts of the past 20 years, leading to a buildup of invasive and weedy
species at the site. A seedbank study was completed with initial conditions, and once again a year
later after the area was planted with Roundup Ready soybeans and treated with five applications
of glyphosate. We look to address the impact five applications of glyphosate over one year can
have on the seedbank of a degraded wetland, and if it is possible to restore these degraded
wetlands to their natural form and function. Results of the seedbank study showed significant
21
differences (P < 0.05) between seedling counts, which suggests one year of herbicide application
is enough time to significantly impact the seedbank of a degraded wetland.
Introduction
A seedbank is described as a collection of all viable seeds in the soil that have not yet
germinated (Roberts 1981). The seedbank composition often provides information as to the
ecological history of plant communities and is necessary to fully understand them (Hill and
Stevens 1981; Thompson 1986; Milberg 1995). Frequently the seedbank is not a direct reflection
of above ground vegetation (Thompson and Grime 1979; Cardina and Sparrow 1996). Many
wetland species require precise cycles of wet and dry for their seeds to germinate, and thus may
not be present in standing vegetation if conditions that year are not favorable. Hydrologic
regimes in temporary or seasonal wetlands can fluctuate greatly in the Prairie Pothole Region
(PPR), and this can have large impacts on seedbanks as well as emergent plants. Brock (2011)
found that the composition of a seedbank can change profoundly the longer a wetland remains
dry, or with an increase in the number successive germination events.
Seedbanks also tend to vary greatly between types of wetlands. Temporary, short lived
wetlands often have a much different seedbank composition than wetlands that hold water
continuously. Short lived wetlands tend to favor a persistent, long lived seedbank that can
survive long periods of dry before germination, while wetlands with nearly permanent
inundation tend to favor transient seedbanks that often remain viable for one year or less
(Thompson et al. 1997). Often areas with more regular hydrologic regimes will contain a mixture
of plant species contributing to both the transient and persistent seedbank (Leck and Simpson
1987; 1995).
22
Analyzing the composition of a seedbank can also explain important ecological shifts that
may be occurring in a community. By comparing a seedbank to the present above ground
vegetation, a determination of floristic similarity can be determined. This can be used to then
determine whether the seedbank is driving vegetation composition, or if the vegetation is
influencing the seedbank (Leck and Simpson 1987; Henderson et al. 1988). This is useful to
determine whether or not a trend, either good or bad, exists across a temporal scale. However, it
is highly likely in wetlands containing both transient and persistent seedbanks, to fluctuate
greatly from year to year depending upon hydrologic conditions, thus greatly influencing floristic
similarity scores from year to year (Leck and Simpson 1995).
It has been suggested that wetland restoration is a process that can occur naturally by
utilizing the seedbank of an area and secondary succession (van der Valk 1999). However,
transient portions of a seedbank have been shown to remain viable for only short periods of time
(one year or less), and fail to germinate if they remain in the seedbank for longer (Thompson et
al. 1997). Because of this, the longer a wetland remains dry or in a degraded condition, the more
likely the transient seedbank is to be depleted. If these conditions are allowed to persist for
decades or longer, it is possible to eliminate portions of the persistent seedbank as well. Larkin et
al. (2012) showed that Typha x glauca was able to prevent seedlings from surviving by creating
a litter layer that changed physical and chemical properties of the soil and shaded out other
species. By failing to create seed yearlyto contribute to the seedbank, eventually these persistent
species can disappear from the seedbank.
Ability to disperse can also significantly influence on the species present in a seedbank.
After years of drainage, many species that were present prior to draining are lost from the seed
rain that aids in these species survival (Kettenring and Galatowitsch 2011). Wienhold and van
23
der Valk (1989), and van der Valk et al. (2009) found that after completing a restoration, only a
subset of the expected or desired wetland species would be present in the seedbank.
Supplementation of a seedbank can occur in a multitude of natural ways including water
movement (Huiskes et al. 1995; Middleton 1999; 2000), waterfowl (Mitsch and Wilson 1996;
Figuerola et al. 2002; Muelller and van der Valk 2002), wind (Fenner 1985; Wienhold and van
der Valk 1989; van der Valk et al. 2009), and other animals (DeVlaming and Proctor 1968;
Crawley 1983). While dispersal of some wetland species happens easily, other species
historically abundant in the PPR (Carex spp.) have been shown to not easily colonize these areas
due to the loss of hydrologic connections across the landscape (Galatowitsch and van der Valk
1995; 1996a) and their reproduction primarily through clonal growth.
It is important to consider the present seedbank when planning a restoration, and design a
plan to control it. Seedbanks of previously farmed hydric croplands are often dominated by
introduced grasses that are difficult to control once they become established (Wilson and Partel
2003). By cropping these areas with traditional farming practices for 2-3 years prior to starting a
restoration, it is possible to reduce their seedbanks and increase chances of restoration success
(Rowe 2010). The use of disking (Farkas 2002), tilling (Gendron and Wilson 2007), and
herbicide (Schreiber 1992) have been shown to reduce perennial and annual weed cover and their
seedbanks in fallow fields. If the existing seedbank is not addressed prior to planting of native
seed, already established introduced species may outcompete native seedlings and hinder their
establishment.
In this study we look to determine which species are left in a soil seedbank of a degraded
wetland that was utilized for decades primarily for agriculture in the past and left fallow to be
taken over by invasive wetland species such as Typha spp. and Phalaris arundinacea. We also
24
were looking to see the impact one year of Roundup Ready soybeans and five applications of
glyphosate can have on the soil seedbank.
Methods
Study Site
This study was conducted on an 18.86 hectare area located on the Albert Ekre Grassland
Preserve in Richland County, North Dakota; approximately two kilometers east of the Sheyenne
National Grasslands (Latitude 46.526224; Longitude -97.132370) (Figure 1.1). This area is
characterized by sandy soils that originated from an ancient river that made its way through the
area and emptied into glacial Lake Agassiz. Historically the study site was primarily native
tallgrass prairie, but was at one time plowed and converted into cropland. Hydrologic regimes at
this site fluctuate greatly from year to year and no type of drainage has been applied. Because of
this, farming has occurred only four times in the past 19 years, with the land remaining fallow on
years it was not farmed (Dewey Lindgren, Personal Communication). This eventually led to a
dominance of weedy species and robust invaders that were able to thrive on this fallow ground.
Figure 1.1: Location of the Ekre seedbank study in Richland County, southeastern North Dakota.
25
The major natural vegetation type in this area was tallgrass prairie, which was dominated
by big bluestem (Andropogon gerardii Vitman), prairie sandreed (Calamovilfa longifolia
(Hook.) Scribn.), sand bluestem (Andropogon hallii Hack.), needle-and-thread grass
(Hesperostipa comata (Trin. & Rupr.) Barkworth), porcupine grass (Hesperostipa spartea (Trin.)
Barkworth), sand dropseed (Sporobolus cryptandrus (Torr.) A. Gray), sideoats grama (Bouteloua
curtipendula (Michx.) Torr.), prairie junegrass (Koeleria macrantha (Ledeb.) Schult.), Canada
wildrye (Elymus canadensis L.), blue grama (Bouteloua gracilis (Willd. ex Kunth) Lag. ex
Griffiths), and sedges (Carex spp.). Wetlands are typically dominated by woolly sedge (Carex
pellita (Muhl.) Willd.), slough sedge (Carex atheroides Spreng.), fescue sedge (Carex brevior
(Dewey) Mack., northern reedgrass (Calamagrostis stricta (Timm) Koeler), prairie cordgrass
(Spartina pectinata (Bosc) Link), rushes (Juncus & Elocharis spp.), other sedges (Carex spp.),
and forbs. (NRCS ESIS, ESD 2015).
Soils of the wetland are described as: 97.2% Aylmer-Rosewood-Serden complex, 0-9%
slopes with minor components: Ulen, Hamar, Bantry and Venlo series; 1.7% Serden-Hamar
complex, 0-15% slopes with minor components: Bantry, Alymer, Ulen, and Venlo series; and
1.1% Garborg loamy fine sand, 0-1% slope with minor components: Hamar, Delamere,
Mantador, Ulen, and Venlo. Aylmer soils are derived from wind-worked sandy glaciofluvial
deposits and classified as subirrigated sands. Rosewood soils are derived from sandy
glaciofluvial deposits and classified as wet meadow. Serden soils are derived from sandy eolian
deposits and are classified as sands. Hamar soils are derived from sandy glaciofluvial deposits
and classified as wet meadow. Garborg soils are derived sandy glaciofluvial deposits and/or
sandy glaciolacustrine deposits and are classified as subirrigated (NRCS WSS 2015).
26
The climate of this area is considered humid continental (cool summer) and has a wide
fluctuation in annual and daily temperatures. Precipitation is highly variable in amount as well as
annual totals. Thirty year averages for the area put precipitation at 47.2 cm during the April to
October growing season from 1981-2010 (USDOC NOAA 2015). Rainfall total in 2013 were
53.2 cm, 6 cm above average, and in 2014, the total was 49.3 cm, 2.1 cm above average
(NDAWN 2014).
Site Preparation
The study site was burned in the spring of 2013 to prepare the area for soybean planting
and spraying. It was a dry spring so the wetland was able to be burned in its entirety. After the
wetland was burned, approximately one week later the ground was prepared for planting. The
site was run over with a salford vertical tillage tool (independently mounted discs, harrow, and
rolling basket to firm the ground) three times, in order to remove any large hummocks or
mounds that were present from decades of cropping, sitting fallow, and being inundated. Seeding
of Roundup Ready soybeans immediately followed this process. Herbicide (Roundup
PowerMax®, Monsanto Company, St. Louis, MO, 63167) was applied five times in 2013, once
post burn before planting, 3 times in crop, and once again post-harvest. Application rates were
consistent with label recommended dose for soybean application of 1.54 kg/ha.
Seedbank Sampling
One hundred eighty seedbank samples were taken in a systematic grid configuration
twice over a one year span, once in early May 2013 before treatment and again in late May 2014
following one year of herbicide application (Figure 1.2). Sample sites from the first year were
marked with a GPS unit (1 meter accuracy) so samples could be taken from the same spot the
following year (Appendix A). The soil samples were taken in the spring of each year as soon as
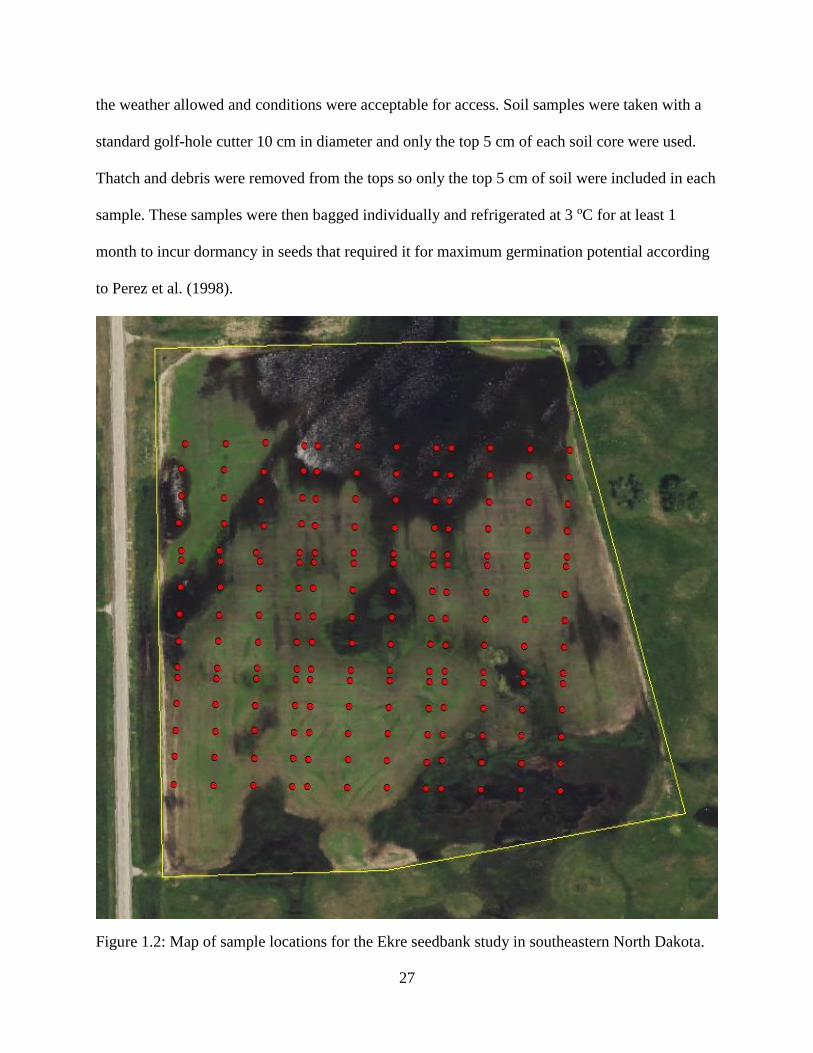
27
the weather allowed and conditions were acceptable for access. Soil samples were taken with a
standard golf-hole cutter 10 cm in diameter and only the top 5 cm of each soil core were used.
Thatch and debris were removed from the tops so only the top 5 cm of soil were included in each
sample. These samples were then bagged individually and refrigerated at 3 oC for at least 1
month to incur dormancy in seeds that required it for maximum germination potential according
to Perez et al. (1998).
Figure 1.2: Map of sample locations for the Ekre seedbank study in southeastern North Dakota.
28
Seedbank Analysis
After being refrigerated, soil samples were processed following the procedures presented
by Ter Heerdt et al. (1996). Ninety 26 x 26 x 6 cm square trays were prepared using a mixture of
steam-sterilized soil and commercial potting mix (SunshineMix No. 1®, Sun Gro Horticulture,
Bellevue, WA 98008) to a depth of 2.5 cm, then topped with 1.5 cm of steam-sterilized silica
sand. Samples were individually washed through two different soil sieves, a coarse No. 5 (4
mm), and fine No. 70 (0.212 mm) to remove debris and root material that may influence
germination results. After washing, two samples were poured together to create a “slurry” and
added to the prepared trays of sand and potting mix to form a layer from 3-5 mm thick. Trays
were then placed in the greenhouse and watered daily. Natural light was supplemented with
halide lamps at 450 µEm-2 s-1 from 6 am to 10 pm daily. Temperature was maintained between
20 and 30 oC for 8 to 9 weeks, the duration of this study. The study was conducted for this
duration because Ter Heerdt et al. (1996) suggested 95 percent of all seedlings will emerge in 6
weeks. Seedlings were then counted and removed as they were identified, to allow further
seedlings to emerge. Unknown seedlings were also removed and placed in separate trays to grow
until they could be identified.
Data Analysis
Plant composition changes were analyzed by evaluating annual to non-annual seedlings
and forb to graminoid seedling proportions. These counts were then transformed using the fourth
root for total seedling counts, and an arcsine conversion for the proportion of annuals and
proportion of forbs. After the conversion, each of these variables had an approximately normal
distribution. Absolute counts were used to compare total seedlings between years. Total seedling
counts per tray were extrapolated to the number of seeds per m2 in a 5 cm layer of soil. Soil
29
seedbank data were analyzed using one-way analysis of variance using SAS Enterprise Guide
(SAS Institute Software 2013, Version 6.1, SAS Inc., Cary, NC) at the P < 0.05 significance
level for total seedlings and plant composition changes.
Results
Seedling emergence was significantly different (P < 0.05) between pre and post herbicide
application. The preliminary seedbank in 2013 resulted in 83,652 total seedlings. After one year
of herbicide treatment, seedling count dropped to 31,835 in 2014. These results were converted
to seedlings per square meter (Appendix B). In 2013, graminoids and forbs were nearly equally
represented with 51.1 percent graminoid and 49.9 percent forb composition. In 2014 graminoid
and forb composition were 41.6 and 58.4 percent respectively. This difference was not
significant (P < 0.05). The biggest cause for this change in composition came from the loss of the
annual graminoid Cyperus erythrorhizos from the seedbank. In both 2013 and 2014, the top five
most abundant species accounted for 79 and 80 percent, respectively, of the total seedlings. In
2013 these species in order of abundance were Cyperus erythrorhizos, Potentilla norvegica,
Potentilla paradoxa, Eleocharis acicularis, and Juncus interior. The 2014 results in order of
abundance are Lindernia dubia, Eleocharis acicularis, Juncus interior, Hypericum majus, and
Potentilla norvegica.
Due to the vast difference in total seedlings between 2013 and 2014, proportions of the
total were used to calculate changes in plant composition before and after herbicide application.
Plants that decreased the greatest proportionally after one year of glyphosate application were
Cyperus erythrorhizos, Potentilla paradoxa, Potentilla norvegica, and Cyperus squarrosus. They
decreased 30.5, 13.9, 13.1, and 4.1 percent respectively when 2014 proportions were compared
to 2013. These plants all are mostly annual species so it is not surprising to see such drastic
30
declines in their numbers. The greatest increasers after herbicide treatment were Lindernia dubia,
Elocharis acicularis, Juncus interior, Hypericum majus, Typha spp., and Veronica peregrina.
They increased 19.5, 16.8, 9.8, 6.8, 3.8, and 3.6 percent respectively in 2014 proportions versus
2013. Half of these plants are annuals, and the other half are perennial, showing a trend of
increases in both.
Proportions of annual to non-annual seedlings did not change drastically between the
years. In 2013, 43.5% of the species were annuals, and in 2014 this number slightly increased to
44.1%. These numbers are not significant (P < 0.05) and thus do not reflect any large change in
the vegetation composition.
While some species had drastic increases or decreases after herbicide application, a
majority did not. Of the 56 species found during this study, 35 increased or decreased by less
than 1 percent, showing their populations remained relatively stable despite the application of
herbicide for one year. Seven species that changed by this percentage were excluded from this
statistic because only one seedling was found in either year.
Discussion
This study shows the impact decades of agriculture can have on a seedbank. Missing
from our seedbank study were many of the native species usually found in most prairie pothole
wetlands such as Carex spp., Calamagrostis stricta, Spartina pectinata, Juncus spp., and other
native forbs (NRCS ESIS, ESD 2015). Our seedbank results support the conclusion that
prolonged agricultural use leads to the fragmentation of wetlands in the landscape, and
subsequent depletion of native species from the soil seedbank (Wienhold and van der Valk 1989;
Kline 1997). The abundance of weedy, mudflat annuals in our seedbank is also consistent with
the results of Galatowitsch and van der Valk (1996a), who also found emergent perennial species
31
to be lacking in restored wetlands. Getting these emergent, wet meadow species reestablished in
a wetland is difficult without direct intervention. Studies of the seed rain of other prairie pothole
wetlands (Kettenring and Galatowitsch 2011) show similar results to this study. Numerous small
wetlands (<1 km away) contain desirable native species (Carex spp.), but few seeds were found
in the seedbank study suggesting the limited dispersal of these species. Incoming seed to these
degraded wetlands often contain few, if any, of these natives, and, instead, is often dominated by
invasive species, which often come to dominate restoration attempts as has been observed in
many restored wetlands (Galatowitsch and van der Valk 1996a; 1996b; van der Valk 2013).
Because of this, dependence upon the seedbank alone is not enough for restoration of previously
observed vegetation in this area.
It should be noted there was an increase in Typha spp. plants as well as the emergence of
reed canarygrass following herbicide application. These two species are known for their ability
to produce dense, monotypic stands, which tend to suppress native species (Galatowitsch et al.
1999; Green and Galatowitsch 2001; Frieswyk et al. 2007). Reed canarygrass is able to form a
dense network of rhizomes, and also produces a long lasting seedbank that can cause difficulties
with restoration attempts (Adams and Galatowitsch 2008). The use of glyphosate helped to
reduce aboveground distribution of both reed canarygrass and Typha, but reemergence from
seemingly the same area was evident after 3-5 weeks, suggesting a vast network of roots and
rhizomes belowground capable of coping with the effects of herbicide. After numerous
treatments of glyphosate the density and distribution of both species had declined. In late
summer 2014, while removing soil plugs for a transplant procedure, several Typha rhizomes
were found inside of the removed soil plugs. Upon closer examination, they appeared to still be
filled with carbohydrates, but were diminished in total size and appeared “shrunken.” This
32
provides evidence about the vigor of Typha rhizomes, and how difficult they can be to eradicate
once they are established in an area. Distribution of both reed canarygrass and Typha were
reduced with multiple applications of herbicide, but Typha seemed to be more tolerant of the
herbicide taking longer to senesce and producing new shoots sooner after spraying.
It is possible that our application rate of glyphosate was not high enough to efficiently
kill hybrid cattail in this study. Solberg and Higgins (1993) reported nearly 100% extermination
rates of hybrid cattail dominated wetlands in South Dakota that were sprayed with 3.4 kg/ha
glyphosate from a fixed wing aircraft. They reported effects of this treatment lasted up to 4 years
if water levels were consistent to prevent its reseeding. Comes and Kelly (1989) reported 3.4 and
4.4 kg/ha were effective at controlling cattail, but a rate of 2.2 kg/ha was insufficient for
significant reduction. These reported rates are all more potent than label recommended
application for soybeans and may lead to the differences in control between their studies and
ours.
Timing of herbicide application is important for control of reed canarygrass. A
combination of spring burning followed by early application of herbicide is often the most
common treatment for limiting its spread. However, this has been shown to not be the most
effective method for its control. Applying herbicide in late August or late September was more
effective at reducing reed canarygrass biomass than an application in late May (Adams and
Galatowitsch 2006). A possible explanation for this increased herbicide effectiveness is
increased rhizome mortality from a seasonal carbohydrate flux as the plant begins to senesce
after the growing season, as also observed in Hemp Dogbane (Becker and Fawcett 1998). Adams
and Galatowitsch (2006) also found that burning did not reduce existing reed canarygrass plants,
but resulted in the reduction of its seedbank, therefore limiting recolonization after herbicide
33
application. This is supported by our results due to the lack of reed canarygrass present in the
seedbank and its severely limited distribution in the study site.
Our study gives evidence that planting Roundup Ready soybeans for one year and using
multiple rounds of glyphosate for one year to prepare an area before starting a restoration project
will help significantly reduce the seedbank of the site, and lead to less competition for planted
native seed. Previous knowledge of an area is helpful prior to starting a restoration project to
determine the extent of invasion and degradation in an area. Dense stands of reed canarygrass or
Typha spp. may take an additional year of herbicide application to decrease their abundance and
provide a better site for native planting.
This study also provides evidence that prolonged agriculture can significantly alter a
seedbank from that of natural wetlands. The lack of native perennial vegetation in our seedbank
is congruent with results found in O’Connell et al. (2013), where perennial vegetation was
greatly reduced in cropland wetlands. Our study also shows that agricultural practices, not just
the hydric drainage often associated along with it, can significantly alter the seedbanks over time.
Tilling and the use of herbicide, both regular practices in modern agriculture, have been shown
to reduce the seedbank of annual weeds (Schreiber 1992). Tilling alone has also been shown to
have significant impacts on perennial, rhizomatous weeds (Farkas 2002; Gendron and Wilson
2007). Because of this, it may be suggested that regular tilling and herbicide application in
hydric cropland can work to eliminate native plants by breaking up their rhizomes and
preventing them from producing seed, thereby depleting them from the seedbank.
According to the US Fish and Wildlife Service (Karen Smith Personal, Communication),
three years of Roundup Ready cropping is recommended to fully prepare an upland area for
restoration. The Natural Resources Conservation Service Wahpeton office, North Dakota (Steven

34
Cole, Personal Communication) and Rowe (2010) also recommend at least 2-3 year of soybean-
corn rotations for maximum weed control and to help offset preparation costs by leasing to local
farmers. The final year of crop production on a restoration site should be soybeans. Rowe (2010)
suggested this because soybeans do not leave furrows present in the soil and leave only a light
layer of residue on the soil surface that can help planted seeds bind to the soil surface. Time
constraints only allowed one year of soybean preparation, which this study shows can still have a
significant impact on the present seedbank. If there were an additional 2-3 years of cropping with
herbicide applications, the seedbank may be even more depleted that what was shown in this
study.
Management Implications
While the difference in plant composition was not significantly different between the
years, this study shows individual species may be greatly impacted by only a single season of
herbicide, allowing desirable plants to potentially fill the holes left in the community. The
complete loss of Cyperus erythrorhizos from the seedbank was surprising because of the quantity
found the previous year, but inspection of the study site after herbicide reflected the same results
seen in the greenhouse. The increase of annual species such as Lindernia dubia and Hypericum
majus does not come as a surprise because these annual plants produce large quantities of seed
yearly. This may be beneficial from a management perspective because these annual species can
often be suppressed and displaced by seeded native perennial plants and mowing (Török et al.
2012). These annual weeds may act like a cover crop by limiting the amount of exposed soil
available for other weeds to establish (Hartwig and Ammon 2002). This is especially relevant at
the Ekre wetland because the surrounding ditches and pastures have large quantities of reed
35
canarygrass and Typha spp. Regular management will have to be conducted to monitor and, if
deemed necessary, provide action to prevent the encroachment of invaders.
Literature Cited
Adams, C. R. and S. M. Galatowitsch. 2006. Increasing the effectiveness of reed canary grass
(Phalaris arundinancea L.) control in wet meadow restorations. Restoration Ecology
14:441-451.
Adams, C. R. and S. M. Galatowitsch. 2008. The transition from invasive species control to
native species promotion and its dependence on seed density thresholds. Applied
Vegetation Science 11:131-138.
Becker, R. L. and R. S. Fawcett. 1998. Seasonal carbohydrate fluctuation in hemp dogbane
(Apocynum cannabinum) crown roots. Weed Science 46:358-365.
Brock, M. A. 2011. Persistence of seed banks in Australian temporary wetlands. Freshwater
Biology 56:1312-1327.
Cardina, J. and D. H. Sparrow. 1996. A comparison of methods to predict weed seedling
populations from the soil seedbank. Weed Science 44:46–51.
Cole, S. 2014. District Conservationist. Natural Resources Conservation Service – Wahpeton
Field Office. Wahpeton, ND.
Comes, R. D. and A. D. Kelley. 1989. Control of common cattail with postemergence herbicides.
Journal of Aquatic Plant Management 27:20-23.
Crawley, M. J. 1983. Herbivory: the Dynamics of Animal-Plant Interactions. University of
California Press, Los Angeles, CA, USA.
DeVlaming, V. and V. W. Proctor. 1968. Dispersal of aquatic organisms: viability of seeds
recovered from the droppings of captive killdeer and mallard ducks. American Journal of
Botany 55:20-26.
Farkas, A. 2002. Evaluation of tilling systems from the point of view of weed control on brown
forest soil in Godollo. Novenytermeles 51:513-528.
Fenner, M. 1985. Seed Ecology. Chapman and Hall, London, UK.
Figuerola, J., A. J. Green and L. Santamaría. 2002. Comparative dispersal effectiveness of
wigeongrass seeds by waterfowl wintering in south-west Spain: quantitative and
qualitative aspects. Journal of Ecology 90:989-1001.
36
Frieswyk, C. B., C. A. Johnston and J. B. Zedler. 2007. Identifying and characterizing dominant
plants as an indicator of community condition. Journal of Great Lakes Research 33:125-
135.
Galatowitsch, S. M. and A. G. van der Valk. 1995. Natural revegetation during restoration of
wetlands in the southern prairie pothole region of North America. In Restoration of
Temperate Wetlands, ed. B. D. Wheeler, S. C. Shaw, W. I. Fojt, and R. A. Robertson,
129-142. Chichester, England: John Wiley and Sons.
Galatowitsch, S. M. and A. G. van der Valk. 1996a. The vegetation of restored and natural
prairie wetlands. Ecological Applications 6:102-112.
Galatowitsch, S. M. and A. G. van der Valk. 1996b. Characteristics of recently restored wetlands
in the prairie pothole region. Wetlands 16:75-83.
Galatowitsch, S. M., N. O. Anderson and P. D. Ascher. 1999. Invasiveness in wetland plants in
temperate North American Wetlands 19:733-755.
Gendron, F. and S. D. Wilson. 2007. Responses to fertility and disturbance in a low-diversity
grassland. Plant Ecology 191:199-207.
Green, E. K. and S. M. Galatowitsch. 2001. Difference in wetland plant community
establishment with additions of nitrate-N and invasive species (Phalaris arundinacea and
Typha × glauca). Canadian Journal of Botany 79:170-178.
Hartwig, N. L. and H. U. Ammon. 2002. Cover crops and living mulches. Weed Science 50:688-
699.
Henderson, C. B., K. E. Petersen and R. A. Redak. 1988. Spatial and temporal patterns in the
seed bank and vegetation of a desert grassland community. Journal of Ecology. 76:717-
728.
Hill, M. O. and P. A. Stevens. 1981. The density of viable seed in soils of forest plantations in
upland Britain. Journal of Ecology 69:693-709.
Huiskes, A. L., B. P. Koutstaal, P. J. Herman, W. G. Beeftink, M. M. Markusse and W.
Demunck. 1995. Seed dispersal of halophytes in tidal salt marshes. Journal of Ecology
83:559-567.
Kettenring, K. M. and S. M. Galatowitsch. 2011. Seed rain of restored and natural prairie
wetlands. Wetlands 31:283-294.
Kline, V. M. 1997. Planning a restoration. Pages 31-46 in S. Packard and C. F. Mutel, editors.
The Tallgrass Restoration Handbook for Prairies, Savannas, and Woodlands. Island
Press, Washington, D. C.
37
Larkin, D. J., M. J. Freyman, S. C. Lishawa, R. Geddes and N. C. Tuchman. 2012. Mechanisms
of dominance by the invasive hybrid cattail Typha x glauca. Biological Invasions 14:65-
77.
Leck, M. A. and R. L. Simpson. 1987. Seed bank of a freshwater tidal wetland: Turnover and
relationship to vegetation change. American Journal of Botany 74:360-370.
Leck, M. A. and R. L. Simpson. 1995. Ten year seed bank and vegetation dynamics of a tidal
freshwater marsh. American Journal of Botany 82:1547-1557.
Lindgren, D. 2015. Program Technician. Farm Service Agency – Richland County Farm Service
Center Office. Wahpeton, ND.
Middleton, B. 1999. Wetland Restoration, Flood Pulsing, and Disturbance Dynamics. John
Wiley and Sons, New York, NY, USA.
Middleton, B. 2000. Hydrochory, seed banks, and regeneration dynamics along the landscape
boundaries of a forested wetland. Plant Ecology 146:169-184.
Milberg, P. 1995. Soil seed bank after eighteen years of succession from grassland to forest.
Oikos 72:3-13.
Mitsch, W. J. and R. F. Wilson. 1996. Improving the success of wetland creation and restoration
with know-how, time, and self-design. Ecological Applications 6:77-83.
Mueller, M. H. and A. G. van der Valk. 2002. The potential role of ducks in wetland seed
dispersal. Wetlands 22:170-178.
Natural Resources Conservation Service. 2015. NRCS Ecological Site Information System,
Ecological Site Description. Available at:
https://esis.sc.egov.usda.gov/ESDReport/fsReport.aspx?approved=yes&repType=regular
&id=R056XY102ND. Accessed 3/2/2015.
Natural Resources Conservation Service. 2015. NRCS Web Soil Survey. Available at:
http://websoilsurvey.sc.egov.usda.gov/App/WebSoilSurvey.aspx. Accessed 3/2/2015.
North Dakota Agricultural Weather Network. 2014. NDAWN Yearly data for the period of
record. Ekre station. Yearly Rainfall. http://ndawn.ndsu.nodak.edu/get-
table.html?station=75&variable=mdr&year=2015&ttype=monthly&quick_pick=&begin_
date=2013-01&count=24. Accessed: 3/2/2015.
O’Connell, J. L., L. A. Johnson, B. J. Beas, L. M. Smith, S. T. McMurray and D. A. Haukos.
2013. Predicting dispersal-limitation in plants: optimizing planting decisions for isolate
wetland restoration in agricultural landscapes. Biological Conservation 159:343-354.
38
Perez, C. J., S. S. Waller, L.E. Moser, J. L. Stubbendieck and A. A. Steuter. 1998. Seedbank
characteristics of a Nebraska sandhills prairie. Journal of Range Management 51:55-62.
Roberts, H. A. 1981. Seed banks in soil. Advanced Applied Biology 6:1-55.
Rowe, H. I. 2010. Tricks of the trade: Techniques and opinions from 38 experts in tallgrass
prairie restoration. Restoration Ecology 18 No. 2:253-262.
Schreiber, M. M. 1992. Influence of tillage, crop-rotation, and weed management on Giant
Foxtail (Setaria faberi) population-dynamics and corn yield. Weed Science 40:645-653.
Smith, K. 2014. Refuge Manager (Retired). United States Fish and Wildlife Service – Lostwood
National Wildlife Refuge. Kenmare, ND.
Solberg, K. L. and K. F. Higgins. 1993. Effects of glyphosate herbicide on cattails, invertebrates
and waterfowl in South Dakota wetlands. Wildlife Society Bulletin 21:299-307.
Ter Heerdt, G. N. J., G. L. Verweij, R. M. Bekker and J. P. Bakker. 1996. An improved method
for seedbank analysis: Seedling emergence after removing the soil by sieving. Functional
Ecology 10:144-151.
Thompson, K. 1986. Small-scale heterogeneity in an acid grassland seed bank. Journal of
Ecology 74:733-738.
Thompson, K., J. P. Bakker and R. M. Bekker. 1997. The Soil Seed Banks of North West
Europe: Methodology, Density, and Longevity. Cambridge University Press, Cambridge,
United Kingdom. 276 pp.
Thompson, K. and J. P. Grime. 1979. Seasonal variation in the seed banks of herbaceous species
in ten contrasting habitats. Journal of Ecology 67:893-921.
Török, P., T. Miglécz, O. Valkó, A. Kelemen, B. Deák, S. Lengyel and B. Tóthmérész. Recovery
of native grass biodiversity by sowing on former croplands: Is weed suppression a
feasible goal for grassland restoration? Journal for Nature Conservation 20:41-48.
United States Department of Commerce. National Oceanic and Atmospheric Administration.
2015. NOAA Summary of month normals 1981-2010 McCleod station 3E, ND, US.
Available at: http://www.ncdc.noaa.gov/cdo-web/datasets. Accessed 1/20/15.
van der Valk, A. G. 1999. Succession theory and wetland restoration. In: Proceedings of
INTEC0L’ V International Wetlands Conference, Perth, Australia, pp. 31-47.
van der Valk, A. G. 2013. Seed banks of drained floodplain, drained palustrine, and undrained
wetlands in Iowa, USA. Weltands 33:183-190.
39
van der Valk, A. G., L. A. Toth, E. B. Gibney, D. Mason and P. R. Wetzel. 2009. Potential
sources of propagules for reestablishing vegetation on the floodplain of the Kissimmee
River, Florida, USA. Wetlands 29:976-987.
Wienhold, C. E. and A. G. van der Valk. 1989. The impact of duration of drainage on the seed
banks of northern prairie wetlands. Canadian Journal of Botany 67:1878-1884.
Wilson, S. D. and M. Partel. 2003. Extirpation or coexistence? Management of a persistent
introduced grass in a prairie restoration. Restoration Ecology 11:410-416.
40
PAPER 2. WETLAND RESTORATION TECHNIQUES AND THEIR ASSOCIATED
COSTS FOR SOUTHEASTERN NORTH DAKOTA
Abstract
Wetland restoration is often a time consuming and expensive process with results that can
be highly variable. Many different methods exist for the restoration of wetlands, but each
situation is unique and no one method is guaranteed to be effective. In many cases, funding is the
limiting factor to the restoration process, and thus limits what may be done when better options
are available. Restoration of vegetation is often the quickest aspect of a wetland to be restored,
and preempts the return of other wetland processes such as nutrient cycling and establishment of
wetland soils. In this experiment, we utilized three different restoration methods: (1) seed only;
(2) seed and hay mulch; and (3) seed, hay mulch, and transplanted wetland soil plugs. We also
looked at the estimated costs associated with implementing each of these methods and evaluated
them at the per hectare level. Cost per hectare increased with the increase in restoration efforts.
Treatment costs are as follows: seed only was estimated at $1,963/ha; seed and hay mulch at
$2,342/ha; and seed, hay mulch, and soil plugs at $5,145/ha. Future research will be done on
these constructed plots to help analyze the cost/benefit ratio of these different restoration
combinations and their resemblance in form and function to nearby “reference” wetlands.
Introduction
Wetland restoration and management in the United States has undergone several
advancements since its inception in the 1970’s (Mitsch and Gosselink 2007). Scientists have also
identified wetland qualities that can be used to assess their functioning in the environment. Many
early restorations focused on restoring hydrological regimes to an area, believing that vegetation
would restore itself. While this is true to an extent, the type of vegetation that reestablished on its
41
own was often very different than that of “natural”, reference wetlands in the area (Galatowitsch
and van der Valk 1996a). In their study, Galatowitsch and van der Valk (1996a) found that entire
guilds of plants occurring in natural wetlands were missing from these hydrologically restored
wetlands, and a potential cause for this discrepancy was the native species’ poor dispersal ability.
After years of cropping and drainage, seed banks can be depleted to the point where naturally
occurring wetland species are eliminated (Wienhold and van der Valk 1989). Without the
recolonization of these restored wetlands by native species, the resulting open areas are prone to
invasion.
Invasion of restored wetlands by unwanted plant species is an ever growing issue
impacting restoration attempts across the United States. In the Prairie Pothole Region (PPR),
some common hindrances to current restoration attempts are Phalaris arundinacea (reed
canarygrass) and Typha spp. (cattails). These species are effective in quickly establishing
themselves in recently disturbed sites, such as those created with the restoration of water to a
wetland (Lindig-Cisneros and Zedler 2002). Reed canarygrass is of great concern due to its
ability to prolifically spread its seed across the landscape, and the ability of this seed to produce
vigorous seedlings that can rapidly establish themselves on moist soil (Wasser 1982). Once
established, it is then able to rapidly dominate an area by vegetative reproduction and create
dense colonies that shade out other, generally native species attempting to become established
(Maurer and Zedler 2002). Because of this, it is important to rapidly establish vegetation cover
on restoration sites to prevent the establishment of species such as reed canarygrass. Linding-
Cisneros and Zedler (2002) suggest using a species-rich seed mix when seeding sites so a more
complex vegetative canopy can establish to resist invasion, planting multiple times or using soil
42
plugs, and including broad-leaved plants in the seed mixture to work in unison to combat reed
canarygrass in the system and ensure it remains a minor component, when present.
Typha spp. add a similar, yet different, problem to restoration attempts in our region.
There are three species of cattail found in the PPR, Typha angustifolia (narrowleaf cattail),
Typha latifolia (broadleaf cattail), and their hybrid Typha × glauca (hybrid cattail). Broadleaf
cattail is a native to this region, and is often found in deep marsh areas of natural wetlands
(Stewart and Kantrud 1972). Narrowleaf cattail is of an unknown origin but is believed to have
arrived here sometime in the past 200 years, and now is often found in wetlands where broadleaf
is present (Smith 1987). This species can persist in both the shallow and deep marshes of
wetlands, but tends to tolerate more variable water depths than broadleaf. These two species do
have the potential to become invasive, but are much less likely to do so than their offspring.
Hybrid cattail was once believed to be sterile, like most hybrids, but recently it is assumed to be
only partially sterile (Travis et al. 2010). This hybrid cattail does not take over an area as rapidly
as reed canarygrass does, as shown by Green and Galatowitsch (2001). Their study, however,
was short term (4 months) and did not look at the impacts it can have on the community
composition as time goes on. It has been shown to grow in a wider variety of water conditions
than either parent (Waters and Shay 1990; 1992). Hybrid cattail influences native plant
communities by producing an abundance of slowly decaying litter each season which can act to
change soil characteristics such as nitrogen mineralization and soil organic matter (Farrer and
Goldberg 2009). This buildup of litter then works against native species not only by changing
soil characteristics, but also by producing a dense litter mat that shades out, or physically blocks
native seedling emergence. Farrer and Goldberg (2009) showed a 98% reduction of light
penetration through cattail litter buildup. Because of the influence this litter accumulation can

43
have on the plant community, it is important to prevent such accumulation. Elimination of live
plants is not enough to prevent the replacing of natives. Two commonly used approaches to
reduce litter levels are prescribed fire and harvest. Prescribed fire is a cheap, efficient way to
remove this layer but can be counterproductive if it’s used at the wrong time or incorrect
intensity (Thompson and Shay 1985). Harvesting is another option for litter removal, but is often
costly and time-consuming on large scales making it an infeasible option (Larkin et al. 2012).
Very few restoration studies have been completed to date that include detailed
explanations of costs. Cost of a restoration project is very important to consider, and often
dictates whether a project is initiated or not. Studies on restoration cost estimates often fail to
include all costs associated with the project. In an estimate of small (0.4 ha), seasonal wetland
restorations, Zentner et al. (2003) noted their estimates excluded the additional costs of land
acquisition; planning, permitting, and engineering; and monitoring and maintenance. Despite
missing these important, often expensive pieces, they estimated restoration costs from $12,000 to
$42,000/acre ($30,000 to $104,000/ha). These costs included native reseeding and land
preparation only. Wetland construction costs were also evaluated on private hydric cropland in
Missouri. These costs were estimated to range from $50 to $200/acre ($125 to $500/ha) (Prato et
al. 1995). However, these prices have not been adjusted for inflation and only included the costs
associated with earth work, water control structures, and grass seeding for erosion control.
Estimates of mitigation projects also vary. In a survey of public works agencies, Zentner et al.
(2003) found estimations for the creation/restoration/enhancement for mitigation ranges from
$50,000 to $500,000/acre ($124,000 to $1,240,000/ha). These costs are highly dependent upon
project design and location, and also differ greatly when completed by public vs. non-profit
agencies (Zentner et al. 2003).
44
The use of native hay transfer to aid native seed establishment is becoming a frequently
utilized practice in restoration attempts. Its use has been shown to increase species diversity and
helps to suppress weedy species which can inhibit establishment of natives (Török et al. 2012).
Hay mulch works to aid establishment in many ways. It prevents soil desiccation (Fowler 1988),
buffers the soil from large temperature fluctuations (Foster and Gross 1998), may act as a
physical barrier to wind dispersed weeds preventing them from making soil contact (Wedin and
Tilman 1993), and also may exhibit some allelopathic effects (Ruprecht et al. 2010). In addition
to the inhibition of weedy species early in the restoration, it can also act as an additional seed
source to complement plantings and those found in the seedbank (Klimkowska et al. 2010).
In this study we introduce potential methods to reclaim wetlands invaded and/or
completely dominated by invasive species such as cattail and reed canarygrass. The wetland we
utilized for this project already contained invasive species when the project began. We also look
at estimated total costs associated with the three different treatment methods outlined in this
study: (1) seed only; (2) seed and native hay mulch; and (3) seed, native hay mulch, and
transplanted vegetation plugs. We also address future research that can be done at these sites to
estimate the cost efficiency of each treatment, and estimate the rate of spread of transplanted wet
meadow soil plugs.
Methods
Study Site
This study was conducted on an 18.86 ha area located on the Albert Ekre Grassland
Preserve in Richland County, North Dakota, approximately two kilometers east of the Sheyenne
National Grasslands (Latitude 46.526224; Longitude -97.132370) (Figure 2.1). This area is
characterized by sandy soils that originated from an ancient river that made its way through the
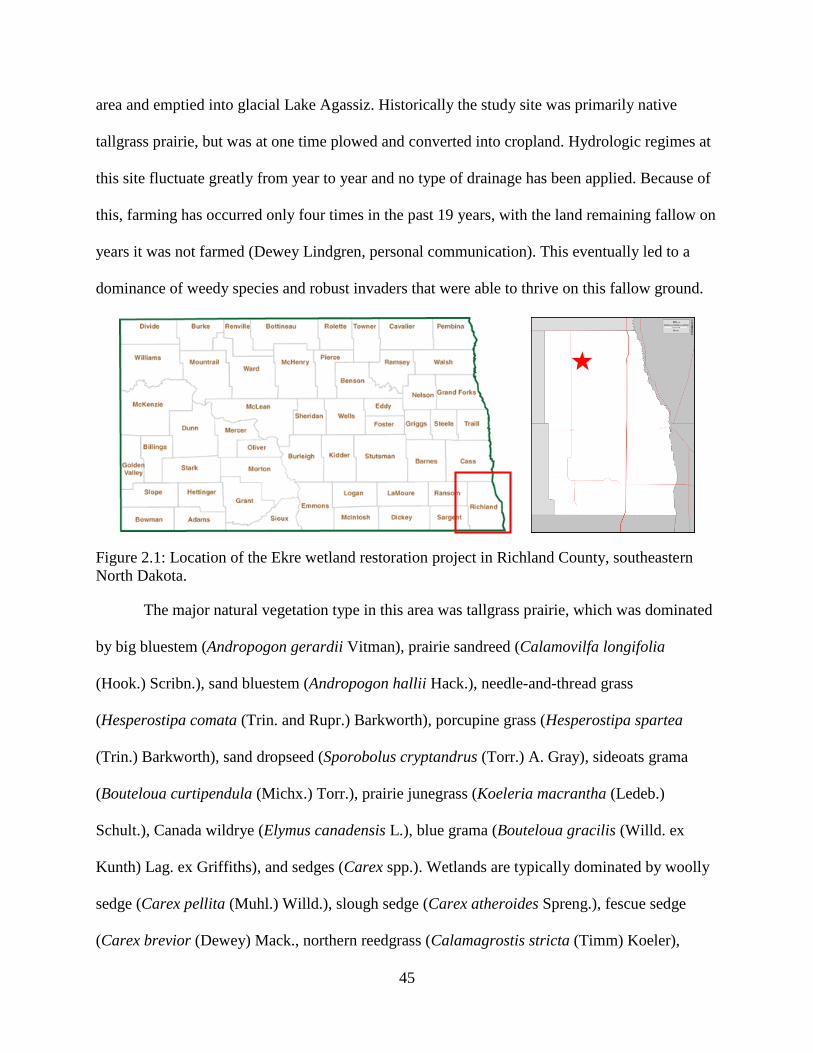
45
area and emptied into glacial Lake Agassiz. Historically the study site was primarily native
tallgrass prairie, but was at one time plowed and converted into cropland. Hydrologic regimes at
this site fluctuate greatly from year to year and no type of drainage has been applied. Because of
this, farming has occurred only four times in the past 19 years, with the land remaining fallow on
years it was not farmed (Dewey Lindgren, personal communication). This eventually led to a
dominance of weedy species and robust invaders that were able to thrive on this fallow ground.
Figure 2.1: Location of the Ekre wetland restoration project in Richland County, southeastern
North Dakota.
The major natural vegetation type in this area was tallgrass prairie, which was dominated
by big bluestem (Andropogon gerardii Vitman), prairie sandreed (Calamovilfa longifolia
(Hook.) Scribn.), sand bluestem (Andropogon hallii Hack.), needle-and-thread grass
(Hesperostipa comata (Trin. and Rupr.) Barkworth), porcupine grass (Hesperostipa spartea
(Trin.) Barkworth), sand dropseed (Sporobolus cryptandrus (Torr.) A. Gray), sideoats grama
(Bouteloua curtipendula (Michx.) Torr.), prairie junegrass (Koeleria macrantha (Ledeb.)
Schult.), Canada wildrye (Elymus canadensis L.), blue grama (Bouteloua gracilis (Willd. ex
Kunth) Lag. ex Griffiths), and sedges (Carex spp.). Wetlands are typically dominated by woolly
sedge (Carex pellita (Muhl.) Willd.), slough sedge (Carex atheroides Spreng.), fescue sedge
(Carex brevior (Dewey) Mack., northern reedgrass (Calamagrostis stricta (Timm) Koeler),
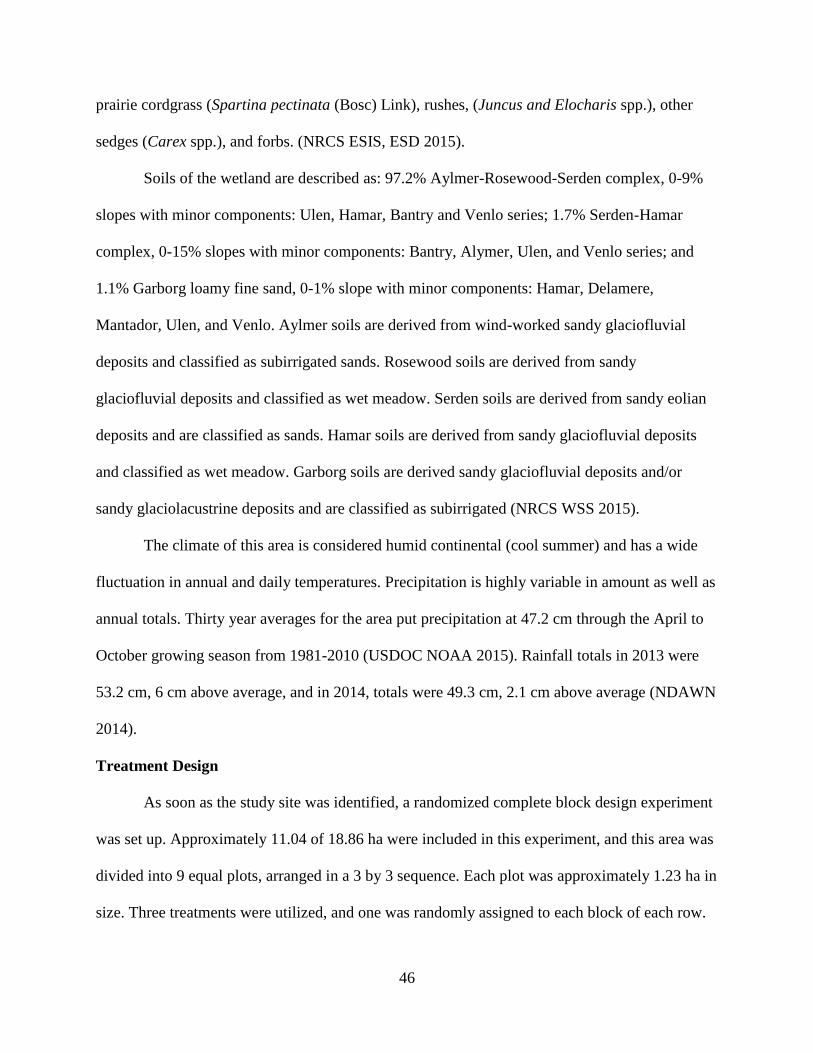
46
prairie cordgrass (Spartina pectinata (Bosc) Link), rushes, (Juncus and Elocharis spp.), other
sedges (Carex spp.), and forbs. (NRCS ESIS, ESD 2015).
Soils of the wetland are described as: 97.2% Aylmer-Rosewood-Serden complex, 0-9%
slopes with minor components: Ulen, Hamar, Bantry and Venlo series; 1.7% Serden-Hamar
complex, 0-15% slopes with minor components: Bantry, Alymer, Ulen, and Venlo series; and
1.1% Garborg loamy fine sand, 0-1% slope with minor components: Hamar, Delamere,
Mantador, Ulen, and Venlo. Aylmer soils are derived from wind-worked sandy glaciofluvial
deposits and classified as subirrigated sands. Rosewood soils are derived from sandy
glaciofluvial deposits and classified as wet meadow. Serden soils are derived from sandy eolian
deposits and are classified as sands. Hamar soils are derived from sandy glaciofluvial deposits
and classified as wet meadow. Garborg soils are derived sandy glaciofluvial deposits and/or
sandy glaciolacustrine deposits and are classified as subirrigated (NRCS WSS 2015).
The climate of this area is considered humid continental (cool summer) and has a wide
fluctuation in annual and daily temperatures. Precipitation is highly variable in amount as well as
annual totals. Thirty year averages for the area put precipitation at 47.2 cm through the April to
October growing season from 1981-2010 (USDOC NOAA 2015). Rainfall totals in 2013 were
53.2 cm, 6 cm above average, and in 2014, totals were 49.3 cm, 2.1 cm above average (NDAWN
2014).
Treatment Design
As soon as the study site was identified, a randomized complete block design experiment
was set up. Approximately 11.04 of 18.86 ha were included in this experiment, and this area was
divided into 9 equal plots, arranged in a 3 by 3 sequence. Each plot was approximately 1.23 ha in
size. Three treatments were utilized, and one was randomly assigned to each block of each row.
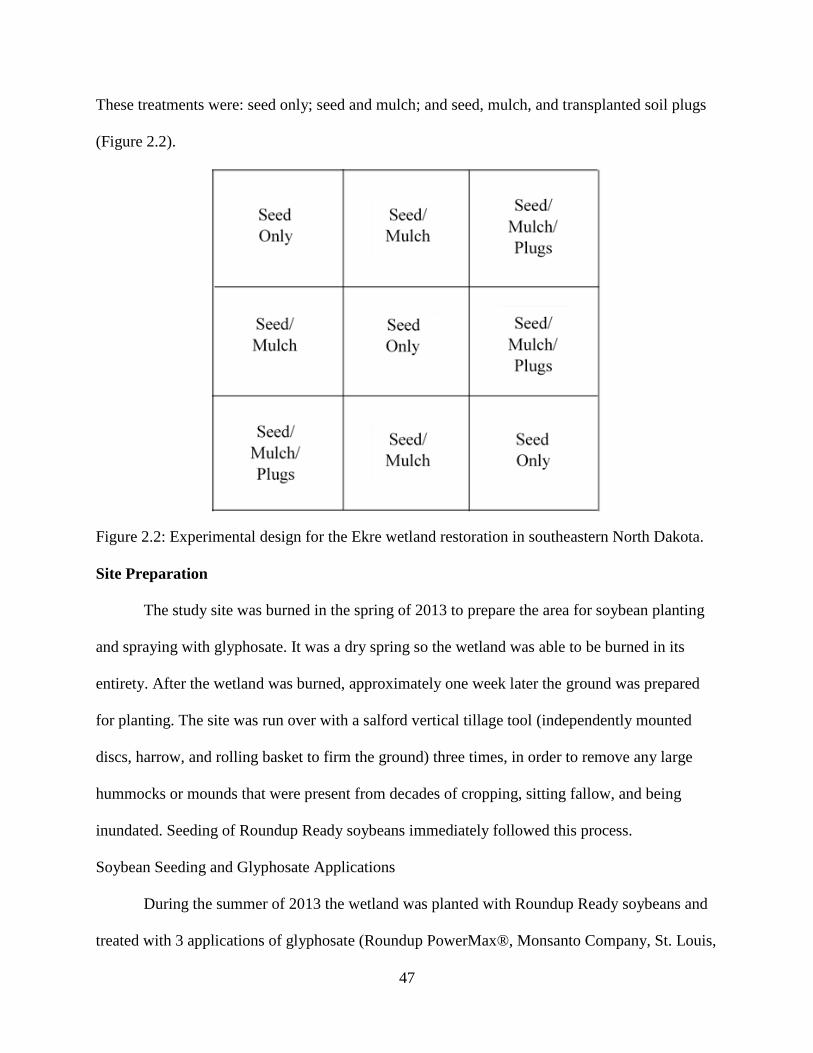
47
These treatments were: seed only; seed and mulch; and seed, mulch, and transplanted soil plugs
(Figure 2.2).
Figure 2.2: Experimental design for the Ekre wetland restoration in southeastern North Dakota.
Site Preparation
The study site was burned in the spring of 2013 to prepare the area for soybean planting
and spraying with glyphosate. It was a dry spring so the wetland was able to be burned in its
entirety. After the wetland was burned, approximately one week later the ground was prepared
for planting. The site was run over with a salford vertical tillage tool (independently mounted
discs, harrow, and rolling basket to firm the ground) three times, in order to remove any large
hummocks or mounds that were present from decades of cropping, sitting fallow, and being
inundated. Seeding of Roundup Ready soybeans immediately followed this process.
Soybean Seeding and Glyphosate Applications
During the summer of 2013 the wetland was planted with Roundup Ready soybeans and
treated with 3 applications of glyphosate (Roundup PowerMax®, Monsanto Company, St. Louis,
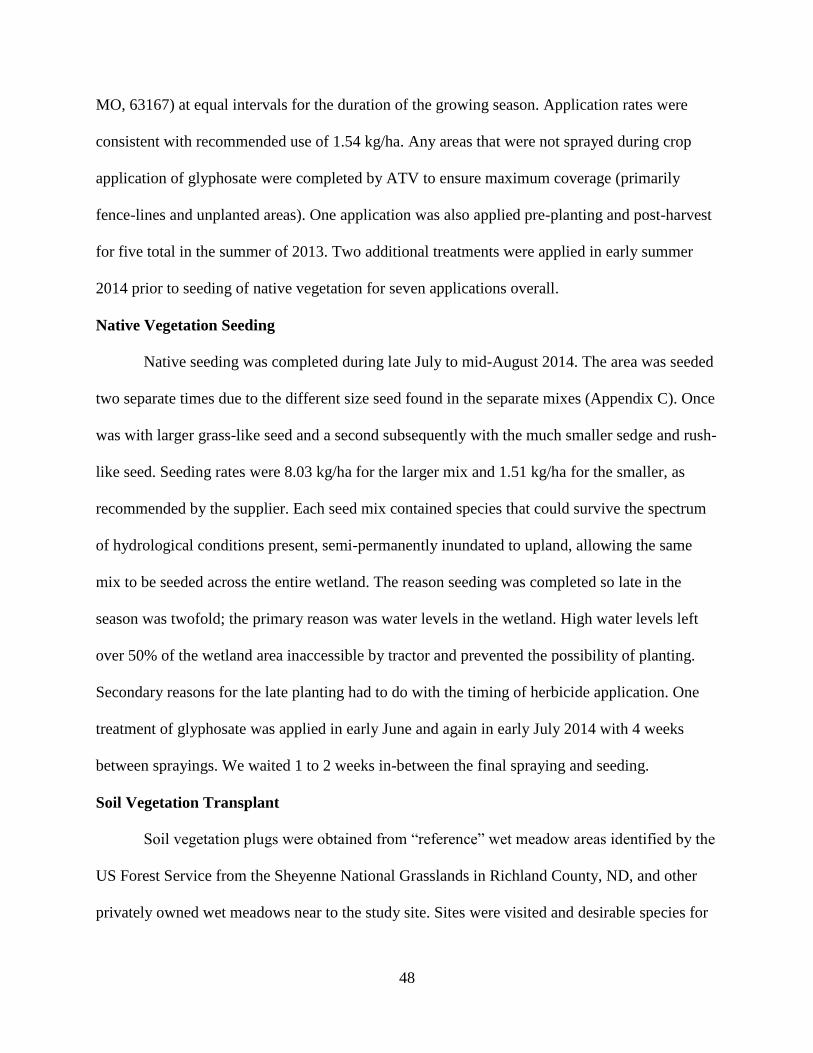
48
MO, 63167) at equal intervals for the duration of the growing season. Application rates were
consistent with recommended use of 1.54 kg/ha. Any areas that were not sprayed during crop
application of glyphosate were completed by ATV to ensure maximum coverage (primarily
fence-lines and unplanted areas). One application was also applied pre-planting and post-harvest
for five total in the summer of 2013. Two additional treatments were applied in early summer
2014 prior to seeding of native vegetation for seven applications overall.
Native Vegetation Seeding
Native seeding was completed during late July to mid-August 2014. The area was seeded
two separate times due to the different size seed found in the separate mixes (Appendix C). Once
was with larger grass-like seed and a second subsequently with the much smaller sedge and rush-
like seed. Seeding rates were 8.03 kg/ha for the larger mix and 1.51 kg/ha for the smaller, as
recommended by the supplier. Each seed mix contained species that could survive the spectrum
of hydrological conditions present, semi-permanently inundated to upland, allowing the same
mix to be seeded across the entire wetland. The reason seeding was completed so late in the
season was twofold; the primary reason was water levels in the wetland. High water levels left
over 50% of the wetland area inaccessible by tractor and prevented the possibility of planting.
Secondary reasons for the late planting had to do with the timing of herbicide application. One
treatment of glyphosate was applied in early June and again in early July 2014 with 4 weeks
between sprayings. We waited 1 to 2 weeks in-between the final spraying and seeding.
Soil Vegetation Transplant
Soil vegetation plugs were obtained from “reference” wet meadow areas identified by the
US Forest Service from the Sheyenne National Grasslands in Richland County, ND, and other
privately owned wet meadows near to the study site. Sites were visited and desirable species for
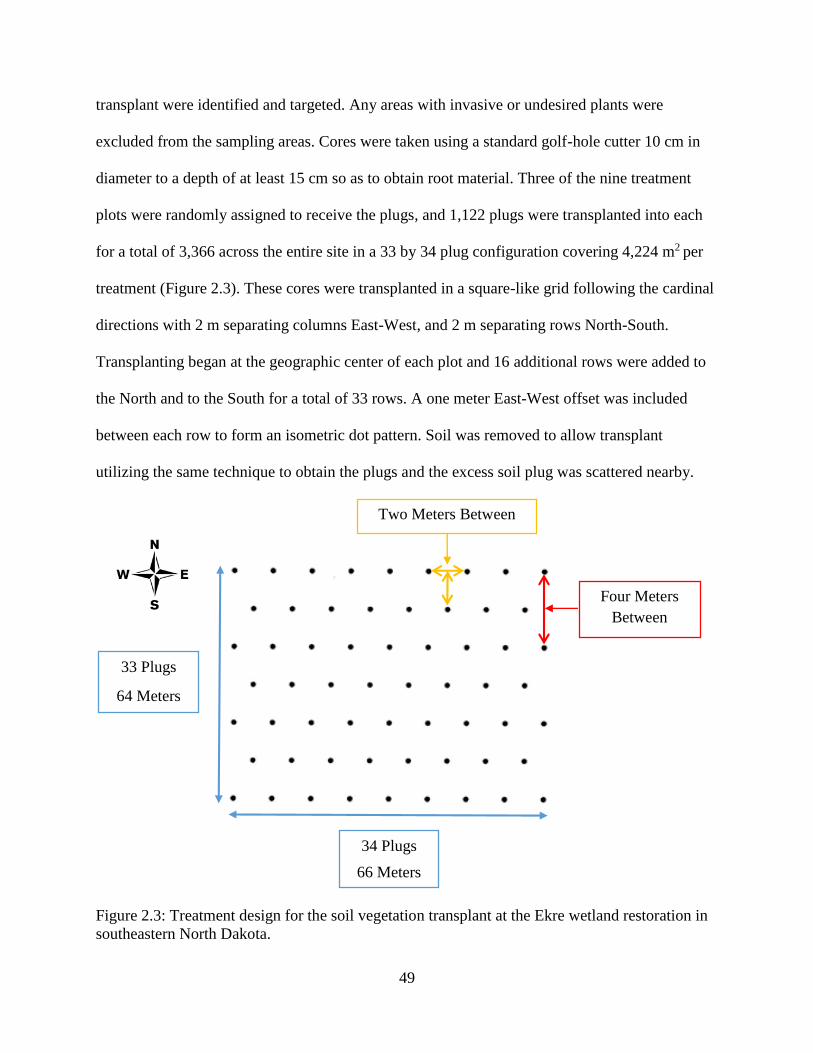
49
transplant were identified and targeted. Any areas with invasive or undesired plants were
excluded from the sampling areas. Cores were taken using a standard golf-hole cutter 10 cm in
diameter to a depth of at least 15 cm so as to obtain root material. Three of the nine treatment
plots were randomly assigned to receive the plugs, and 1,122 plugs were transplanted into each
for a total of 3,366 across the entire site in a 33 by 34 plug configuration covering 4,224 m2 per
treatment (Figure 2.3). These cores were transplanted in a square-like grid following the cardinal
directions with 2 m separating columns East-West, and 2 m separating rows North-South.
Transplanting began at the geographic center of each plot and 16 additional rows were added to
the North and to the South for a total of 33 rows. A one meter East-West offset was included
between each row to form an isometric dot pattern. Soil was removed to allow transplant
utilizing the same technique to obtain the plugs and the excess soil plug was scattered nearby.
Figure 2.3: Treatment design for the soil vegetation transplant at the Ekre wetland restoration in
southeastern North Dakota.
34 Plugs
66 Meters
33 Plugs
64 Meters
Four Meters
Between
Two Meters Between
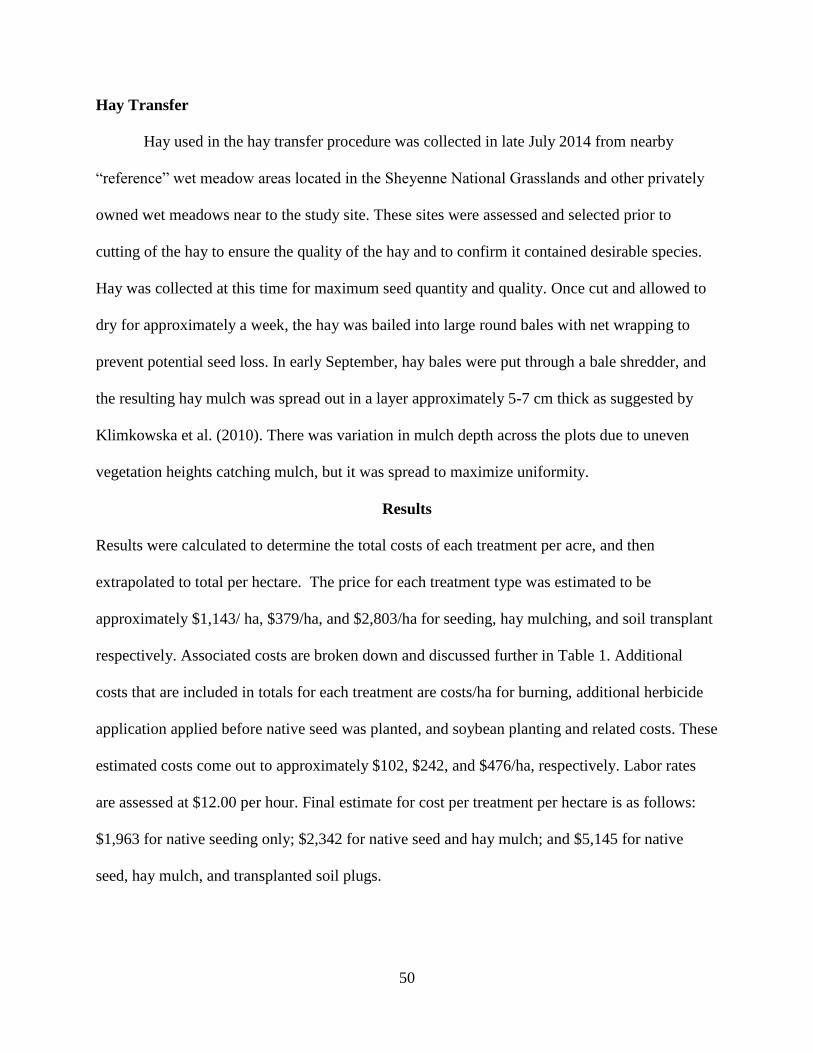
50
Hay Transfer
Hay used in the hay transfer procedure was collected in late July 2014 from nearby
“reference” wet meadow areas located in the Sheyenne National Grasslands and other privately
owned wet meadows near to the study site. These sites were assessed and selected prior to
cutting of the hay to ensure the quality of the hay and to confirm it contained desirable species.
Hay was collected at this time for maximum seed quantity and quality. Once cut and allowed to
dry for approximately a week, the hay was bailed into large round bales with net wrapping to
prevent potential seed loss. In early September, hay bales were put through a bale shredder, and
the resulting hay mulch was spread out in a layer approximately 5-7 cm thick as suggested by
Klimkowska et al. (2010). There was variation in mulch depth across the plots due to uneven
vegetation heights catching mulch, but it was spread to maximize uniformity.
Results
Results were calculated to determine the total costs of each treatment per acre, and then
extrapolated to total per hectare. The price for each treatment type was estimated to be
approximately $1,143/ ha, $379/ha, and $2,803/ha for seeding, hay mulching, and soil transplant
respectively. Associated costs are broken down and discussed further in Table 1. Additional
costs that are included in totals for each treatment are costs/ha for burning, additional herbicide
application applied before native seed was planted, and soybean planting and related costs. These
estimated costs come out to approximately $102, $242, and $476/ha, respectively. Labor rates
are assessed at $12.00 per hour. Final estimate for cost per treatment per hectare is as follows:
$1,963 for native seeding only; $2,342 for native seed and hay mulch; and $5,145 for native
seed, hay mulch, and transplanted soil plugs.
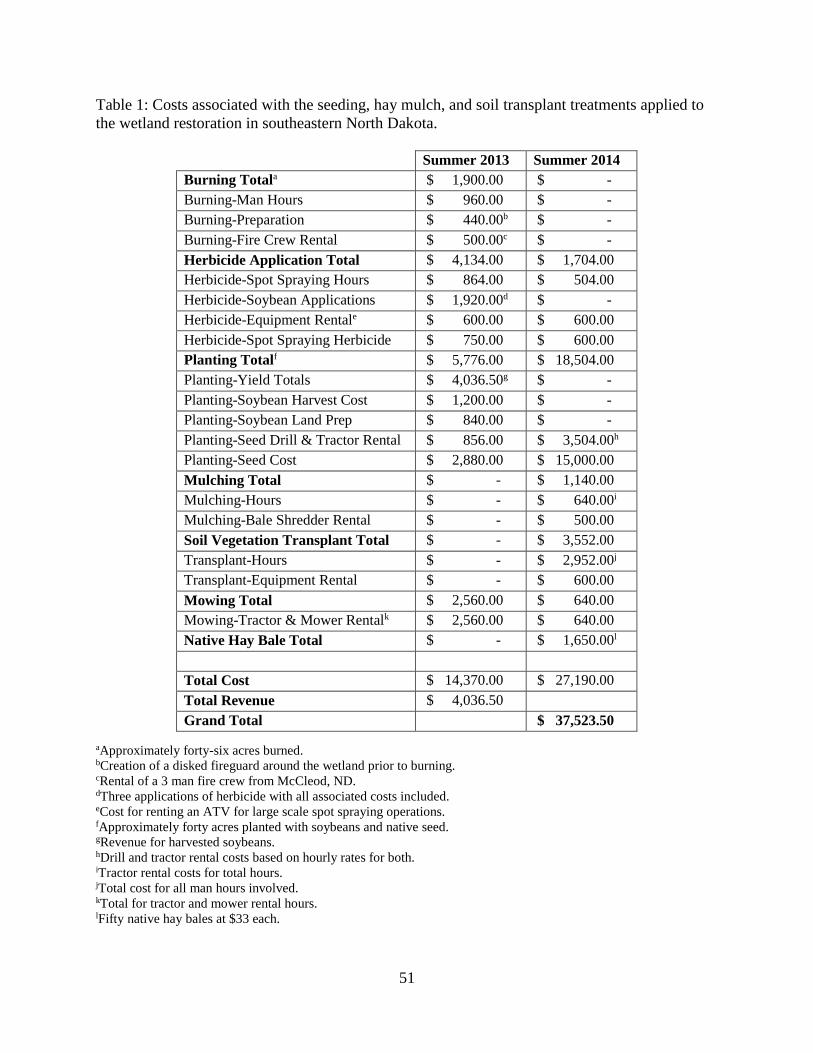
51
Table 1: Costs associated with the seeding, hay mulch, and soil transplant treatments applied to
the wetland restoration in southeastern North Dakota.
Summer 2013 Summer 2014
Burning Totala $ 1,900.00 $ -
Burning-Man Hours $ 960.00 $ -
Burning-Preparation $ 440.00b $ -
Burning-Fire Crew Rental $ 500.00c $ -
Herbicide Application Total $ 4,134.00 $ 1,704.00
Herbicide-Spot Spraying Hours $ 864.00 $ 504.00
Herbicide-Soybean Applications $ 1,920.00d $ -
Herbicide-Equipment Rentale $ 600.00 $ 600.00
Herbicide-Spot Spraying Herbicide $ 750.00 $ 600.00
Planting Totalf $ 5,776.00 $ 18,504.00
Planting-Yield Totals $ 4,036.50g $ -
Planting-Soybean Harvest Cost $ 1,200.00 $ -
Planting-Soybean Land Prep $ 840.00 $ -
Planting-Seed Drill & Tractor Rental $ 856.00 $ 3,504.00h
Planting-Seed Cost $ 2,880.00 $ 15,000.00
Mulching Total $ - $ 1,140.00
Mulching-Hours $ - $ 640.00i
Mulching-Bale Shredder Rental $ - $ 500.00
Soil Vegetation Transplant Total $ - $ 3,552.00
Transplant-Hours $ - $ 2,952.00j
Transplant-Equipment Rental $ - $ 600.00
Mowing Total $ 2,560.00 $ 640.00
Mowing-Tractor & Mower Rentalk $ 2,560.00 $ 640.00
Native Hay Bale Total $ - $ 1,650.00l
Total Cost $ 14,370.00 $ 27,190.00
Total Revenue $ 4,036.50
Grand Total $ 37,523.50
aApproximately forty-six acres burned.
bCreation of a disked fireguard around the wetland prior to burning. cRental of a 3 man fire crew from McCleod, ND. dThree applications of herbicide with all associated costs included. eCost for renting an ATV for large scale spot spraying operations. fApproximately forty acres planted with soybeans and native seed.
gRevenue for harvested soybeans. hDrill and tractor rental costs based on hourly rates for both. iTractor rental costs for total hours. jTotal cost for all man hours involved. kTotal for tractor and mower rental hours. lFifty native hay bales at $33 each.
52
Discussion
As predicted, total cost goes up as treatment level increases. The more labor and time
intensive the treatment, the more it costs per hectare to restore. Since only one year of Roundup
Ready cropping was utilized in this study due to time constraints, our cropping costs are less than
would be predicted if 2-3 years were utilized. However, if the land is leased for cropping, this
could lower the costs by removing cropping costs entirely and possibly saving money depending
upon the terms of the lease. At this time we cannot make a certain conclusion as to the
effectiveness of any treatment, but we predict the most intensive treatment (i.e. Seed, Mulch, and
Plugs) will contain a higher diversity of desirable plant species, based on initial observations at
the conclusion of work on the treatment sites in Fall 2014.
The estimates we make here are likely to vary greatly with location of the restoration
which influences the choice of native seed mix. Pay rates may also be different than those
utilized in this study. Hourly wages were estimated at $12.00 per hour, and were completed by a
graduate student. These rates are unlikely to carry over when work is completed by
professionals. Seeding methods may also vary greatly between restorations. Hydroseeding often
is a more expensive process than regular drill seeding, and the transplant of live root material is
more expensive than either method individually. Zentner et al. (2003) estimated hydroseeding for
their restoration to cost $4,000/acre ($9,900/ha), and transplanting of live plants to be $8,500 to
$34,000/acre ($21,000 to $84,000/ha). However, these costs took into account a variety of
transplant “plug” sizes at 0.6 to 0.9 meter planting intervals. The drastic difference in
transplanting cost compared to our study comes mainly from the cost of obtaining plugs. Soil
plugs in our study were donated versus having to be purchased, as in Zentner’s study at $6.00 per
plug. While our results may differ from these other studies, we offer one estimate as to overall
53
project costs. Contingent upon the situation, project costs may differ drastically from those
offered here.
The use of hay mulch as a source of seed is a commonly used practice. Studies done in
Europe (Kiehl et al. 2006; Edwards et al. 2007; Klimkowska et al. 2010), Canada (Desserud and
Naeth 2011), and the United States (Gates 1962) have supported its use as a beneficial source of
native seed. The type of hay transferred is also an important factor. The use of either dried or
wet, fresh cut hay has also been utilized. In an evaluation of many restoration projects across
Europe, Kiehl et al. (2010) found many studies that utilized wet hay transfer instead of dry. This
wet hay has potentially higher seed content and is suggested to be much more promising in
restoration than using dry hay (Rasran et al. 2006). Kiehl et al. (2010) suggested the use of dry
hay as a seed source is limited because the cutting, turning, and swathing necessary to dry hay
will reduce the seed content considerably. The results of our study have yet to be determined, but
dry hay has been shown to aid in the establishment and development of seeded native species
(Kirmer et al. 2012; Török et al. 2012), and also have no impact on their establishment (Bakker
et al. 2003).
The transplant of wetland soil as a restoration technique is a relatively new method which
is gaining popularity. Transplant of the seed bank and root material in the soil gives these species
a jump start on establishment. This is especially useful for species that have limited dispersal
and/or colonize slowly. Fraser and Kindscher (2001), found sod transplanting to be an effective
method for vegetative restoration with species that spread quickly (Eleocharis macrostachya)
and those that have limited reproduction from seed alone (Spartina pectinata). These
transplanted rhizomes are able to rapidly spread once they have been replanted. Many plant
species have been shown to reproduce rapidly through clonal growth (Clevering and van Guilik
54
1997; Brewer et al. 1998), and these growth rates have been suggested to continue for decades
(Frenkel and Boss 1988). Fraser and Kindscher (2001), found their transplanted vegetation plugs
to have exponential growth over a four year period.
Consideration of which species to transplant is also important. While some wet meadow
species can naturally disperse from adjacent wetlands, important species such as Carex spp. and
Spartina pectinata have been shown to have limited dispersal and poor reproduction from seed
(Schütz 2000). Budelsky and Galatowitsch (1999), found that Carex spp. seeds have a specific
set of conditions that are necessary for germination to occur, and even when those are met,
germination rates can still be at best approximately 50%. Because of this, restoration of naturally
occurring wet meadow vegetation is difficult to complete. Galatowitsch and van der Valk
(1996b) found that after restoration had occurred, reference like wet prairie and sedge meadow
zones had failed to appear on many of their sites. The depletion of these species from the
landscape, and possibly the seedbank, following degradation is evident in their analysis. These
species are important to the wet prairie/meadow medley, so they need to be restored on the
landscape. Fraser and Kindscher (2005) recommend planting many small (20 cm diameter) soil
plugs to reestablish difficult wet meadow species such as Spartina pectinata, and to maximize
area in the restoration. Their study showed promising results with plugs becoming established
and increasing in area, although densities and stem counts were still less than reference
populations.
The removal of soil for transplanting can have significant impacts on the original site
from which the soil is taken. This removal can leave holes in the landscape mosaic which may be
utilized by rapidly spreading exotic species to establish a foothold in the landscape, or create an
area that is prone to soil erosion (Davis and Short 1997). Few, if any, studies have been done on
55
the impacts of soil plug removal on donor sites, suggesting this is an area where more research
may be needed. One way to alleviate these effects is to salvage vegetation from native areas
destined for impact, and utilizing the vegetation in mitigation restorations for better native
establishment (Fraser and Kindscher 2001).
The economics of hydric cropland to wetland conversion is a topic that has not been
extensively examined. One possible reason for this is the difficulty of estimating the value of
services provided by wetlands. Costanza et al. (1997) completed an estimate of the value of
wetland services, but not many studies have been completed for individual wetlands. Wetland
functioning, and therefore value, may vary drastically across a small landscape, further
complicating this valuation process. A geoeconomic study of the conversion of hydric cropland
to wetland in Missouri was completed by Prato et al. (1995), and showed as long as benefits of
the restoration remain high, it is more profitable to the landowner than continued cropping. The
only benefits they acknowledged of restoring these wetlands, however, was money that
landowner could make from leasing the land to waterfowl hunters. Hammack and Brown (1974)
looked at the value of wetlands by putting a monetary value on the waterfowl produced from
them, and the loss of revenue from waterfowl if these wetlands were to disappear from the
landscape.
Management Implications
What is often lacking in many restoration attempts is a post management plan. We look
to conclude this study by offering insight as to what we believe to be an effective management
strategy to monitor the progress, and determine if intervention is necessary to ensure its
continued success. No large scale follow-up study should be done for at least five years post
restoration to allow the plant community to stabilize. However, the site should be visited

56
regularly to ensure that undesirable species are prevented from dominating the trials and data
should be gathered to track species establishment. Direct intervention and control may need to be
used if it is found invasive species are encroaching. As there are pockets of woody species found
along the edges of the wetland, it may be necessary to implement a burn plan and burn the
wetland frequently (1-2 years) to prevent their encroachment after seeded species are established.
We suggest starting in summer of 2016 to complete an analysis of the treatment areas.
These early samplings (< 5 years post restoration) can give vital information on early succession
in restored wetlands, and allow monitoring for future restorations. With these data it may be
possible to predict trends in future projects and provide information on when/if intervention is
needed to keep a project on track. We predict the first few years post restoration will result in the
area being covered with many annual weeds prior to perennial grasses and grass-likes
establishing, as discovered by Rowe (2010). For sampling protocol, we recommend starting the
center of each plot and moving out 2 m from center in the four cardinal directions for each
additional point, and taking modified Daubenmire readings with a .25 m2 quadrat utilizing the six
cover classes. Each treatment will have 17 readings, four from each length away from center and
one from the center to determine species composition and cover (Figure 2.4). These results can
then be analyzed with a standard ANOVA to determine if there are significant differences
between composition and cover across treatments.
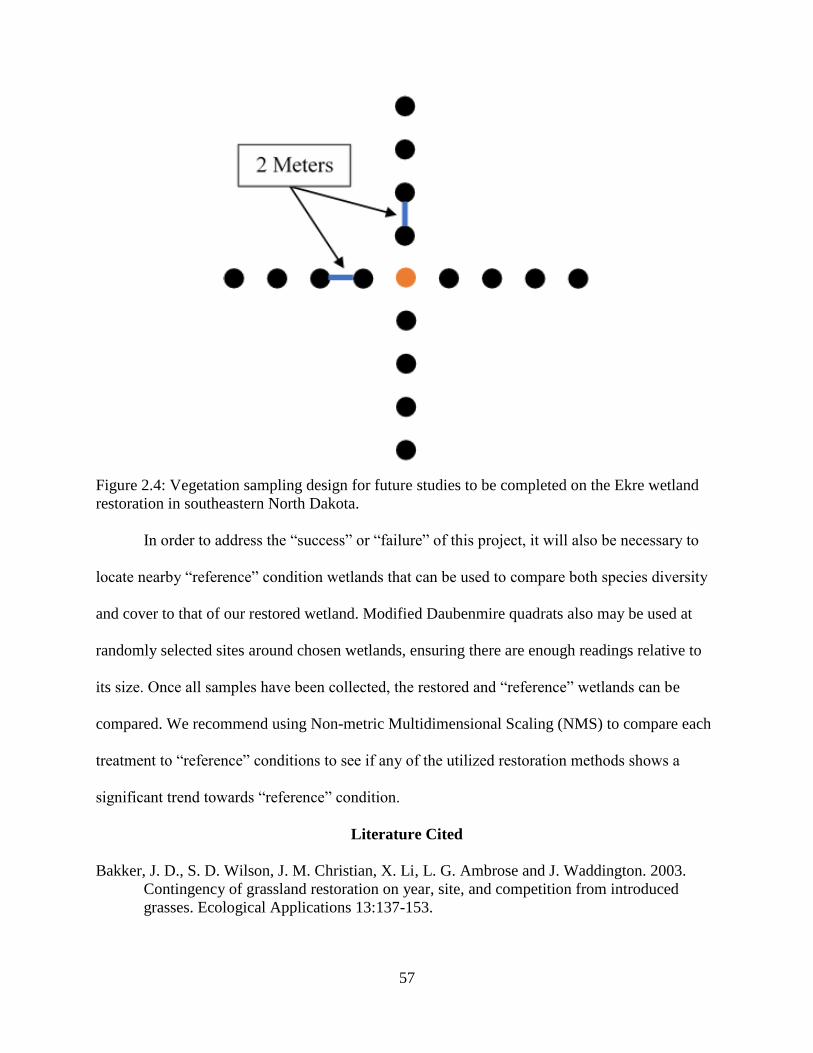
57
Figure 2.4: Vegetation sampling design for future studies to be completed on the Ekre wetland
restoration in southeastern North Dakota.
In order to address the “success” or “failure” of this project, it will also be necessary to
locate nearby “reference” condition wetlands that can be used to compare both species diversity
and cover to that of our restored wetland. Modified Daubenmire quadrats also may be used at
randomly selected sites around chosen wetlands, ensuring there are enough readings relative to
its size. Once all samples have been collected, the restored and “reference” wetlands can be
compared. We recommend using Non-metric Multidimensional Scaling (NMS) to compare each
treatment to “reference” conditions to see if any of the utilized restoration methods shows a
significant trend towards “reference” condition.
Literature Cited
Bakker, J. D., S. D. Wilson, J. M. Christian, X. Li, L. G. Ambrose and J. Waddington. 2003.
Contingency of grassland restoration on year, site, and competition from introduced
grasses. Ecological Applications 13:137-153.
58
Brewer, J. S., T. Rand, J. M. Levine and M. D. Bertness. 1998. Biomass allocation, clonal
dispersal, and competitive success in three salt marsh plants. Oikos 82:347-353.
Budelsky, R. A. and S. M. Galatowitsch. 1999. Effects of moisture, temperature, and time on
seed germination of five wetland Carices: Implications for restoration. Restoration
Ecology 7:86-97.
Clevering, O. A. and W. M. G. van Guilik. 1997. Restoration of Scirpus lacustris and Scirpus
maritimus stands in a former tidal area. Aquatic Botany 55:229-246.
Costanza, R., R. d’Arge, R. de Groot, S. Farber, M. Grasso, B. Hannon, K. Limburg, S. Naeem,
R. V. O’Neill, J. Paruelo, R. G. Raskin, P. Sutton and M. van den Belt. 1997. The value
of the world’s ecosystem services and natural capital. Nature 387:253-260.
Davis, R. C. and F. T. Short. 1997. Restoring eelgrass, Zostera marina L., habitat using a new
transplanting technique: the horizontal rhizome method. Aquatic Botany. 59:1-15.
Desserud P. A. and M. A. Naeth. 2011. Promising results restoring grassland disturbances with
native hay (Alberta). Ecological Restoration 29:215-219.
Edwards, A. R., S. R. Mortimer, C. S. Lawson, D. B. Westbury, S. J. Harris, B. A. Woodcock
and V. K. Brown. 2007. Hay strewing, brush harvesting of seed and soil disturbance as
tools for the enhancement of botanical diversity in grasslands. Biological Conservation
134:372-382.
Farrer, E. C. and D. E. Goldberg. 2009. Litter drives ecosystem and plant community changes in
cattail invasion. Ecological Applications 19:398-412.
Foster, B. L. and K. L. Gross. 1998. Species richness in a successional grassland: effects of
nitrogen enrichment and plant litter. Ecology 79:2593-2602.
Fowler, N. L. 1988. What is a safe site? Neighbor, litter, germination date, and patch effects.
Ecology 69:947-961.
Fraser, A. and K. Kindscher. 2001. Tree spade transplanting of Spartina pectinata (Link) and
Elocharis macrostachya (Britt.) in a prairie wetland restoration site. Aquatic Botany
71:297-304.
Fraser, A. and K. Kindscher. 2005. Spatial distribution of Spartina pectinata transplants to
restore wet prairie. Restoration Ecology 13:144-151.
Frenkel, R. E. and T. R. Boss. 1988. Introduction, establishment, and spread of Spartina patens
on Cox Island, Siuslaw Estuary, Oregon. Wetlands 8:33-49.
Galatowitsch, S. M. and A. G. van der Valk. 1996a. Characteristics of recently restored wetlands
in the prairie pothole region. Wetlands 16:75-83.
59
Galatowitsch, S. M. and A. G. van der Valk. 1996b. The vegetation of restored and natural
prairie wetlands. Ecological Applications 6:102-112.
Gates, D. H. 1962. Revegetation of a high-altitude barren slop in northern Idaho. Journal of
Range Management 15:314-318.
Green, E. K. and S. M. Galatowitsch. 2001. Difference in wetland plant community
establishment with additions of nitrate-N and invasive species (Phalaris arundinacea and
Typha × glauca). Canadian Journal of Botany 79:170-178.
Hammack, J. and G. M. Brown. 1974. Waterfowl and wetlands: Towards bioeconomic analysis.
Resources for the Future, Washington, D.C.
Kiehl, K. K., A. Kirmer, T. W. Donath, L. Rasran and N. Hölzel. 2010. Species introduction in
restoration projects – evaluation of different techniques for the establishment of semi-
natural grasslands in Central and Northwestern Europe. Basic and Applied Ecology
11:285-299.
Kiehl, K. K., A. Thormann and J. Pfadenhauer. 2006. Evaluation of initial restoration measures
during restoration of calcareous grasslands on former arable fields. Restoration Ecology
14:148-156.
Kirmer, A., A. Baasch and S. Tischew. 2012. Sowing of low and high diversity seed mixtures in
ecological restoration of surface mined-land. Applied Vegetation Science 15:198-207.
Klimkowska, A., W. Kotowski, R. Van Diggelen, A. P. Grootjans, P. Dzierza and K. Brzezińska.
2010. Vegetation re-development after fen meadow restoration by topsoil removal and
hay transfer. Restoration Ecology 18:924-933.
Larkin D. J., M. J. Freyman, S. C. Lishawa, R. Geddes and N. C. Tuchman. 2012. Mechanisms
of dominance by the invasive hybrid cattail Typha x glauca. Biological Invasions 14:65-
77.
Lindgren, D. 2015. Program Technician. Farm Service Agency – Richland County Farm Service
Center Office. Wahpeton, ND.
Lindig-Cisneros, R. and J. B. Zedler. 2002. Phalaris arundinacea seedling establishment: Effects
of canopy complexity in fen, mesocosm, and restoration experiments. Canadian Journal
of Botany 80:617-24.
Maurer, D. and J. B. Zedler. 2002. Differential invasion of a wetland grass explained by tests of
nutrients and light availability on establishment and vegetative growth. Oecologia
131:279–288.
Mitsch, W. J. and J. G. Gosselink. 2007. Wetlands. 4th edition. John Wiley and Sons, Hoboken.
60
Natural Resources Conservation Service. 2015. NRCS Ecological Site Information System,
Ecological Site Description. Available at:
https://esis.sc.egov.usda.gov/ESDReport/fsReport.aspx?approved=yes&repType=regular
&id=R056XY102ND. Accessed 3/2/2015.
Natural Resources Conservation Service. 2015. NRCS Web Soil Survey. Available at:
http://websoilsurvey.sc.egov.usda.gov/App/WebSoilSurvey.aspx. Accessed 3/2/2015.
North Dakota Agricultural Weather Network. 2014. NDAWN Yearly data for the period of
record. Ekre station. Yearly Rainfall. http://ndawn.ndsu.nodak.edu/get-
table.html?station=75&variable=mdr&year=2015&ttype=monthly&quick_pick=&begin_
date=2013-01&count=24. Accessed: 3/2/2015.
Prato, T., Y. Wang, T. Haithcoat, C. Barnett, and C. Fulcher. 1995. Converting hydric cropland
to wetland in Missouri: A geoeconomic analysis. Journal of Soil and Water Conservation
50:101-106.
Rasran, L., K. Vogt and K. Jensen. 2006. Seed content and conservation evaluation of hay
material of fen grasslands. Journal for Nature Conservation 14:34-45.
Rowe, H. I. 2010. Tricks of the trade: Techniques and opinions from 38 experts in tallgrass
prairie restoration. Restoration Ecology 18 No. 2:253-262.
Ruprecht, E., J. Józsa, T. B. Ölvedi and J. Simon. 2010. Differential effects of several “litter”
types on the germination of dry grassland species. Journal of Vegetation Science
21:1069-1081.
Schütz, W. 2000. Ecology of seed dormancy and germination in sedges (Carex). Perspectives in
Plant Ecology, Evolution, and Systematics 3:67-89.
Smith, S. G. 1987. Typha: Its taxonomy and the ecological significance of hybrids. In
Proceedings of the 2nd Intecol Wetlands Conference, Trebon, Czeckoslovakia. Arch.
Hydrobiol. Beih. No. 27. pp. 129-138.
Stewart, R. E. and H. A. Kantrud. 1972. Vegetation of prairie potholes in North Dakota, in
relation to quality of water and other environmental factors. U.S. Geological Survey
Professional Paper 585-D. Washington, DC: U.S. Government Printing Office.
Thompson D. J. and J. M. Shay. 1985. The effects of fire on Phragmites australis in the Delta
Marsh, Manitoba. Canadian Journal of Botany 63:1864-1869.
Török, P., T. Miglécz, O. Valkó, A. Kelemen, K. Tóth, S. Lengyel and B. Tóthmérész. 2012.
Fast restoration of grassland vegetation by a combination of seed mixture sowing and
low-diversity hay transfer. Ecological Engineering 44:133-138.
61
Travis S. E., J. E. Marburger, S. Windel and B. Kubátová. 2010. Hybridization dynamics of
invasive cattail (Typhaceae) stands in the Western Great Lakes region of North America:
a molecular analysis. Journal of Ecology 98:7-16.
United States Department of Commerce. National Oceanic & Atmospheric Administration.
2015. NOAA Summary of month normals 1981-2010 McCleod station 3E, ND, US.
Available at: http://www.ncdc.noaa.gov/cdo-web/datasets. Accessed 1/20/15.
Wasser, C. H. 1982. Ecology and culture of selected species useful in revegetating disturbed
lands in the west. FWS/ OBS-82/56. Washington, DC: U.S. Department of the Interior,
Fish and Wildlife Service, Office of Biological Services, Western Energy and Land Use
Team. 347 p.
Waters, I. and J. M. Shay. 1990. A field study of the morphometric response of Typha glauca
shoots to a water depth gradient. Canadian Journal of Botany 68:2339-2343.
Waters, I. and J. M. Shay. 1992. Effect of water depth on population parameters of a Typha
glauca stand. Canadian Journal of Botany 70:349-351.
Wedin, D. A. and D. Tilman. 1993. Competition among grasses along a nitrogen gradient: Initial
conditions and mechanisms of competition. Ecological Monographs 63:199-229.
Wienhold, C. E. and A. G. van der Valk. 1989. The impact of duration of drainage on the seed
banks of northern prairie wetlands. Canadian Journal of Botany 67:1878-1884.
Zentner, J., J. Glaspy and D. Schenk. 2003. Wetland and riparian woodland restoration costs.
Ecological Restoration 21:166-173.
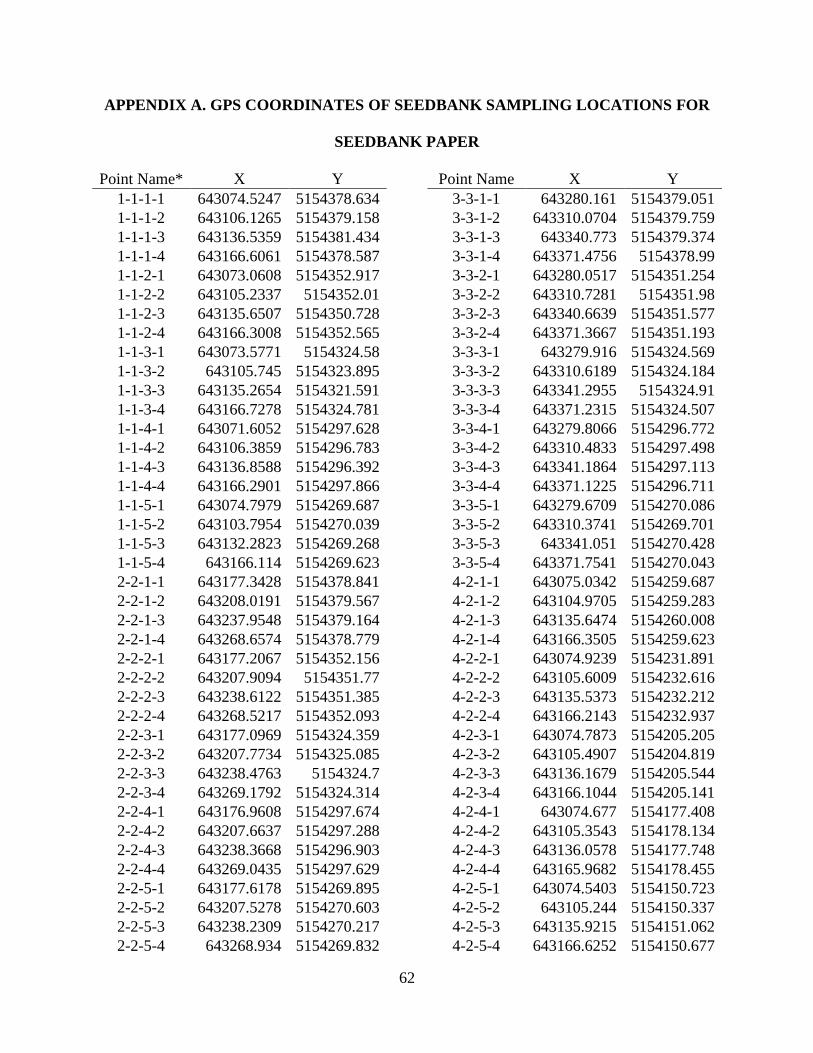
62
APPENDIX A. GPS COORDINATES OF SEEDBANK SAMPLING LOCATIONS FOR
SEEDBANK PAPER
Point Name* X Y
1-1-1-1 643074.5247 5154378.634
1-1-1-2 643106.1265 5154379.158
1-1-1-3 643136.5359 5154381.434
1-1-1-4 643166.6061 5154378.587
1-1-2-1 643073.0608 5154352.917
1-1-2-2 643105.2337 5154352.01
1-1-2-3 643135.6507 5154350.728
1-1-2-4 643166.3008 5154352.565
1-1-3-1 643073.5771 5154324.58
1-1-3-2 643105.745 5154323.895
1-1-3-3 643135.2654 5154321.591
1-1-3-4 643166.7278 5154324.781
1-1-4-1 643071.6052 5154297.628
1-1-4-2 643106.3859 5154296.783
1-1-4-3 643136.8588 5154296.392
1-1-4-4 643166.2901 5154297.866
1-1-5-1 643074.7979 5154269.687
1-1-5-2 643103.7954 5154270.039
1-1-5-3 643132.2823 5154269.268
1-1-5-4 643166.114 5154269.623
2-2-1-1 643177.3428 5154378.841
2-2-1-2 643208.0191 5154379.567
2-2-1-3 643237.9548 5154379.164
2-2-1-4 643268.6574 5154378.779
2-2-2-1 643177.2067 5154352.156
2-2-2-2 643207.9094 5154351.77
2-2-2-3 643238.6122 5154351.385
2-2-2-4 643268.5217 5154352.093
2-2-3-1 643177.0969 5154324.359
2-2-3-2 643207.7734 5154325.085
2-2-3-3 643238.4763 5154324.7
2-2-3-4 643269.1792 5154324.314
2-2-4-1 643176.9608 5154297.674
2-2-4-2 643207.6637 5154297.288
2-2-4-3 643238.3668 5154296.903
2-2-4-4 643269.0435 5154297.629
2-2-5-1 643177.6178 5154269.895
2-2-5-2 643207.5278 5154270.603
2-2-5-3 643238.2309 5154270.217
2-2-5-4 643268.934 5154269.832
Point Name X Y
3-3-1-1 643280.161 5154379.051
3-3-1-2 643310.0704 5154379.759
3-3-1-3 643340.773 5154379.374
3-3-1-4 643371.4756 5154378.99
3-3-2-1 643280.0517 5154351.254
3-3-2-2 643310.7281 5154351.98
3-3-2-3 643340.6639 5154351.577
3-3-2-4 643371.3667 5154351.193
3-3-3-1 643279.916 5154324.569
3-3-3-2 643310.6189 5154324.184
3-3-3-3 643341.2955 5154324.91
3-3-3-4 643371.2315 5154324.507
3-3-4-1 643279.8066 5154296.772
3-3-4-2 643310.4833 5154297.498
3-3-4-3 643341.1864 5154297.113
3-3-4-4 643371.1225 5154296.711
3-3-5-1 643279.6709 5154270.086
3-3-5-2 643310.3741 5154269.701
3-3-5-3 643341.051 5154270.428
3-3-5-4 643371.7541 5154270.043
4-2-1-1 643075.0342 5154259.687
4-2-1-2 643104.9705 5154259.283
4-2-1-3 643135.6474 5154260.008
4-2-1-4 643166.3505 5154259.623
4-2-2-1 643074.9239 5154231.891
4-2-2-2 643105.6009 5154232.616
4-2-2-3 643135.5373 5154232.212
4-2-2-4 643166.2143 5154232.937
4-2-3-1 643074.7873 5154205.205
4-2-3-2 643105.4907 5154204.819
4-2-3-3 643136.1679 5154205.544
4-2-3-4 643166.1044 5154205.141
4-2-4-1 643074.677 5154177.408
4-2-4-2 643105.3543 5154178.134
4-2-4-3 643136.0578 5154177.748
4-2-4-4 643165.9682 5154178.455
4-2-5-1 643074.5403 5154150.723
4-2-5-2 643105.244 5154150.337
4-2-5-3 643135.9215 5154151.062
4-2-5-4 643166.6252 5154150.677
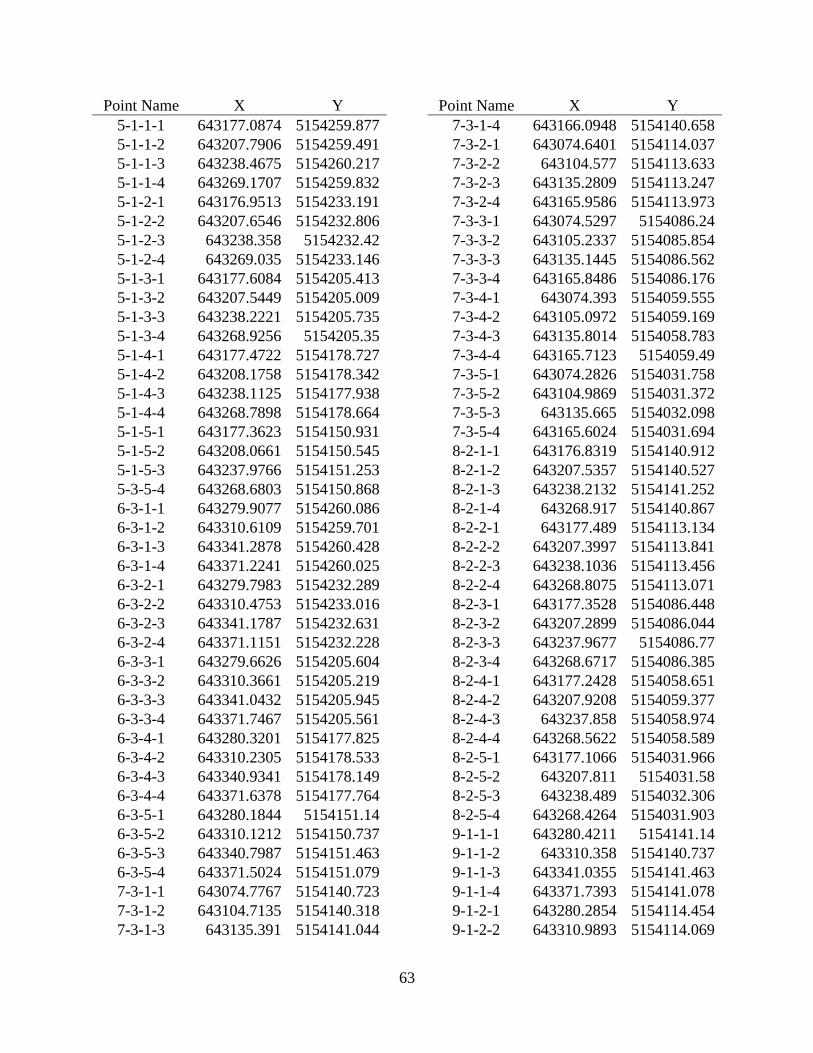
63
Point Name X Y
5-1-1-1 643177.0874 5154259.877
5-1-1-2 643207.7906 5154259.491
5-1-1-3 643238.4675 5154260.217
5-1-1-4 643269.1707 5154259.832
5-1-2-1 643176.9513 5154233.191
5-1-2-2 643207.6546 5154232.806
5-1-2-3 643238.358 5154232.42
5-1-2-4 643269.035 5154233.146
5-1-3-1 643177.6084 5154205.413
5-1-3-2 643207.5449 5154205.009
5-1-3-3 643238.2221 5154205.735
5-1-3-4 643268.9256 5154205.35
5-1-4-1 643177.4722 5154178.727
5-1-4-2 643208.1758 5154178.342
5-1-4-3 643238.1125 5154177.938
5-1-4-4 643268.7898 5154178.664
5-1-5-1 643177.3623 5154150.931
5-1-5-2 643208.0661 5154150.545
5-1-5-3 643237.9766 5154151.253
5-3-5-4 643268.6803 5154150.868
6-3-1-1 643279.9077 5154260.086
6-3-1-2 643310.6109 5154259.701
6-3-1-3 643341.2878 5154260.428
6-3-1-4 643371.2241 5154260.025
6-3-2-1 643279.7983 5154232.289
6-3-2-2 643310.4753 5154233.016
6-3-2-3 643341.1787 5154232.631
6-3-2-4 643371.1151 5154232.228
6-3-3-1 643279.6626 5154205.604
6-3-3-2 643310.3661 5154205.219
6-3-3-3 643341.0432 5154205.945
6-3-3-4 643371.7467 5154205.561
6-3-4-1 643280.3201 5154177.825
6-3-4-2 643310.2305 5154178.533
6-3-4-3 643340.9341 5154178.149
6-3-4-4 643371.6378 5154177.764
6-3-5-1 643280.1844 5154151.14
6-3-5-2 643310.1212 5154150.737
6-3-5-3 643340.7987 5154151.463
6-3-5-4 643371.5024 5154151.079
7-3-1-1 643074.7767 5154140.723
7-3-1-2 643104.7135 5154140.318
7-3-1-3 643135.391 5154141.044
Point Name X Y
7-3-1-4 643166.0948 5154140.658
7-3-2-1 643074.6401 5154114.037
7-3-2-2 643104.577 5154113.633
7-3-2-3 643135.2809 5154113.247
7-3-2-4 643165.9586 5154113.973
7-3-3-1 643074.5297 5154086.24
7-3-3-2 643105.2337 5154085.854
7-3-3-3 643135.1445 5154086.562
7-3-3-4 643165.8486 5154086.176
7-3-4-1 643074.393 5154059.555
7-3-4-2 643105.0972 5154059.169
7-3-4-3 643135.8014 5154058.783
7-3-4-4 643165.7123 5154059.49
7-3-5-1 643074.2826 5154031.758
7-3-5-2 643104.9869 5154031.372
7-3-5-3 643135.665 5154032.098
7-3-5-4 643165.6024 5154031.694
8-2-1-1 643176.8319 5154140.912
8-2-1-2 643207.5357 5154140.527
8-2-1-3 643238.2132 5154141.252
8-2-1-4 643268.917 5154140.867
8-2-2-1 643177.489 5154113.134
8-2-2-2 643207.3997 5154113.841
8-2-2-3 643238.1036 5154113.456
8-2-2-4 643268.8075 5154113.071
8-2-3-1 643177.3528 5154086.448
8-2-3-2 643207.2899 5154086.044
8-2-3-3 643237.9677 5154086.77
8-2-3-4 643268.6717 5154086.385
8-2-4-1 643177.2428 5154058.651
8-2-4-2 643207.9208 5154059.377
8-2-4-3 643237.858 5154058.974
8-2-4-4 643268.5622 5154058.589
8-2-5-1 643177.1066 5154031.966
8-2-5-2 643207.811 5154031.58
8-2-5-3 643238.489 5154032.306
8-2-5-4 643268.4264 5154031.903
9-1-1-1 643280.4211 5154141.14
9-1-1-2 643310.358 5154140.737
9-1-1-3 643341.0355 5154141.463
9-1-1-4 643371.7393 5154141.078
9-1-2-1 643280.2854 5154114.454
9-1-2-2 643310.9893 5154114.069
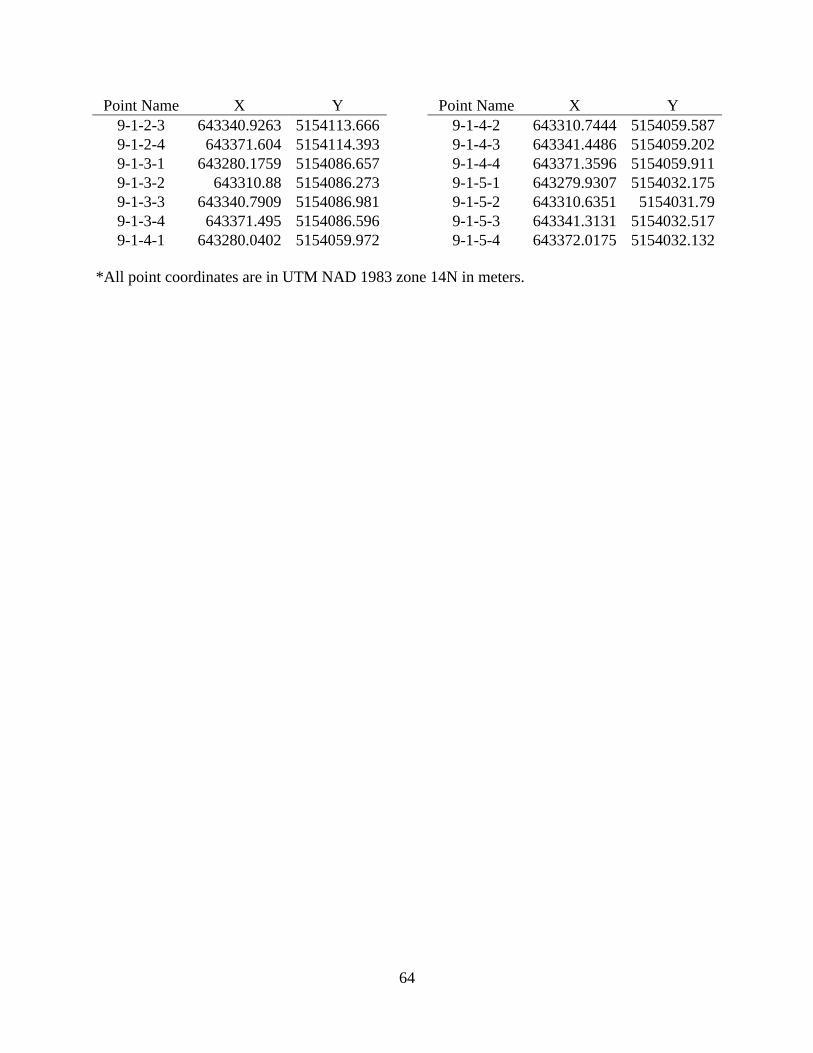
64
Point Name X Y
9-1-2-3 643340.9263 5154113.666
9-1-2-4 643371.604 5154114.393
9-1-3-1 643280.1759 5154086.657
9-1-3-2 643310.88 5154086.273
9-1-3-3 643340.7909 5154086.981
9-1-3-4 643371.495 5154086.596
9-1-4-1 643280.0402 5154059.972
Point Name X Y
9-1-4-2 643310.7444 5154059.587
9-1-4-3 643341.4486 5154059.202
9-1-4-4 643371.3596 5154059.911
9-1-5-1 643279.9307 5154032.175
9-1-5-2 643310.6351 5154031.79
9-1-5-3 643341.3131 5154032.517
9-1-5-4 643372.0175 5154032.132
*All point coordinates are in UTM NAD 1983 zone 14N in meters.
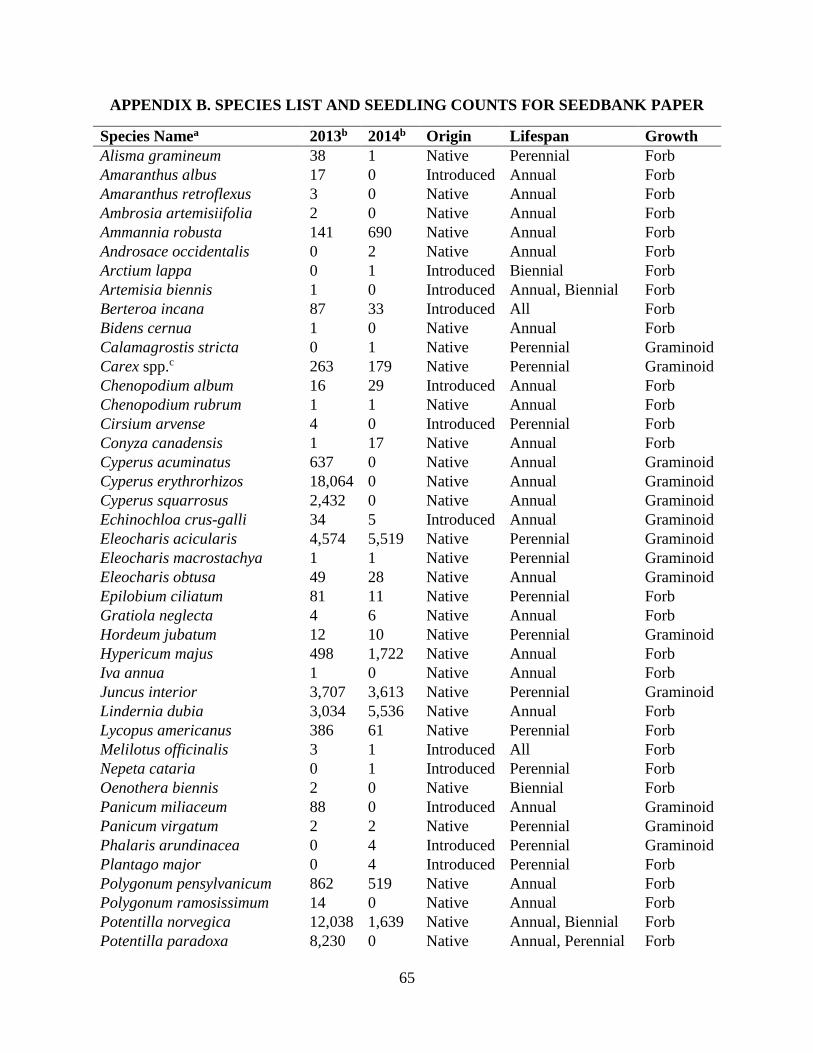
65
APPENDIX B. SPECIES LIST AND SEEDLING COUNTS FOR SEEDBANK PAPER
Species Namea 2013b 2014b Origin Lifespan Growth
Alisma gramineum 38 1 Native Perennial Forb
Amaranthus albus 17 0 Introduced Annual Forb
Amaranthus retroflexus 3 0 Native Annual Forb
Ambrosia artemisiifolia 2 0 Native Annual Forb
Ammannia robusta 141 690 Native Annual Forb
Androsace occidentalis 0 2 Native Annual Forb
Arctium lappa 0 1 Introduced Biennial Forb
Artemisia biennis 1 0 Introduced Annual, Biennial Forb
Berteroa incana 87 33 Introduced All Forb
Bidens cernua 1 0 Native Annual Forb
Calamagrostis stricta 0 1 Native Perennial Graminoid
Carex spp.c 263 179 Native Perennial Graminoid
Chenopodium album 16 29 Introduced Annual Forb
Chenopodium rubrum 1 1 Native Annual Forb
Cirsium arvense 4 0 Introduced Perennial Forb
Conyza canadensis 1 17 Native Annual Forb
Cyperus acuminatus 637 0 Native Annual Graminoid
Cyperus erythrorhizos 18,064 0 Native Annual Graminoid
Cyperus squarrosus 2,432 0 Native Annual Graminoid
Echinochloa crus-galli 34 5 Introduced Annual Graminoid
Eleocharis acicularis 4,574 5,519 Native Perennial Graminoid
Eleocharis macrostachya 1 1 Native Perennial Graminoid
Eleocharis obtusa 49 28 Native Annual Graminoid
Epilobium ciliatum 81 11 Native Perennial Forb
Gratiola neglecta 4 6 Native Annual Forb
Hordeum jubatum 12 10 Native Perennial Graminoid
Hypericum majus 498 1,722 Native Annual Forb
Iva annua 1 0 Native Annual Forb
Juncus interior 3,707 3,613 Native Perennial Graminoid
Lindernia dubia 3,034 5,536 Native Annual Forb
Lycopus americanus 386 61 Native Perennial Forb
Melilotus officinalis 3 1 Introduced All Forb
Nepeta cataria 0 1 Introduced Perennial Forb
Oenothera biennis 2 0 Native Biennial Forb
Panicum miliaceum 88 0 Introduced Annual Graminoid
Panicum virgatum 2 2 Native Perennial Graminoid
Phalaris arundinacea 0 4 Introduced Perennial Graminoid
Plantago major 0 4 Introduced Perennial Forb
Polygonum pensylvanicum 862 519 Native Annual Forb
Polygonum ramosissimum 14 0 Native Annual Forb
Potentilla norvegica 12,038 1,639 Native Annual, Biennial Forb
Potentilla paradoxa 8,230 0 Native Annual, Perennial Forb
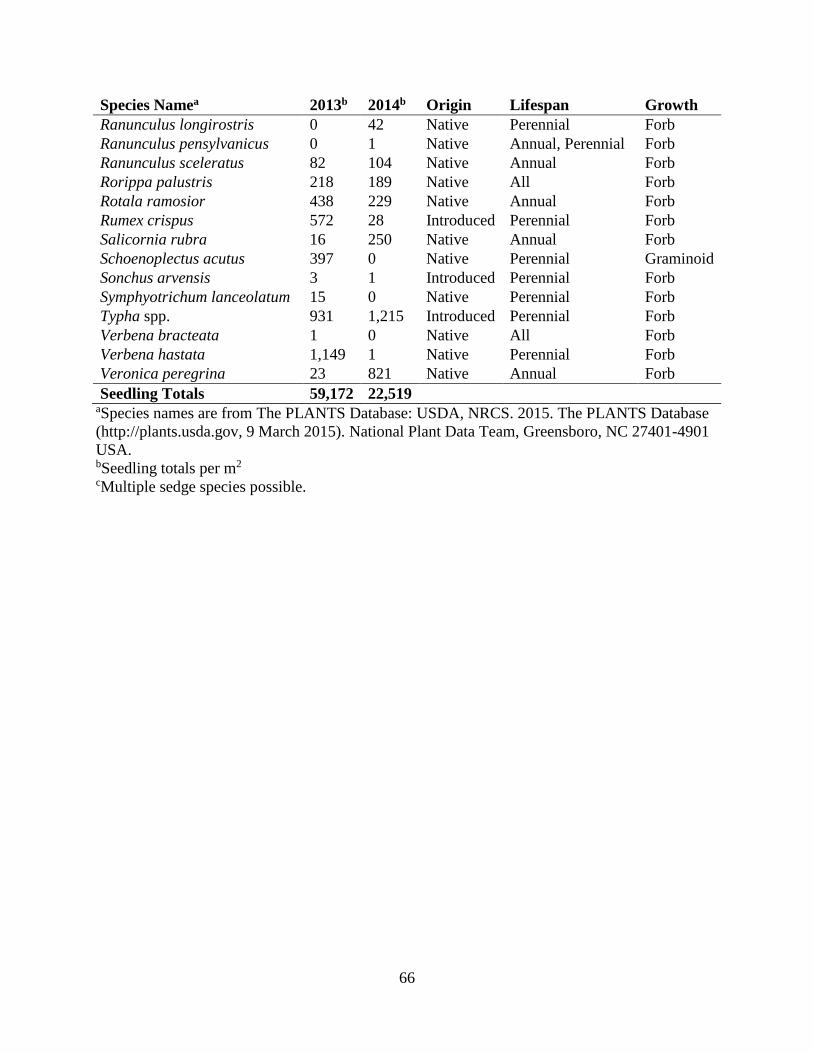
66
Species Namea 2013b 2014b Origin Lifespan Growth
Ranunculus longirostris 0 42 Native Perennial Forb
Ranunculus pensylvanicus 0 1 Native Annual, Perennial Forb
Ranunculus sceleratus 82 104 Native Annual Forb
Rorippa palustris 218 189 Native All Forb
Rotala ramosior 438 229 Native Annual Forb
Rumex crispus 572 28 Introduced Perennial Forb
Salicornia rubra 16 250 Native Annual Forb
Schoenoplectus acutus 397 0 Native Perennial Graminoid
Sonchus arvensis 3 1 Introduced Perennial Forb
Symphyotrichum lanceolatum 15 0 Native Perennial Forb
Typha spp. 931 1,215 Introduced Perennial Forb
Verbena bracteata 1 0 Native All Forb
Verbena hastata 1,149 1 Native Perennial Forb
Veronica peregrina 23 821 Native Annual Forb
Seedling Totals 59,172 22,519 aSpecies names are from The PLANTS Database: USDA, NRCS. 2015. The PLANTS Database
(http://plants.usda.gov, 9 March 2015). National Plant Data Team, Greensboro, NC 27401-4901
USA. bSeedling totals per m2 cMultiple sedge species possible.
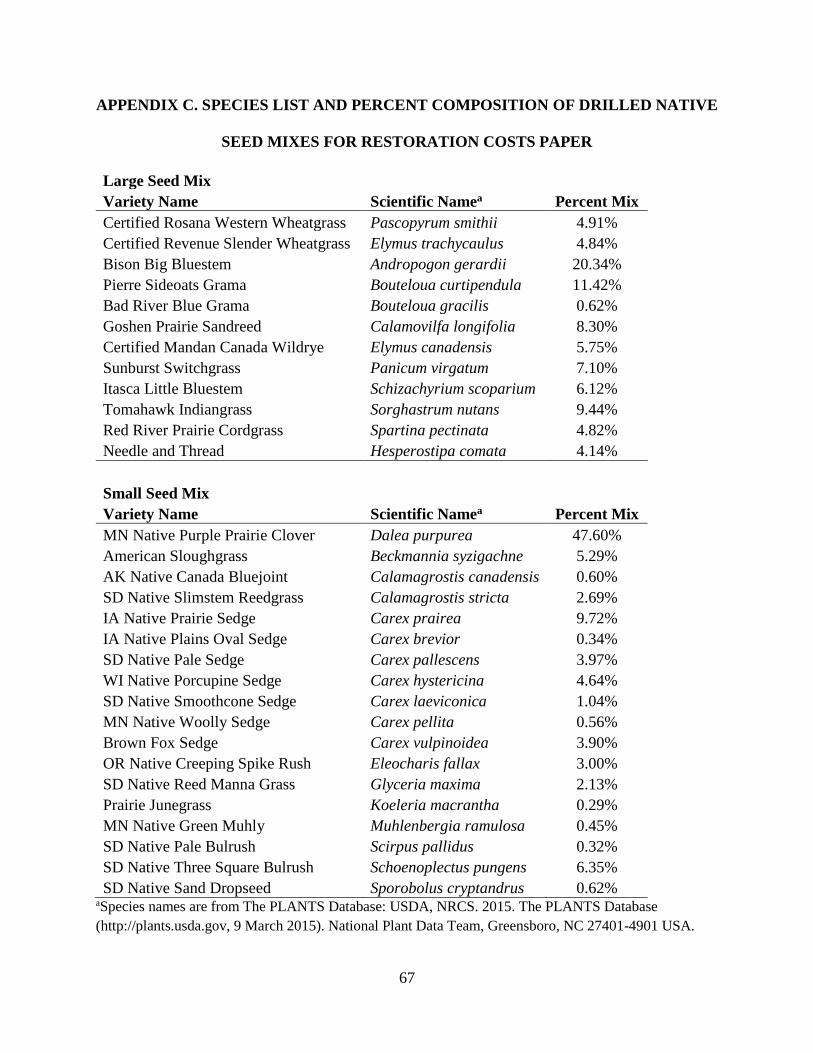
67
APPENDIX C. SPECIES LIST AND PERCENT COMPOSITION OF DRILLED NATIVE
SEED MIXES FOR RESTORATION COSTS PAPER
Large Seed Mix
Variety Name Scientific Namea Percent Mix
Certified Rosana Western Wheatgrass Pascopyrum smithii 4.91%
Certified Revenue Slender Wheatgrass Elymus trachycaulus 4.84%
Bison Big Bluestem Andropogon gerardii 20.34%
Pierre Sideoats Grama Bouteloua curtipendula 11.42%
Bad River Blue Grama Bouteloua gracilis 0.62%
Goshen Prairie Sandreed Calamovilfa longifolia 8.30%
Certified Mandan Canada Wildrye Elymus canadensis 5.75%
Sunburst Switchgrass Panicum virgatum 7.10%
Itasca Little Bluestem Schizachyrium scoparium 6.12%
Tomahawk Indiangrass Sorghastrum nutans 9.44%
Red River Prairie Cordgrass Spartina pectinata 4.82%
Needle and Thread Hesperostipa comata 4.14%
Small Seed Mix
Variety Name Scientific Namea Percent Mix
MN Native Purple Prairie Clover Dalea purpurea 47.60%
American Sloughgrass Beckmannia syzigachne 5.29%
AK Native Canada Bluejoint Calamagrostis canadensis 0.60%
SD Native Slimstem Reedgrass Calamagrostis stricta 2.69%
IA Native Prairie Sedge Carex prairea 9.72%
IA Native Plains Oval Sedge Carex brevior 0.34%
SD Native Pale Sedge Carex pallescens 3.97%
WI Native Porcupine Sedge Carex hystericina 4.64%
SD Native Smoothcone Sedge Carex laeviconica 1.04%
MN Native Woolly Sedge Carex pellita 0.56%
Brown Fox Sedge Carex vulpinoidea 3.90%
OR Native Creeping Spike Rush Eleocharis fallax 3.00%
SD Native Reed Manna Grass Glyceria maxima 2.13%
Prairie Junegrass Koeleria macrantha 0.29%
MN Native Green Muhly Muhlenbergia ramulosa 0.45%
SD Native Pale Bulrush Scirpus pallidus 0.32%
SD Native Three Square Bulrush Schoenoplectus pungens 6.35%
SD Native Sand Dropseed Sporobolus cryptandrus 0.62% aSpecies names are from The PLANTS Database: USDA, NRCS. 2015. The PLANTS Database
(http://plants.usda.gov, 9 March 2015). National Plant Data Team, Greensboro, NC 27401-4901 USA.