Embed Size (px)
Citation preview

Nat. Hazards Earth Syst. Sci., 11, 2419–2431, 2011www.nat-hazards-earth-syst-sci.net/11/2419/2011/doi:10.5194/nhess-11-2419-2011© Author(s) 2011. CC Attribution 3.0 License.
Natural Hazardsand Earth
System Sciences
Wet snow hazard for power lines: a forecast and alert systemapplied in Italy
P. Bonelli, M. Lacavalla, P. Marcacci, G. Mariani, and G. Stella
RSE S.p.A. (former ERSE), Via Rubattino 54, 20134 Milano, Italy
Received: 16 July 2010 – Revised: 24 January 2011 – Accepted: 22 July 2011 – Published: 9 September 2011
Abstract. Wet snow icing accretion on power lines is a realproblem in Italy, causing failures on high and medium volt-age power supplies during the cold season. The phenomenonis a process in which many large and local scale variablescontribute in a complex way and not completely understood.A numerical weather forecast can be used to select areaswhere wet snow accretion has an high probability of occur-ring, but a specific accretion model must also be used to es-timate the load of an ice sleeve and its hazard. All the infor-mation must be carefully selected and shown to the electricgrid operator in order to warn him promptly.
The authors describe a prototype of forecast and alert sys-tem, WOLF (Wet snowOverload aLert andForecast), devel-oped and applied in Italy. The prototype elaborates the out-put of a numerical weather prediction model, as temperature,precipitation, wind intensity and direction, to determine theareas of potential risk for the power lines. Then an accretionmodel computes the ice sleeves’ load for different conduc-tor diameters. The highest values are selected and displayedon a WEB-GIS application principally devoted to the electricoperator, but also to more expert users. Some experimentalfield campaigns have been conducted to better parameterizethe accretion model. Comparisons between real accidentsand forecasted icing conditions are presented and discussed.
1 Introduction
Icing formation on structures and power lines is an importantnatural hazard that causes damage in many countries (Fikke,2005a, b; Fikke et al., 2007; Cigre, 2009). Two kinds ofphenomena are involved: in-cloud icing, due to the super-cooled water contained in the cold low-clouds, and precipita-tion icing, due to the freezing rain or the wet snow deposition
Correspondence to:P. Bonelli([email protected])
(Farzaneh, 2008; Poots, 1996). In Italy, as well as in otherMediterranean countries, especially at low altitude, the wetsnow icing process is more important than the in-cloud one(Admirat and Sakamoto, 1988a, b; Bonelli and Lacavalla,2010). In fact, snowfall precipitation, with temperaturesclose to 0◦C, is more frequent than humid and cold-cloudadvections near the ground. At high altitude and in mountainregions, in-cloud icing may be important, but the power linesare rare and they are built with hardiness criteria (IEC, 1991;IEC, 1997; IEC, 2003).
The atmospheric icing process is an interesting subjectfor the electric grid design as well. In fact, as other severeweather phenomena, the icing frequency undergoes GlobalClimate Change and its long-term behaviour may be consid-ered in building criteria. Atmospheric icing has been anal-ysed from a climate point of view in Czech Republic, mea-suring ice-load deposition for a long time in the station ofStudnice (Cigre, 2005). The analysis shows a positive trendthat is explained as a probable effect of Global Warming.In Italy as well, the frequency of “warm and wet” snow-fall events, observed by means of SYNOP data since 1951,shows a positive trend (Bonelli and Lacavalla, 2010).
1.1 Icing in Italy
In the last years, northern regions of Italy suffered some se-vere snow events. In December 2008, heavy snowfall overthe pre-alpine area, close to the city of Bergamo (Lombardy),at about 900 m a.s.l., caused the collapse of a lattice and manyusers were affected by days of electrical blackout. On the15 December of the same year, another snow storm involvedPiedmont, with more than 2 m of snow on the ground andthe collapse of some overhead lines at about 800 m a.s.l. ofaltitude. This break caused the lack of power for 50 000 habi-tants. On the 28 April 2009, in the Gressoney Valley (Valled’Aosta) at an altitude of 1800 m a.s.l., a high voltage con-ductor broke down during a heavy snowfall event.
Published by Copernicus Publications on behalf of the European Geosciences Union.

2420 P. Bonelli et al.: Wet snow hazard for power lines
Similar events don’t only happen in mountain regions,but also in the plain, as the one which occurred in the Po-Valley, close to the city of Ferrara and Piacenza on the10 March 2010. In this case, many long black-outs, due tomedium voltage grid failures, pained 25 000 end-users.
A survey on a database containing medium and low volt-age failure data, since 1999 to 2004, highlights that morethan 4000 independent failures on the medium voltage gridoccurred during winter (Bonelli et al., 2008). In that study,it is shown that most of the failures can be linked to snow-fall events characterised by the air temperature ranging be-tween 0◦C and 2◦C, and occurring more than 12 h with awide range of wind intensity. The wind intensity plays dif-ferent roles, since power lines can sometimes collapse due tothe combined action of wind intensity and ice load (Bonelliet al., 2008).
1.2 Defence strategies
The first defence strategy is to adopt correct building criteriafor power lines, well calibrated on the climate of the regionwhere they cross. Power lines are usually built followingclimatic hardiness rules (IEC, 2003). In some countries, asin Italy, rules are only based on rough climatic evaluation bythe altitude and latitude of the terrain where the power linewill be built. But, as stated above, most of accidents occurredbelow the altitude of 1000 m a.s.l., in regions where terrainranges between 100 m a.s.l. and 4000 m a.s.l.!
In many countries where power line icing is a relevantproblem, some strategies are taken into account in order tomitigate or avoid the effect of this phenomenon on the reli-ability of the power supply service. A wide presentation ofthese techniques can be found in the specific Cigre Report(Cigre, 2009). Some of these strategies, such as wire heat-ing, are justified for their costs only in the countries wherethe icing problem is frequent. Other protection systems arepassive methods, as the one tested by Italian TSO1 (TERNA)on 132 kV power line in Valle Stura (Cuneo, Piedmont re-gion) during the 2009–2010 winter season. It consists ofusing counterweights that increase the torsional stiffness ofconductors. Field observations demonstrate that this devicecan limit the formation of cylindrical deposits of wet snowon conductors, as shown in Fig. 1.
Other defence strategies, when building solutions are notavailable for economic reasons, are based on power dispatch-ing, devoted to minimize the supply failures as used by someTSO. In this case, a good prediction of icing phenomena afew days before the event is necessary.
In some countries, the tendency is to develop icing fore-cast systems by the combination of Numerical Weather Pre-diction (NWP) output and ice accretion models. Proba-bly, the best attempts to connect wet snow accretion modelsand weather forecasting models were developed in Iceland
1 Transmission System Operator
Fig. 1. Counterweights on a 132 kV power line limit the wetsnow accretion on wires (Valle Stura – Piedmont – Italy; 19 Febru-ary 2010).
(Olafsson et al., 2002a, b; Farzaneh, 2008). Their model alsoincludes a realistic description of the mountain effect of someimportant meteorological processes.
Another important project is developed in UK by usingthe Weather Research Forecast model (WRF) combined witha wet snow accretion model (Wareing and Nygaard, 2009).This system was successfully used to simulate the ice accre-tion on conductors during a strong event in central Englandin 1990 that caused some accidents and failures. The resultsdemonstrated the feasibility for applying that forecast systemto the entire UK.
The Hungarian Meteorological Service developed a fore-cast method after testing different weather models with vari-ous microphysical schemes. Comparisons with observationshave been carried out too. The results show that a detailedhydrometeor description is suitable to improve the forecastskill (Toth et al., 2009). They also used the model to calcu-late the return period of the strongest events.
In this paper, a prediction and alert system, named WOLF(Wet snowsOverload aLert andForecast) is presented. Itwas developed to provide a tool for the Italian TSO, able toanalyse and forecast the icing hazard over the whole country,together with information on the power lines. Some WOLFhighlights are: interactivity and availability via Internet, sim-plicity in use for non-meteorologist people too.
The main WOLF applications are:
– to supply an on-line alert system for the electric gridmanagement;
– to provide an off-line work instrument for meteorolo-gists, grid planning engineers and “Regulation Authori-ties”.
Nat. Hazards Earth Syst. Sci., 11, 2419–2431, 2011 www.nat-hazards-earth-syst-sci.net/11/2419/2011/

P. Bonelli et al.: Wet snow hazard for power lines 2421
Fig. 2. Tower collapse due to overload ice on conductors during awet snow event (Puglia – Italy; winter 1995).
In fact, if climatic evaluations are required for the designof new lines and local measurements are not available, themodel remains the only tool for this purpose.
Description of the system and its application during thecold season 2009–2010, are presented in the followingSects. 2 and 3.
2 The WOLF system
The aim of WOLF is to forecast wet snow events and calcu-late maximum ice-load expected on conductors with differ-ent diameters in a target area. Every day, the ice-load hazardlevel is plotted on a map in order to supply a daily-warning.The system helps power network management to use elec-tricity dispatching solutions. WOLF integrates an ice ac-cretion model, an interface for the collection of forecastedmeteorological data and a GIS2 display system. Before de-scribing WOLF, a brief explanation of the physics of the wetsnow process and accretion follows.
2.1 The wet snow precipitation and the accretionprocess on overhead power lines
Atmospheric icing is a complex phenomenon that involvesseveral physical processes (Cigre, 2005). Many meteorolog-ical variables are relevant, such as: air temperature, amount
2 Geographical Information System
of precipitation, wind intensity and its direction, hydrome-teor phase and size distributions. These parameters strictlyinfluence the rate of ice accretion on overhead power linesand the possible ice shedding. There are different types oficing accretion, but in this article it will be treated as onlythe wet snow type, due to its strong influence on power linesin Italy. In fact, as shown in the introduction, most of theservice outages and failures are caused by heavy wet snowmeteorological conditions.
Wet snow precipitation generally occurs when the surfaceair temperature is close to freezing point (Makkonen, 1989;Sakamoto, 2000). There is not an exact temperature rangefor wet snow conditions, but the most well-known inter-val, verified by many observations in different countries, iswithin the range 0–2◦C. In this positive temperature layer,the snowflakes can partially melt and their typical liquid wa-ter content (LWC) is within the range of 15 %–40 % of thetotal mass. Under these conditions, the snowflakes settle onthe conductor and join together not only by the mechanism ofcollision, but also for the strong coalescence due to the pres-ence of liquid water content in the snowflakes that promotesthe growth of sleeve.
During every precipitation, the vertical temperature gra-dient of the atmosphere is proximally 6◦C km−1 (Fikke,2005a, b; Fikke et al., 2007). Wet snow is generally asso-ciated with an unstable layer, in which snowflakes fall froma colder air mass to a warmer layer near the surface. It is alsoimportant to estimate the elevation of 0◦C isotherm, in orderto evaluate the exposure time of snowflakes above freezingpoint temperatures, that may increase their liquid water con-tent. It is clear that one of the most critical parameters isthe accuracy of the forecasted air temperature, not only onthe surface, but also along the overall vertical air profile, inwhich the physical processes take place. The typical durationof wet snow events is 18–24 h, producing snow sleeves up to15 cm in diameter and causing an extra load on conductorsup to 8–10 Kg m−1 (Admirat and Sakamoto, 1988a, b). Thisoverload can produce serious damage to overhead lines, ex-ceeding the mechanical resistance of lattice tower supports,as shown in Fig. 2. In some cases, the conductor undergoesan extra load due to the intense wind blowing after the accre-tion event.
2.2 Meteorological variables involved
The ice accretion model in WOLF requires forecasted mete-orological variables in order to compute the maximum over-load of ice sleeves on conductors during a wet snow pre-cipitation. The most important data, as stated by other au-thors, are: the surface air temperature, precipitation amountexpressed in water equivalent, the height of 0◦C and 2◦Cisotherm, 10 m wind intensity (Fikke, 2005a, b; Gland andAdmirat, 1986; Olafsson et al., 2002a, b; Wareing and Ny-gaard, 2009). It is assumed that a precipitation amount for thewhole event of less than 10 mm cannot produce an important
www.nat-hazards-earth-syst-sci.net/11/2419/2011/ Nat. Hazards Earth Syst. Sci., 11, 2419–2431, 2011
2422 P. Bonelli et al.: Wet snow hazard for power lines
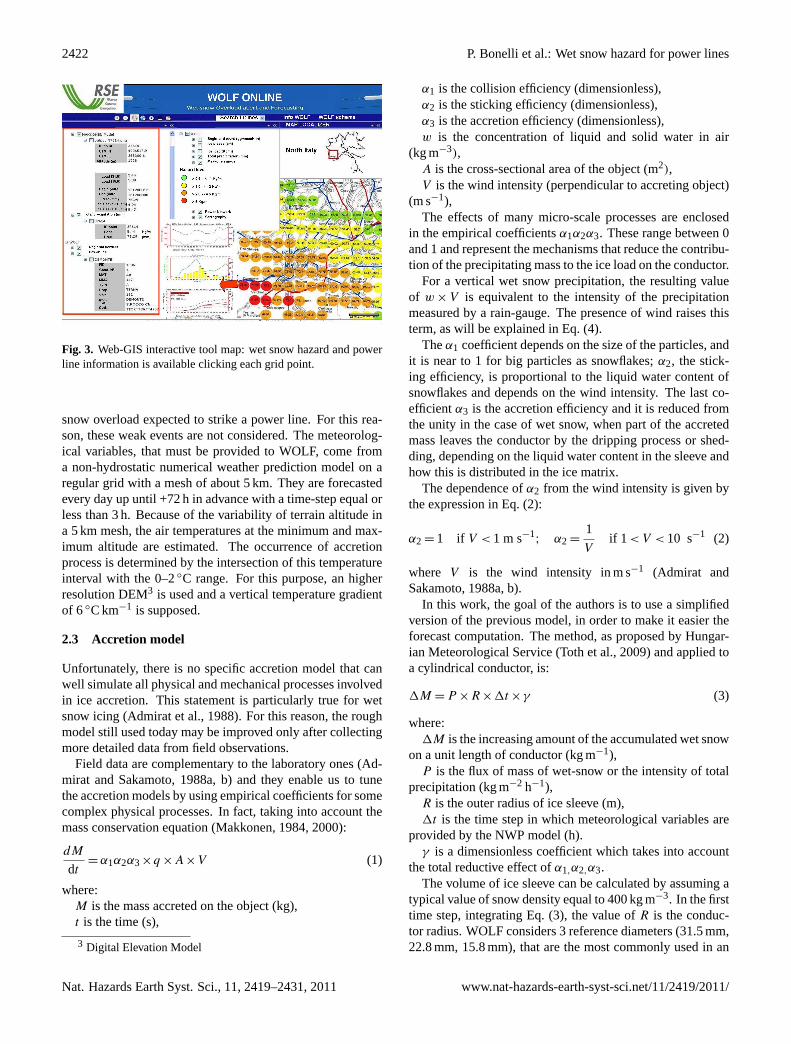
Fig. 3. Web-GIS interactive tool map: wet snow hazard and powerline information is available clicking each grid point.
snow overload expected to strike a power line. For this rea-son, these weak events are not considered. The meteorolog-ical variables, that must be provided to WOLF, come froma non-hydrostatic numerical weather prediction model on aregular grid with a mesh of about 5 km. They are forecastedevery day up until +72 h in advance with a time-step equal orless than 3 h. Because of the variability of terrain altitude ina 5 km mesh, the air temperatures at the minimum and max-imum altitude are estimated. The occurrence of accretionprocess is determined by the intersection of this temperatureinterval with the 0–2◦C range. For this purpose, an higherresolution DEM3 is used and a vertical temperature gradientof 6◦C km−1 is supposed.
2.3 Accretion model
Unfortunately, there is no specific accretion model that canwell simulate all physical and mechanical processes involvedin ice accretion. This statement is particularly true for wetsnow icing (Admirat et al., 1988). For this reason, the roughmodel still used today may be improved only after collectingmore detailed data from field observations.
Field data are complementary to the laboratory ones (Ad-mirat and Sakamoto, 1988a, b) and they enable us to tunethe accretion models by using empirical coefficients for somecomplex physical processes. In fact, taking into account themass conservation equation (Makkonen, 1984, 2000):
dM
dt= α1α2α3×q ×A×V (1)
where:M is the mass accreted on the object (kg),t is the time (s),
3 Digital Elevation Model
α1 is the collision efficiency (dimensionless),α2 is the sticking efficiency (dimensionless),α3 is the accretion efficiency (dimensionless),w is the concentration of liquid and solid water in air
(kg m−3),A is the cross-sectional area of the object (m2),V is the wind intensity (perpendicular to accreting object)
(m s−1),The effects of many micro-scale processes are enclosed
in the empirical coefficientsα1α2α3. These range between 0and 1 and represent the mechanisms that reduce the contribu-tion of the precipitating mass to the ice load on the conductor.
For a vertical wet snow precipitation, the resulting valueof w ×V is equivalent to the intensity of the precipitationmeasured by a rain-gauge. The presence of wind raises thisterm, as will be explained in Eq. (4).
Theα1 coefficient depends on the size of the particles, andit is near to 1 for big particles as snowflakes;α2, the stick-ing efficiency, is proportional to the liquid water content ofsnowflakes and depends on the wind intensity. The last co-efficientα3 is the accretion efficiency and it is reduced fromthe unity in the case of wet snow, when part of the accretedmass leaves the conductor by the dripping process or shed-ding, depending on the liquid water content in the sleeve andhow this is distributed in the ice matrix.
The dependence ofα2 from the wind intensity is given bythe expression in Eq. (2):
α2 = 1 if V < 1 m s−1; α2 =
1
Vif 1 < V < 10 s−1 (2)
where V is the wind intensity in m s−1 (Admirat andSakamoto, 1988a, b).
In this work, the goal of the authors is to use a simplifiedversion of the previous model, in order to make it easier theforecast computation. The method, as proposed by Hungar-ian Meteorological Service (Toth et al., 2009) and applied toa cylindrical conductor, is:
1M = P ×R×1t ×γ (3)
where:1M is the increasing amount of the accumulated wet snow
on a unit length of conductor (kg m−1),P is the flux of mass of wet-snow or the intensity of total
precipitation (kg m−2 h−1),R is the outer radius of ice sleeve (m),1t is the time step in which meteorological variables are
provided by the NWP model (h).γ is a dimensionless coefficient which takes into account
the total reductive effect ofα1,α2,α3.The volume of ice sleeve can be calculated by assuming a
typical value of snow density equal to 400 kg m−3. In the firsttime step, integrating Eq. (3), the value ofR is the conduc-tor radius. WOLF considers 3 reference diameters (31.5 mm,22.8 mm, 15.8 mm), that are the most commonly used in an
Nat. Hazards Earth Syst. Sci., 11, 2419–2431, 2011 www.nat-hazards-earth-syst-sci.net/11/2419/2011/

P. Bonelli et al.: Wet snow hazard for power lines 2423
Fig. 4. Time diagramme of a major wet snow event referred to: (Ossola Valley – Piedmont – Italy; 13–15 December 2008).
Italian power grid. The empirical coefficientγ has been setto 1 in WOLF procedure because it is preferred to considerthe worst condition of ice accretion for alerting purpose. Thisvalue may clearly overestimate the ice load, but a more suit-able value can be considered only defining the contributionof some microphysical processes, as shedding and dripping,until now unknown. This is one of the reasons for which theauthors started in 2007, a continuous experimental campaignprogramme in different regions of Italy (Bonelli and Lacav-alla, 2009). This activity is explained in Sect. 3. Equation (3)is integrated during the whole wet-snow event. An event,predicted by WOLF in every grid point, is defined as a timeinterval in which the snowfall forecast is considered contin-uous and the snow sleeve around the conductor can grow,i.e., the meteorological variables as precipitation, tempera-ture, wind intensity, are in the required range for starting andmaintaining the process. In order to do that, the 3-hourlyforecast variables are separately analysed for each mesh of5× 5 km2. A wet snow icing event is detected applying spe-cific criteria: principally, the extreme temperature interval ineach point must intersect the typical range values of the wetsnow event: 0–2◦C.
In Eq. (3), the wind intensity does not appear, but it shouldbe taken into account because it contributes to the flux ofsnow massP as shown in Eq. (4).
P = P0
√1+
(V sin8
Vs
)2
(4)
where:P0 is the precipitation intensity measured or forecasted at
the ground (mm h−1 or kg m−2 h−1),V is the wind intensity at the conductor height (m s−1),θ is the angle between the wind direction and the conduc-
tor supposed horizontal,Vs is the vertical velocity of snowflakes (m s−1).Despite the correct formulation of Eq. (4) that can lead
to an increase ofP with respect toP0, some approximationshave been introduced in WOLF, considering the follow state-ments.
– Vs is difficult to forecast or to measure routinely by syn-optic weather stations. During our experimental cam-paigns, some values ofVs have been measured with a
www.nat-hazards-earth-syst-sci.net/11/2419/2011/ Nat. Hazards Earth Syst. Sci., 11, 2419–2431, 2011

2424 P. Bonelli et al.: Wet snow hazard for power lines
Fig. 5. Time diagramme referred to the Piacenza case on 08–10 March 2010.
laser precipitation monitoring (disdrometer), finding atypical figure of 2 m s−1.
– V should be given at the height of the conductor, butboth synoptic measurements and NWP outputs providethe wind intensity at 10 m height andθ is also difficultto estimate in a mountain terrain.
– Many observations in Italy show weak winds, below1 m s−1, during wet snow conditions.
These arguments led us to considerP = P0 in the first pro-totype version of WOLF. On the contrary, in the new releasethat will be operative in order to alert grid operators, the needto consider the worst possible condition forces us to computeP by Eq. (4) with the forecasted valueV and the angleθ setto 90◦.
Another important factor that should be taken into accountin the model is the Joule effect heating, caused by the electriccurrent flowing in the conductor and triggering the ice accre-tion. Some measurements of this effect have been carriedout in the experimental campaign activity and the influenceof Joule heating on the start-up of the accretion process will
be introduced in the next version of WOLF. At the moment,WOLF doesn’t take into account any electric current in theconductor.
2.4 The WOLF output and WEB-GIS display
WOLF forecast outputs are reported in a WEB-GIS ActiveDesktop, easy-accessible by the staff of Power Grid Mainte-nance Department of TERNA, the Italian TSO. The interac-tive WEB-GIS tool map allows us to display a large amountof information, as shown in Fig. 3.
First of all, the forecast hazard level of the expected max-imum ice load (kg m−1), calculated by Eq. (3) on the 3 con-ductor diameters, is plotted over a geographical base map inwhich the power lines are reported as well.
The ice-load hazard level has been set into 4 intervals asreported below, by using a typical colour scale, from greento red:
– 0.5 Kg–1 Kg m−1: green
– 1 Kg m−1–2 Kg m−1: yellow
Nat. Hazards Earth Syst. Sci., 11, 2419–2431, 2011 www.nat-hazards-earth-syst-sci.net/11/2419/2011/

P. Bonelli et al.: Wet snow hazard for power lines 2425
Table 1. Principal electrical accidents occurred during the WOLF simulation period.
Date Site Failure type(from the press)
Power line Wolf predictionIce load(kg m−1)
Wolf predictionIce-sleevethickness (cm)
From 13 to16/12/2008
Biella, Cuneo, Verbania(Piedmont)
Black-out afflicted morethan 50 000 users
Medium andhigh voltagegrid
10.6 13.5
28/04/2009 Gressoney(Valle d’Aosta)1800 m a.s.l.
22.8 mm. conductor brokedown
132 kV 12.4 18
10/03/2010 Ferrara and Piacenza(Emilia Romagna)
Diffuse and prolongedblack-outs pained25 000 users
Mediumvoltage grid
Ferrara: 1.2Piacenza: 4.3
Ferrara: 3.2Piacenza: 9.2
– 2 Kg m−1–5 Kg m−1: orange
– > 5 Kg m−1: red
These values have been chosen by referring to the build-ing design criteria of overhead lines. Other works, lead byAdmirat (Admirat and Sakamoto, 1988a, b) and consideringa historical database of “wet snow days” in French climaticstations, calculated the hazard reference levels by using thereturn period (year) of simulated ice-load accretions.
The “warning value” is set>5 kg m−1 and when it hap-pens, an alert is displayed on the active desktop where theuser can obtain further important and detailed informationabout the event. In particular, in WOLF, each single wetsnow episode shown in the map is characterised by:
– the altitudes concerned by wet-snow atmospheric layer(0◦C–2◦C);
– the precipitation amount (water equivalent in mm) in thearea;
– the solid fraction of snow precipitation (in mm);
– the wind intensity (m s−1) and its direction (◦) duringand after the event;
– the duration of wet-snow event (in hours);
– the label “icing” or “melting” , to represent the condi-tions after the events;
– the stress forces on conductors due to ice-load and windintensity;
– the diameters of ice-sleeves accreted on 3 reference con-ductors.
Additional data are available in the WEB-GIS map as:
– the high-voltage power lines network (132, 150, 220and 380 kV) with some additional information;
– the electric grid information;
– the raster cartography of Italy 1:750:000;
– the Digital Elevation Model (DEM) with 250 m gridspacing;
– the administrative boundaries of Italy.
The procedure provides, for each single wet-snow event,the time evolution of the episode. With 3-hourly forecastedweather data, the development of a snow event can be repre-sented by the air temperature, total amount of precipitation,wind intensity and direction. At each point, the mass and di-ameters of snow sleeves have been plotted in a time diagram,as shown in Fig. 4.
It is important to underline that the warnings issued byWOLF are “potential warnings” taking into account only thenecessary weather conditions for wet-snow accretion; for thisreason the False Alarm Rate (FAR) may be high, although thetotal number of warnings is still small compared to the snowevent frequency. Only after a field verification is it possible tocorrectly compute the FAR. According to this need, a WEB-GIS archive in WOLF is queried, providing model data thatmight be attached to the available observations, as shown inFig. 7.
3 WOLF application during the period 2009–2010
From November 2009 to April 2010, WOLF ran routinelyevery day, producing an icing forecast of the entire Italianterritory. Because of the occurrence of other important eventsin December 2008, WOLF was also tested in these cases.
www.nat-hazards-earth-syst-sci.net/11/2419/2011/ Nat. Hazards Earth Syst. Sci., 11, 2419–2431, 2011

2426 P. Bonelli et al.: Wet snow hazard for power lines
Fig. 6. Time diagram referred to the Ferrara case on 08–10 March 2010.
The simulation outputs allowed the authors to compare theforecasts with the only available information about the elec-trical accidents: the press articles. During the same period,some field campaigns have been carried out in order to col-lect detailed and local measurements (Bonelli et al., 2009),as explained further.
WOLF has been fed by the non-hydrostatic numericalweather prediction model LAMI (Limited Area Model Italy),developed in the framework of the COSMO4 Project andmanaged by ARPA – Emilia Romagna. The model has a7 km horizontal resolution, 41 vertical levels and it providesthe principal local meteorological variables at medium rangein time till +72 h. Every output field has been reported tothe WOLF horizontal grid with a spatial resolution of 5 km,by using a spatialization algorithm. This step is necessary toallow the feeding by other numerical weather models.
Every day WOLF produces a +72 h forecast of ice load ac-cumulated on conductors of different diameters during wet-snow precipitations. Some case studies have been analysed
4 COSMO is an international Consortium between Germany,Poland, Switzerland, Greece and Italy; for further information:www.cosmo-model.org
during observed failures in the power line grid and the wholeperiod output to evaluate the rate of false alarm. The ac-cidents which occurred in the period of the simulation, arereported in the Table 1.
In the Piedmont case, between the 13 and 16 Decem-ber 2008, a heavy and wide snowfall caused many powerline failures. The forecast of the total precipitation amountreached 150 mm and WOLF forecasted an ice-load of morethan 10 kg m−1 on the 22.8 mm conductor. The snow depthregistered in different areas of Piedmont as in Stura and Os-sola valleys, reached 1.5 m on the ground. The WOLF fore-cast for the Ossola valleys is shown in Fig. 4. In the Gres-soney case (28 April 2009), when a 22.8 mm conductor brokedown at an altitude of 1800 m a.s.l., WOLF forecasted an iceload greater than 12 kg m−1 and a precipitation amount of113 mm, that was confirmed by local observations (143 mmregistered by the heating rain gauge of Gressoney S. J.). Fig-ure 8 shows a zoom of the Gressoney area on the WOLFdisplay.
The Emilia Romagna events (10 March 2010) were char-acterised by prolonged and wide spread snowfall combinedwith wind intensity till 10 m s−1 in the east part of the area
Nat. Hazards Earth Syst. Sci., 11, 2419–2431, 2011 www.nat-hazards-earth-syst-sci.net/11/2419/2011/

P. Bonelli et al.: Wet snow hazard for power lines 2427
Fig. 7. Web-GIS Archive tool: it is possible to download and visu-alize each event stored in the Archive, through the data list menu.
(Ferrara) and even with wind gusts of 25 m s−1 on the coastof Romagna. In particular, the total precipitation amount(rain + snow) forecasted was 47 and 65 mm, respectively, atFerrara and Piacenza. Some local and different observationswere available: a total precipitation (rain + snow) of 17 mmat Ferrara, and 37 mm at Piacenza. Despite the precipitationnot being heavy in Ferrara, diffuse and protracted black-outsafflicted thousands of users. In this case, it’s reasonable toassume that the wind intensity was the main cause of elec-trical outages due also to indirect effects, as trees fell on theoverhead lines. Conversely, the city of Piacenza was afflictedby a strong wet-snowfall and the accidents were principallydue to the ice overload on conductors.
The accretion model in WOLF provided a value of 1.2 and4.3 kg m−1 for Ferrara and Piacenza, respectively, with an icesleeve thickness of 3.2 and 9.2 cm. This difference is onlydue to the different amount of forecasted precipitation with-out any wind effect in the accretion model. Figures 5 and 6show the time development of the event on the two sites fore-casted by WOLF. Even though the poor available weatherobservations, the occurring events agree with the forecast ofstrong wind in Ferrara and heavy precipitation in Piacenza.
WOLF allowed the calculation of ice loads due to wetsnow through the 2009–2010 season. The histogram inFig. 11 reports the frequency of load classes forecasted byWOLF. Obviously, the first two lowest classes include mostof the predicted cases (86.8 %). Fixing the value of 5 kg m−1,as the load alert threshold for a 31.5 mm conductor, it canbe observed that the percentage of events, with a depositiongreater than that fixed value, is 1.2 % of the total number ofwet snow events. These results seem to confirm a low num-ber of dangerous events, important feature of a meteorologi-cal warning system. The histogram in Fig. 12 highlights that,most of the wet snowfall, occurs below 1500 m a.s.l. and onlyfew cases (5 %) happened at a high altitude (>2000 m a.s.l.).
Fig. 8. Web-GIS Archive tools: the output of WOLF provided sev-eral alerts (>5 Kg m−1).
A deeper analysis is shown in Fig. 13, where the different ice-load classes are divided for range of altitude. The lowest iceload class (1–2 kg m−1) occurs under 1000 m a.s.l. (36 %), al-though higher load classes also happen at low altitude. Thetwo highest loads presents no preferring altitudes.
For the season 2009–2010, the geographical distributionof ice load events, greater than 2 kg m−1, for a 31.5 mm con-ductor, are plotted in Fig. 10. In the map, it is evident thatthe most important events occurred both in mountain regionsand in the plain. The Ossola Valley (Piedmont region) showsthe highest frequency. The major loads forecasted by WOLFwere in the Alpine region, but few events occurred also in thenorthern part of Apennines and in the Po valley.
Field measurements during wet-snow events are funda-mental in improving the knowledge on the physical process,as well as the possibility to tune the ice accretion modelon conductors (Cigre, 2001; Thorsteins and Eliasson, 1998).The IEC 61774 rules (IEC, 1997) recommend a strategy forcollecting different data sources in order to obtain the bestpossible information basis to evaluate the maximum designload.
For these reasons, the authors collected field data by meansof mobile campaigns started on the 2007–2008 cold season(Bonelli and Lacavalla, 2009). In particular, in the 2009–2010 season, two campaigns have been lead in sites with dif-ferent geographical characteristics. Some data from thosecampaigns have been compared with WOLF outputs: eitherthe meteorological forecast and the ice loads. Snow accretionwas measured on test conductors with a diameter of 31.5 mmfree to rotate, being one of the typical conductors used in HVgrid. Table 2 reports a selection of forecasted and observeddata collected at Riale (Alpine valley in the Piedmont region)and nearby Alba (Po valley city in the Piedmont region). Theforecasts are obtained from the 00:00 UTC model run on thesame day of the campaign.
www.nat-hazards-earth-syst-sci.net/11/2419/2011/ Nat. Hazards Earth Syst. Sci., 11, 2419–2431, 2011

2428 P. Bonelli et al.: Wet snow hazard for power lines
Fig. 9. Measurements collected during the experimental campaign of Alba (Piedmont; 7–8 January 2010).
In Fig. 9, the principal measurements are represented, col-lected during the experimental campaign of Alba on the 7–8 January 2010. The temperature decreased to 0◦C beforethe beginning of the precipitation that started in the evening.During the whole event, the wind intensity remained low(<1 m s−1) not playing an important role for the ice accre-tion or shedding. The precipitation measured by a heatedrain gauge for the whole event was 28 mm, with a max rainrate of 9.5 mm h−1. In the figure, the size of the blue bub-ble points is proportional to the ice load with a maximum of0.698 Kg m−1 on the morning of the 8th. At the end of theevent, the air temperature slightly increased, the snow turnedinto rain and the ice-sleeve fell down.
During the Riale event on the 29–30 March 2010, thetemperature during the precipitation decreased below 0◦C,reaching a minimum value of−1.6◦C. The wind was absentduring the whole event and the total amount of precipitationwas 47 mm. Because of the low temperatures, the snowfallhas had characteristics of dry-snow and the ice load on theconductor was rather limited not only for the low density ofsleeve, but also for frequent ice shedding due to lack of co-hesive forces.
The time-integrated values in Table 2 are referred to thewhole snow event, whose time-interval is defined from theobservations. In order to separate the performance of NWPmodel from that one of the accretion model used in WOLF,ice load is computed using the observed meteorological vari-ables. It is important to underline that in both cases in Ta-ble 2, the observed average air temperatures were close to0◦C at Alba and slightly negative at Riale. The ice-loadmeasurements show no severe values. Correctly, the WOLF
Fig. 10. Geographical distribution of significant events (ice loadgreater than 2 Kg m−1) forecasted by WOLF.
forecast did not issue any alerts. Table 2 shows that the pre-cipitation amounts are well forecasted at Riale and slightlyoverestimated at Alba, while the average temperatures arequite well predicted in both cases. At Riale, the temperaturedecreased from 0.2 to−1.6◦C during the snowfall explaining
Nat. Hazards Earth Syst. Sci., 11, 2419–2431, 2011 www.nat-hazards-earth-syst-sci.net/11/2419/2011/
P. Bonelli et al.: Wet snow hazard for power lines 2429
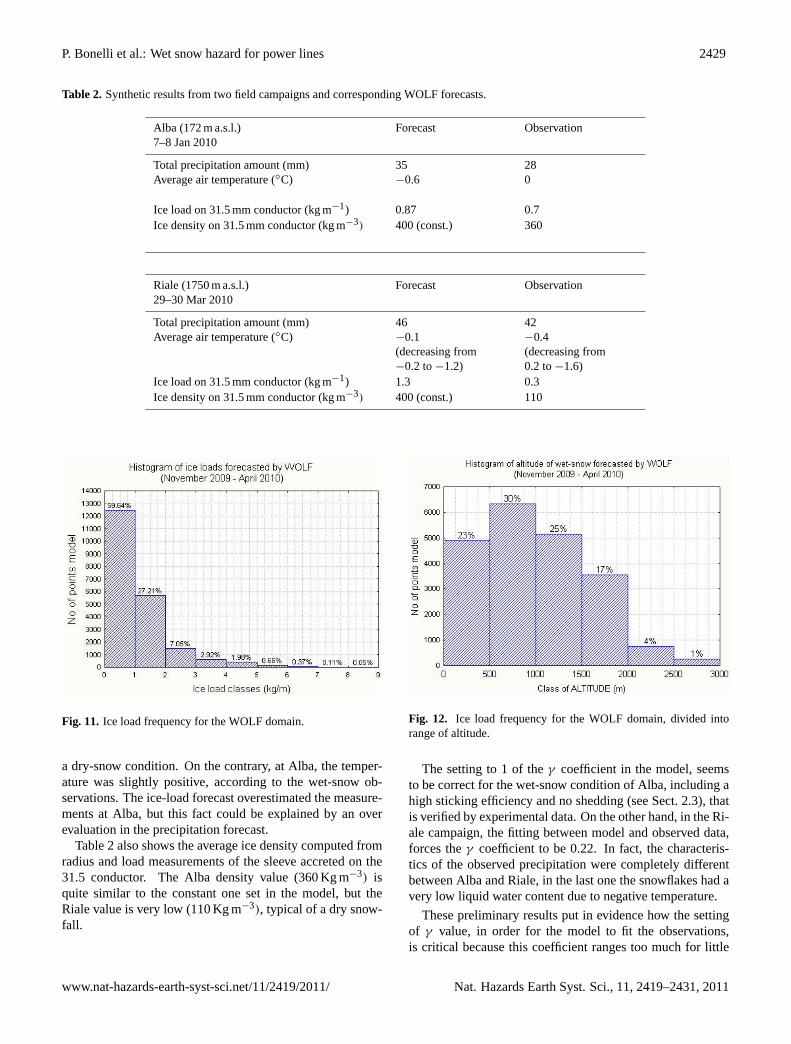
Table 2. Synthetic results from two field campaigns and corresponding WOLF forecasts.
Alba (172 m a.s.l.)7–8 Jan 2010
Forecast Observation
Total precipitation amount (mm) 35 28Average air temperature (◦C) −0.6 0
Ice load on 31.5 mm conductor (kg m−1) 0.87 0.7Ice density on 31.5 mm conductor (kg m−3) 400 (const.) 360
Riale (1750 m a.s.l.)29–30 Mar 2010
Forecast Observation
Total precipitation amount (mm) 46 42Average air temperature (◦C) −0.1
(decreasing from−0.2 to−1.2)
−0.4(decreasing from0.2 to−1.6)
Ice load on 31.5 mm conductor (kg m−1) 1.3 0.3Ice density on 31.5 mm conductor (kg m−3) 400 (const.) 110
Fig. 11. Ice load frequency for the WOLF domain.
a dry-snow condition. On the contrary, at Alba, the temper-ature was slightly positive, according to the wet-snow ob-servations. The ice-load forecast overestimated the measure-ments at Alba, but this fact could be explained by an overevaluation in the precipitation forecast.
Table 2 also shows the average ice density computed fromradius and load measurements of the sleeve accreted on the31.5 conductor. The Alba density value (360 Kg m−3) isquite similar to the constant one set in the model, but theRiale value is very low (110 Kg m−3), typical of a dry snow-fall.
Fig. 12. Ice load frequency for the WOLF domain, divided intorange of altitude.
The setting to 1 of theγ coefficient in the model, seemsto be correct for the wet-snow condition of Alba, including ahigh sticking efficiency and no shedding (see Sect. 2.3), thatis verified by experimental data. On the other hand, in the Ri-ale campaign, the fitting between model and observed data,forces theγ coefficient to be 0.22. In fact, the characteris-tics of the observed precipitation were completely differentbetween Alba and Riale, in the last one the snowflakes had avery low liquid water content due to negative temperature.
These preliminary results put in evidence how the settingof γ value, in order for the model to fit the observations,is critical because this coefficient ranges too much for little
www.nat-hazards-earth-syst-sci.net/11/2419/2011/ Nat. Hazards Earth Syst. Sci., 11, 2419–2431, 2011

2430 P. Bonelli et al.: Wet snow hazard for power lines
Fig. 13. As in Fig. 12, divided into ranges of altitude and ice load.
temperature variations across the 0◦C. This effect is due tothe sudden change of the adhesive characteristics of snowflakes.
4 Conclusions
This paper presents a forecast system (WOLF) able to com-pute ice-accretion on overhead power lines, due to wet-snow.The system provides alarms and displays meteorological andpower lines information on an easy GIS interface. WOLF isdevoted to the power grid managers that can adopt defencestrategies to reduce the effect of possible accidents.
WOLF has been applied in Italy for an entire cold period(November 2009–April 2010), demonstrating the capabilityto forecast some real accidents and to build datasets, also use-ful for statistical studies. In that period, WOLF predicted 6days of severe wet-snow conditions when 2 power line acci-dents, on different days, occurred in the right areas. A thirdaccident, happened in December 2008, which was correctlypredicted by means of a dedicated simulation. These results,demonstrate the WOLF ability to predict critical events andprovide alerts, necessary to adopt dispatching strategies, re-ducing the effects of power supply failures.
Analysing the whole output produced by WOLF, it hasbeen possible to identify the mostly afflicted sites by wet-snow conditions in Italy, although for only one short period.This procedure suggests the possibility to build a climatologyof the wet-snow conditions over a wide geographic area.
Experimental campaigns have been carried out in order tomeasure ice-load and local weather variables involved in theaccretion process. Some results have been reported in thispaper. The comparison between the WOLF forecasts and theobservations, lead to verify the right parameterization of themicrophysical processes in the accretion model, expressed bytheγ factor, but only for a positive temperature close to 0◦C.Sleeve accretion was observed for negative temperature too,but in this case the model does not produce the right forecastand it should be re-tuned.
WOLF has been developed following some hints comingfrom similar experiences of other countries, but it representsthe first effort in Italy on this subject. It is common think-ing that a unique general purpose-wide area forecast systemcould not meet the needs of countries with different climaticconditions and grid management, but it is good practice todevelop and test different systems.
The authors realise that the role of wind intensity and itsdirection on the accretion process has not been investigated,due to the poor experimental data, but they think by improv-ing the knowledge on this topic with further campaigns. Fur-thermore, the vertical velocity of snowflakes combined withthe wind intensity is another important parameter that shouldbe considered, in order to better calculate the effective snowflux on the conductor. The authors experienced that this valuecannot be considered constant or negligible.
In the future, the authors plan to improve the WOLF algo-rithm introducing the heating Joule effect and a more suitablealarm system including SMS messages.
Nat. Hazards Earth Syst. Sci., 11, 2419–2431, 2011 www.nat-hazards-earth-syst-sci.net/11/2419/2011/

P. Bonelli et al.: Wet snow hazard for power lines 2431
Acknowledgements.This work has been financed by the ResearchFund for the Italian Electrical System under the Contract Agreementbetween RSE (formerly known as ERSE) and the Ministry of Eco-nomic Development – General Directorate for Nuclear Energy, Re-newable Energy and Energy Efficiency stipulated on 29 July 2009in compliance with the Decree of 19 March 2009.
The authors give thanks to their colleague Giovanni Pirovano forproviding them with suggestions and some data.
Edited by: N. R. DaleziosReviewed by: T. Niedzwiedz and another anonymous referee
References
Admirat, P. and Sakamoto, Y. : Calibration of a wet-snow model onreal cases in Japan and France, in: Proc. 4th International Work-shop on Atmospheric Icing of Structures, Paris, 7–13, 1988a.
Admirat, P. and Sakamoto, Y. : Wet snow on overhead lines: astate of the art, in: Proc. of the 4th International Workshop onAtmospheric Icing of Structures, Paris, 7–13, 1988b.
Bonelli, P. and Lacavalla, M. : Experimental activity and investi-gation of wet-snow accretion on overhead power lines in Italy,in: Proc. 13th International Workshop on Atmospheric Icing ofStructures, Andermatt, September 2009.
Bonelli, P. and Lacavalla, M. : Trend in snow deposition on over-head electric lines: using synoptic data to investigate the rela-tionship black-out risk/climate change. Management of Weatherand Climate Risk in the Energy Industry, NATO Science forPeace and Security Series – C. Environmental Security, editedby: Troccoli, A., (ISSN: 1874-6519), January 2010.
Bonelli, P., Marcacci, P., and Lacavalla, M.: Caratterizzazionedel fenomeno di ghiacciamento di linee elettriche, Rapporto diRicerca di Sistema WP 3.2, CESI RICERCA, Febbraio 2008.
Cigre: Guidelines for field measurement of ice loadings on over-head power line conductors, Cigre Task Force 22.06.01, TB179,2001.
Cigre: Guidelines for meteorological icing models, statistical meth-ods and topographical effects, Cigre Working Group B2.16,TB291, Revision 6, May 2005.
Cigre: System for prediction and monitoring of ice shedding, anti-icing and de-icing for overhead lines. Cigre Working GroupB2.29, September 2009.
Farzaneh, M.: Atmospheric Icing of Power Networks, edited by:Farzaneh, M., Springer Science, 2008.
Fikke, S.: Cost Action 727 Measuring and forecasting atmosphericicing on structures, in: Proc. 11th International Workshop onAtmospheric icing of Structures, Montreal, Canada, June PaperIW64, 2005a.
Fikke, S.: Modern meteorology and atmospheric icing, in: Proc.11th International Workshop on Atmospheric icing on Struc-tures, Montreal, Canada, June, Paper IW73, 2005b.
Fikke, S., Ronsten, G., Heimo, A., Kunz, S., Ostrozlik, M., Persson,P. E., Sabata, J., Wareing, B., Wichure, B., Chum, J., Laakso, T.,Santti, K., and Makkonen, L.: COST 727: Atmospheric Icingon structures, Measurements and data collection on icing: Stateof the Art, Publication of MeteoSwiss, 75, 110 pp., ISSN:1422-1381, 2007.
Gland, H. and Admirat, P.: Meteorological conditions for wet snowoccurrence in France, Calculated and measured results in a recentcase study on March 5th, 1985, in: Proc. of the 3rd InternationalWorkshop on Atmospheric icing of Structures, Vancouver, 1986.
IEC: Loading and strength of overhead transmission lines, IECTechnical Report, 1991.
IEC: Overhead lines – Meteorological data for assessing climaticloads, International Electrotechnical Commission Technical Re-port 61774, 1997.
IEC: Design criteria of overhead transmission lines. InternationalElectrotechnical Commission Technical Report 60826, Ed.3.0,2003.
Makkonen, L.: Modelling of ice accretion on wires, J. ClimateAppl. Meteor., 23, 929–939, 1984.
Makkonen, L.: Estimation of wet-snow accretion on wires, ColdRegions, Sci. Technol., 17, 83–88, 1989.
Makkonen, L.: Models for the growth of rime, glaze, icicles andwet-snow on structures, Phil. Trans. R. Soc. London. A, 358,2913–2939, 2000.
Olafsson, H., Eliasson, A. J., and Thorsteins, E.: Orographic influ-ence on wet-snow icing, Part 1: Upstream of mountains, in: Proc.10th International Workshop on Atmospheric Icing of Structures,Brno, Check Republic, June, Paper 2-2, 2002a.
Olafsson, H., Eliasson, A. J., and Thorsteins, E.: Orographic in-fluence on wet-snow icing, Part 2: Downstream of mountains,in: Proc. 10th International Workshop on Atmospheric Icing ofStructures, Brno, Check Republic, June, Paper 2-3, 2002b.
Poots, G.: Ice and snow accretion on wires, Wiley, 1996.Sakamoto, Y.: Snow accretion on overhead wires. Phil. Trans. R.
Soc. London, 358(1776), 2941–2970, 2000.Thorsteins, E. and Eliasson, A. J.: Iceload measurements in test
spans in Iceland – statistical analysis of data, in: Proc. 8th In-ternational Workshop on Atmospheric Icing of Structures, Reyk-javik, June, 285–289, 1998.
Toth, K., Lakatos, M., Kollath, K., Fulop, R., and Simon, A.: Cli-matology and forecasting of severe wet snow icing in Hungary,in: Proc. 13th International Workshop on Atmospheric Icing ofStructures, Andermatt, September 2009.
Wareing, B. J. and Nygaard, B. E.: WRF Simulation of wet snowand rime icing incidents in the UK, in: Proc. 13th Interna-tional Workshop on Atmospheric Icing of Structures, Andermatt,September 2009.
www.nat-hazards-earth-syst-sci.net/11/2419/2011/ Nat. Hazards Earth Syst. Sci., 11, 2419–2431, 2011