Embed Size (px)
Citation preview
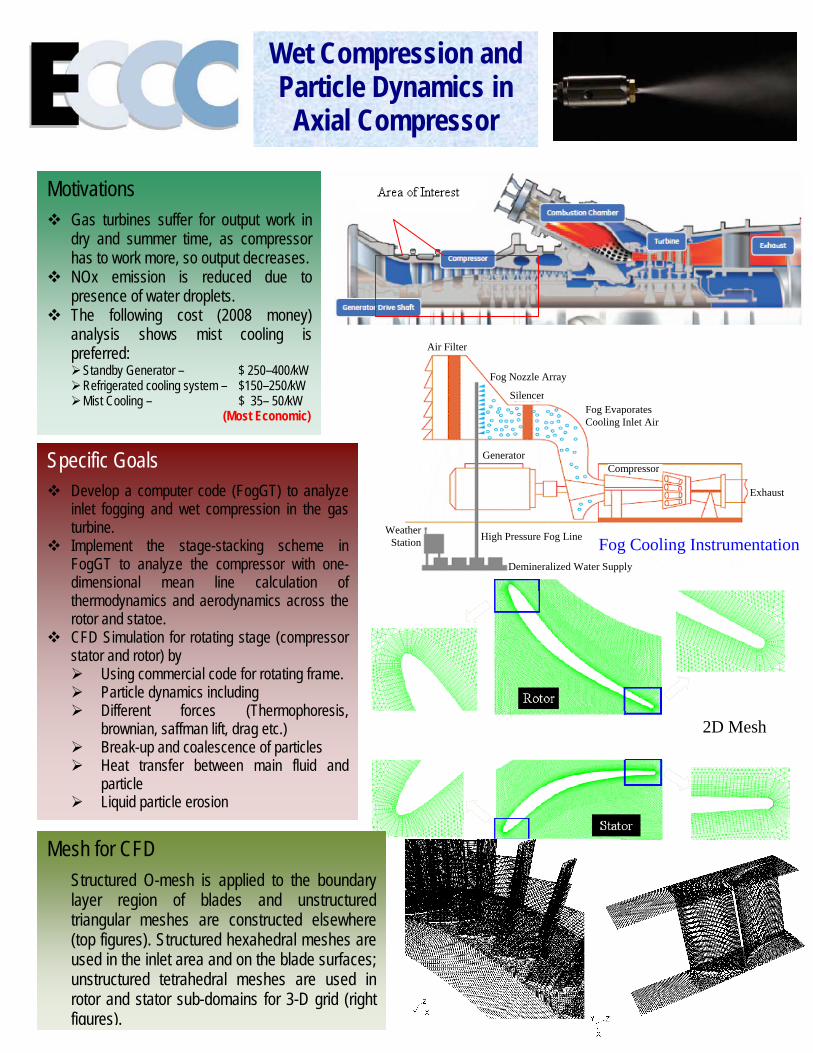
Wet Compression and Particle Dynamics in
Axial Compressor
Motivations
Gas turbines suffer for output work in dry and summer time, as compressor has to work more, so output decreases.
NOx emission is reduced due to presence of water droplets.
The following cost (2008 money) analysis shows mist cooling is preferred:
Standby Generator – $ 250–400/kW Refrigerated cooling system – $150–250/kW Mist Cooling – $ 35– 50/kW
(Most Economic)
Specific Goals
Develop a computer code (FogGT) to analyze inlet fogging and wet compression in the gas turbine.
Implement the stage-stacking scheme in FogGT to analyze the compressor with one-dimensional mean line calculation of thermodynamics and aerodynamics across the rotor and statoe.
CFD Simulation for rotating stage (compressor stator and rotor) by
Using commercial code for rotating frame. Particle dynamics including Different forces (Thermophoresis,
brownian, saffman lift, drag etc.) Break-up and coalescence of particles Heat transfer between main fluid and
particle Liquid particle erosion
Mesh for CFD
Structured O-mesh is applied to the boundary layer region of blades and unstructured triangular meshes are constructed elsewhere (top figures). Structured hexahedral meshes are used in the inlet area and on the blade surfaces; unstructured tetrahedral meshes are used in rotor and stator sub-domains for 3-D grid (right figures).
Air Filter
Fog Nozzle Array
Weather Station High Pressure Fog Line
Demineralized Water Supply
Fog Evaporates Cooling Inlet Air
Generator
Exhaust
Compressor
Silencer
Fog Cooling Instrumentation
2D Mesh
30°
90°
42°Points of accumulation
Point of maximum erosion
3D Mesh
(a)
a
b
(a)
a
b
b′b′′ 2′′
(b)
Case 2 (Hot)Case 3 (Overspray) Case 4/5 (Interstage
Spray) 2′′
P
v
1 1′
2 2′
4
3
T1
T1′
c
v
P
1
2
2′
d1
d
c
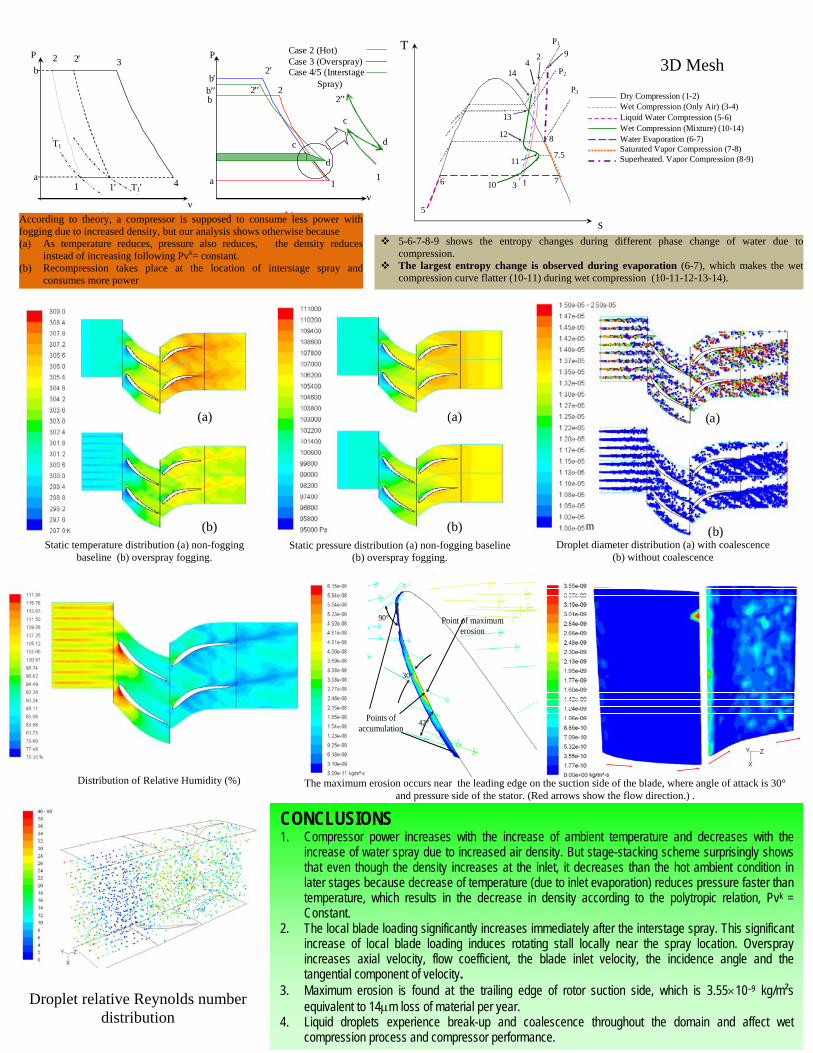
According to theory, a compressor is supposed to consume less power withfogging due to increased density, but our analysis shows otherwise because (a) As temperature reduces, pressure also reduces, the density reduces
instead of increasing following Pvk= constant. Recompression takes p(b) lace at the location of interstage spray an dconsumes more power
T
P2
P1
P3
s
Dry Compression (1-2)
1
2
3
49
Wet Compression (Only Air) (3-4)
5
6
Liquid Water Compression (5-6)
710
Wet Compression (Mixture) (10-14)
7.5
Water Evaporation (6-7)
11Saturated Vapor Compression (7-8)
8
13
14
12
Superheated. Vapor Compression (8-9)
5-6-7-8-9 shows the entropy changes during different phase change of water due tocompression. The largest entropy change is observed during evaporation (6-7), which makes the wet compression curve flatter (10-11) during wet compression (10-11-12-13-14).
(a)
(b)m
Static pressure(b) overspray fogging. distribution (a) non-fogging baseline
(b)(b)
(a)
Droplet diam(b) without coalescence
Static t gging baseline (b) overspray fogging.
The maximum erosion occurs near the leading edge on the suction side of the blade, where angle of attack is 30° and pressure side of the stator. (Red arrows show the flow direction.) .
Distribution of Relative Humidity (%)
eter distribution (a) with coalescence emperature distribution (a) non-fo
CONCLUSIONS 1. Compressor power increases with the increase of ambient temperature and decreases with the
increase of water spray due to increased air density. But stage-stacking scheme surprisingly shows that even though the density increases at the inlet, it decreases than the hot ambient condition in later stages because decrease of temperature (due to inlet evaporation) reduces pressure faster than temperature, which results in the decrease in density according to the polytropic relation, Pvk = Constant.
2. The local blade loading significantly increases immediately after the interstage spray. This significant increase of local blade loading induces rotating stall locally near the spray location. Overspray increases axial velocity, flow coefficient, the blade inlet velocity, the incidence angle and the tangential component of velocity.
3. Maximum erosion is found at the trailing edge of rotor suction side, which is 3.55×10⁻⁹ kg/m²s equivalent to 14μm loss of material per year.
4. Liquid droplets experience break-up and coalescence throughout the domain and affect wet compression process and compressor performance.
roplet relative Reynolds number distribution
D