Embed Size (px)
Citation preview
Business and Consumer Banking
Discussion Pack
Mike Pratt Group Executive, Business & Consumer Banking
August/September 2003
BCB Discussion Pack – Aug/Sept 200322
Disclaimer
The material contained in this presentation is intended to be general background information on Westpac Banking Corporation and its activities.
The information is supplied in summary form and is therefore not necessarily complete. Also, it is not intended that it be relied upon as advice to investors or potential investors, who should consider seeking independent professional advice depending upon their specific investment objectives, financial situation or particular needs.
BCB Discussion Pack – Aug/Sept 200333
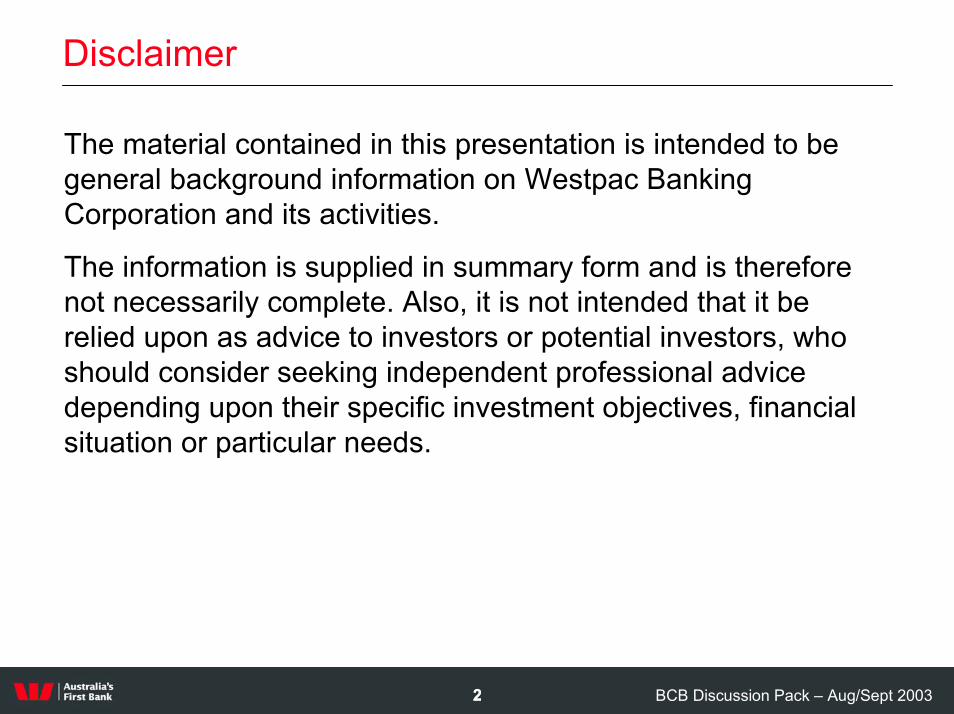
Business and Consumer Banking today
Underlying cash earnings by business unit (1H03)
BCB53%
Wealth8%
Institutional Bank19%
NZ Retail15%
Other5%
• Australian retail banking and wealth distribution
• Customer-driven organisational structure
• Optimal geographic footprint
• 5.1 million customers
• Customers that consider us their main bank:- 13% Consumer- 20% Middle Markets- 16% SME
• 13,841 staff employed
BCB Discussion Pack – Aug/Sept 200344
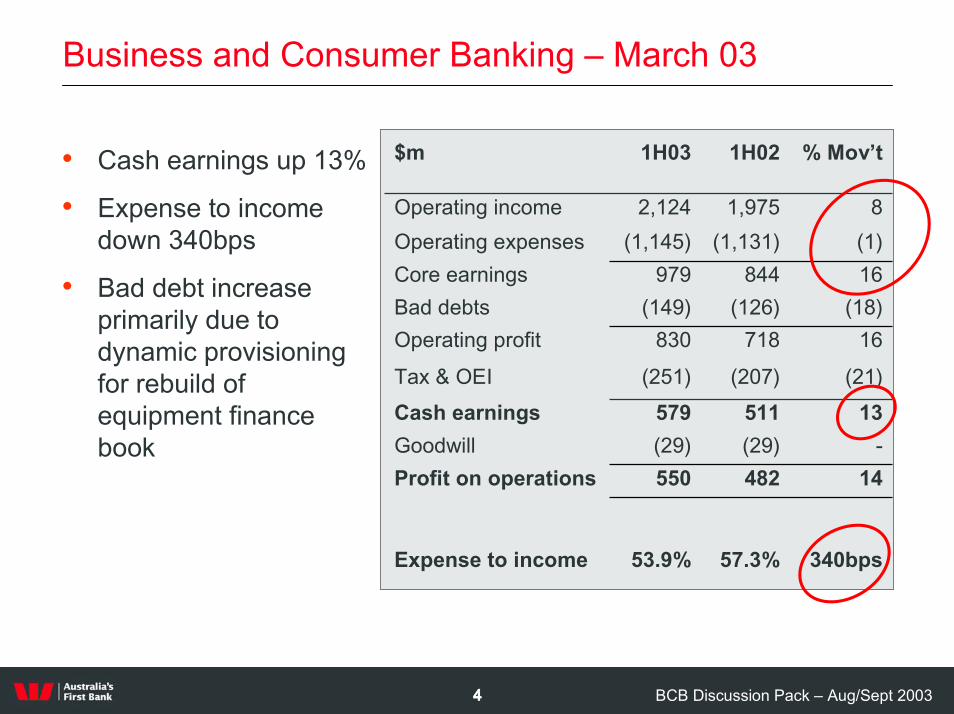
Business and Consumer Banking – March 03
14482550Profit on operations
(18)(126)(149)Bad debts
340bps57.3%53.9%Expense to income
(29)579
(251)
830
979(1,145)
2,124
1H03
-(29)Goodwill13511Cash earnings
(21)(207)Tax & OEI
16718Operating profit
16844Core earnings(1)(1,131)Operating expenses
81,975Operating income
% Mov’t1H02$m• Cash earnings up 13%
• Expense to income down 340bps
• Bad debt increase primarily due to dynamic provisioning for rebuild of equipment finance book
BCB Discussion Pack – Aug/Sept 200355
Achievements - year to date
• Business-unit led initiatives contributed 13% to cash earnings – Pricing review– Disciplined cost management
• Branch and small business initiatives in place – quality of referrals up – customer satisfaction is up
• Lending Process Project (Pinnacle)– credit card scorecards upgraded– single customer view within collections
• CRM Project (Reach) – early results– leads converted to opportunity 78%– cross-sell 23% of contacts, contact to sale 9%
• Customer Experience– queues and credit cards being addressed
• Westpac Academy– 14% of staff have participated in the training
BCB Discussion Pack – Aug/Sept 200366
What the market is saying
• What is behind the strong growth in loans and acceptances, particularly in business banking?
• How can market share growth momentum be maintained?
• What is happening in the mortgage book, and how are you managing the broker channel?
• How is Westpac going to differentiate itself from its peers on customer service?
• What is Westpac doing in CRM?
• How is the Virgin Card partnership progressing?
BCB Discussion Pack – Aug/Sept 200377
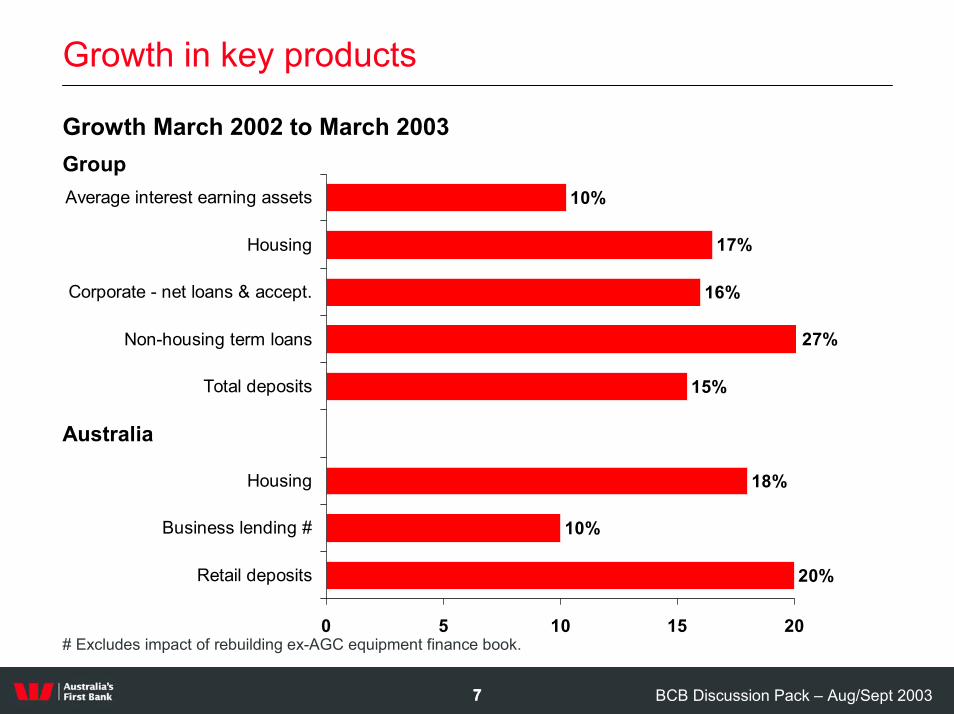
Growth in key products
Growth March 2002 to March 2003
27%
16%
17%
10%
18%
10%
20%
15%
0 5 10 15 20
Retail deposits
Business lending #
Housing
Total deposits
Non-housing term loans
Corporate - net loans & accept.
Housing
Average interest earning assets
Group
Australia
# Excludes impact of rebuilding ex-AGC equipment finance book.
BCB Discussion Pack – Aug/Sept 200388
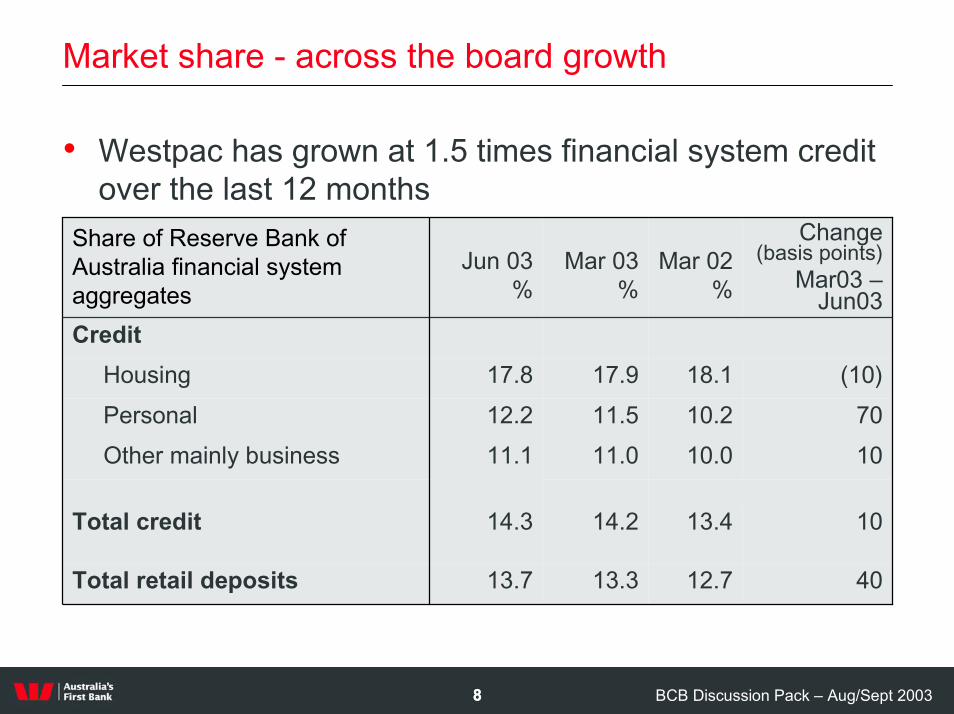
Market share - across the board growth
• Westpac has grown at 1.5 times financial system credit over the last 12 months
13.7
14.3
11.112.217.8
Jun 03%
Credit(10)18.117.9Housing
13.3
14.2
11.011.5
Mar 03%
4012.7Total retail deposits
1013.4Total credit
1010.0Other mainly business7010.2Personal
Change (basis points)
Mar03 –Jun03
Mar 02%
Share of Reserve Bank of Australia financial system aggregates
BCB Discussion Pack – Aug/Sept 200399
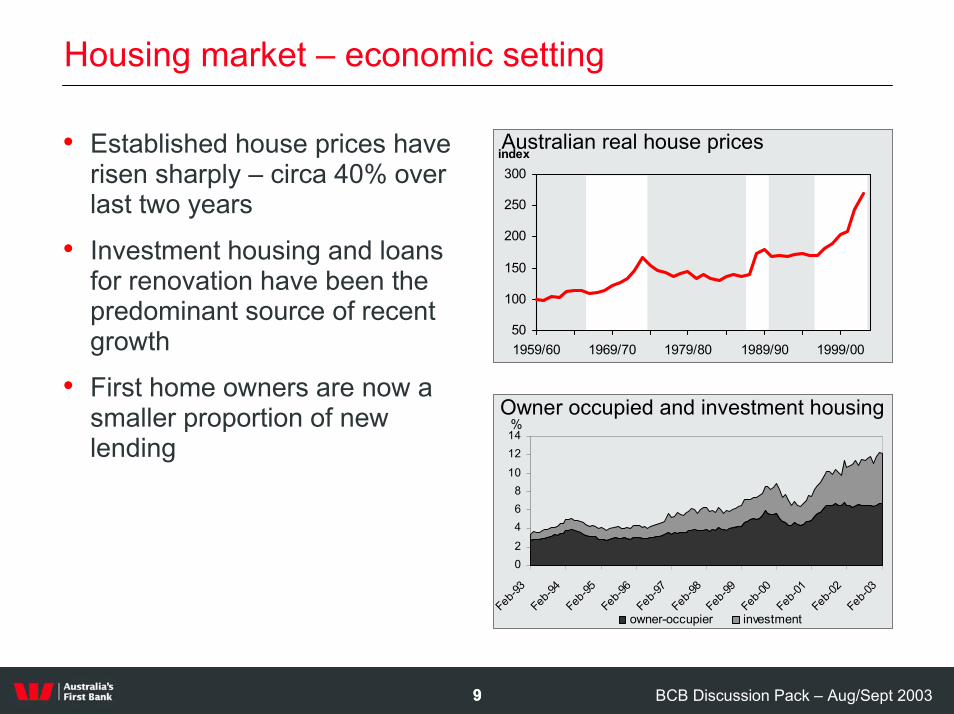
Housing market – economic setting
• Established house prices have risen sharply – circa 40% over last two years
• Investment housing and loans for renovation have been the predominant source of recent growth
• First home owners are now a smaller proportion of new lending
Australian real house prices
50
100
150
200
250
300
1959/60 1969/70 1979/80 1989/90 1999/00
index
Owner occupied and investment housing
02468
101214
Feb-93
Feb-94
Feb-95
Feb-96
Feb-9
7Feb-9
8Feb
-99Feb
-00Feb
-01Fe
b-02
Feb-0
3
owner-occupier investment
%
BCB Discussion Pack – Aug/Sept 20031010
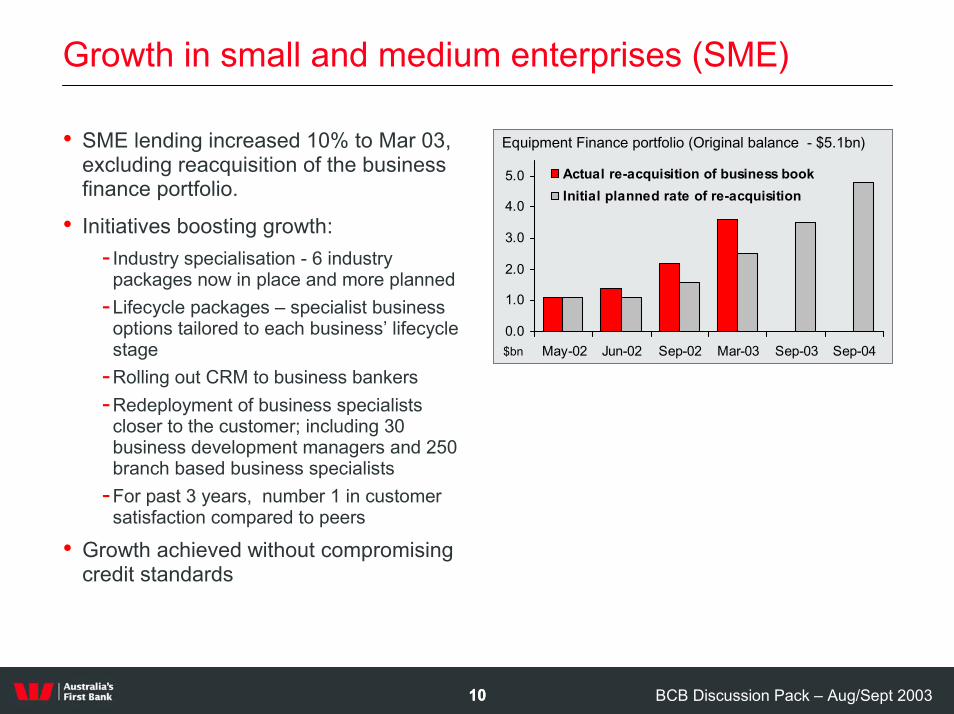
Growth in small and medium enterprises (SME)
• SME lending increased 10% to Mar 03, excluding reacquisition of the business finance portfolio.
• Initiatives boosting growth:- Industry specialisation - 6 industry
packages now in place and more planned-Lifecycle packages – specialist business
options tailored to each business’ lifecycle stage
-Rolling out CRM to business bankers-Redeployment of business specialists
closer to the customer; including 30 business development managers and 250 branch based business specialists
-For past 3 years, number 1 in customer satisfaction compared to peers
• Growth achieved without compromising credit standards
0.0
1.0
2.0
3.0
4.0
5.0
May-02 Jun-02 Sep-02 Mar-03 Sep-03 Sep-04
Actual re-acquisition of business bookInitial planned rate of re-acquisition
Equipment Finance portfolio (Original balance - $5.1bn)
$bn
BCB Discussion Pack – Aug/Sept 20031111
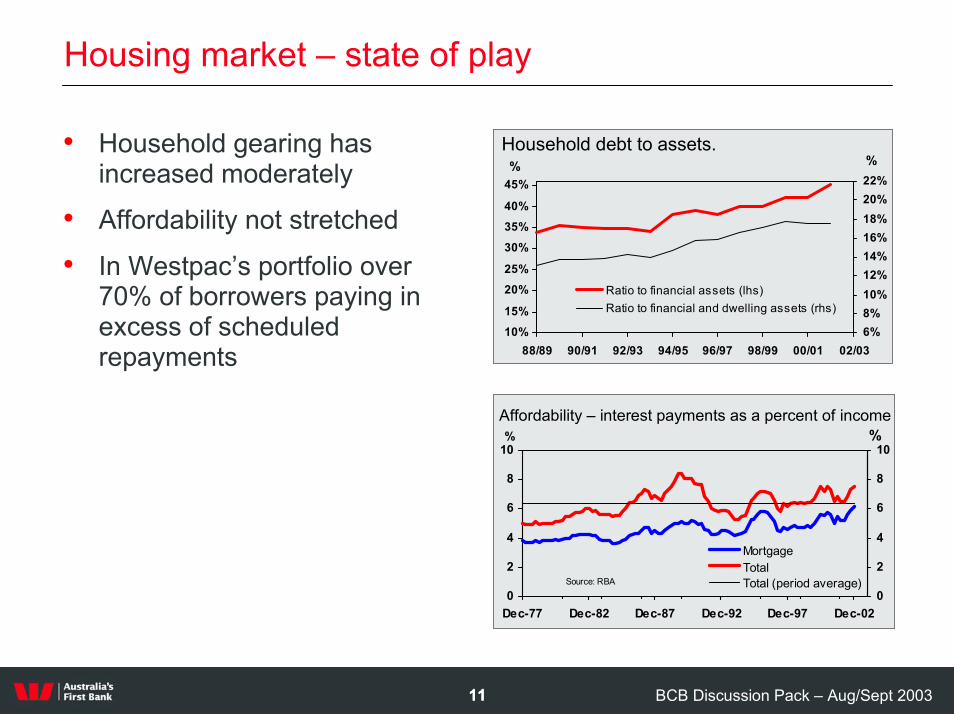
Housing market – state of play
• Household gearing has increased moderately
• Affordability not stretched
• In Westpac’s portfolio over 70% of borrowers paying in excess of scheduled repayments
Household debt to assets.
10%15%
20%25%
30%35%40%
45%
88/89 90/91 92/93 94/95 96/97 98/99 00/01 02/03
%
6%8%10%12%14%16%18%20%22%%
Ratio to financial assets (lhs)Ratio to financial and dwelling assets (rhs)
Affordability – interest payments as a percent of income
0
2
4
6
8
10
Dec-77 Dec-82 Dec-87 Dec-92 Dec-97 Dec-02
%
0
2
4
6
8
10%
MortgageTotal Total (period average)Source: RBA
BCB Discussion Pack – Aug/Sept 20031212
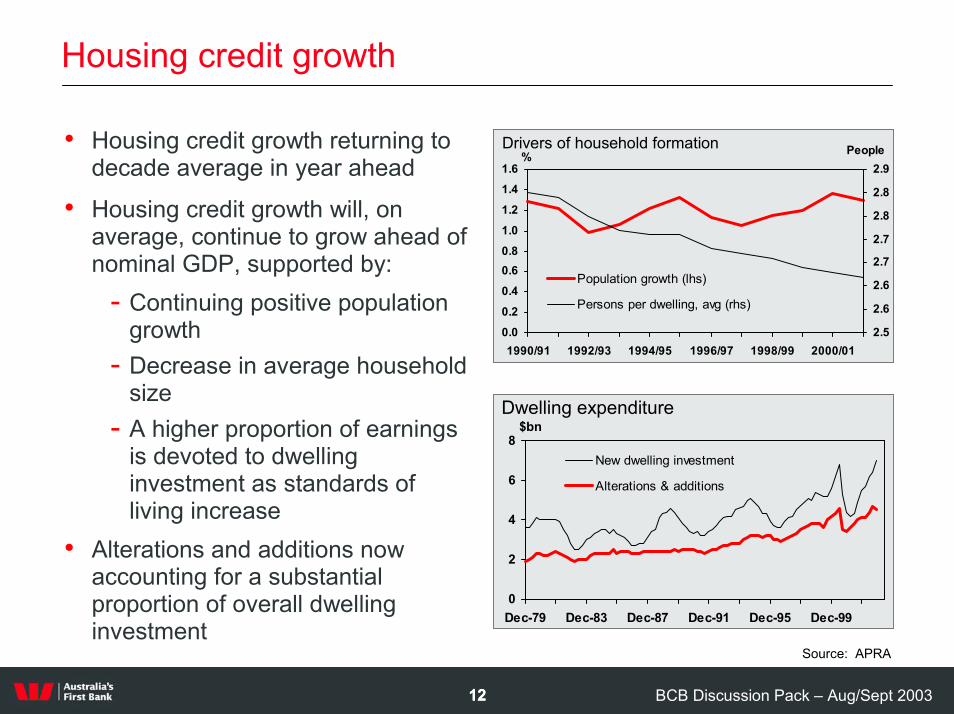
Housing credit growth
• Housing credit growth returning to decade average in year ahead
• Housing credit growth will, on average, continue to grow ahead of nominal GDP, supported by:
- Continuing positive population growth
- Decrease in average household size
- A higher proportion of earnings is devoted to dwelling investment as standards of living increase
• Alterations and additions now accounting for a substantial proportion of overall dwelling investment
0.00.20.40.60.81.01.21.41.6
1990/91 1992/93 1994/95 1996/97 1998/99 2000/01
%
2.5
2.6
2.6
2.7
2.7
2.8
2.8
2.9People
Population growth (lhs)
Persons per dwelling, avg (rhs)
Drivers of household formation
0
2
4
6
8
Dec-79 Dec-83 Dec-87 Dec-91 Dec-95 Dec-99
$bn
New dwelling investment
Alterations & additions
Dwelling expenditure
Source: APRA
BCB Discussion Pack – Aug/Sept 20031313
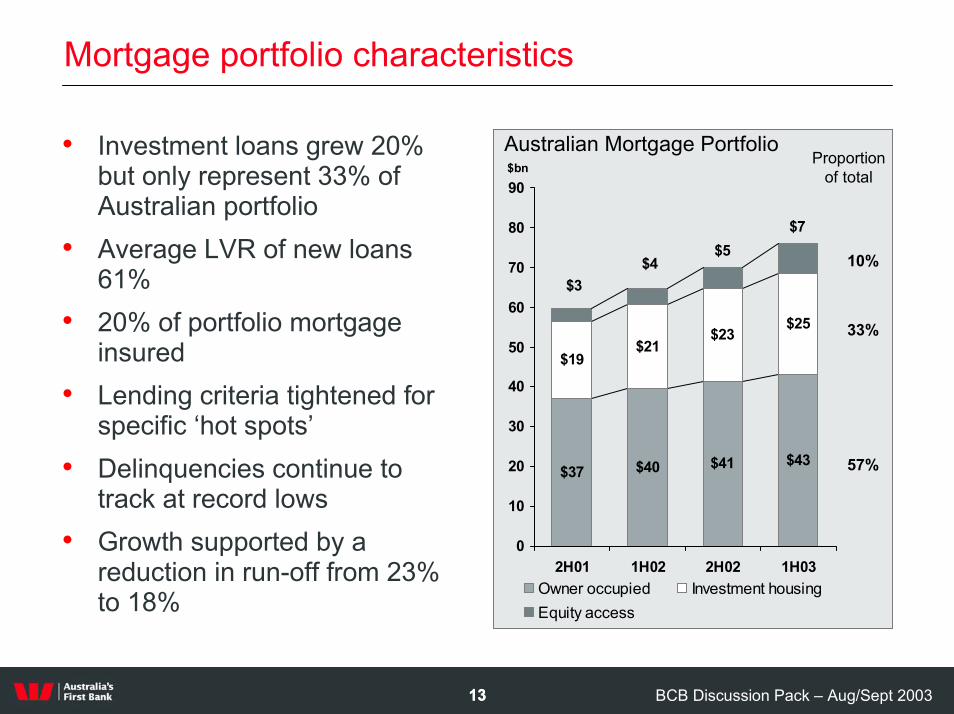
Mortgage portfolio characteristics
• Investment loans grew 20% but only represent 33% of Australian portfolio
• Average LVR of new loans 61%
• 20% of portfolio mortgage insured
• Lending criteria tightened for specific ‘hot spots’
• Delinquencies continue to track at record lows
• Growth supported by a reduction in run-off from 23% to 18%
$37 $40 $41 $43
$19$21
$23$25
$7$5
$4$3
0
10
20
30
40
50
60
70
80
90
2H01 1H02 2H02 1H03
$bn
Owner occupied Investment housingEquity access
Australian Mortgage Portfolio
10%
33%
57%
Proportion of total
BCB Discussion Pack – Aug/Sept 20031414
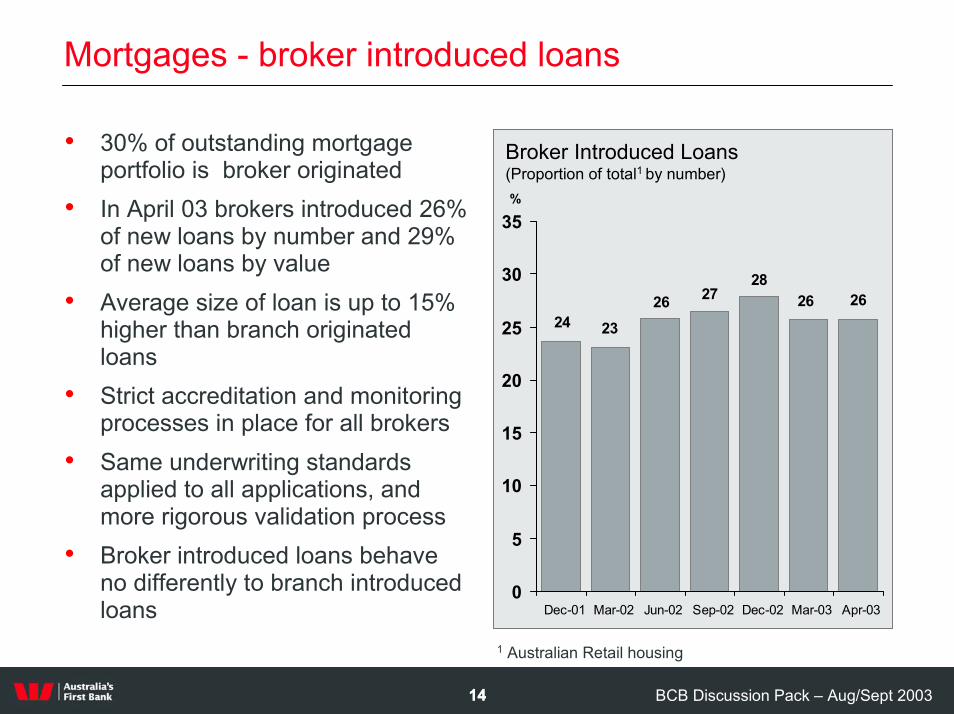
Mortgages - broker introduced loans
• 30% of outstanding mortgage portfolio is broker originated
• In April 03 brokers introduced 26% of new loans by number and 29% of new loans by value
• Average size of loan is up to 15% higher than branch originated loans
• Strict accreditation and monitoring processes in place for all brokers
• Same underwriting standards applied to all applications, and more rigorous validation process
• Broker introduced loans behave no differently to branch introduced loans
262628
27262324
0
5
10
15
20
25
30
35
Dec-01 Mar-02 Jun-02 Sep-02 Dec-02 Mar-03 Apr-03
%
Broker Introduced Loans(Proportion of total1 by number)
1 Australian Retail housing
BCB Discussion Pack – Aug/Sept 20031515
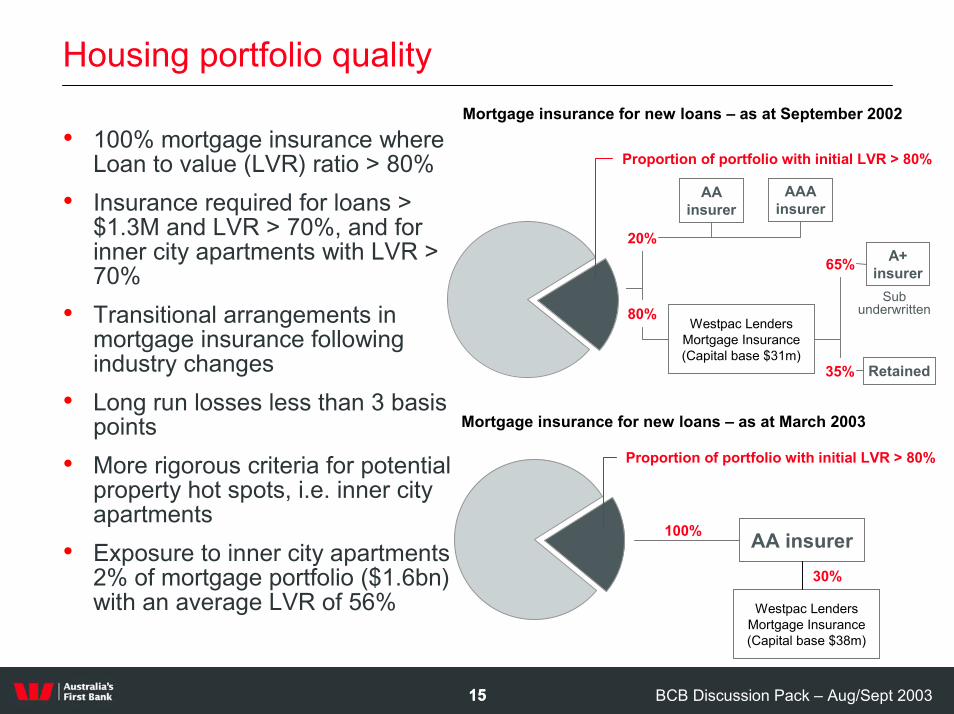
Housing portfolio quality
• 100% mortgage insurance where Loan to value (LVR) ratio > 80%
• Insurance required for loans > $1.3M and LVR > 70%, and for inner city apartments with LVR > 70%
• Transitional arrangements in mortgage insurance following industry changes
• Long run losses less than 3 basis points
• More rigorous criteria for potential property hot spots, i.e. inner city apartments
• Exposure to inner city apartments 2% of mortgage portfolio ($1.6bn) with an average LVR of 56%
20%
Mortgage insurance for new loans – as at September 2002
Proportion of portfolio with initial LVR > 80%
80%Westpac Lenders
Mortgage Insurance (Capital base $31m)
A+ insurer65%
Sub underwritten
20%
AA insurer
AAAinsurer
Retained35%
20%
Proportion of portfolio with initial LVR > 80%
AA insurer
Mortgage insurance for new loans – as at March 2003
100%
Westpac Lenders Mortgage Insurance (Capital base $38m)
30%
BCB Discussion Pack – Aug/Sept 20031616
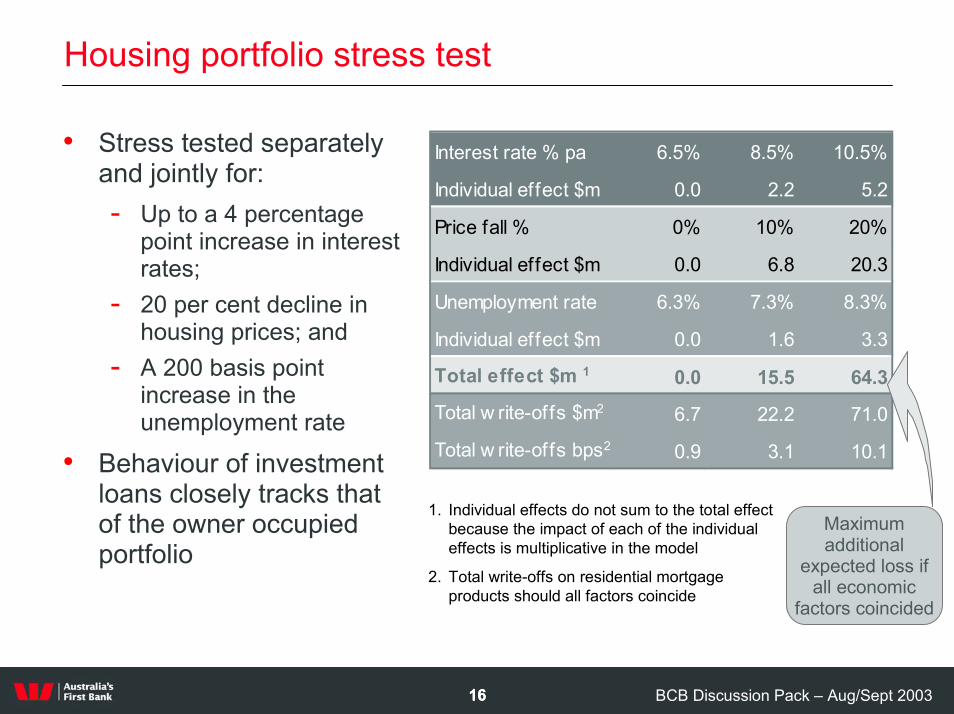
Housing portfolio stress test
Interest rate % pa 6.5% 8.5% 10.5%
Individual effect $m 0.0 2.2 5.2
Price fall % 0% 10% 20%
Individual effect $m 0.0 6.8 20.3
Unemployment rate 6.3% 7.3% 8.3%
Individual effect $m 0.0 1.6 3.3
Total effect $m 1 0.0 15.5 64.3
Total w rite-offs $m2 6.7 22.2 71.0
Total w rite-offs bps2 0.9 3.1 10.1
1. Individual effects do not sum to the total effect because the impact of each of the individual effects is multiplicative in the model
2. Total write-offs on residential mortgage products should all factors coincide
Maximum additional
expected loss if all economic
factors coincided
• Stress tested separately and jointly for:- Up to a 4 percentage
point increase in interest rates;
- 20 per cent decline in housing prices; and
- A 200 basis point increase in the unemployment rate
• Behaviour of investment loans closely tracks that of the owner occupied portfolio
BCB Discussion Pack – Aug/Sept 20031717
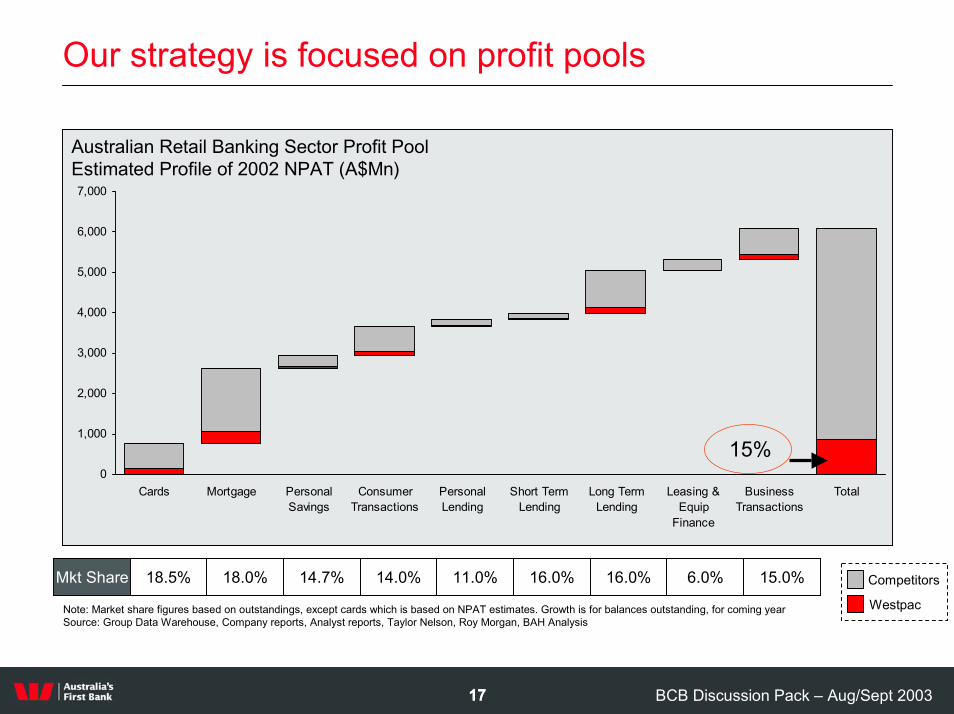
Our strategy is focused on profit pools
0
1,000
2,000
3,000
4,000
5,000
6,000
7,000
Cards Mortgage PersonalSavings
ConsumerTransactions
PersonalLending
Short TermLending
Long TermLending
Leasing &Equip
Finance
BusinessTransactions
Total
Australian Retail Banking Sector Profit Pool Estimated Profile of 2002 NPAT (A$Mn)
15%
Mkt Share Competitors
Westpac
18.5% 18.0% 14.7% 14.0% 11.0% 16.0% 16.0% 6.0% 15.0%
Note: Market share figures based on outstandings, except cards which is based on NPAT estimates. Growth is for balances outstanding, for coming yearSource: Group Data Warehouse, Company reports, Analyst reports, Taylor Nelson, Roy Morgan, BAH Analysis
BCB Discussion Pack – Aug/Sept 20031818
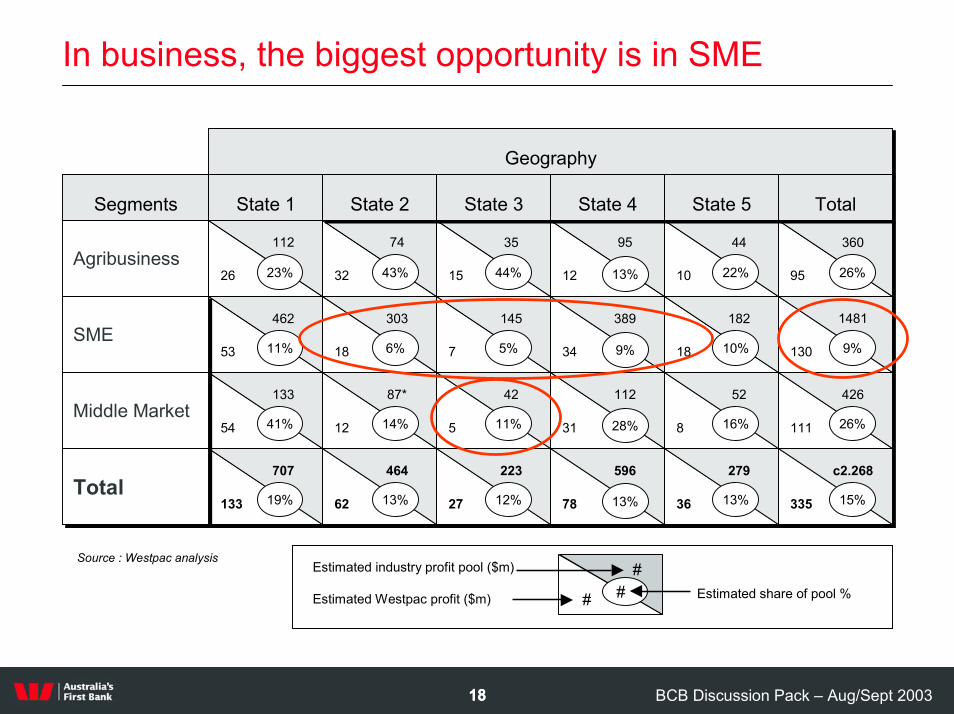
In business, the biggest opportunity is in SME
Geography
SegmentsSegments
Geography
State 1State 1
AgribusinessAgribusiness26
112
32
74
15
35
53
462
18
303
7
145
54
133
12
87*
5
42
12
95
10
44
34
389
18
182
31
112
8
52
95
360
130
1481
111
426
133
707
62
464
27
223
78
596
36
279
335
c2.268
23% 43% 44% 22% 26%
11% 6% 5% 10% 9%
41% 14% 11% 16% 26%
19% 13% 12% 13% 15%
13%
9%
28%
13%
State 2State 2 State 3State 3
SMESME
Middle MarketMiddle Market
State 4State 4 State 5State 5 TotalTotal
TotalTotal
Estimated industry profit pool ($m)
Estimated Westpac profit ($m) Estimated share of pool %##
#Source : Westpac analysis
BCB Discussion Pack – Aug/Sept 20031919
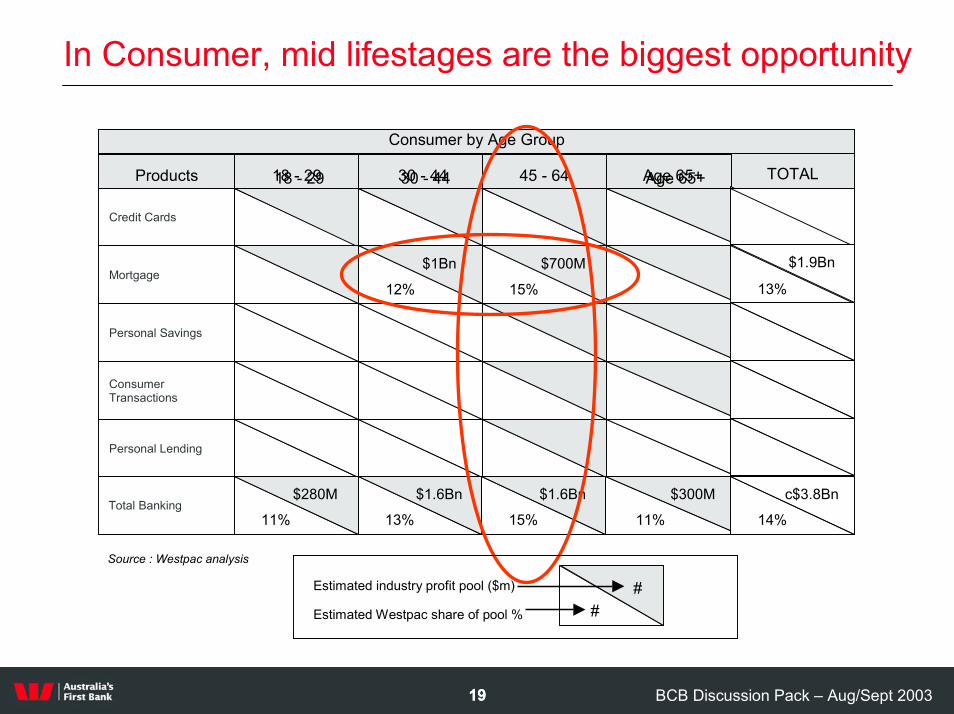
In Consumer, mid lifestages are the biggest opportunity
Products 45 - 64 45 - 64
12%
$1Bn
15%
$700M
13%
$1.6Bn
15%
$1.6Bn
Consumer by Age Group
Estimated industry profit pool ($m)
Estimated Westpac share of pool % ##
Source : Westpac analysis
TOTALProducts 18 - 29 18 - 29
Credit Cards
Mortgage
Personal Savings
Consumer Transactions
Personal Lending
30 - 44 30 - 44 Age 65+ Age 65+
$1.9Bn
13%
$280M $300M c$3.8BnTotal Banking
11% 11% 14%
BCB Discussion Pack – Aug/Sept 20032020
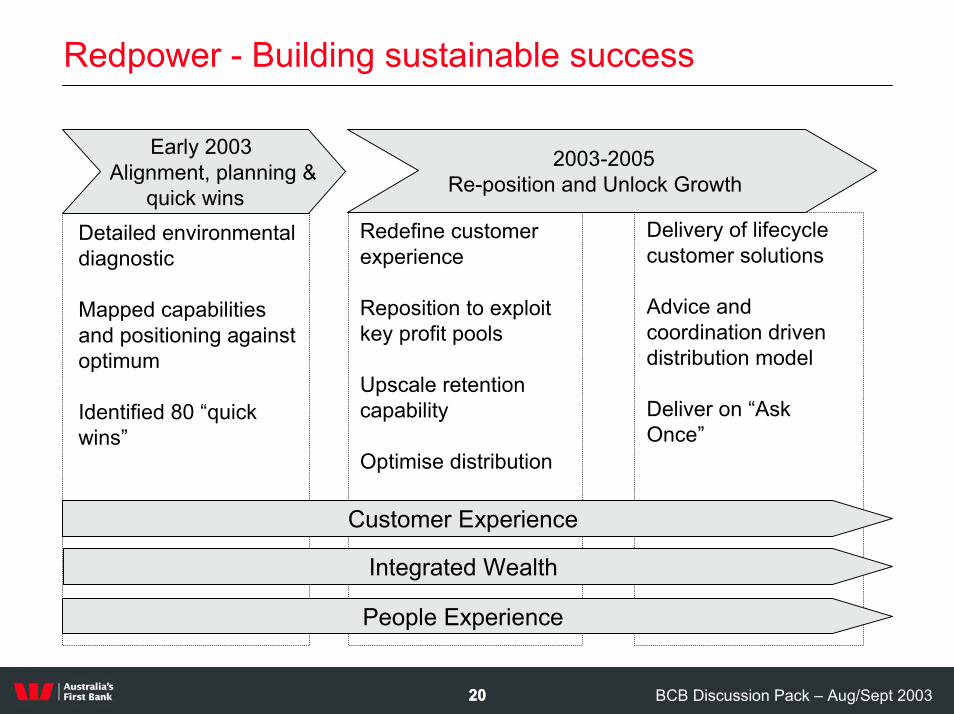
Redpower - Building sustainable success
Integrated Wealth
2003-2005Re-position and Unlock Growth
People Experience
Customer Experience
Detailed environmental diagnostic
Mapped capabilities and positioning against optimum
Identified 80 “quick wins”
Redefine customer experience
Reposition to exploit key profit pools
Upscale retention capability
Optimise distribution
Delivery of lifecycle customer solutions
Advice and coordination driven distribution model
Deliver on “Ask Once”
Early 2003Alignment, planning &
quick wins
BCB Discussion Pack – Aug/Sept 20032121
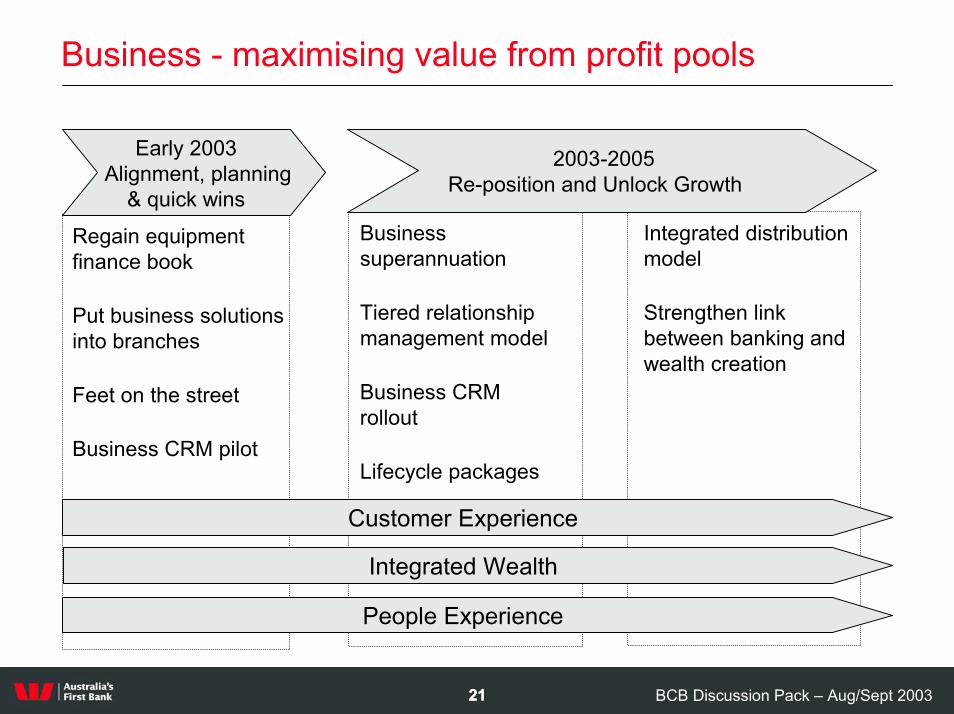
Business - maximising value from profit pools
Integrated Wealth
People Experience
Customer Experience
Regain equipment finance book
Put business solutions into branches
Feet on the street
Business CRM pilot
Business superannuation
Tiered relationship management model
Business CRM rollout
Lifecycle packages
Integrated distribution model
Strengthen link between banking and wealth creation
Early 2003Alignment, planning
& quick wins
2003-2005Re-position and Unlock Growth
BCB Discussion Pack – Aug/Sept 20032222
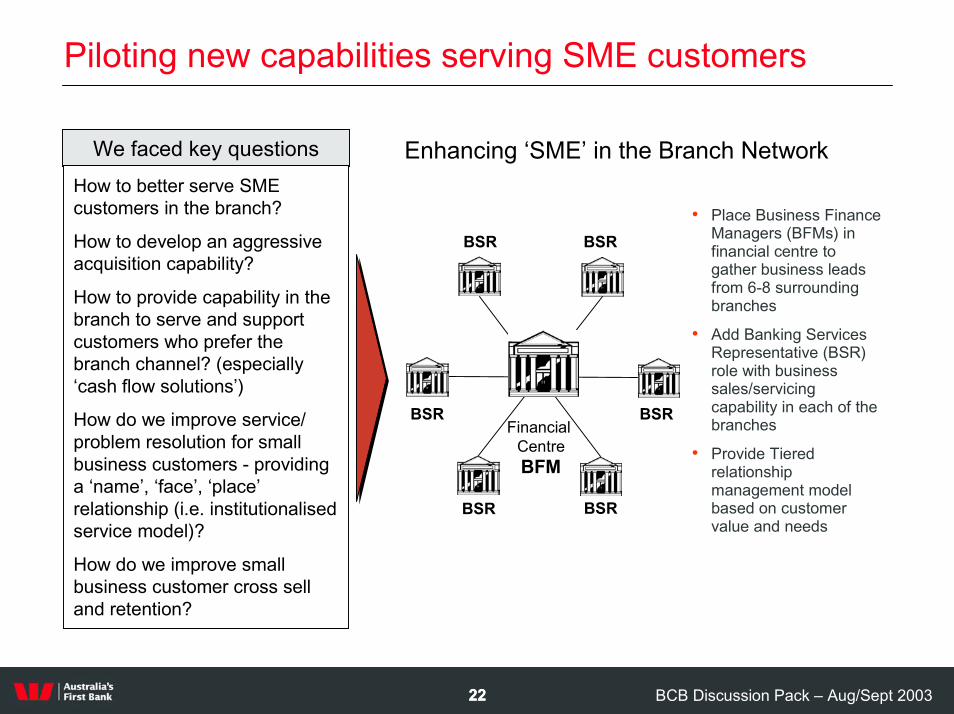
Piloting new capabilities serving SME customers
Enhancing ‘SME’ in the Branch NetworkWe faced key questionsHow to better serve SME customers in the branch?
How to develop an aggressive acquisition capability?
How to provide capability in the branch to serve and support customers who prefer the branch channel? (especially ‘cash flow solutions’)
How do we improve service/ problem resolution for small business customers - providing a ‘name’, ‘face’, ‘place’ relationship (i.e. institutionalised service model)?
How do we improve small business customer cross sell and retention?
• Place Business Finance Managers (BFMs) in financial centre to gather business leads from 6-8 surrounding branches
• Add Banking Services Representative (BSR) role with business sales/servicing capability in each of the branches
• Provide Tiered relationship management model based on customer value and needs
BSR
BSRBSR
Financial CentreBFM
BSR
BSRBSR
BCB Discussion Pack – Aug/Sept 20032323
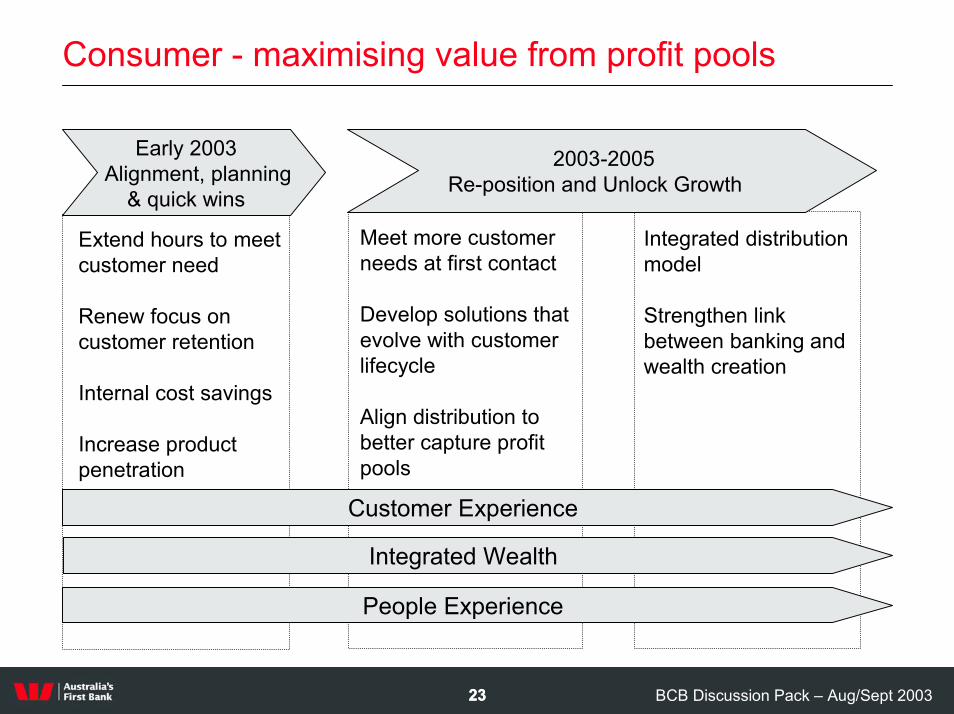
Consumer - maximising value from profit pools
Integrated Wealth
People Experience
Customer Experience
Extend hours to meet customer need
Renew focus on customer retention
Internal cost savings
Increase product penetration
Meet more customer needs at first contact
Develop solutions that evolve with customer lifecycle
Align distribution to better capture profit pools
Integrated distribution model
Strengthen link between banking and wealth creation
Early 2003Alignment, planning
& quick wins
2003-2005Re-position and Unlock Growth
BCB Discussion Pack – Aug/Sept 20032424
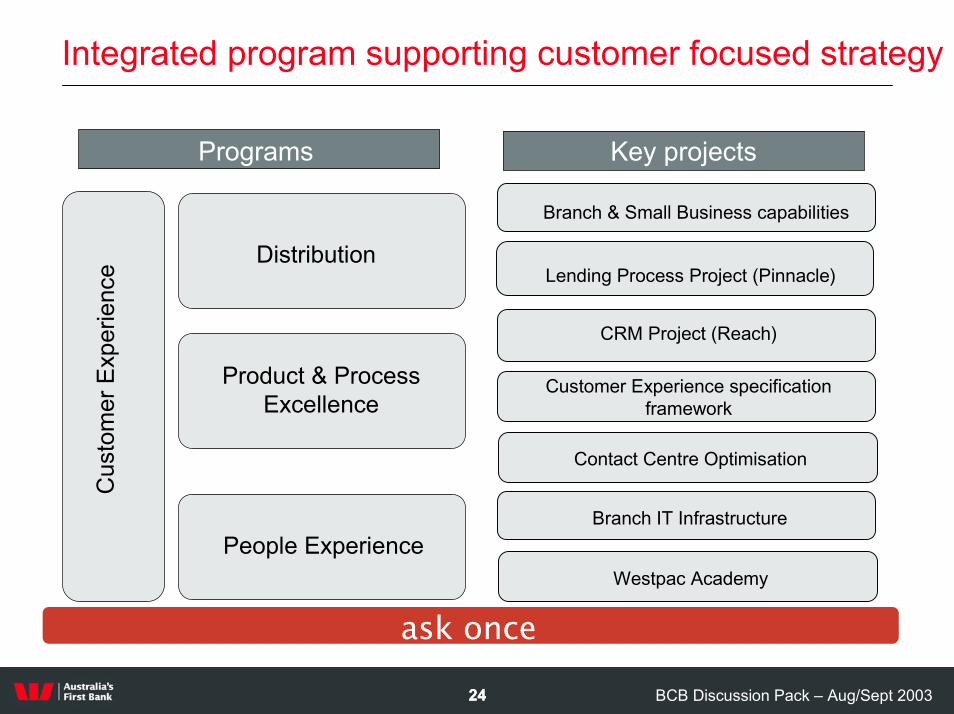
Integrated program supporting customer focused strategy
Programs Key projects
Branch & Small Business capabilities
Distribution
Product & Process Excellence
tom
er E
x pe
Lending Process Project (Pinnacle)
Cus
rienc
e
CRM Project (Reach)
Customer Experience specification framework
Contact Centre Optimisation
Branch IT InfrastructurePeople Experience
Westpac Academy
ask once
BCB Discussion Pack – Aug/Sept 20032525
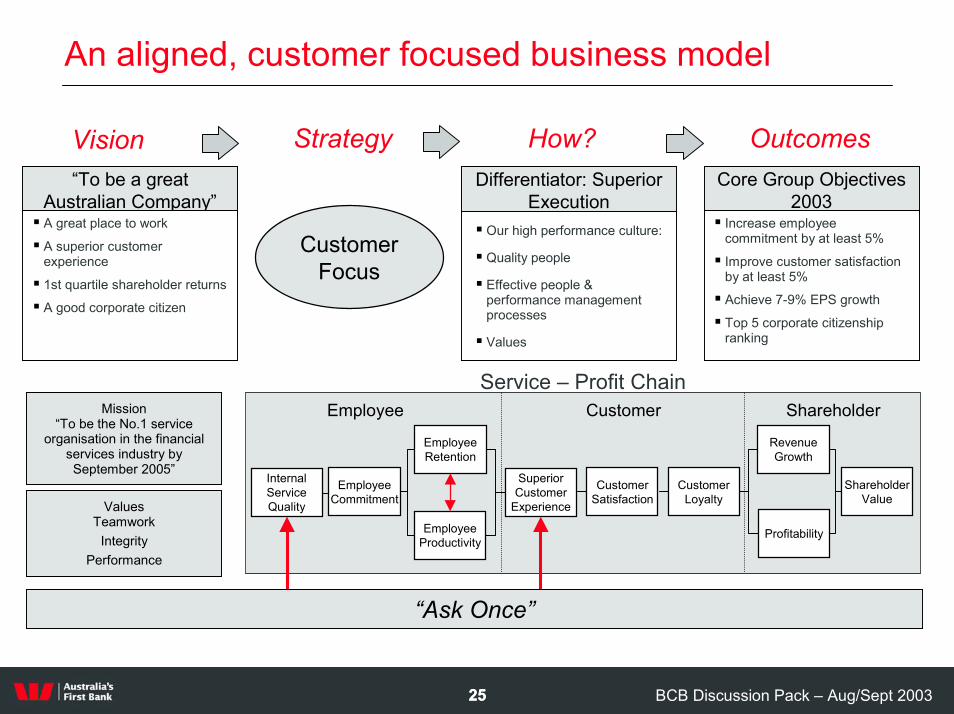
An aligned, customer focused business model
Strategy How? OutcomesVisionDifferentiator: Superior
Execution� Our high performance culture:
� Quality people
� Effective people & performance management processes
� Values
Core Group Objectives 2003
� Increase employee commitment by at least 5%
� Improve customer satisfaction by at least 5%
� Achieve 7-9% EPS growth
� Top 5 corporate citizenship ranking
“To be a great Australian Company”
� A great place to work
� A superior customer experience
� 1st quartile shareholder returns
� A good corporate citizen
Customer Focus
Service – Profit Chain
Internal Service Quality
Employee Commitment
Employee Retention
Employee Productivity
Superior Customer
Experience
Customer Satisfaction
Customer Loyalty
Revenue Growth
Profitability
Shareholder Value
Employee Customer ShareholderMission“To be the No.1 service
organisation in the financial services industry by September 2005”
ValuesTeamwork
IntegrityPerformance
“Ask Once”
BCB Discussion Pack – Aug/Sept 20032626
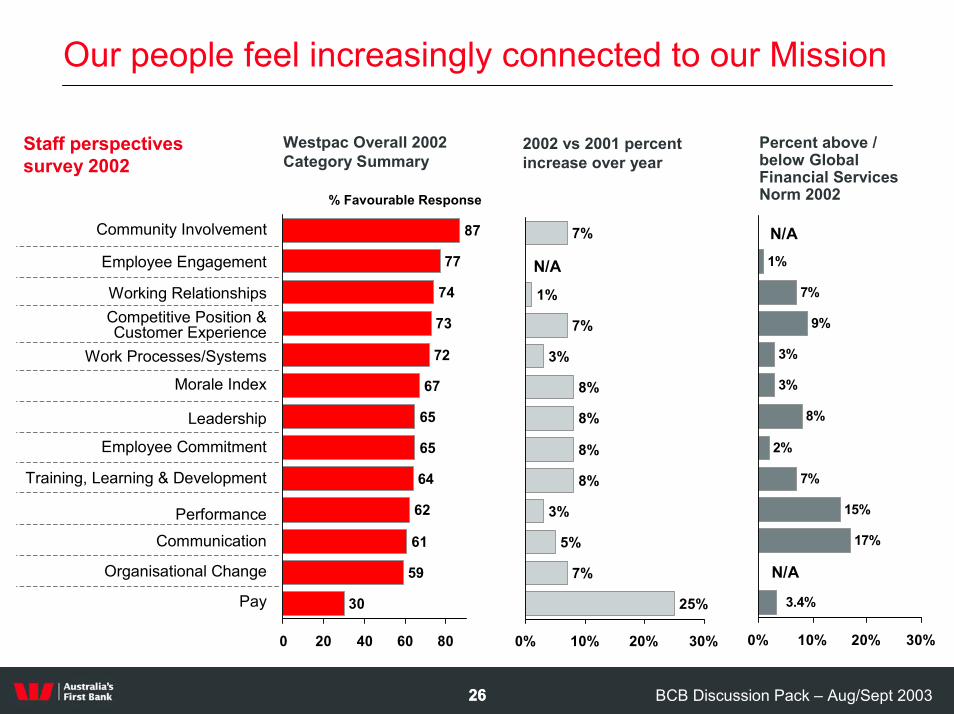
Our people feel increasingly connected to our Mission
Staff perspectives survey 2002
Westpac Overall 2002 Category Summary
2002 vs 2001 percent increase over year
Percent above / below Global Financial Services Norm 2002
1%
7%
9%
3%
3%
8%
2%
7%
15%
17%
3.4%
0% 10% 20% 30%
N/A
N/A
7%
1%
7%
3%
8%
8%
8%
8%
3%
5%
7%
25%
0% 10% 20% 30%
N/A
87
77
74
73
72
67
65
65
64
62
61
59
30
0 20 40 60 80
Employee Engagement
Working RelationshipsCompetitive Position & Customer Experience
Work Processes/Systems
Leadership
Employee Commitment
Training, Learning & Development
Communication
Organisational Change
Performance
Pay
Morale Index
Community Involvement
% Favourable Response
BCB Discussion Pack – Aug/Sept 20032727
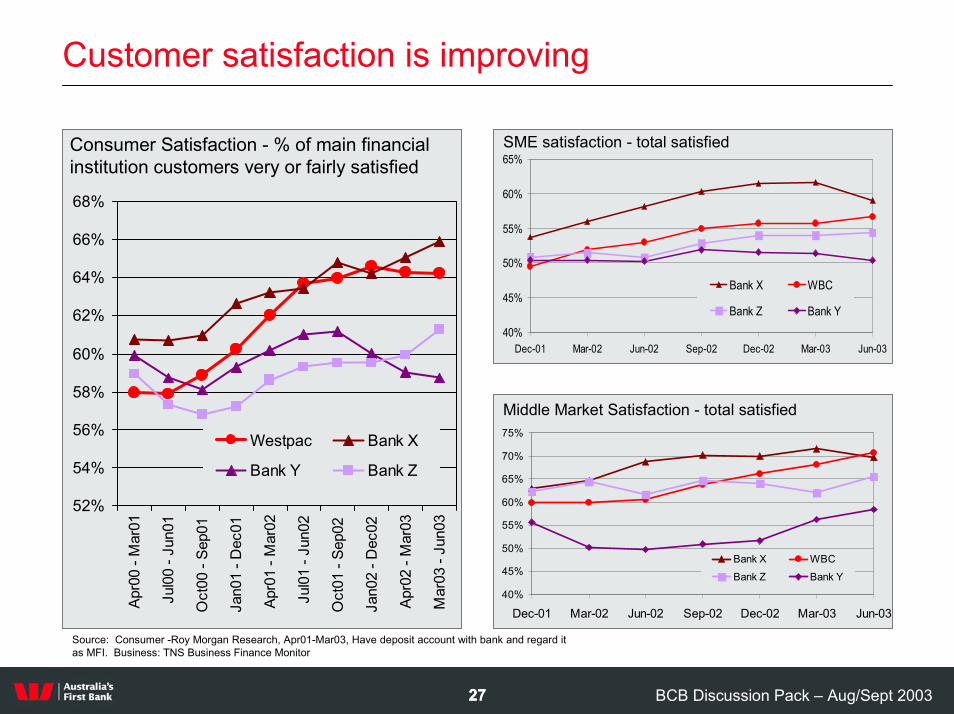
Customer satisfaction is improving
Consumer Satisfaction - % of main financial institution customers very or fairly satisfied
52%
54%
56%
58%
60%
62%
64%
66%
68%
Apr0
0 - M
ar01
Jul0
0 - J
un01
Oct
00 -
Sep0
1
Jan0
1 - D
ec01
Apr0
1 - M
ar02
Jul0
1 - J
un02
Oct
01 -
Sep0
2
Jan0
2 - D
ec02
Apr0
2 - M
ar03
Mar
03 -
Jun0
3Westpac Bank X
Bank Y Bank Z
SME satisfaction - total satisfied
40%
45%
50%
55%
60%
65%
Dec-01 Mar-02 Jun-02 Sep-02 Dec-02 Mar-03 Jun-03
Bank X WBC
Bank Z Bank Y
Middle Market Satisfaction - total satisfied
40%
45%
50%
55%
60%
65%
70%
75%
Dec-01 Mar-02 Jun-02 Sep-02 Dec-02 Mar-03 Jun-03
Bank X WBCBank Z Bank Y
Source: Consumer -Roy Morgan Research, Apr01-Mar03, Have deposit account with bank and regard it as MFI. Business: TNS Business Finance Monitor
BCB Discussion Pack – Aug/Sept 20032828
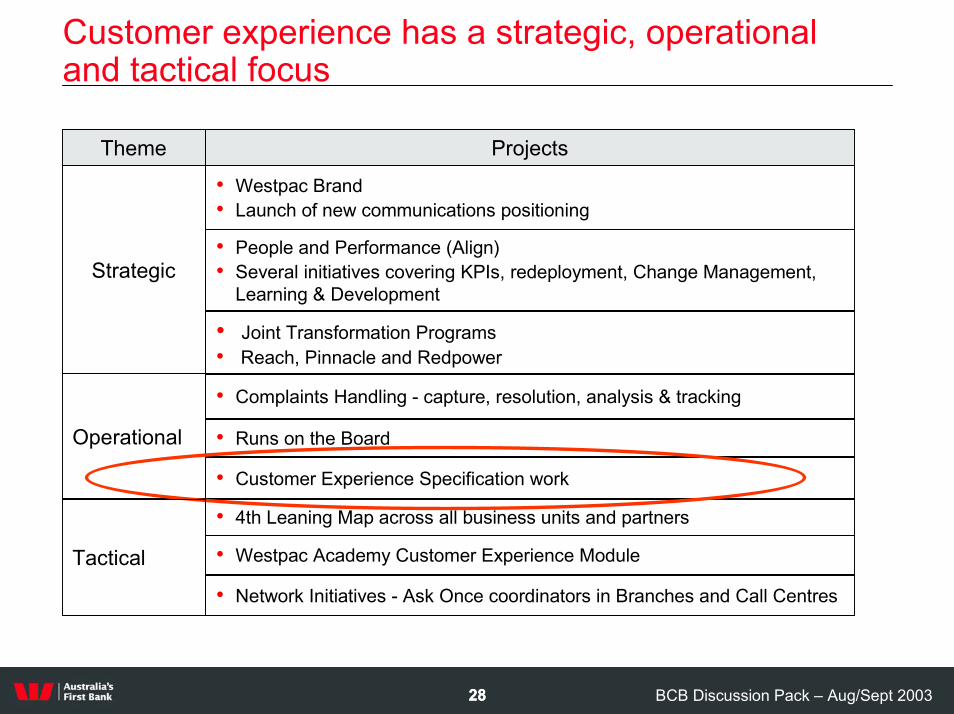
Customer experience has a strategic, operational and tactical focus
Strategic
• Westpac Brand• Launch of new communications positioning
• People and Performance (Align)• Several initiatives covering KPIs, redeployment, Change Management,
Learning & Development
• Joint Transformation Programs• Reach, Pinnacle and Redpower
• Complaints Handling - capture, resolution, analysis & tracking
• Runs on the Board
• Customer Experience Specification work
• 4th Leaning Map across all business units and partners
Theme Projects
Operational
• Westpac Academy Customer Experience Module Tactical
• Network Initiatives - Ask Once coordinators in Branches and Call Centres
BCB Discussion Pack – Aug/Sept 20032929
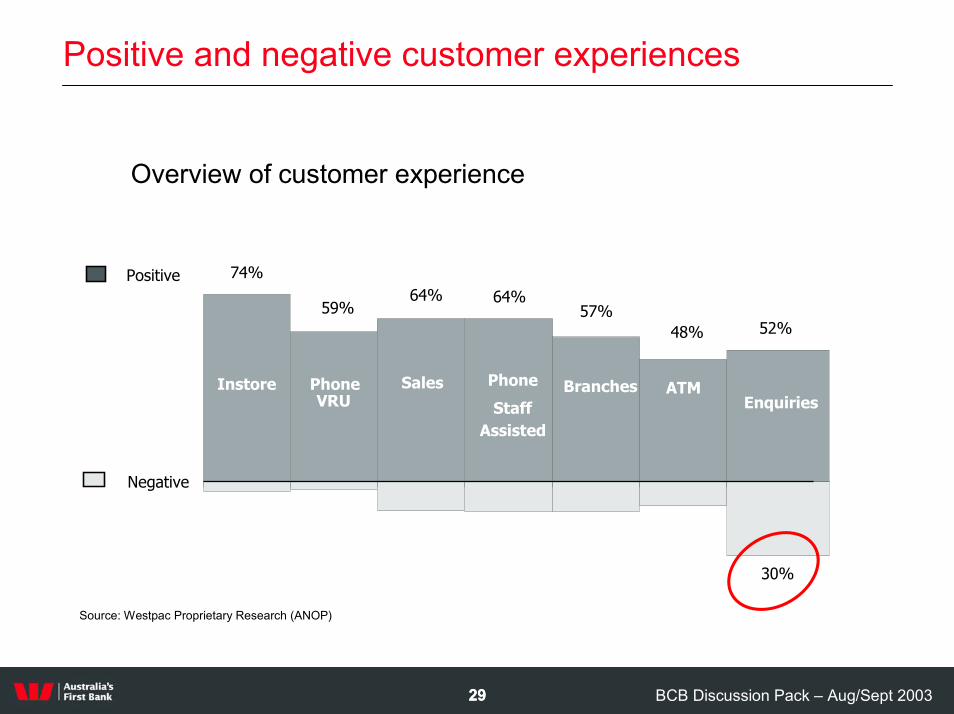
Positive and negative customer experiences
Overview of customer experience
30%
Instore PhoneVRU
Sales Phone
StaffAssisted
Branches ATMEnquiries
Positive 74%64% 64%
59% 57%52%48%
Negative
Source: Westpac Proprietary Research (ANOP)
BCB Discussion Pack – Aug/Sept 20033030
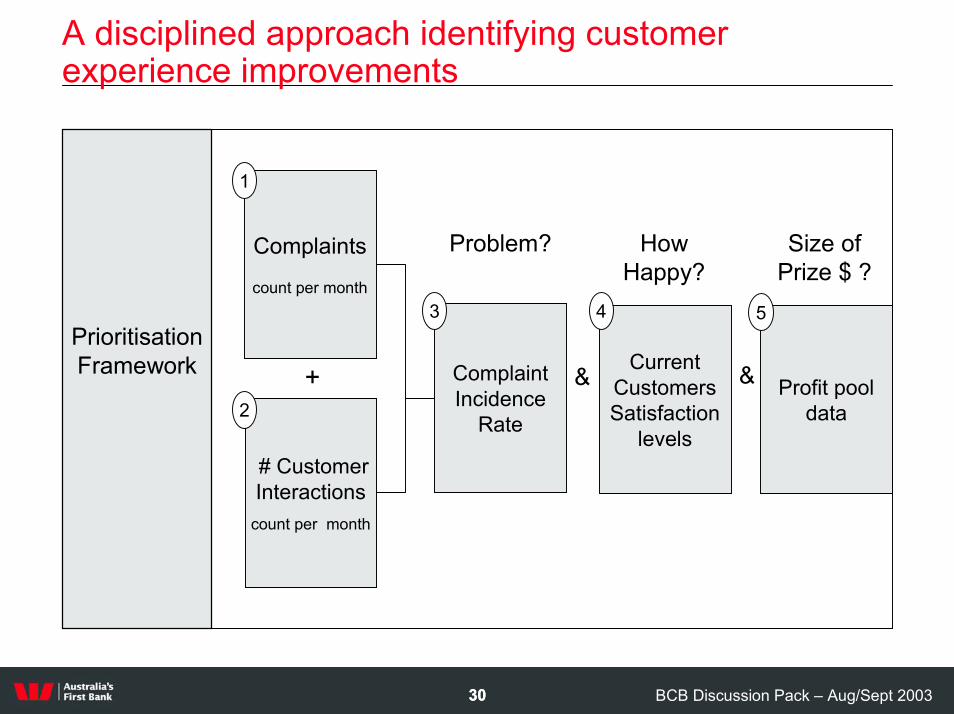
A disciplined approach identifying customer experience improvements
Complaints
count per month
1
2
3
Problem?
+
How Happy?
Size of Prize $ ?
Complaint Incidence
Rate
Current Customers Satisfaction
levels# Customer Interactions
count per month
4 5Prioritisation Framework && Profit pool
data
BCB Discussion Pack – Aug/Sept 20033131
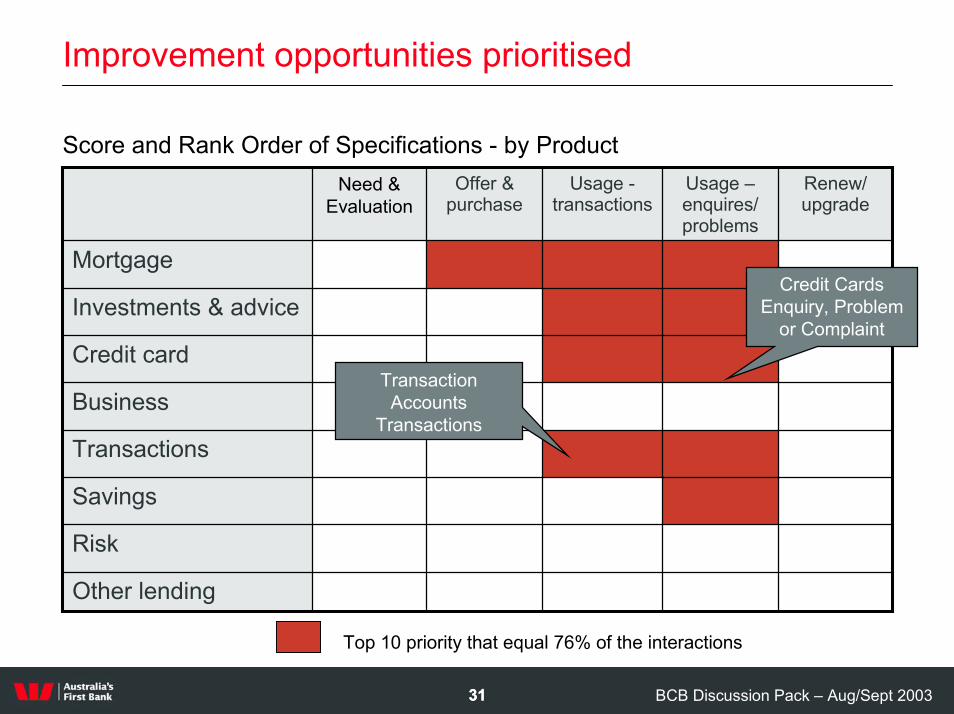
Improvement opportunities prioritised
Score and Rank Order of Specifications - by Product
Other lending
Risk
Savings
Transactions
Business
Credit card
Investments & advice
Mortgage
Renew/ upgrade
Usage –enquires/ problems
Usage -transactions
Offer & purchase
Need & Evaluation
Transaction Accounts
Transactions
Credit CardsEnquiry, Problem
or Complaint
Top 10 priority that equal 76% of the interactions
BCB Discussion Pack – Aug/Sept 20033232
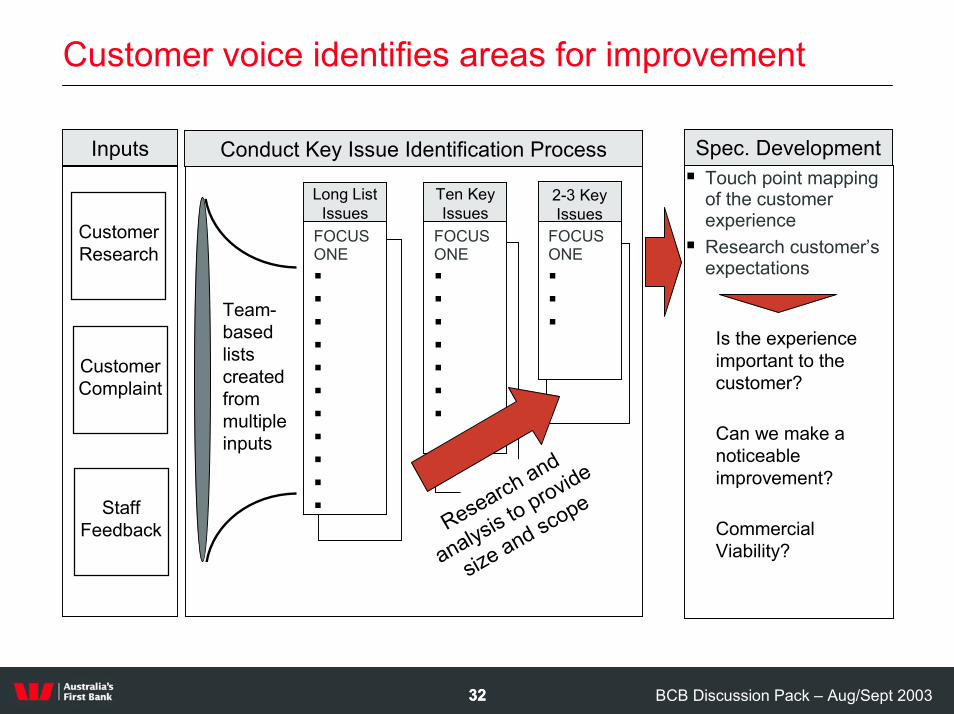
Customer voice identifies areas for improvement
Spec. DevelopmentInputs Conduct Key Issue Identification Process
Long List Issues
Team-based lists created from multiple inputs
••••••••••
Ten Key Issues
FOCUS ONE�
�
�
�
�
�
�
2-3 Key Issues
FOCUS ONE�
�
�
FOCUS ONE�
�
�
�
�
�
�
�
�
�
�
Research and
analysis to provide
size and scope
� Touch point mapping of the customer experience
� Research customer’s expectations
Can we make a noticeable improvement?
Is the experience important to the customer?
Commercial Viability?
Staff Feedback
Customer Complaint
Customer Research
BCB Discussion Pack – Aug/Sept 20033333
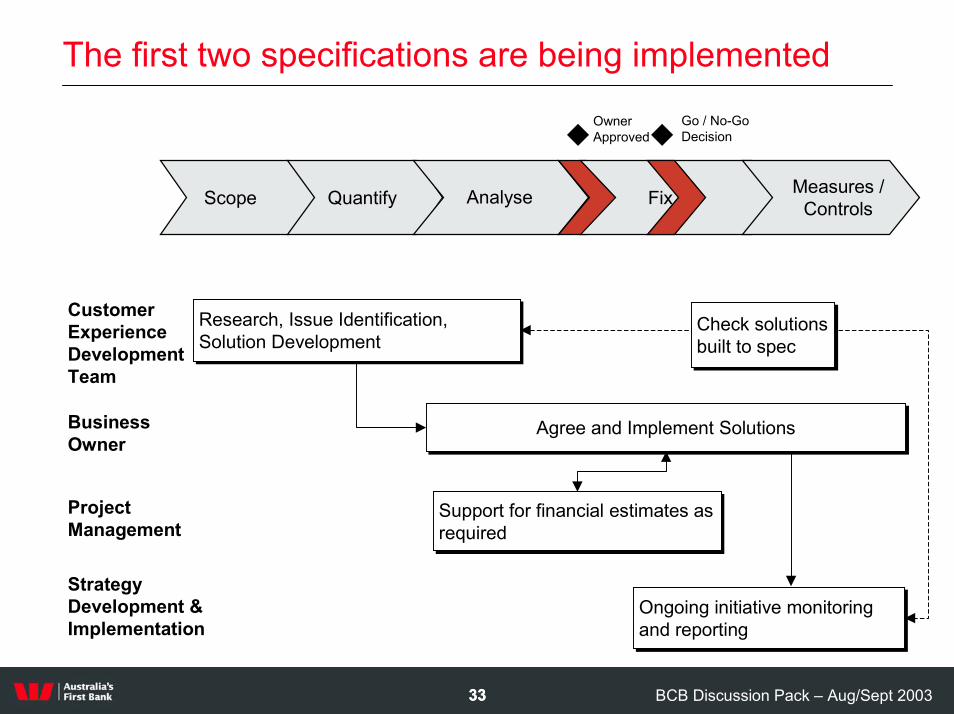
The first two specifications are being implemented
�Owner Approved
Go / No-Go Decision�
Scope Quantify Analyse Fix Measures / Controls
Customer Experience Development Team
Support for financial estimates as requiredSupport for financial estimates as required
Agree and Implement SolutionsAgree and Implement Solutions
Ongoing initiative monitoring and reporting Ongoing initiative monitoring and reporting
Check solutions built to specCheck solutions built to spec
Research, Issue Identification, Solution DevelopmentResearch, Issue Identification, Solution Development
Business Owner
Project Management
Strategy Development & Implementation
BCB Discussion Pack – Aug/Sept 20033434
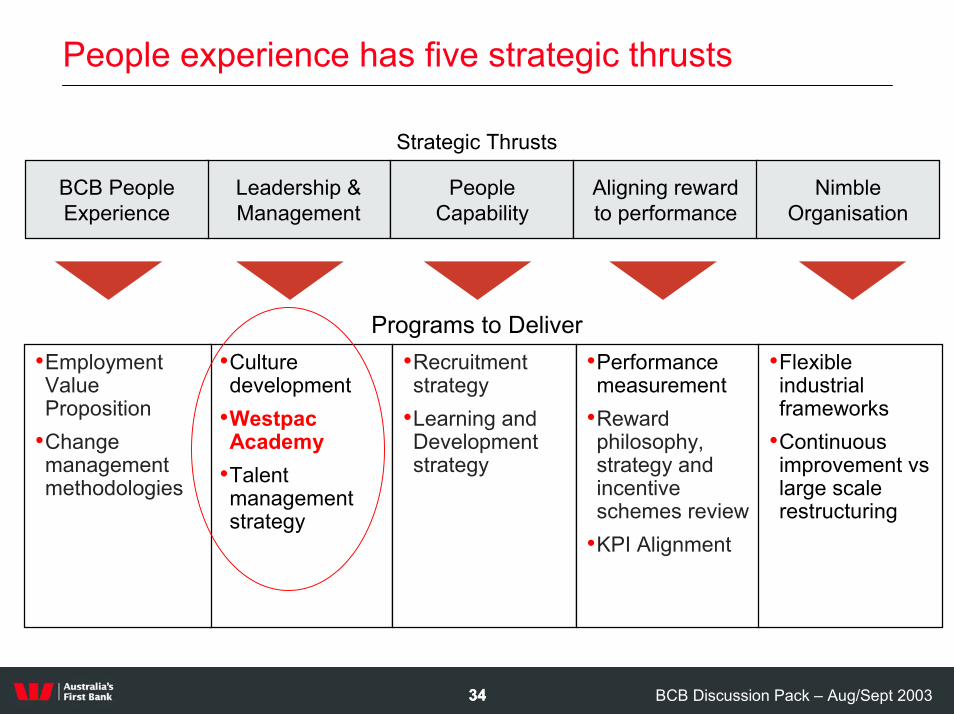
People experience has five strategic thrusts
Strategic Thrusts
BCB People Experience
Leadership & Management
People Capability
Aligning reward to performance
Nimble Organisation
•Culture development
•WestpacAcademy
•Talent management strategy
•Recruitment strategy
•Learning and Development strategy
•Performance measurement
•Reward philosophy, strategy and incentive schemes review
•KPI Alignment
•Employment Value Proposition
•Change management methodologies
•Flexible industrial frameworks
•Continuous improvement vslarge scale restructuring
Programs to Deliver
BCB Discussion Pack – Aug/Sept 20033535
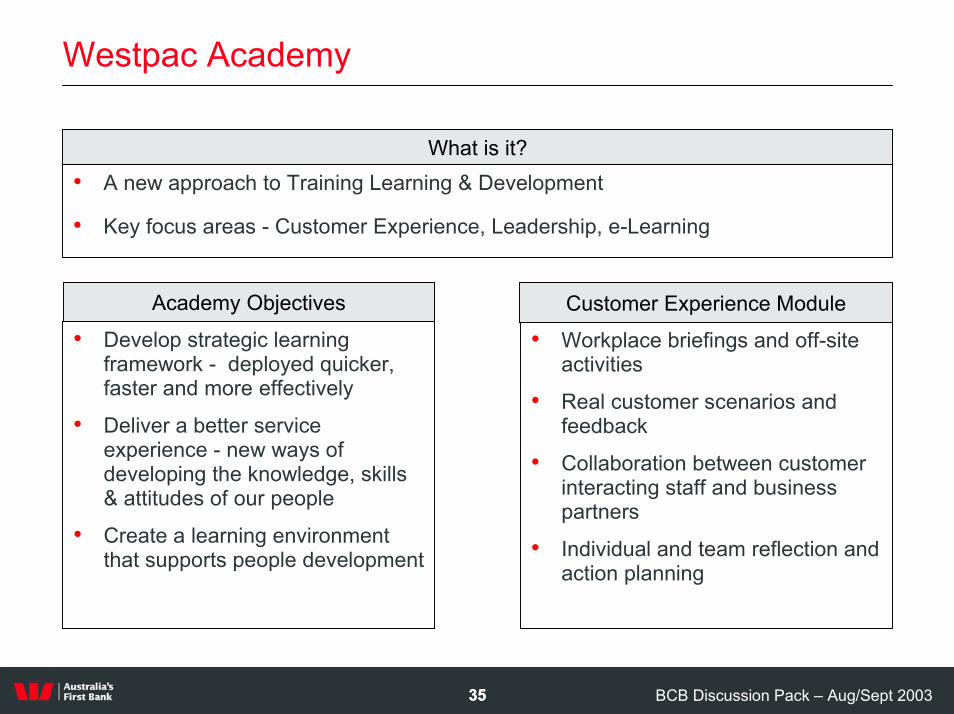
Westpac Academy
What is it?• A new approach to Training Learning & Development
• Key focus areas - Customer Experience, Leadership, e-Learning
Academy Objectives Customer Experience Module
• Develop strategic learning framework - deployed quicker, faster and more effectively
• Deliver a better service experience - new ways of developing the knowledge, skills & attitudes of our people
• Create a learning environment that supports people development
• Workplace briefings and off-site activities
• Real customer scenarios and feedback
• Collaboration between customer interacting staff and business partners
• Individual and team reflection and action planning
BCB Discussion Pack – Aug/Sept 20033636
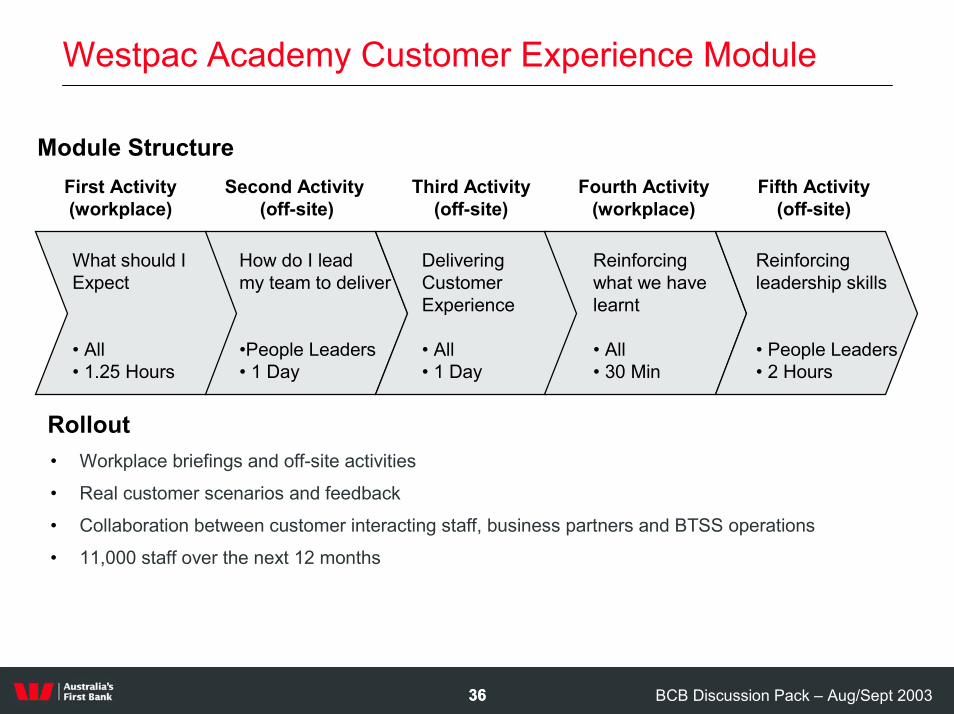
Westpac Academy Customer Experience Module
Module StructureSecond Activity
(off-site)Third Activity
(off-site)Fourth Activity
(workplace)Fifth Activity
(off-site)First Activity(workplace)
What should I Expect
• All• 1.25 Hours
How do I lead my team to deliver
•People Leaders• 1 Day
Delivering Customer Experience
• All• 1 Day
Reinforcing what we have learnt
• All• 30 Min
Reinforcing leadership skills
• People Leaders• 2 Hours
Rollout• Workplace briefings and off-site activities
• Real customer scenarios and feedback
• Collaboration between customer interacting staff, business partners and BTSS operations
• 11,000 staff over the next 12 months
BCB Discussion Pack – Aug/Sept 20033737
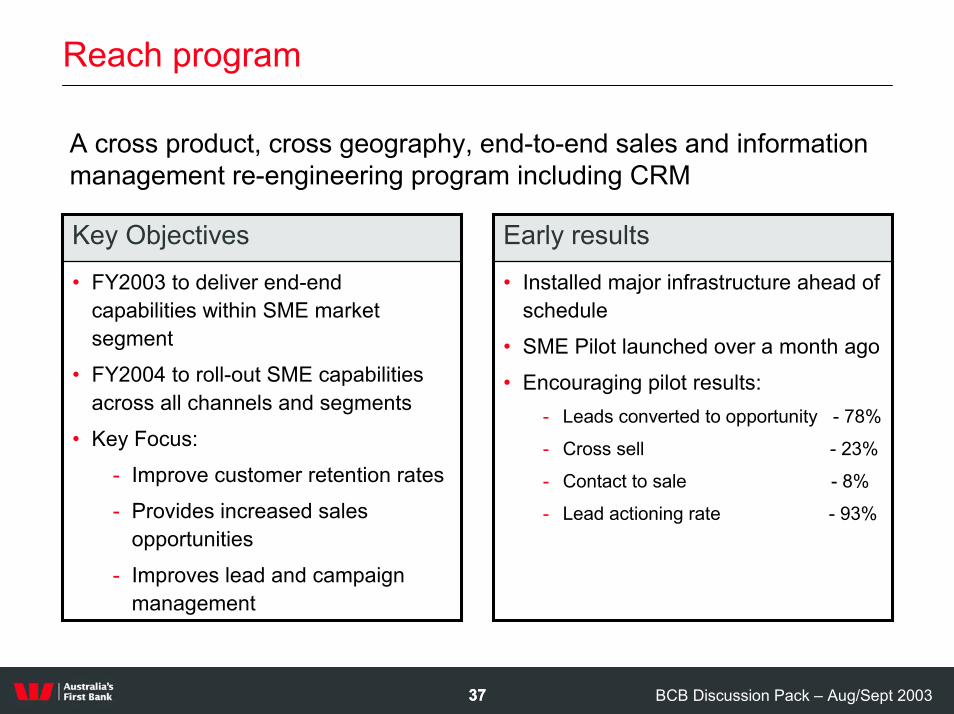
Reach program
A cross product, cross geography, end-to-end sales and information management re-engineering program including CRM
• Installed major infrastructure ahead of schedule
• SME Pilot launched over a month ago • Encouraging pilot results:
- Leads converted to opportunity - 78%
- Cross sell - 23%
- Contact to sale - 8%
- Lead actioning rate - 93%
• FY2003 to deliver end-end capabilities within SME market segment
• FY2004 to roll-out SME capabilities across all channels and segments
• Key Focus:- Improve customer retention rates- Provides increased sales
opportunities- Improves lead and campaign
management
Early resultsKey Objectives
BCB Discussion Pack – Aug/Sept 20033838
Virgin credit card partnership – early success
• Strong initial demand
• Approvals in line with normal customer experience
• Value of card to Westpac supported by:
- Customer skew complementary to Westpac customer base- Higher average balances - Higher revolver rate- No loyalty points cost
BCB Discussion Pack – Aug/Sept 20033939
Business & Consumer Banking – maintaining momentum
• Strong earnings growth
• Maintaining or growing market share in key segments
• Profit pool analysis highlighting significant untapped potential across the franchise
• Significant enhancements to core infrastructure beginning to deliver benefits
• Superior staff commitment delivering a leading customer experience and a sustainable competitive advantage