Embed Size (px)
Citation preview
WESTON HIGH SCHOOL
CLASS OF 2016
Principal – Lisa W. Deorio
Director of School Counseling – Meredith Starzyk
STATISTICAL REPORT
&
ANALYSIS OF COLLEGE APPLICATIONS
2
TABLE OF CONTENTS
Introduction………………………………………………………………………………………………………………….3
2016 Statistics and Testing Charts……………………………………………………...............................4
Summary of Weston High School Applications…………………………………………………………….10
Early Decision and Early Action Statistics……………………………………………………………………..12
“Competitive” Rated Colleges/Universities Results……………………………………………………..13
Appendix A: Class of 2016 College Matriculation List………………………………………………….16
Appendix B: Weston High School Counseling Highlights and Newsletter……………………18
3
INTRODUCTION Weston High School annually collects acceptance-related information from its graduating seniors and makes the information available to students, their parents, and to the public. The 2016 College Statistical Report, located in the College and Career Center, lists the colleges to which each student applied, and then indicates, along the same row, that particular student’s GPA, SAT/ACT scores, application type, and the result. This year, eight families of the 205 graduating seniors chose to be excluded from the data. This report is a compilation of data that is monitored through the “Naviance/Weston High School Data Center” that tracks college applications for each student in the class beginning their senior year. The program enables a comparison of students’ academic credentials against those of former students in examining notification patterns (e.g. admit, deny) specific to each college. Summaries of previous Weston High School graduating classes reveal the trends in our graduates’ post-secondary plans, SAT performance, Advanced Placement exams, and the processing and notification statistics.
Weston High School School Counseling Department
Meredith Starzyk, Director of School Counseling
Diane Schirizzo, Counselor Meg Sullivan, Counselor
Arielle Luksberg, Counselor Gary Meunier, Counselor
Meghan Skelton, Social Worker Angelo DiTocco, School Psychologist
Wheat Osinski, Registrar Nancy LaMarco, Data Technician
Maria Gregory, School Counseling Administrative Assistant Marilyn Moks, College and Career Center Administrative Assistant
4
2016 Standardized Testing Statistics
Acronyms PSAT Practice version of the SAT I – Administered in October each year at WHS to all
10th & 11th grade students SAT A standardized examination of a student's academic skills used for admission to
US colleges and the Connecticut state assessment for all 11th grade students SAT II One hour subject tests used in college admissions at highly selective institutions ACT “American College Testing” – college readiness assessment AP Advanced Placement Exam – Administered at the end of a course (college level)
in May Interesting Testing Trends & Statistics for the Class of 2016
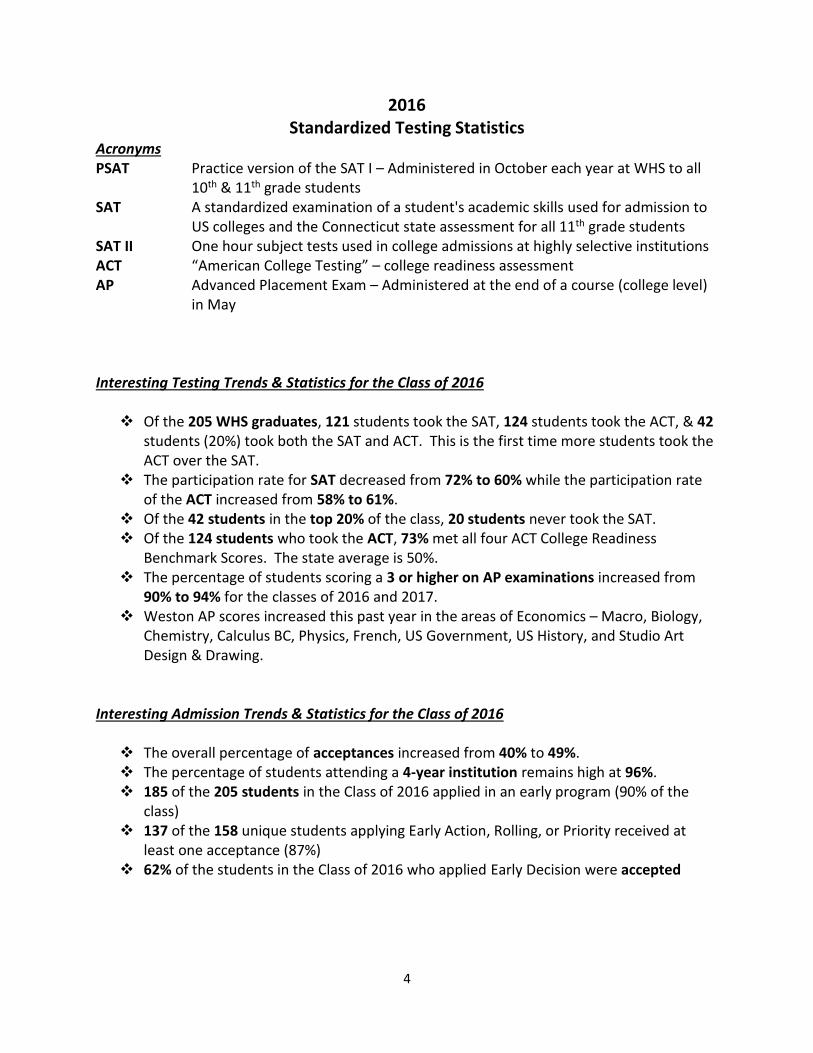
Of the 205 WHS graduates, 121 students took the SAT, 124 students took the ACT, & 42
students (20%) took both the SAT and ACT. This is the first time more students took the ACT over the SAT.
The participation rate for SAT decreased from 72% to 60% while the participation rate of the ACT increased from 58% to 61%.
Of the 42 students in the top 20% of the class, 20 students never took the SAT. Of the 124 students who took the ACT, 73% met all four ACT College Readiness
Benchmark Scores. The state average is 50%. The percentage of students scoring a 3 or higher on AP examinations increased from
90% to 94% for the classes of 2016 and 2017. Weston AP scores increased this past year in the areas of Economics – Macro, Biology,
Chemistry, Calculus BC, Physics, French, US Government, US History, and Studio Art Design & Drawing.
Interesting Admission Trends & Statistics for the Class of 2016
The overall percentage of acceptances increased from 40% to 49%. The percentage of students attending a 4-year institution remains high at 96%. 185 of the 205 students in the Class of 2016 applied in an early program (90% of the
class) 137 of the 158 unique students applying Early Action, Rolling, or Priority received at
least one acceptance (87%) 62% of the students in the Class of 2016 who applied Early Decision were accepted
5
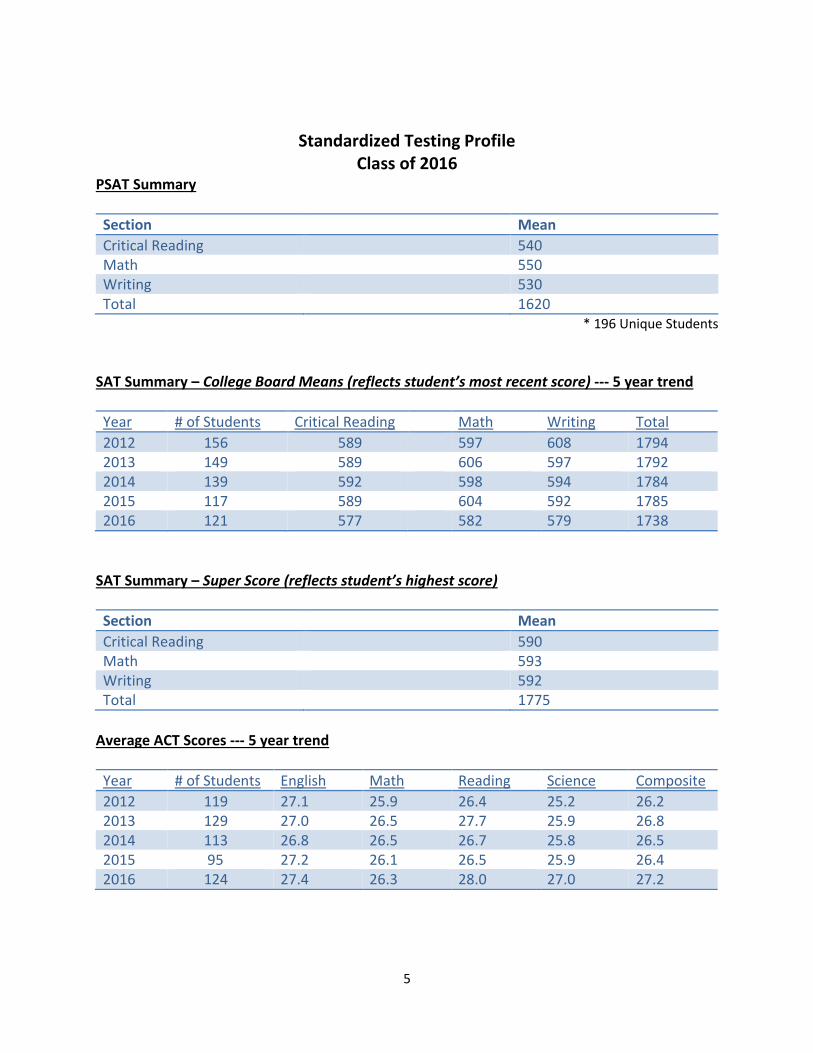
Standardized Testing Profile Class of 2016
PSAT Summary
Section Mean
Critical Reading 540 Math 550 Writing 530 Total 1620
* 196 Unique Students
SAT Summary – College Board Means (reflects student’s most recent score) --- 5 year trend
Year # of Students Critical Reading Math Writing Total
2012 156 589 597 608 1794 2013 149 589 606 597 1792 2014 139 592 598 594 1784 2015 117 589 604 592 1785 2016 121 577 582 579 1738
SAT Summary – Super Score (reflects student’s highest score)
Section Mean
Critical Reading 590 Math 593 Writing 592 Total 1775
Average ACT Scores --- 5 year trend
Year # of Students English Math Reading Science Composite
2012 119 27.1 25.9 26.4 25.2 26.2 2013 129 27.0 26.5 27.7 25.9 26.8 2014 113 26.8 26.5 26.7 25.8 26.5 2015 95 27.2 26.1 26.5 25.9 26.4 2016 124 27.4 26.3 28.0 27.0 27.2
6
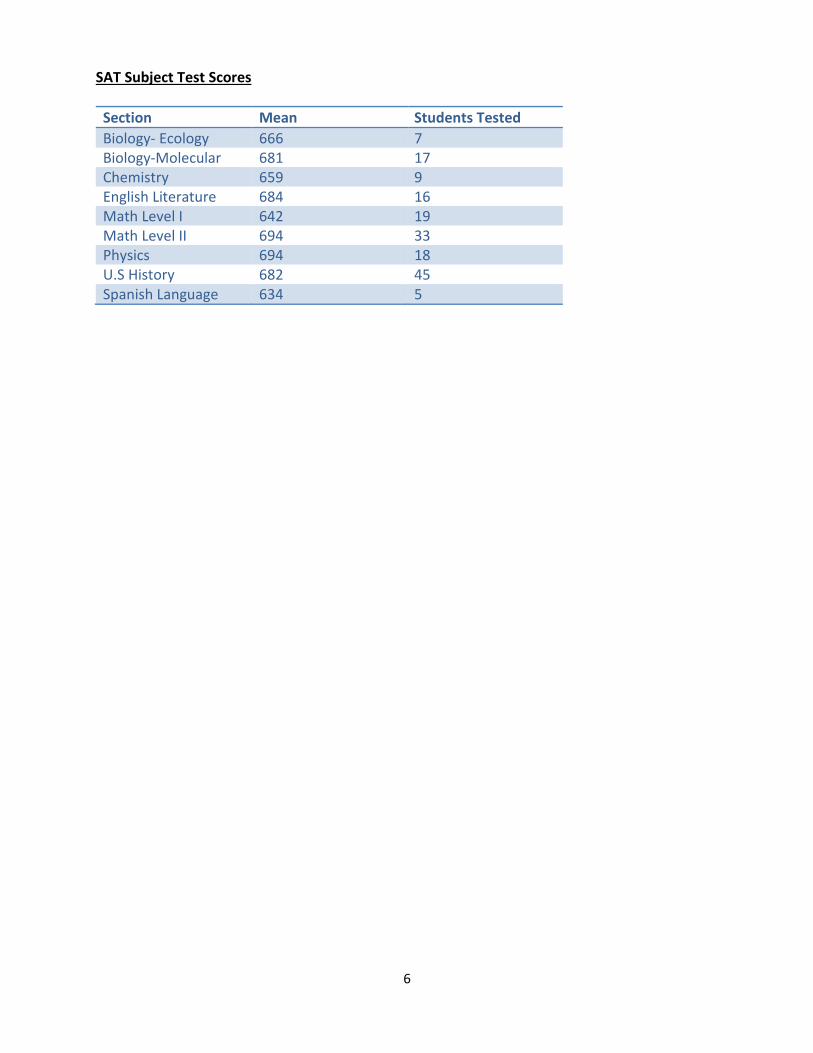
SAT Subject Test Scores
Section Mean Students Tested
Biology- Ecology 666 7 Biology-Molecular 681 17 Chemistry 659 9 English Literature 684 16 Math Level I 642 19 Math Level II 694 33 Physics 694 18 U.S History 682 45 Spanish Language 634 5
7
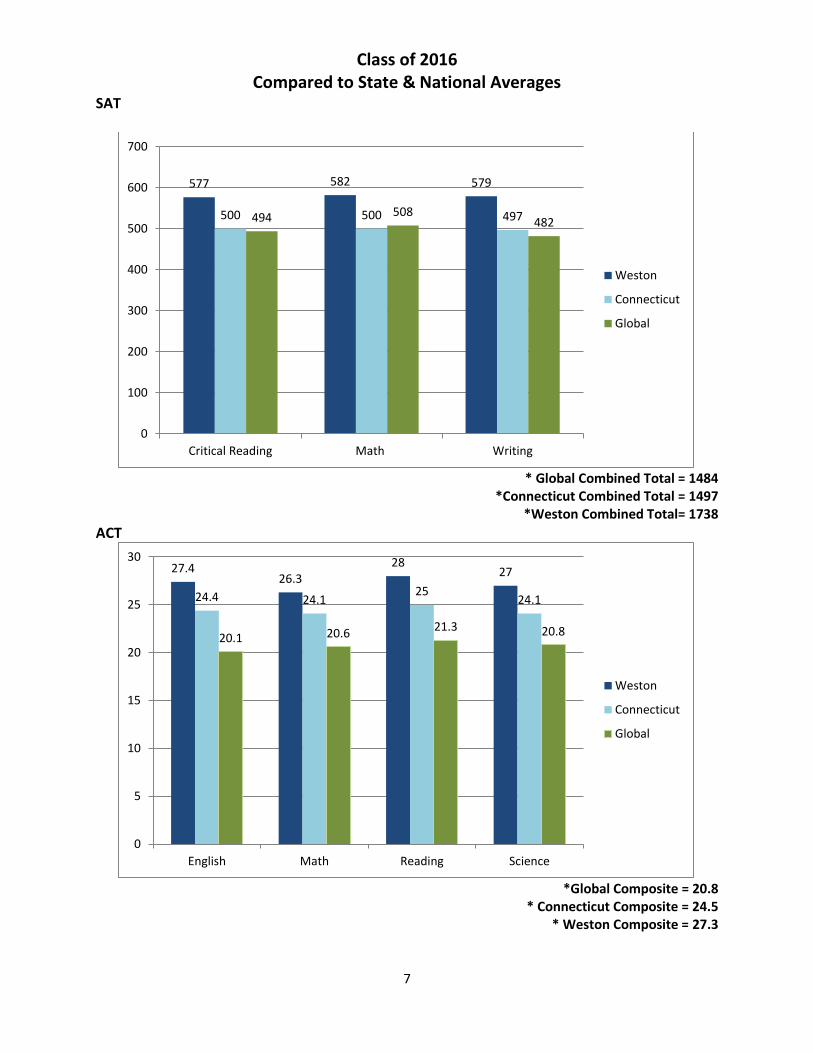
Class of 2016 Compared to State & National Averages
SAT
* Global Combined Total = 1484
*Connecticut Combined Total = 1497 *Weston Combined Total= 1738
ACT
*Global Composite = 20.8
* Connecticut Composite = 24.5 * Weston Composite = 27.3
577 582 579
500 500 497494 508482
0
100
200
300
400
500
600
700
Critical Reading Math Writing
Weston
Connecticut
Global
27.426.3
2827
24.4 24.125
24.1
20.1 20.621.3 20.8
0
5
10
15
20
25
30
English Math Reading Science
Weston
Connecticut
Global
8
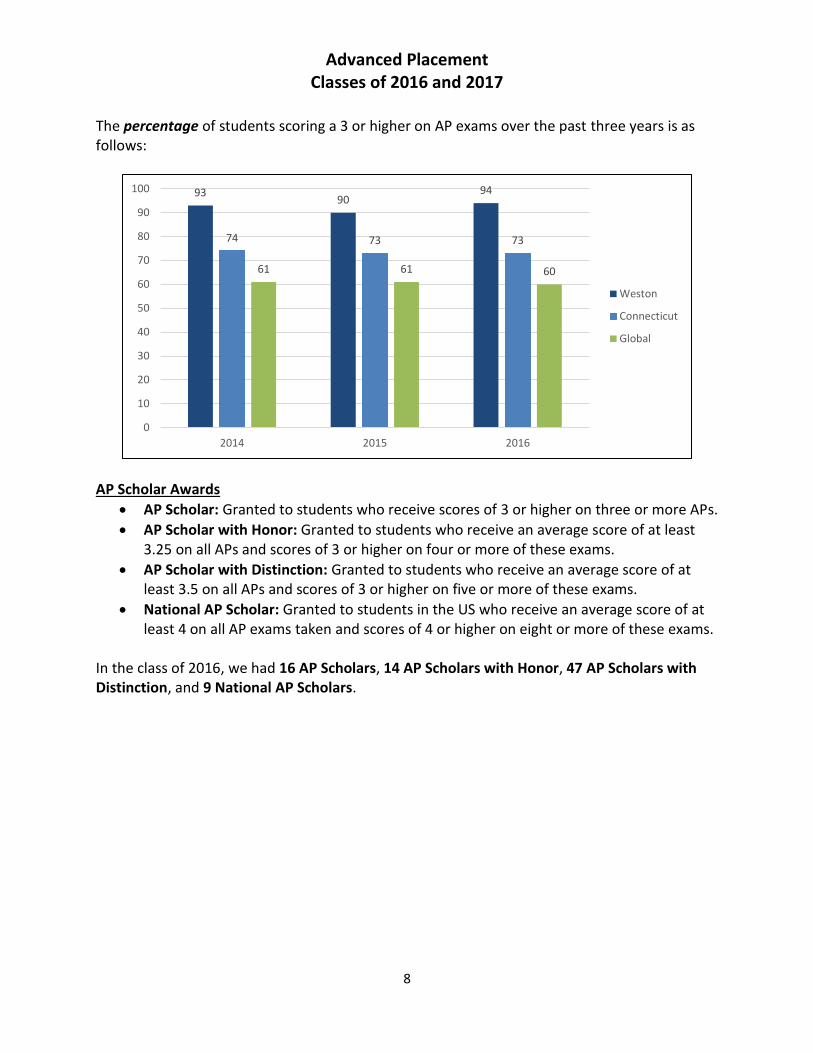
Advanced Placement Classes of 2016 and 2017
The percentage of students scoring a 3 or higher on AP exams over the past three years is as follows:
AP Scholar Awards
AP Scholar: Granted to students who receive scores of 3 or higher on three or more APs.
AP Scholar with Honor: Granted to students who receive an average score of at least 3.25 on all APs and scores of 3 or higher on four or more of these exams.
AP Scholar with Distinction: Granted to students who receive an average score of at least 3.5 on all APs and scores of 3 or higher on five or more of these exams.
National AP Scholar: Granted to students in the US who receive an average score of at least 4 on all AP exams taken and scores of 4 or higher on eight or more of these exams.
In the class of 2016, we had 16 AP Scholars, 14 AP Scholars with Honor, 47 AP Scholars with Distinction, and 9 National AP Scholars.
9390
94
74 73 73
61 61 60
0
10
20
30
40
50
60
70
80
90
100
2014 2015 2016
Weston
Connecticut
Global
9
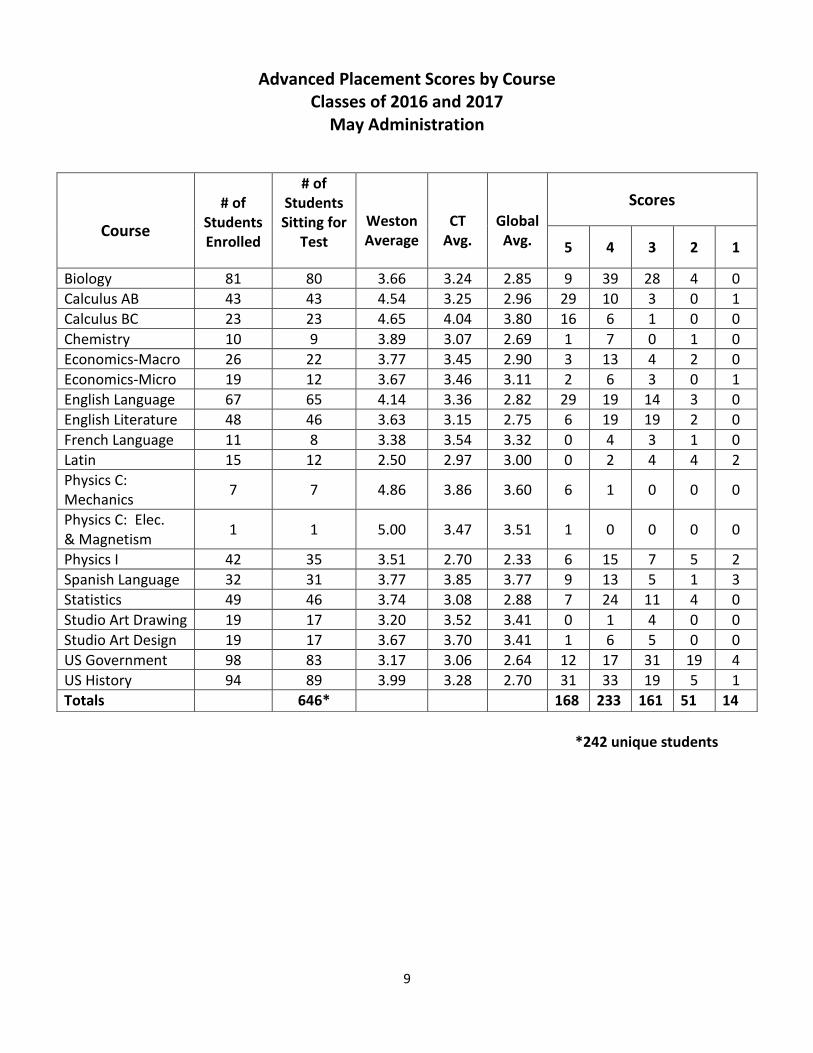
Advanced Placement Scores by Course Classes of 2016 and 2017
May Administration
*242 unique students
Course
# of
Students Enrolled
# of Students Sitting for
Test
Weston Average
CT
Avg.
Global Avg.
Scores
5 4 3 2 1
Biology 81 80 3.66 3.24 2.85 9 39 28 4 0
Calculus AB 43 43 4.54 3.25 2.96 29 10 3 0 1
Calculus BC 23 23 4.65 4.04 3.80 16 6 1 0 0
Chemistry 10 9 3.89 3.07 2.69 1 7 0 1 0
Economics-Macro 26 22 3.77 3.45 2.90 3 13 4 2 0
Economics-Micro 19 12 3.67 3.46 3.11 2 6 3 0 1
English Language 67 65 4.14 3.36 2.82 29 19 14 3 0
English Literature 48 46 3.63 3.15 2.75 6 19 19 2 0
French Language 11 8 3.38 3.54 3.32 0 4 3 1 0
Latin 15 12 2.50 2.97 3.00 0 2 4 4 2
Physics C: Mechanics
7 7 4.86 3.86 3.60 6 1 0 0 0
Physics C: Elec. & Magnetism
1 1 5.00 3.47 3.51 1 0 0 0 0
Physics I 42 35 3.51 2.70 2.33 6 15 7 5 2
Spanish Language 32 31 3.77 3.85 3.77 9 13 5 1 3
Statistics 49 46 3.74 3.08 2.88 7 24 11 4 0
Studio Art Drawing 19 17 3.20 3.52 3.41 0 1 4 0 0
Studio Art Design 19 17 3.67 3.70 3.41 1 6 5 0 0
US Government 98 83 3.17 3.06 2.64 12 17 31 19 4
US History 94 89 3.99 3.28 2.70 31 33 19 5 1
Totals 646* 168 233 161 51 14
10
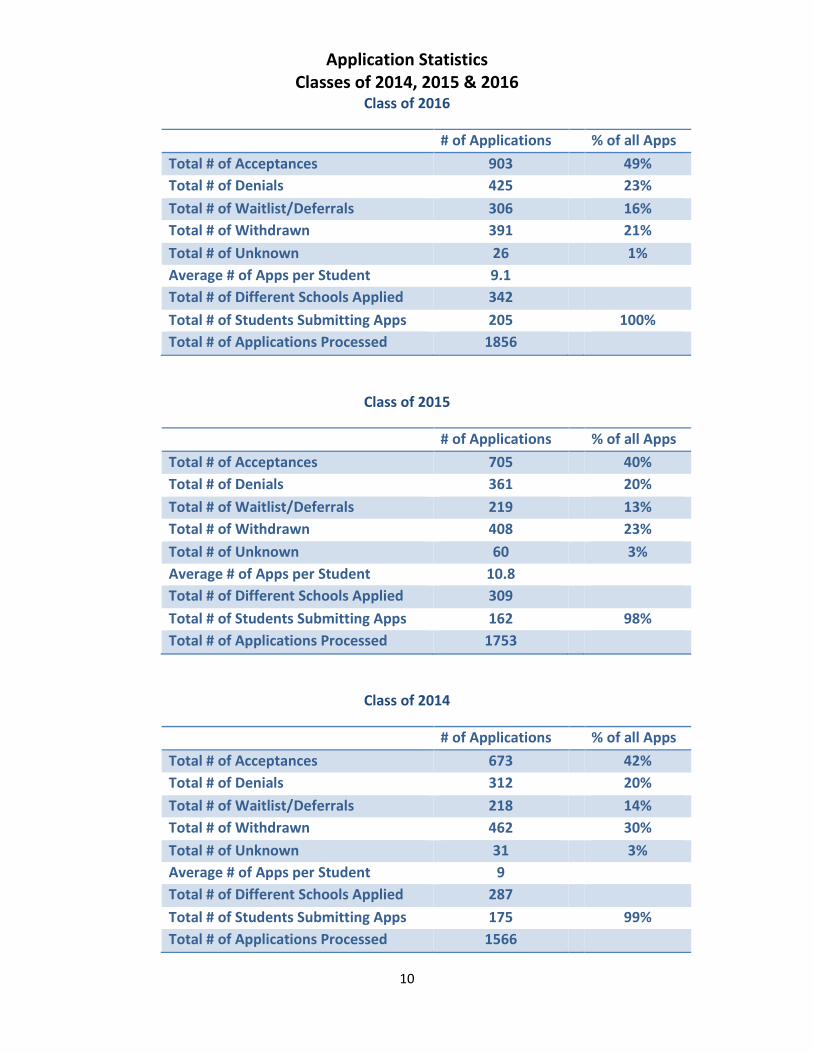
Application Statistics Classes of 2014, 2015 & 2016
Class of 2016
# of Applications % of all Apps
Total # of Acceptances 903 49%
Total # of Denials 425 23%
Total # of Waitlist/Deferrals 306 16%
Total # of Withdrawn 391 21%
Total # of Unknown 26 1%
Average # of Apps per Student 9.1
Total # of Different Schools Applied 342
Total # of Students Submitting Apps 205 100%
Total # of Applications Processed 1856
Class of 2015
# of Applications % of all Apps
Total # of Acceptances 705 40%
Total # of Denials 361 20%
Total # of Waitlist/Deferrals 219 13%
Total # of Withdrawn 408 23%
Total # of Unknown 60 3%
Average # of Apps per Student 10.8
Total # of Different Schools Applied 309
Total # of Students Submitting Apps 162 98%
Total # of Applications Processed 1753
Class of 2014
# of Applications % of all Apps
Total # of Acceptances 673 42%
Total # of Denials 312 20%
Total # of Waitlist/Deferrals 218 14%
Total # of Withdrawn 462 30%
Total # of Unknown 31 3%
Average # of Apps per Student 9
Total # of Different Schools Applied 287
Total # of Students Submitting Apps 175 99%
Total # of Applications Processed 1566
11
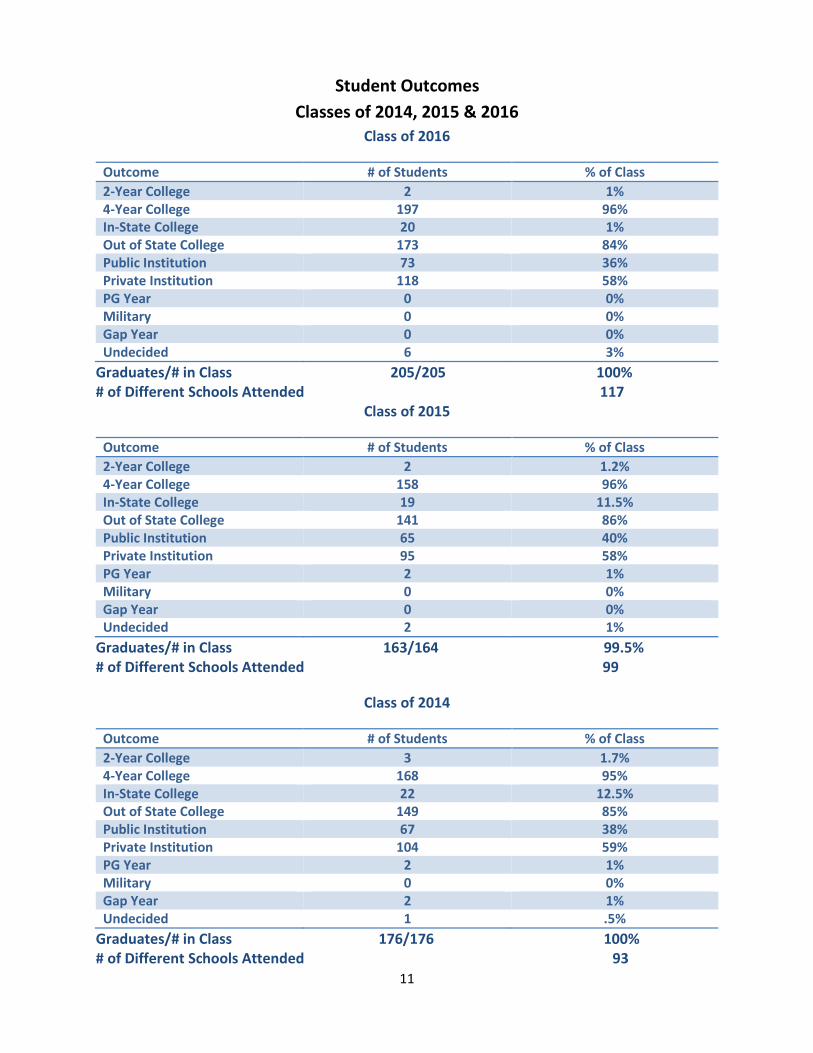
Student Outcomes
Classes of 2014, 2015 & 2016
Class of 2016
Outcome # of Students % of Class
2-Year College 2 1% 4-Year College 197 96% In-State College 20 1% Out of State College 173 84% Public Institution 73 36% Private Institution 118 58% PG Year 0 0% Military 0 0% Gap Year 0 0% Undecided 6 3%
Graduates/# in Class 205/205 100% # of Different Schools Attended 117
Class of 2015
Outcome # of Students % of Class
2-Year College 2 1.2% 4-Year College 158 96% In-State College 19 11.5% Out of State College 141 86% Public Institution 65 40% Private Institution 95 58% PG Year 2 1% Military 0 0% Gap Year 0 0% Undecided 2 1%
Graduates/# in Class 163/164 99.5% # of Different Schools Attended 99
Class of 2014
Outcome # of Students % of Class
2-Year College 3 1.7% 4-Year College 168 95% In-State College 22 12.5% Out of State College 149 85% Public Institution 67 38% Private Institution 104 59% PG Year 2 1% Military 0 0% Gap Year 2 1% Undecided 1 .5%
Graduates/# in Class 176/176 100% # of Different Schools Attended 93
12
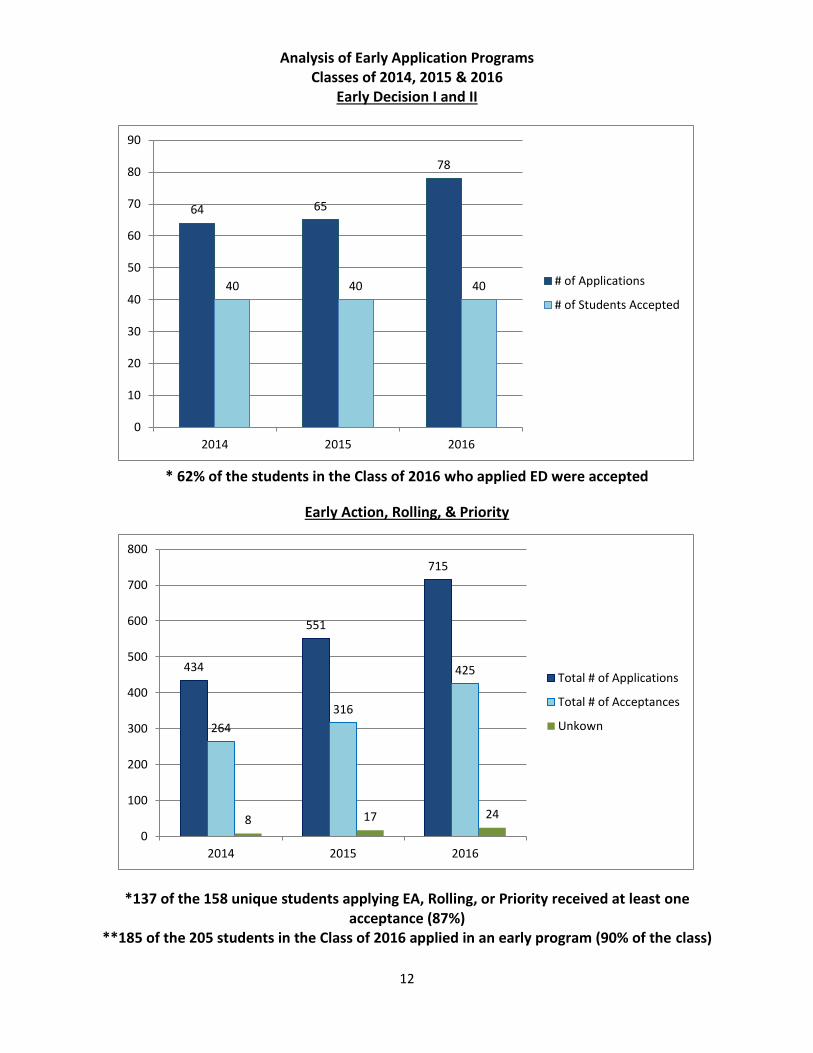
Analysis of Early Application Programs Classes of 2014, 2015 & 2016
Early Decision I and II
* 62% of the students in the Class of 2016 who applied ED were accepted
Early Action, Rolling, & Priority
*137 of the 158 unique students applying EA, Rolling, or Priority received at least one acceptance (87%)
**185 of the 205 students in the Class of 2016 applied in an early program (90% of the class)
64 65
78
40 40 40
0
10
20
30
40
50
60
70
80
90
2014 2015 2016
# of Applications
# of Students Accepted
434
551
715
264
316
425
8 17 24
0
100
200
300
400
500
600
700
800
2014 2015 2016
Total # of Applications
Total # of Acceptances
Unkown
13
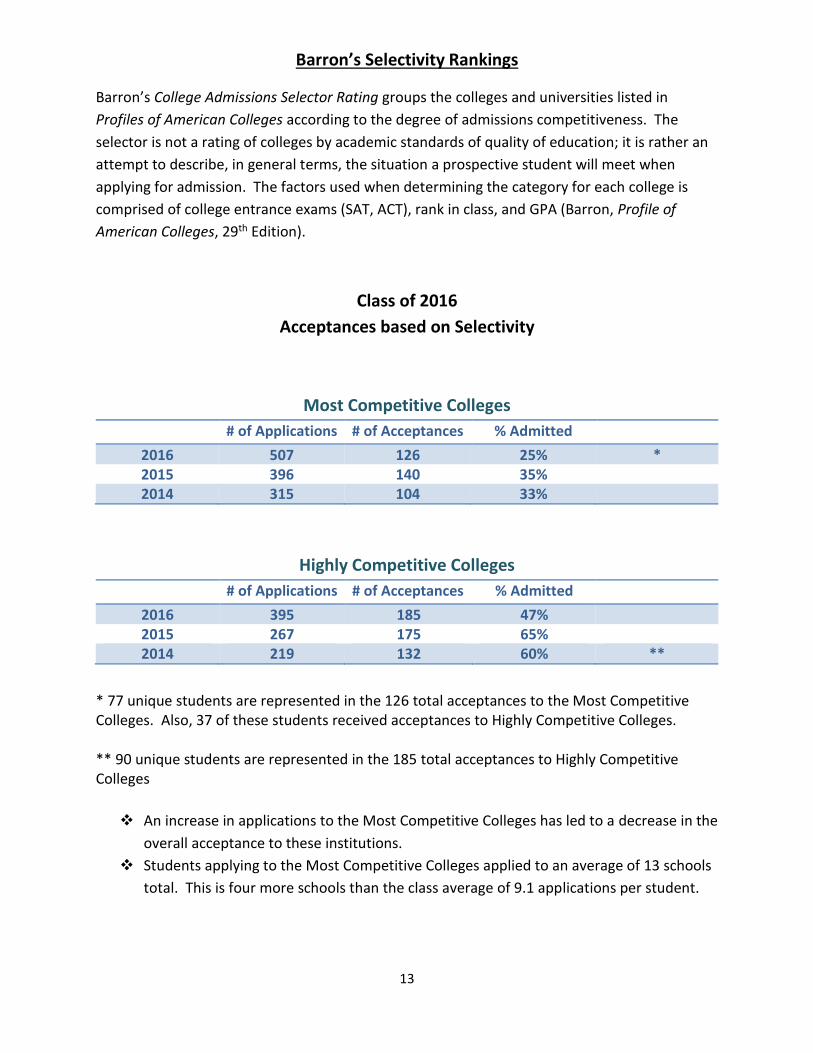
Barron’s Selectivity Rankings
Barron’s College Admissions Selector Rating groups the colleges and universities listed in
Profiles of American Colleges according to the degree of admissions competitiveness. The
selector is not a rating of colleges by academic standards of quality of education; it is rather an
attempt to describe, in general terms, the situation a prospective student will meet when
applying for admission. The factors used when determining the category for each college is
comprised of college entrance exams (SAT, ACT), rank in class, and GPA (Barron, Profile of
American Colleges, 29th Edition).
Class of 2016
Acceptances based on Selectivity
Most Competitive Colleges
# of Applications # of Acceptances % Admitted 2016 507 126 25% * 2015 396 140 35% 2014 315 104 33%
Highly Competitive Colleges
# of Applications # of Acceptances % Admitted 2016 395 185 47% 2015 267 175 65% 2014 219 132 60% **
* 77 unique students are represented in the 126 total acceptances to the Most Competitive Colleges. Also, 37 of these students received acceptances to Highly Competitive Colleges. ** 90 unique students are represented in the 185 total acceptances to Highly Competitive Colleges
An increase in applications to the Most Competitive Colleges has led to a decrease in the
overall acceptance to these institutions.
Students applying to the Most Competitive Colleges applied to an average of 13 schools
total. This is four more schools than the class average of 9.1 applications per student.
14
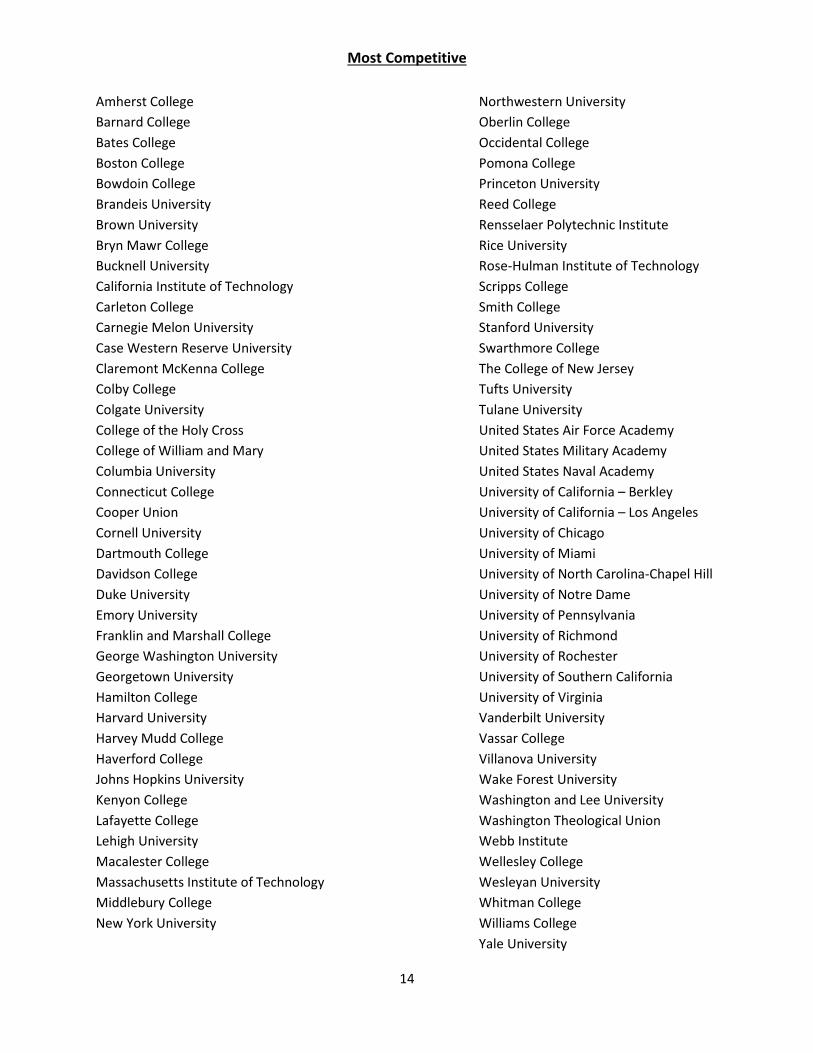
Most Competitive
Amherst College Northwestern University
Barnard College Oberlin College
Bates College Occidental College
Boston College Pomona College
Bowdoin College Princeton University
Brandeis University Reed College
Brown University Rensselaer Polytechnic Institute
Bryn Mawr College Rice University
Bucknell University Rose-Hulman Institute of Technology
California Institute of Technology Scripps College
Carleton College Smith College
Carnegie Melon University Stanford University
Case Western Reserve University Swarthmore College
Claremont McKenna College The College of New Jersey
Colby College Tufts University
Colgate University Tulane University
College of the Holy Cross United States Air Force Academy
College of William and Mary United States Military Academy
Columbia University United States Naval Academy
Connecticut College University of California – Berkley
Cooper Union University of California – Los Angeles
Cornell University University of Chicago
Dartmouth College University of Miami
Davidson College University of North Carolina-Chapel Hill
Duke University University of Notre Dame
Emory University University of Pennsylvania
Franklin and Marshall College University of Richmond
George Washington University University of Rochester
Georgetown University University of Southern California
Hamilton College University of Virginia
Harvard University Vanderbilt University
Harvey Mudd College Vassar College
Haverford College Villanova University
Johns Hopkins University Wake Forest University
Kenyon College Washington and Lee University
Lafayette College Washington Theological Union
Lehigh University Webb Institute
Macalester College Wellesley College
Massachusetts Institute of Technology Wesleyan University
Middlebury College Whitman College
New York University Williams College
Yale University
15
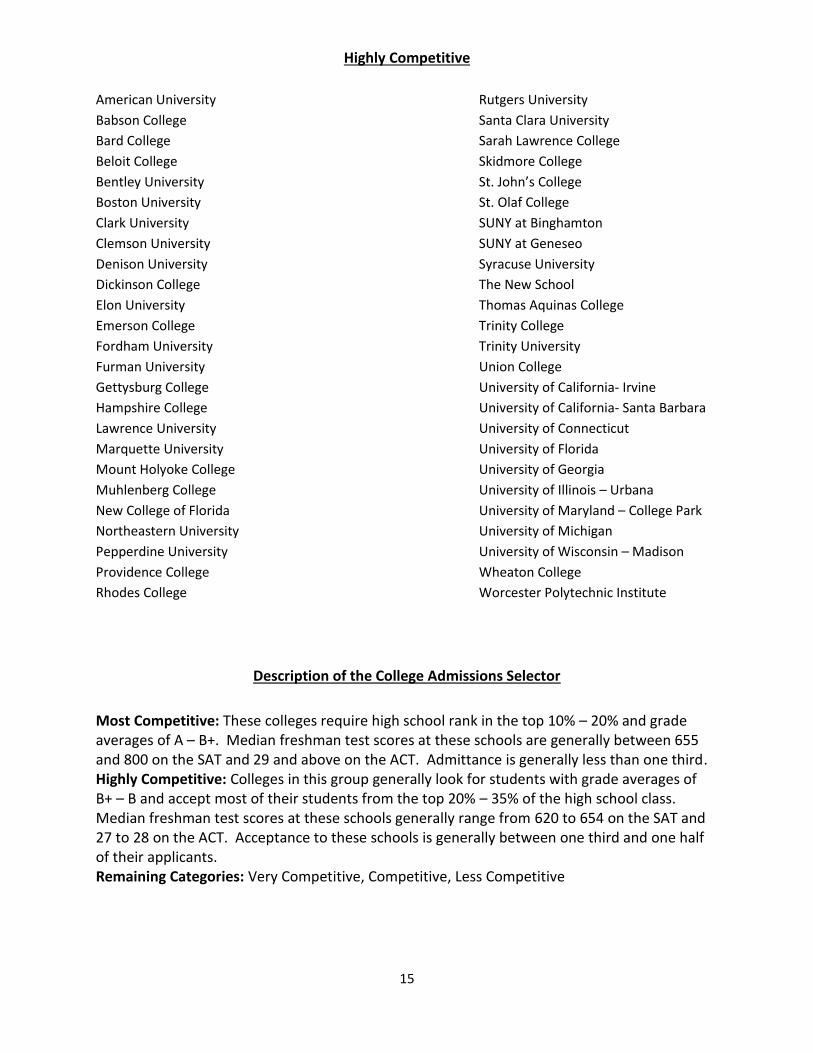
Highly Competitive
American University Rutgers University
Babson College Santa Clara University
Bard College Sarah Lawrence College
Beloit College Skidmore College
Bentley University St. John’s College
Boston University St. Olaf College
Clark University SUNY at Binghamton
Clemson University SUNY at Geneseo
Denison University Syracuse University
Dickinson College The New School
Elon University Thomas Aquinas College
Emerson College Trinity College
Fordham University Trinity University
Furman University Union College
Gettysburg College University of California- Irvine
Hampshire College University of California- Santa Barbara
Lawrence University University of Connecticut
Marquette University University of Florida
Mount Holyoke College University of Georgia
Muhlenberg College University of Illinois – Urbana
New College of Florida University of Maryland – College Park
Northeastern University University of Michigan
Pepperdine University University of Wisconsin – Madison
Providence College Wheaton College
Rhodes College Worcester Polytechnic Institute
Description of the College Admissions Selector
Most Competitive: These colleges require high school rank in the top 10% – 20% and grade averages of A – B+. Median freshman test scores at these schools are generally between 655 and 800 on the SAT and 29 and above on the ACT. Admittance is generally less than one third. Highly Competitive: Colleges in this group generally look for students with grade averages of B+ – B and accept most of their students from the top 20% – 35% of the high school class. Median freshman test scores at these schools generally range from 620 to 654 on the SAT and 27 to 28 on the ACT. Acceptance to these schools is generally between one third and one half of their applicants. Remaining Categories: Very Competitive, Competitive, Less Competitive
16
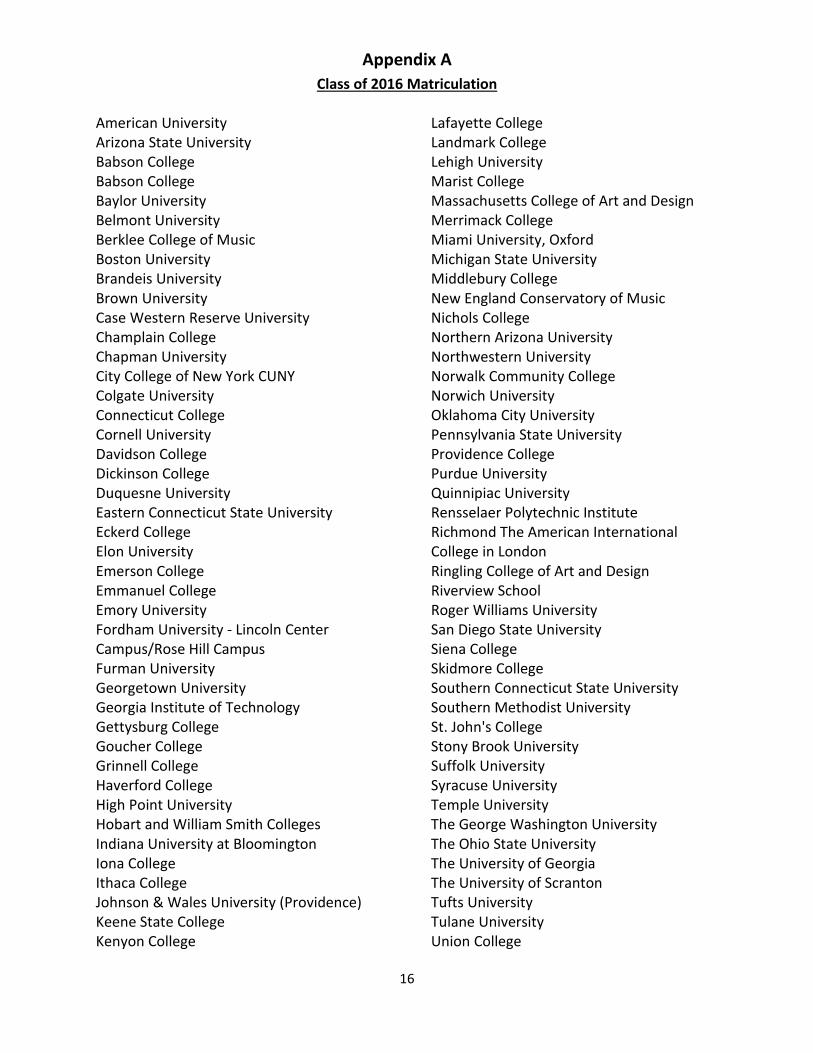
Appendix A
Class of 2016 Matriculation
American University Arizona State University Babson College Babson College Baylor University Belmont University Berklee College of Music Boston University Brandeis University Brown University Case Western Reserve University Champlain College Chapman University City College of New York CUNY Colgate University Connecticut College Cornell University Davidson College Dickinson College Duquesne University Eastern Connecticut State University Eckerd College Elon University Emerson College Emmanuel College Emory University Fordham University - Lincoln Center Campus/Rose Hill Campus Furman University Georgetown University Georgia Institute of Technology Gettysburg College Goucher College Grinnell College Haverford College High Point University Hobart and William Smith Colleges Indiana University at Bloomington Iona College Ithaca College Johnson & Wales University (Providence) Keene State College Kenyon College
Lafayette College Landmark College Lehigh University Marist College Massachusetts College of Art and Design Merrimack College Miami University, Oxford Michigan State University Middlebury College New England Conservatory of Music Nichols College Northern Arizona University Northwestern University Norwalk Community College Norwich University Oklahoma City University Pennsylvania State University Providence College Purdue University Quinnipiac University Rensselaer Polytechnic Institute Richmond The American International College in London Ringling College of Art and Design Riverview School Roger Williams University San Diego State University Siena College Skidmore College Southern Connecticut State University Southern Methodist University St. John's College Stony Brook University Suffolk University Syracuse University Temple University The George Washington University The Ohio State University The University of Georgia The University of Scranton Tufts University Tulane University Union College
17
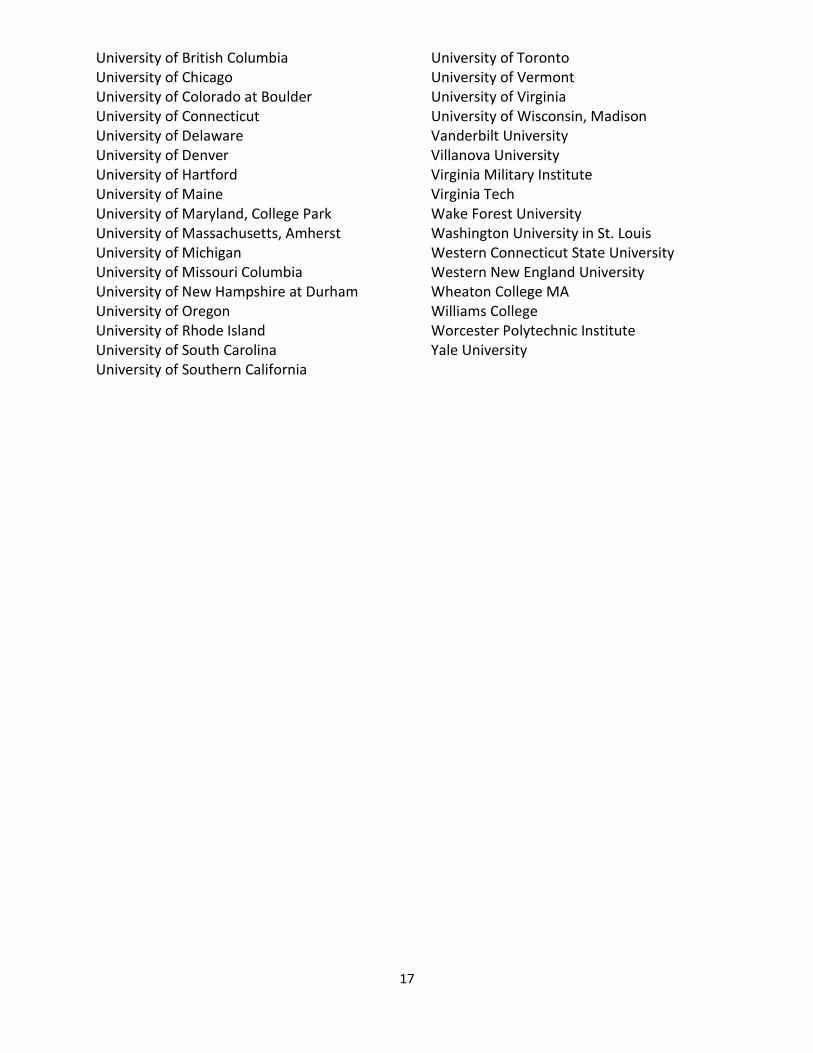
University of British Columbia University of Chicago University of Colorado at Boulder University of Connecticut University of Delaware University of Denver University of Hartford University of Maine University of Maryland, College Park University of Massachusetts, Amherst University of Michigan University of Missouri Columbia University of New Hampshire at Durham University of Oregon University of Rhode Island University of South Carolina University of Southern California
University of Toronto University of Vermont University of Virginia University of Wisconsin, Madison Vanderbilt University Villanova University Virginia Military Institute Virginia Tech Wake Forest University Washington University in St. Louis Western Connecticut State University Western New England University Wheaton College MA Williams College Worcester Polytechnic Institute Yale University
18
Appendix B
Highlights and Announcements from the WHS School Counseling Department
This year we are pleased to report that WHS will continue to administer the SAT on four separate test dates. Those dates are October 1, January 21, May 6, and June 3. We are also administering the ACT on two separate test dates; October 22 and June 10. In response to the increase in ACT participation, WHS has decided to administer the Pre-ACT to sophomores on Saturday, May 6. Registration information will be provided to families in March. This fall, the College and Career Center (CCC) had over 205 colleges visit. The number of visiting colleges continues to increase each year despite the recent trend of institutions holding open houses and not participating in fairs or high school visits. This provides students with the opportunity to establish personal communication, in a small setting, with the admissions representatives who will most likely be reading their application. The counselors were also able to increase the amount of visits they attended in the CCC to 90%. Meeting with admissions representatives is crucial to strengthen the relationship between WHS and post-secondary institutions. On October 20, the school counseling department held an annual College Admissions Panel Night presentation. A diverse admissions panel of very selective and highly selective colleges and universities representing both the private and public sector addressed current trends and relevant issues regarding post-secondary planning. The panelists clarified the admissions processes unique to their institutions in addition to discussing the various key components of the application process such as transcripts, standardized tests, scholarships, essays, interviews, campus visits, file review, and financial aid. This year’s panel included admissions representatives from Washington University in St. Louis, Colgate, Boston University, Franklin and Marshall, Indiana University, SMU, Hobart and William Smith, University of Delaware, and Union College. The school counseling department has continued to increase the level of communication with families through monthly newsletters and the school website. In our continuing efforts to support students through the post-secondary process, we have increased the number of programs we offer throughout the school year. Upcoming presentations in October and November include a sophomore parent seminar, a financial aid seminar, and a junior parent post-secondary planning evening. In December, the school counseling department will be hosting an alumni panel for juniors. Recent graduates will be invited back to WHS to share their experience with the college application process. The alumni will be able to provide a unique perspective on the process that only a former student could relay. In response to student and parental concerns on “life after WHS”, the counseling department will hold Senior Seminars prior to Internship in April. These seminars will take place during school at the beginning of fourth quarter. Students will learn about self-defense, financial planning and budgeting, nutrition, and coping skills for anxiety and stress when they leave home. More information on these sessions can be found in the counseling department monthly newsletter second semester.
W SCHOOL COUNSELING DEPARTMENT
NEWSLETTER NOVEMBER 2016
WESTON HIGH SCHOOL
School
NOV. 4TH FIRST DAY OF 2ND QUARTER
NOV. 9TH SOPHOMORE SECRETS FOR
SUCCESS PARENT SEMINAR
8:30AM, MAIN OFFICE CONFERENCE ROOM
NOV. 14TH STUDENT SOPHOMORE SEMINARS BEGIN
NOV 17TH JR. COLLEGE PLANNING EVENING SEMINAR
7:00PM, WHS AUDITORIUM
The end of the first quarter is a great time to review
your child’s performance. In addition to the grades
and comments on PowerSchool, we suggest you use
this opportunity to discuss your student’s overall
transition to the high school. It is our observation that
many freshmen typically underestimate the increased
demands on their time and energy during the
transition. Increased classroom expectations
combined with participation in the activities and
athletic programs puts pressure on a student’s physical
well-being, tests their executive functioning, and
contributes to many cranky adolescent mornings.
We offer the following talking points to help you with
the conversation:
Ask your child: What kind of effort went into the
first quarter report card? Identify any areas
needing improvement and provide positive
feedback where the student performed admirably.
Set goals for the second quarter.
Promote a conversation about well-being and
balance. Is the overall schedule too much when
combined with co-curricular activities? Are they
getting enough rest? How can you (as parents)
provide additional support or structure to continue
or promote an increase in their performance?
FRESHMEN, CONT.
Talk about communication. Is your student taking
full advantage of extra help opportunities and
communicating with his/her teachers? How
effectively are they using their available resources
(teacher webpages, PowerSchool, email) to gain
clarity and improve performance?
Remind your student that the first quarter is just a
starting point. Most students who successfully
transition to the high school improve their
performance as the year continues. Remember,
only the final grades appear on student transcripts.
Quarter grades, mid-year, final exam grades and
teacher comments do not appear, so there is
plenty of time to improve.
Homework, homework, homework! Students
cannot be successful in the classroom and on
assessments if they are not completing their
homework in a thorough and timely manner.
The School Counseling Office is here to help. If there
are significant concerns, feel free to contact us to
discuss available resources and gain additional insight
as to how you can assist your student with being more
successful in the classroom or more involved in the
school community.
SOPHOMORES
Please join us on November 9th at 8:30am for
Sophomore Secrets to Success, an informational
parent meeting in the Main Office Conference
Room. We will be providing an overview of what to
expect during sophomore year, an introduction to
Naviance, a brief overview of standardized testing,
and strategies for maximizing effective
communication. If you are unable to make this
daytime meeting, a PowerPoint presentation
covering the salient points will be posted to our
website for viewing at your convenience.
Application Processing Update:
Seniors and their parents should rest assured that all
Weston High School documentation is being filed on time
with colleges and in many cases, in advance of our stated
timeline. As a reminder, it is the student’s responsibility to
ensure that all application materials have been received by
the institution. If you have any questions regarding the
status of your application, please contact the college or
university directly.
Financial Aid Seminar Recap:
On October 25th, Morgan Kelly, Associate Director of
Student Financial Assistance at Sacred Heart University
provided a comprehensive financial aid program overview.
Ms. Kelly encouraged parents to:
Verify with each college what financial aid forms are
required as well as the deadline(s), which vary.
Become familiar with 3 potential forms: Free
Application for Federal Student Aid (FAFSA), College
Scholarship Service (CSS) Profile, and/or any
institution-specific forms. All schools require the
FAFSA, some private institutions require the CSS
Profile, and others have their own additional financial
applications.
File the CSS Profile ASAP as it is estimate-based. The
FAFSA may be filed after October 1st. Institution-
specific application timelines vary.
Use the Net Price Calculator (which is available on
every institution’s website) to help better understand
potential out-of-pocket expenses now! A tax return is
not required and it takes about 10 minutes.
Ask relevant questions including: How do outside
awards affect the aid package? What is the school’s
policy on non-custodial parents? What is the average
student debt level? Are the scholarships/grants
renewable each year? How might the award change in
future years? What if financial circumstances change?
For more information, click here for the PowerPoint
presentation.
SOPHOMORES, CONT.
During the week of November 14th, we will holding
Sophomore Student Seminars. Students will be
completing various inventories in Naviance related
to personality type and career exploration. Useful
information regarding learning style, strengths, blind
spots, and potential careers will be available in
Naviance following this presentation for discussion
at home as well as in-school follow up during second
semester.
JUNIORS
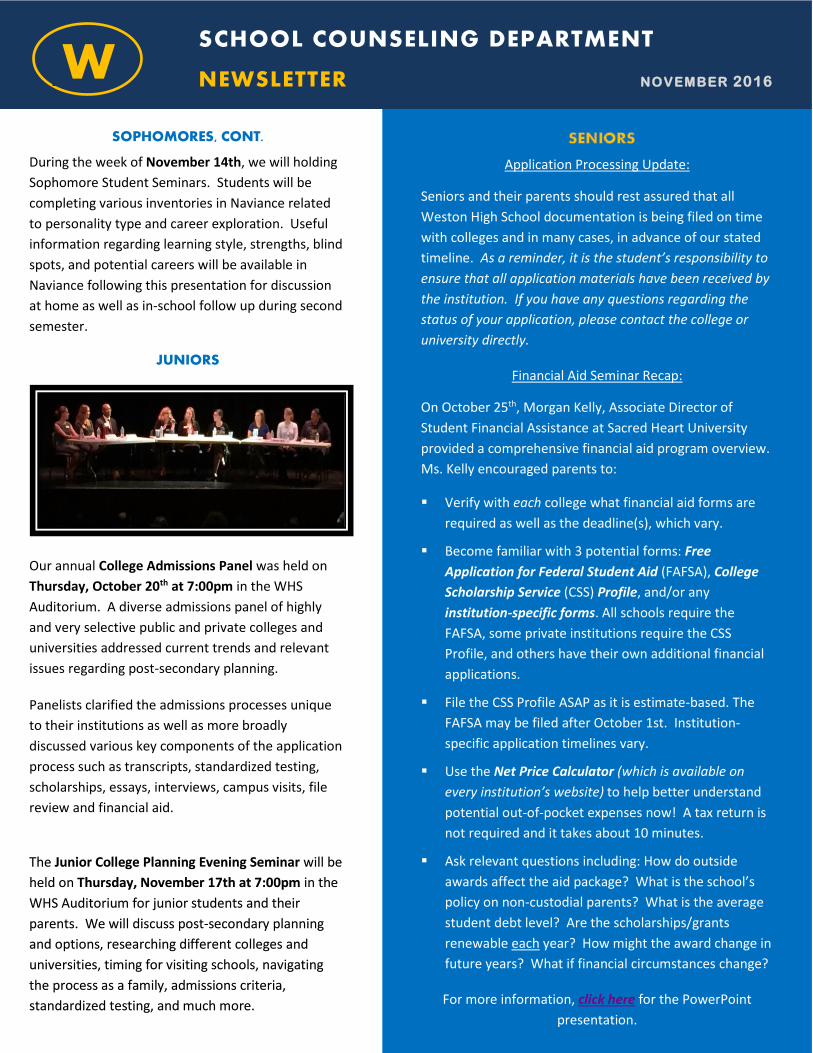
Our annual College Admissions Panel was held on
Thursday, October 20th at 7:00pm in the WHS
Auditorium. A diverse admissions panel of highly
and very selective public and private colleges and
universities addressed current trends and relevant
issues regarding post-secondary planning.
Panelists clarified the admissions processes unique
to their institutions as well as more broadly
discussed various key components of the application
process such as transcripts, standardized testing,
scholarships, essays, interviews, campus visits, file
review and financial aid.
The Junior College Planning Evening Seminar will be
held on Thursday, November 17th at 7:00pm in the
WHS Auditorium for junior students and their
parents. We will discuss post-secondary planning
and options, researching different colleges and
universities, timing for visiting schools, navigating
the process as a family, admissions criteria,
standardized testing, and much more.
W SCHOOL COUNSELING DEPARTMENT
NEWSLETTER NOVEMBER 2016