Embed Size (px)
DESCRIPTION
Westlake OH residential home sales report and guide for homeowners, sellers, and buyers. This report details both local and national housing trends as a tool for potential buyers and sellers.
Citation preview

WESTLAKE OH
2015 HOME SALES REPORTFOR SELLERS, OWNERS & HOME BUYERS
SPRING 2015
EDITION NortheastOhioRealEstateSource.com
Facebook.com/AmazingNortheastOhioHomes
Amazing

Crossroads Properties
Lisa Humenik
About the Author:
LISA HUMENIK, Realtor®, RE/MAX Crossroads
Lisa Humenik is a real estate professional (REALTOR) at RE/MAX
Crossroads Properties helping clients buy and/or sell their home
and find the perfect new place or investment to meet their
needs. Her clients include residential home sellers, investors, and
new and move-up buyers. Home sellers enjoy state-of-the-art
marketing services to assist them in the sale of their home
including internet, video, social media, print, and mobile
marketing to expose their home to the most buyers. Lisa is the
author of the NortheastOhioRealEstateSource.com blog covering
real estate trends in the Northeast Ohio suburbs. Lisa’s Facebook
fan page, AmazingNortheastOhioHomes, has over 1,200 fans.
Lisa has been practicing real estate for over ten years and sells
over 50 homes per year. She also holds a BBA in Marketing and
Quantitative Business Analysis from Cleveland State University.
Lisa can be reached at (440)476-4959 or via email at
RE/MAX Crossroads
CONTENTS
Lisa Humenik, RE/MAX Crossroads * (440)476-4959* AmazingNortheastOhioHomes.com
1. NATIONAL HOUSING MARKET SUMMARY
2. WESTLAKE OHIO MARKET TRENDS & DATA
Home Prices
Homes Sold
Homes for Sale & New Listings
Market Inventory
3. MORTGAGE RATES
4. 2015 EXPERT MARKET PREDICTIONS
5. SELLING A HOME IN 2015
6. REASONS TO BUY A HOME IN 2015
7. HOW TO INCREASE YOUR SALES PRICE
8. TOP HOME SELLING STRATEGIES FOR 2015
9. SMART HOME SELLERS
APPENDIX Real Estate Market Data for Westlake
YTD to May 1, 2015 DATA
This report covers Single Family home sales in the Westlake OH real estate
market. Detailed YTD results are shown in the Appendix. Specific data is
available for any local suburb on request.

Lisa Humenik, RE/MAX Crossroads * (440)476-4959* AmazingNortheastOhioHomes.com
U.S. HOME SALES – 1Q 2015 NATIONAL RESULTS

1Q, 2015 NATIONAL HOUSING MARKET TRENDS
Lisa Humenik, RE/MAX Crossroads * (440)476-4959* AmazingNortheastOhioHomes.com
National 1Q, 2015 Market OverviewA just released report, the Health of Housing Market
(HoHM) Report (Nationwide), states the US housing
market is at it’s healthiest levels since the index’s
creation in 2001. The report showed that the 4Q, 2014
ended with the highest indicator score in over 15 years
at a score of 109.8. Employment, demographics, the
mortgage market, and housing prices are all used to
evaluate the health of each market. The report
ranked the top 10 healthiest housing markets and
ranked the Cleveland area on the Top 10 List, as #2.
The most recent Pending Homes Sales Index from the
National Association of Realtors revealed that homes
going into contract in February increased to their
highest level since June 2013. The Pending Home
Sales Index is a leading indicator for the housing
sector, based on pending sales of existing homes. A
sale is listed as pending when the contract has been
signed but the transaction has not closed, though the
sale usually is finalized within one or two months of
signing.
Realtor.com data shows that supply is not keeping
pace with surging demand. The are expecting rising
prices to persuade those who may be on the fence
about listing their homes to do so in the coming
months, leading to closer parity between supply and
demand.” In addition, Fannie Mae's March 2015
Housing Survey, also showed signs of a seller's market.
The percentage of respondents in Fannie Mae's survey
who said they believe now is a good time to sell
reached an all-time survey high of 46 percent.
Source: Business Insider (3/30/2015)
Source: Business Insider (3/30/2015)
NATIONAL HOUSING MARKET TRENDS
Lisa Humenik, RE/MAX Crossroads * (440)476-4959* AmazingNortheastOhioHomes.com
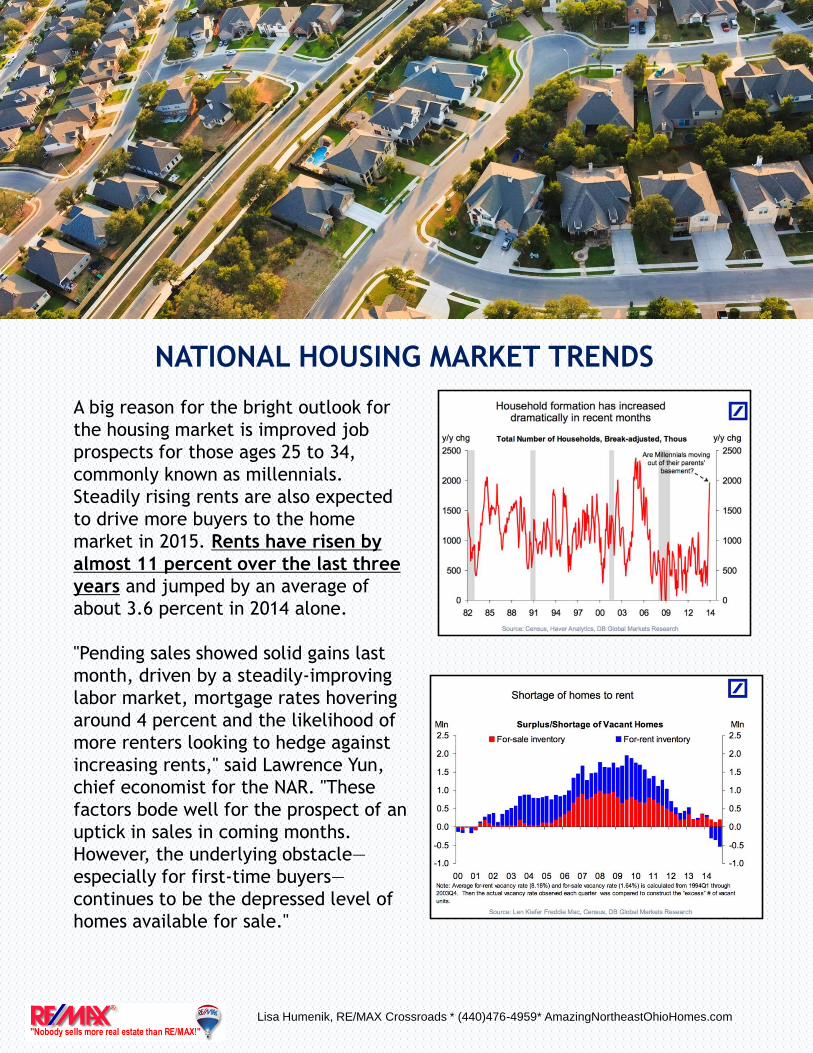
A big reason for the bright outlook for
the housing market is improved job
prospects for those ages 25 to 34,
commonly known as millennials.
Steadily rising rents are also expected
to drive more buyers to the home
market in 2015. Rents have risen by
almost 11 percent over the last three
years and jumped by an average of
about 3.6 percent in 2014 alone.
"Pending sales showed solid gains last
month, driven by a steadily-improving
labor market, mortgage rates hovering
around 4 percent and the likelihood of
more renters looking to hedge against
increasing rents," said Lawrence Yun,
chief economist for the NAR. "These
factors bode well for the prospect of an
uptick in sales in coming months.
However, the underlying obstacle—
especially for first-time buyers—
continues to be the depressed level of
homes available for sale."

Crossroads Properties
WHERE ARE HOME PRICESHEADING IN THE NEXT FIVE
YEARS?
Real estate and financial professionals put
tremendous value in the Home Price Expectation
Survey. Every quarter, Pulsenomics surveys a
nationwide panel of more than 100 economists,
real estate experts and investment & market
strategists about where prices are headed over the
next five years. They then average the projections
of all 100+ experts into a single number. The results
of their latest survey:
Nationally, values appreciated by 4.8% in 2014
Cumulative appreciation will be 23.5% by 2019
That means the average annual appreciation will
be 3.6% over the next 5 years.
Even the experts making up the most bearish
quartile of the survey still are projecting a
cumulative appreciation of almost 15.1% by 2019.
This survey is a fair depiction of future values.
WHERE ARE HOME PRICES HEADED OVER
THE NEXT 5 YEARS?
Lisa Humenik, RE/MAX Crossroads * (440)476-4959* AmazingNortheastOhioHomes.com
WESTLAKE HOME SALES
LOOKING BACK AT 2014 AND WHAT IS AHEAD FOR 2015
Lisa Humenik, RE/MAX Crossroads * (440)476-4959* AmazingNortheastOhioHomes.com
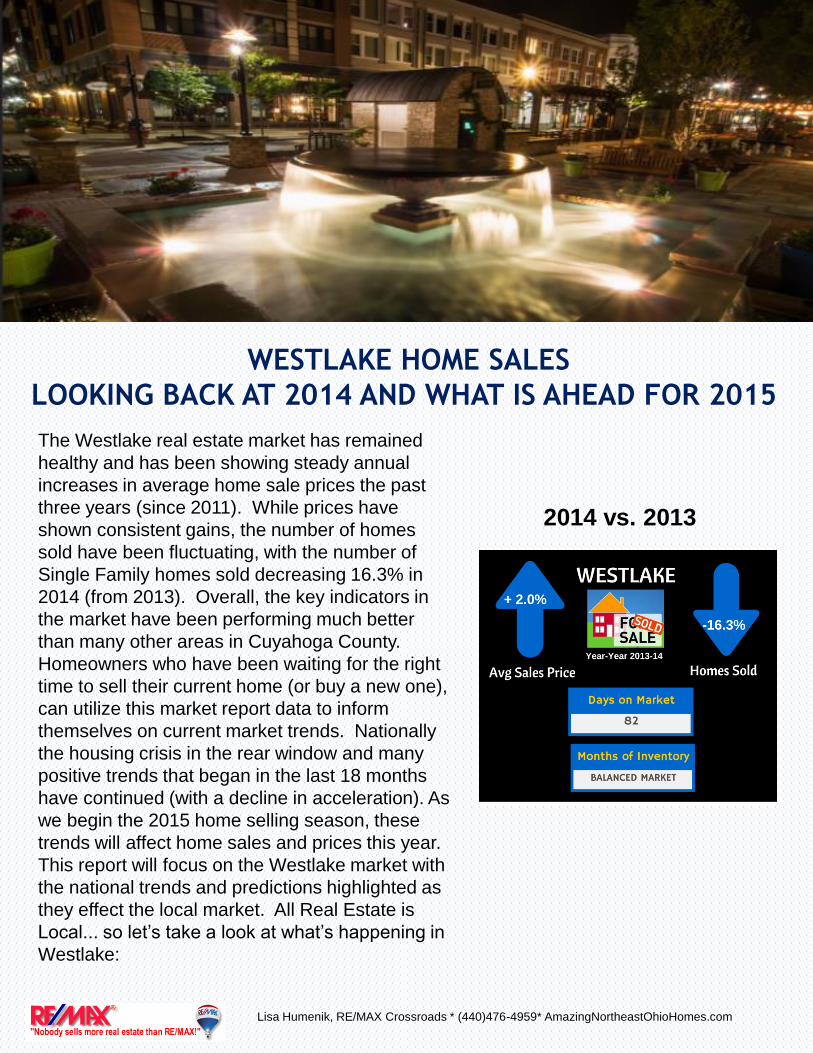
2014 vs. 2013
The Westlake real estate market has remained
healthy and has been showing steady annual
increases in average home sale prices the past
three years (since 2011). While prices have
shown consistent gains, the number of homes
sold have been fluctuating, with the number of
Single Family homes sold decreasing 16.3% in
2014 (from 2013). Overall, the key indicators in
the market have been performing much better
than many other areas in Cuyahoga County.
Homeowners who have been waiting for the right
time to sell their current home (or buy a new one),
can utilize this market report data to inform
themselves on current market trends. Nationally
the housing crisis in the rear window and many
positive trends that began in the last 18 months
have continued (with a decline in acceleration). As
we begin the 2015 home selling season, these
trends will affect home sales and prices this year.
This report will focus on the Westlake market with
the national trends and predictions highlighted as
they effect the local market. All Real Estate is
Local... so let’s take a look at what’s happening in
Westlake:

WESTLAKE - HOMES SOLD
2014 Market Summary
The number of Single Family homes sold in 2014
was 251, down from 300 (-16.3%) the year prior.
So far this year, home sales started off slow, but
the current YTD sales are outpacing the same
period last year. The forecast for 2015 is a 2-3%
increase in the number of homes sold as
demand for the Westlake market continues to
increase.
1Q, 2015 Market Summary
So far YTD (up to May, 2015) the number of
Single Family home sold in Westlake is up 30%
from 2014. In April, there were 28 homes sold,
up 100% from March of 2014 (14). In addition,
pending home sales (the leading indicator),
are up 43.5% from the same quarter last year
which indicates a strong upcoming sales
market for 2015. The number of homes
available for sale has finally started increasing.
At the end April, we had 108 single family
homes for sale, up 12.5% from 96 in April 2014.
Lisa Humenik, RE/MAX Crossroads * (440)476-4959* AmazingNortheastOhioHomes.com
Westlake – 5YR Single Family Homes Sold
Trend (2009-2014)
Westlake – Single Family
Homes For Sale, Sold & Pending (last 13 mos)
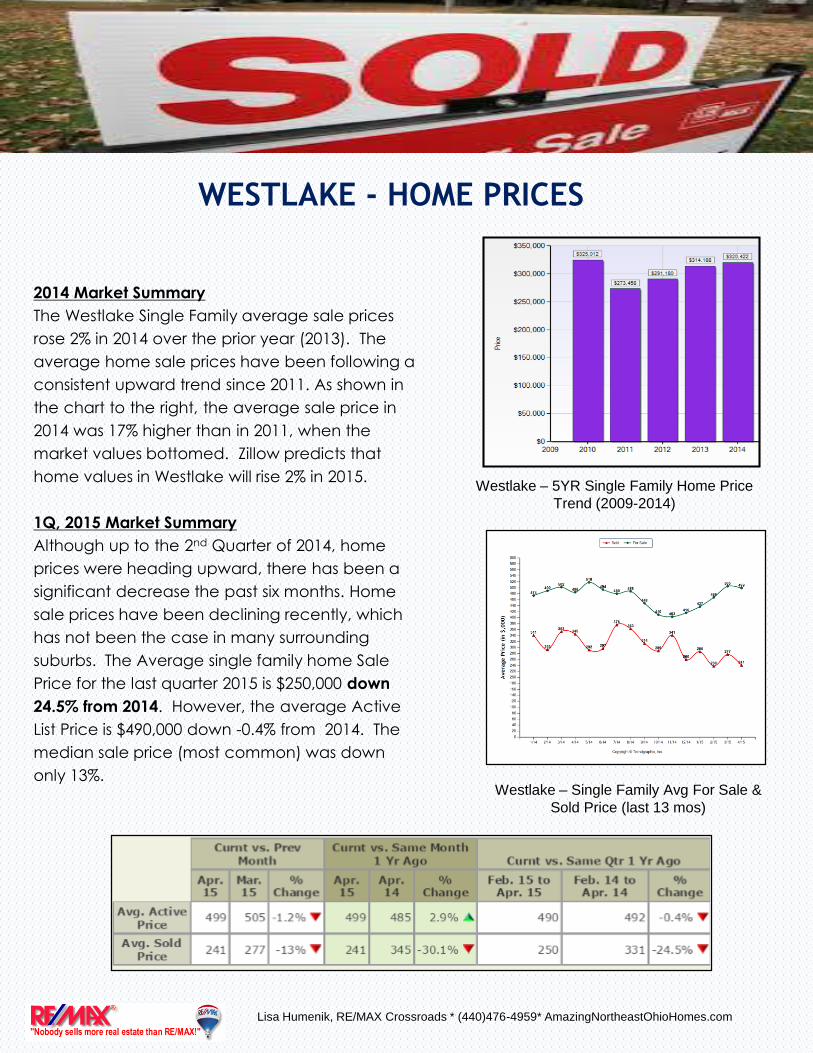
2014 Market Summary
The Westlake Single Family average sale prices
rose 2% in 2014 over the prior year (2013). The
average home sale prices have been following a
consistent upward trend since 2011. As shown in
the chart to the right, the average sale price in
2014 was 17% higher than in 2011, when the
market values bottomed. Zillow predicts that
home values in Westlake will rise 2% in 2015.
1Q, 2015 Market Summary
Although up to the 2nd Quarter of 2014, home
prices were heading upward, there has been a
significant decrease the past six months. Home
sale prices have been declining recently, which
has not been the case in many surrounding
suburbs. The Average single family home Sale
Price for the last quarter 2015 is $250,000 down
24.5% from 2014. However, the average Active
List Price is $490,000 down -0.4% from 2014. The
median sale price (most common) was down
only 13%.
WESTLAKE - HOME PRICES
Lisa Humenik, RE/MAX Crossroads * (440)476-4959* AmazingNortheastOhioHomes.com
Westlake – 5YR Single Family Home Price
Trend (2009-2014)
Westlake – Single Family Avg For Sale &
Sold Price (last 13 mos)

HOMES FOR SALE AND NEW LISTINGSWestlake – Single Family - Past 5 Years
The number of Homes for Sale has
been declining over the past five
years creating a supply problem and
creating SELLER’S markets in many
suburbs due to tight inventory levels.
In April 2015, there were 108 homes
on the market for sale, compared to
172 five years ago - a 37% decrease.
However, the bottom of the home
inventory appears to have passed at
the end of 2013 and now more homes
are hitting the market. New listings
for 2015 are running close to 2014
numbers.
The current market inventory is
3.9 months which is a Balanced
Market between buyers and sellers
(a Sellers Market is 3 mos or less of
inventory and a Buyers Market is
more than 6 months).
Lisa Humenik, RE/MAX Crossroads * (440)476-4959* AmazingNortheastOhioHomes.com
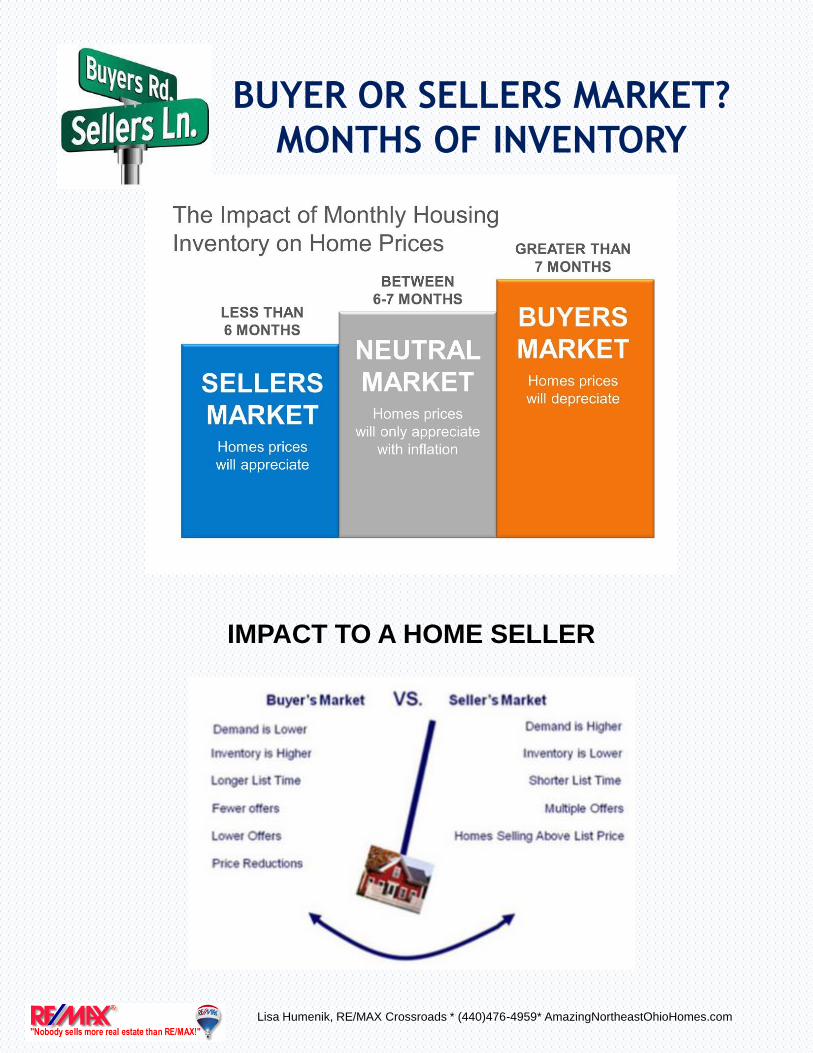
BUYER OR SELLERS MARKET?
MONTHS OF INVENTORY
Lisa Humenik, RE/MAX Crossroads * (440)476-4959* AmazingNortheastOhioHomes.com
IMPACT TO A HOME SELLER

Crossroads Properties
MARKET TREND DATA – SURROUNDING SUBURBS
CITY 2014 Homes Sold
(% Change to
2013)
2014 Avg. Sales Price
(% Change to 2013)
YE Mos.
Inventory
TEMPERATURE /
MARKET TRENDS
PARMA 1,047 (+1.2%) $89,869 (+.6%) 5.6 BALANCED. Prices and Home Sales Rising. Decreased distress
sales.
STRONGSVILLE 531 (4.1%) $204,994(-1.1%) 3.3 SELLERS MARKET. Significant increase in homes sold. Price
neutral.
LAKEWOOD 451 (3%) $153,473 (+4.4%) 3.6 SELLERS MARKET. Home sales and prices rising.
BRUNSWICK 433 (-3.8%) $171,331 (+10.3%) 3.7 BALANCED. Prices Rising. Balanced inventory.
AVON 375 (-9.6%) $269,043 (+6.4%) 3.1 BALANCED. Prices Rising. Balanced inventory.
OLM FALLS & TOWNSHP 275 (3.8%) $141.924 (-2.1%) 4.3 BALANCED MARKET. Home sales rising with pricing
remaining nuetral
ROCKY RIVER 260 (-9.4%) $288,787 (-1.2%) 4.0 BALANCED MARKET. Decline in homes sold and prices due
to increase in homes available.
WESTLAKE 251 (-16.3%) $320,422 (+2%) 3.9 TIGHT INVENTORY in some neighborhoods. Decreasing
home sales with prices increasing.
NORTH OLMSTED 214 (-19.1%) $137,078 (+5.7%) 3.5 BALANCED MARKET. Sales declining with reduced distress
sales.
BEREA 212 (+7.1%) $125,356 (+0.3%) 3.7 BALANCED MARKET. Significant increase in homes sold and
moderate price increases.
BROOK PARK 206 (+19.8%) $93,380 (+5.6%) 2.6 WARM MARKET – PRICES RISING AND NUMBER OF HOMES
SOLD
ALL CUYAHOGA
SUBURBS
11,348 (-3.5%) $145,267(2.4%) 5.4 BALANCED MARKET. Slight decline in homes sold with price
appreciation.
If you’d like a instant report showing the current sales and price trends in your local neighborhood..
VISIT:
NortheastOhioNeighborhoodReport.com
Lisa Humenik, RE/MAX Crossroads * (440)476-4959* AmazingNortheastOhioHomes.com

Crossroads Properties
WHAT IS THE MARKET & PRICE TRENDS IN
YOUR NEIGHBORHOOD TODAY?
All Real Estate is Local! What might be
happening to sales and prices in the suburb
next to yours can be different. Although
housing prices and trends are significantly
affected by national and regional trends,
local influences such as jobs, schools, taxes,
and distress sales have a significant impact
on the real estate market.
If you’d like a instant report showing the
current sales and price trends in your local
neighborhood..
VISIT:
http://NortheastOhioNeighborhoodReport.com
Lisa Humenik, RE/MAX Crossroads * (440)476-4959* AmazingNortheastOhioHomes.com
SAMPLE

MORTGAGE RATES OVER TIME
Today’s average mortgage rate is 3.86% and the average House Payment is $939. Today’s
mortgage rates are a bargain as compared to what the have averaged in past years.
Lisa Humenik, RE/MAX Crossroads * (440)476-4959* AmazingNortheastOhioHomes.com
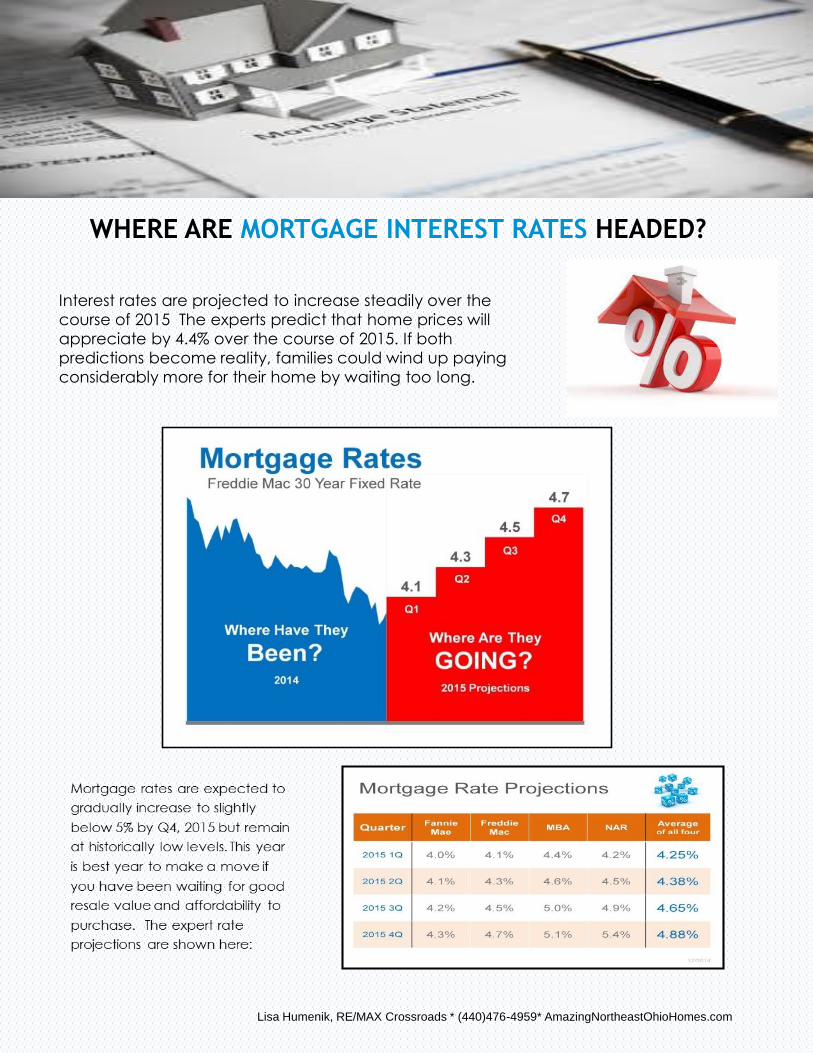
WHERE ARE MORTGAGE INTEREST RATES HEADED?
Interest rates are projected to increase steadily over the
course of 2015 The experts predict that home prices will
appreciate by 4.4% over the course of 2015. If both
predictions become reality, families could wind up paying
considerably more for their home by waiting too long.
Lisa Humenik, RE/MAX Crossroads * (440)476-4959* AmazingNortheastOhioHomes.com

Crossroads Properties
2015 Expert Real Estate
Market Forecast
1. Millennials will drive household formations. Younger professionals are having more
luck in the job market, which is expected to help more of them jump into home
ownership
2. Existing home sales will increase 5-8% as more buyers enter the market motivated
by a clear belief that both rates and prices will continue to rise.
3. Home prices will rise between 4-5%: Low inventory levels and demand driven by
improved employment opportunities will push home prices up next year.
4. Mortgage rates will end the year at 5% with increases beginning in the middle of
2015
5. Return of the 3 percent down payment. Fannie Mae and Freddie Mac have
announced new programs lowering down payment requirements helping more
buyers.
6. New-home sales rebound. Sales of new homes are expected to rise 25 percent as
single-family construction picks up traction in 2015.
7. Foreclosures recede to pre-recession levels and REO inventory to decline
sharply: The number of foreclosures is expected to continue to fall in 2015, but
possibly be still high in some pocket areas.
8. Rents continue to rise. Growth in U.S. rents will outpace growth in home values by
the end of the year
9. Zillow predicts more homes selection, continued low mortgage rates, coupled
with an increasingly difficult rental environment. These factors will bring balance
to 2015 and result in smoother sailing for everyone in the housing market...2015
could be one of the best years to buy or sell!
Lisa Humenik, RE/MAX Crossroads * (440)476-4959* AmazingNortheastOhioHomes.com
REASONS 2015 IS A GOOD TIME TO SELLAs the temperature rises, buyers are coming out ready to purchase their dream home. The spring is a
great time to list your home for sale. Here are five reasons supporting that.
1. Demand is StrongFoot traffic refers to the number of people out actually physically looking at homes right now. The latest
foot traffic numbers show that there are more prospective purchasers currently looking at homes than at
any other time in the last 12 months which includes last spring’s buyers’ market. These buyers are ready,
willing and able to purchase… and are in the market right now! Take advantage of the buyer activity
currently in the market.
2. Less Competition Housing supply just dropped to 5 months, which is under the 6 months’ supply that is needed for a
normal housing market. This means, in many areas, there are not enough homes for sale to satisfy the
number of buyers in that market. This is good news for home prices. However, additional inventory is
about to come to market.
There is a pent-up desire for many homeowners to move as they were unable to sell over the last few
years because of a negative equity situation. Homeowners are now seeing a return to positive equity as
real estate values have increased over the last two years. Many of these homes will be coming to the
market in the near future. The choices buyers have will continue to increase.
3. The Process Will Be QuickerBanks are requiring more and more paperwork before approving a mortgage. As the market heats up,
banks will be inundated with loan inquiries causing closing timelines to lengthen. Selling now will make
the process quicker & simpler.
4. There Will Never Be a Better Time to Move-UpIf you are moving up to a larger, more expensive home, consider doing it now. Prices are projected to
appreciate by over 19.3% from now to 2019. If you are moving to a higher priced home, it will wind-up
costing you more in raw dollars (both in down payment and mortgage payment) if you wait. You can also
lock-in your 30 year housing expense with an interest rate near 4% right now. Rates are projected to
increase by about three quarters of a percent by the end of 2015.
5. It’s Time to Move On with Your Life Goals!Look at the reason you decided to sell in the first place and determine whether it is worth the RISK of
waiting as prices and rates are predicted to increase.
Lisa Humenik, RE/MAX Crossroads * (440)476-4959* AmazingNortheastOhioHomes.com
WHAT IS YOUR HOME WORTH NOW?
Find out instantly at:
NortheastOhioHomeValuation.com
You’ll get an instant estimate of your home’s value based on MLS sales. In addition, your report will include a list of neighborhood sales and
current active homes on the market.
Home values have been rising in many (but not all) Northeast Ohio suburbs, leaving some homeowners unsure of the current market value of their home and those in their neighborhood. Below is a new Quick Home Valuation Tool that cross-references your home to comparable sales in your neighborhood to estimate a price your home would sell for if it were to go on the MLS today. This information is used to give you a fair estimate of market value.
Lisa Humenik, RE/MAX Crossroads * (440)476-4959* AmazingNortheastOhioHomes.com

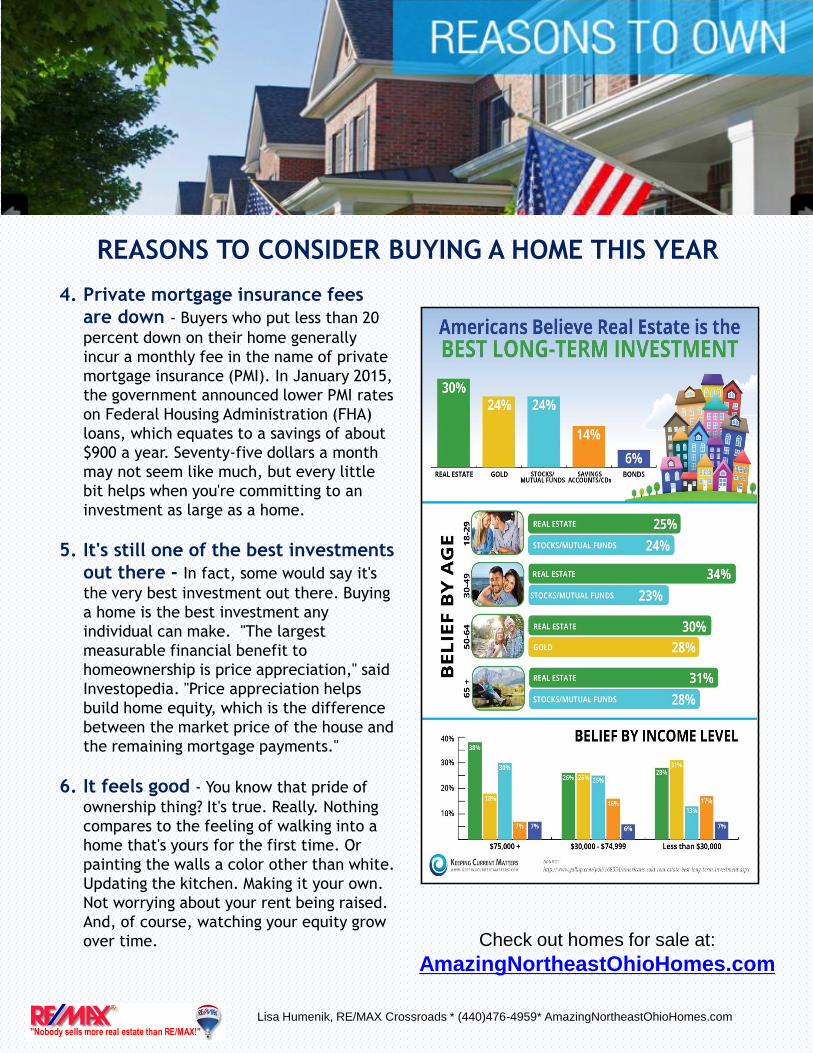
REASONS TO CONSIDER BUYING A HOME THIS YEAR
1. Interest rates are low - Even a small change in interest rates has a significant effect on
what you'll pay each month and over the life of a 30-year mortgage. Now that the housing market
has stabilized, more and more homeowners are considering moving up to the home they have
always dreamed of. Prices are still below those of a few years ago and interest rates are still near
4%. Current renters (see below) and moveup sellers alike sellers should realize that waiting to
make the move while mortgage rates are increasing probably doesn’t make sense. As rates
increase, the price of the house you can buy will decrease. Here is a chart detailing this point:
2. Qualifications are easier - During the real estate downturn of the mid-
2000s, banks and lenders tightened the reins, and often only the most qualified
applicants could get approved. Post-recession, qualifications have loosened.
Buyers who can't show solid income and a minimum credit score probably won't
be offered a risky interest-only ARM today, however, those with less-than-perfect
credit and minimal funds still have options. The Federal Housing Association
(FHA) minimums are a 620 credit score and a 3.5 percent down payment.
Lisa Humenik, RE/MAX Crossroads * (440)476-4959* AmazingNortheastOhioHomes.com

REASONS TO CONSIDER BUYING A HOME THIS YEAR
3. Rents are High! - In many markets, rents are rising to unsustainable levels, reports the
National Association of Realtors (NAR). "In the past five years, a typical rent rose 15% while the
income of renters grew by only 11%.“. Today buying is 38% cheaper than renting nationwide, and
buying is cheaper than renting in all of the 100 largest metros. In the Cleveland & Akron metro
areas it is 58% cheaper to buy verses rent.
A great resource to compare what is a better choice for financially for a current renter is to visit
Trulia’s online “Rent vs. Buy” Calculator at:
http://www.trulia.com/rent_vs_buy/
Source: http://www.trulia.com/trends/category/rent-vs-buy-index/
Today buying a
home is 38%
cheaper than
renting
nationwide, and
buying is
cheaper than
renting in all of
the 100 largest
metros. In the
Cleveland &
Akron metro
areas it is 58%
cheaper to buy
verses rent.
Lisa Humenik, RE/MAX Crossroads * (440)476-4959* AmazingNortheastOhioHomes.com
REASONS TO CONSIDER BUYING A HOME THIS YEAR
4. Private mortgage insurance fees
are down - Buyers who put less than 20
percent down on their home generally
incur a monthly fee in the name of private
mortgage insurance (PMI). In January 2015,
the government announced lower PMI rates
on Federal Housing Administration (FHA)
loans, which equates to a savings of about
$900 a year. Seventy-five dollars a month
may not seem like much, but every little
bit helps when you're committing to an
investment as large as a home.
5. It's still one of the best investments
out there - In fact, some would say it's
the very best investment out there. Buying
a home is the best investment any
individual can make. "The largest
measurable financial benefit to
homeownership is price appreciation," said
Investopedia. "Price appreciation helps
build home equity, which is the difference
between the market price of the house and
the remaining mortgage payments."
6. It feels good - You know that pride of
ownership thing? It's true. Really. Nothing
compares to the feeling of walking into a
home that's yours for the first time. Or
painting the walls a color other than white.
Updating the kitchen. Making it your own.
Not worrying about your rent being raised.
And, of course, watching your equity grow
over time.
Lisa Humenik, RE/MAX Crossroads * (440)476-4959* AmazingNortheastOhioHomes.com
Check out homes for sale at:
AmazingNortheastOhioHomes.com

THINKING OF SELLING?
HERE’S HOW TO INCREASE YOUR HOME SALES PRICE
Lisa Humenik, RE/MAX Crossroads * (440)476-4959* AmazingNortheastOhioHomes.com
Just by making some minor changes you can drastically improve the selling price of your home.
According to industry data and research from Consumer Reports, home sellers may be able to boost
the value of their home by an additional 12 percent with just a few smart pre-listing repairs and
improvements. The selling price impact is according to a new survey of 300 residential real estate
professionals by the Consumer Reports National Research Center. This information is valuable when
selling your home if you want to put a few extra dollars in your pocket. On a median, single-family
home priced at $205,000, that could be a potential gain of $24,600. On a more expensive home,
the profits will go many times higher.
This month is the start of the hot home selling season, so here is a summary of the highest return
improvements based on the data from the top industry experts and my experience working with
home sellers:
1. Clean up the Clutter – Cost range: $0
(DIY) to $2,500 (pro) – Potential return of 3 to
5%. The best advice here is, Start Packing!
Declutter and depersonalize. One of the best
ways to stage your home for someone else to
imagine living there is to get rid of your
personal stuff. Declutter books, pictures,
knickknacks, and anything else that is
exclusively you. Start removing excess
furniture and items from the walls and
furniture. Put away the extra decorations and
family pictures. Kitchen counters should only
have a few items out for all showings. Know
the “Rule of Three” – Knick knacks- such as
candles, books, lamps, etc – tend to look the
best when placed in a group of three.

HOW TO INCREASE YOUR HOME SALES PRICE
Lisa Humenik, RE/MAX Crossroads * (440)476-4959* AmazingNortheastOhioHomes.com
2. Focus on the Kitchen! - Cost range: $300 to $5,000 –
Potential Return 3 to 7%. Take it from the pros, the kitchen,
more than any other room, sells the home. Over 53 percent of
Realtors will tell you that the kitchen is among the most
important rooms of the home to have looking great before
selling and showing your home. If necessary, make upgrades to
the kitchen. This will depend largely on your budget and the
age and style of the home. New hardware can make a huge
difference for a reasonably small cost. Even small kitchen
improvements will go a long way when selling our home. Limit
counter top items to three – remove extra small appliances (i.e.
toasters, blenders, cookbooks, etc..). Consider removing extra
furnishings – free standing islands, kitchen trolleys and dining
hutches can close in a space. If you cannot remove these
pieces, ruthlessly edit the items displayed on or in them.
3. Create a Beautiful Bathroom Retreat – Cost
range: $300-1,000 – Potential return 2 to 3%. The 2nd most
important rooms for selling your home for the best price is
the bathrooms. First and foremost, make sure everything
is sparkling clean! Remove personal products (tuck away):
Get rid of your ‘stuff’. When selling, clear every surface
of all your day to day care products. Personal items
distracts buyers. Limit counter top decor to a hand towel
and pretty soap dispenser. Make it sparkle: Scrub the tiles
and grout, dust the lights, shine fixtures, and clean
everything. Second, spend a few dollars to get fresh
towels, rugs, and decorations that accent the bathroom
color scheme. New towel racks and shower curtains
should also be purchased if needed. Have your bathroom
look and smell like a spa retreat that any home buyer
would love to enjoy.

HOW TO INCREASE YOUR HOME SALES PRICE
Lisa Humenik, RE/MAX Crossroads * (440)476-4959* AmazingNortheastOhioHomes.com
4. Paint – Paint rooms (where needed) – Cost
range: $100 (DIY) to $1,000 (or more) by a Pro –
return 1 to 3% (or more). From my experience,
I would call paint “Money in a Can”! For very
minimal investment, you a huge return in
boosting your selling price and speed to an
offer. Paint walls in neutral tones. Real estate
experts will tell you to use certain paint colors
to inspire buyers to put in an offer, and often
suggest that sellers repaint their home in these
hues to create a blank canvas for optimal
staging. Four “go-to” Benjamin Moore colors
that work well include: Shaker Beige, Jackson
Tan, Linen White, and Mellow Yellow. (Most
paint stores can do color matches if you don’t
have a Benjamin Moore store near you.)
5. Exterior Fixes & Curb Appeal –Cost range: $150 to $7,500 – Potential
return: 2 to 5%. Now that spring has
sprung, it is a great time to get outside
and spruce up the yard. Put some mulch in
the front and clean up the winter yard
debris. If your home needs a power wash
or some paint touch-ups, now is the time.
As the weather gets warmer, put out some
flower pots and make the entry to your
home look welcoming. Many people
thinking of touring your home will do a
quick drive-by first, often deciding on the
spot if it is even worth a look inside.

HOW TO INCREASE YOUR HOME SALES PRICE
Lisa Humenik, RE/MAX Crossroads * (440)476-4959* AmazingNortheastOhioHomes.com
6. Make your Home “Sparkle” – Cost
range: $0-3,000 – Potential return – “Priceless”.
Clean everything and make it shine! Now’s the
time for a major cleaning from scrubbing floors,
cleaning the carpeting, closets, and more. Add
some aromatherapy to make your home look
and smell fabulous!
Spending a little extra time and a few
extra dollars is a very worthwhile endeavor
to get the best price for your home. Your
home will never look better than the day
your sell it! These extra efforts combined
with a professional marketing strategy
designed to bring in the most qualified
buyers for your home will make your home
selling process more enjoyable and
profitable than you thought it might be.

According to data from the National Association of Realtors, 89 percent of buyers use
online tools in their home searches. Rather than waiting for agents to send them listings,
they go online and tell the agents which homes they’d like to see. Here are the top
factors in a successful home online marketing strategy:
1. Professional Photography – “A Picture is Worth A Thousand Words”. Your first
home showing is online, so your home has to win the beauty contest. Great
photographs are probably the single most important piece of any online listing.
Wide-angle Lense Photography of your home is important to make the right first
impression.. It is imperative that your home shows better than others!
TOP HOME SELLING STRATEGIES NEEDED IN 2015
StandardWide Angle
Lisa Humenik, RE/MAX Crossroads * (440)476-4959* AmazingNortheastOhioHomes.com

2. Social Media Marketing - To expand the reach of your home marketing, your
agent should take to social media sites like Facebook, Twitter, LinkedIn, and
Instagram. Paid social media promotion is a important element of a successful
marketing plan. Facebook is approaching Google as having the highest internet
traffic.
Sample promotions include:
- Facebook Fan Page and Realtor Group promotion
Facebook “Promoted Posts” of your home’s listing and Video to targeted home
buyers
- “Just Listed” Anouncement on agent’s Blog, Fan Page, and LinkedIn
- Posts to community SunNews webpages
- Twitter tweet of new listing
- Instagram photos shared on the web
Social proof and sharing by local homeowners and buyers creates a “BUZZ” around
your new listing and home video and can be a magnet to potential buyers.
TOP HOME SELLING STRATEGIES NEEDED IN 2015
Lisa Humenik, RE/MAX Crossroads * (440)476-4959* AmazingNortheastOhioHomes.com

TOP HOME SELLING STRATEGIES NEEDED IN 2015
3. Online Marketing – Vast online presence (especially as a promoted listing)
on the top sites. Most buyers use Zillow, Trulia, Realtor.com, Remax.com, or other
major portals to find the homes they want to see.
Sponsored promotion of your home and SEO on Google make sure more home
buyers see your home is for sale.
.
Lisa Humenik, RE/MAX Crossroads * (440)476-4959* AmazingNortheastOhioHomes.com

4. Video Marketing - A video of your home that is taken as a buyer would see your
home when walking thru is the latest tool in real estate home marketing. Buyers are
attracted to video and are much more likely to view the video as opposed to scroll
through screens of pictures of your home. Also, when a buyer calls to see your
home after seeing the video, they are already “pre-sold” and are more likely to be a
qualified buyer for your home. The best videos include narration, music and great
photography highlighting your home’s best features. Video really allows
homebuyers to create that emotional connection.
TOP HOME SELLING STRATEGIES NEEDED IN 2015
Lisa Humenik, RE/MAX Crossroads * (440)476-4959* AmazingNortheastOhioHomes.com

TOP HOME SELLING STRATEGIES NEEDED IN 2015
5. Mobile/Smartphone Presence - Younger buyers especially want to look
at listings on their smartphones, and apps that make it easier for them to
do. All the major portals have apps, as do some real estate brokerages.
Your home’s visual presentation on mobile is more important than ever.
Sellers need to make sure their listing looks great on a smartphone. Photos
should be taken with a high-resolution camera, because that’s what looks
best on mobile. Zillow reported that in January, nearly 600 million homes
were viewed on Zillow’s mobile app. That’s 223 homes per second.
6. Your Home’s Own Unique Website – A dedicated website for our
home will allow your video, pictures, description, and tons of other info to
be showcased in one place. Your home should have its own web address
(URL) which buyers can use to search for your home directly on the
internet, i.e. http://123YourAddress.com. Check out a example at
2883ForestLake.com.
These advanced marketing and home presentation strategies will bring
more buyers in the door and, as a result, a higher sales price. It is
imperative that these are incorporated into a professional home marketing
plan.
Lisa Humenik, RE/MAX Crossroads * (440)476-4959* AmazingNortheastOhioHomes.com

SMART HOME SELLER PLAN
If you are considering selling your home in 2015, check out my Smart Home Seller Plan. The Smart Home Seller Plan is designed to offer clients the most state-of-the art marketing of their home to bring in the highest and best market offers in faster than average market time. In addition, light staging and professional photography will give the professional finishes needed to get top dollar.
The Northeast Ohio real estate market has improved quite a bit in the last year, but all real estate is local right down to your city and neighborhood. A professional pricing assessment of your home, light staging or improvements (if needed), and a highly targeted marketing plan will deliver the results you did not think possible. Plus, a 100% Happiness Guarantee.
Check it out at:
SmartHomeSellerPlan.com
Lisa Humenik, RE/MAX Crossroads * (440)476-4959* AmazingNortheastOhioHomes.com

Lisa Humenik, RE/MAX Crossroads * (440)476-4959* AmazingNortheastOhioHomes.com
APPENDIX
Westlake Ohio
Real Estate Market Data – to May 1, 2015

April 2015 is a Neutral market! The number of for sale listings was up 12.5% from one year earlier and up 11.3% from the previous month. The
number of sold listings increased 100% year over year and increased 75% month over month. The number of under contract listings was up
11.4% compared to the previous month and up 44.4% compared to the previous year. The Months of Inventory based on Closed Sales is 3.9,
down 43.8% from the previous year.
The Average Sold Price per Square Footage was down 5.5% compared to the previous month and down 11.9% compared to last year. The
Median Sold Price decreased by 8.9% from last month. The Average Sold Price also decreased by 13% from last month. Based on the 6 month
trend, the Average Sold Price trend is "Neutral" and the Median Sold Price trend is "Neutral".
The Average Days on Market showed a neutral trend, an increase of 33.3% compared to the previous year. The ratio of Sold Price vs. Original
List Price is 95%, an increase of 1.1% compared to the previous year.
Lisa HumenikCell Phone: (440)476-4959
Email: [email protected]
http://lisahumenik.com
2007002829
(202) WestlakePublished: May 2015*
Property Types: Single Family Homes - All Properties - All Properties
Price Range: $0 - No Limit SQFT Range: 0 - No Limit
Bedrooms: 0 - No Limit Full Baths: 0 - No Limit
Half Baths: 0 - No Limit Year Built: 0 - No Limit
It is a Neutral Market
Property Sales (Sold)April property sales were 28, up 100% from 14 in April of 2014 and 75%higher than the 16 sales last month.
Current Inventory (For Sale)Versus last year, the total number of homes available this month ishigher by 12 units of 12.5%. This year's bigger inventory means thatbuyers who waited to buy may have bigger selection to choose from.The number of current inventory is up 11.3% compared to the previousmonth.
Property Under Contract (Pended)There was an increase of 11.4% in the pended properties in April, with39 properties versus 35 last month. This month's pended property saleswere 44.4% higher than at this time last year.
All reports are published May 2015, based on data available at the end of April 2015. All reports presented are based on data supplied by NEOHREX. NEOHREX does not guarantee or is not in anyway responsible for its accuracy. Data maintained byNEOHREX may not reflect all real estate activities in the market. Information deemed reliable but not guaranteed.
Lisa HumenikCell Phone: (440)476-4959
Email: [email protected]
http://lisahumenik.com
2007002829
(202) WestlakePublished: May 2015*
Property Types: Single Family Homes - All Properties - All Properties
Price Range: $0 - No Limit SQFT Range: 0 - No Limit
Bedrooms: 0 - No Limit Full Baths: 0 - No Limit
Half Baths: 0 - No Limit Year Built: 0 - No Limit
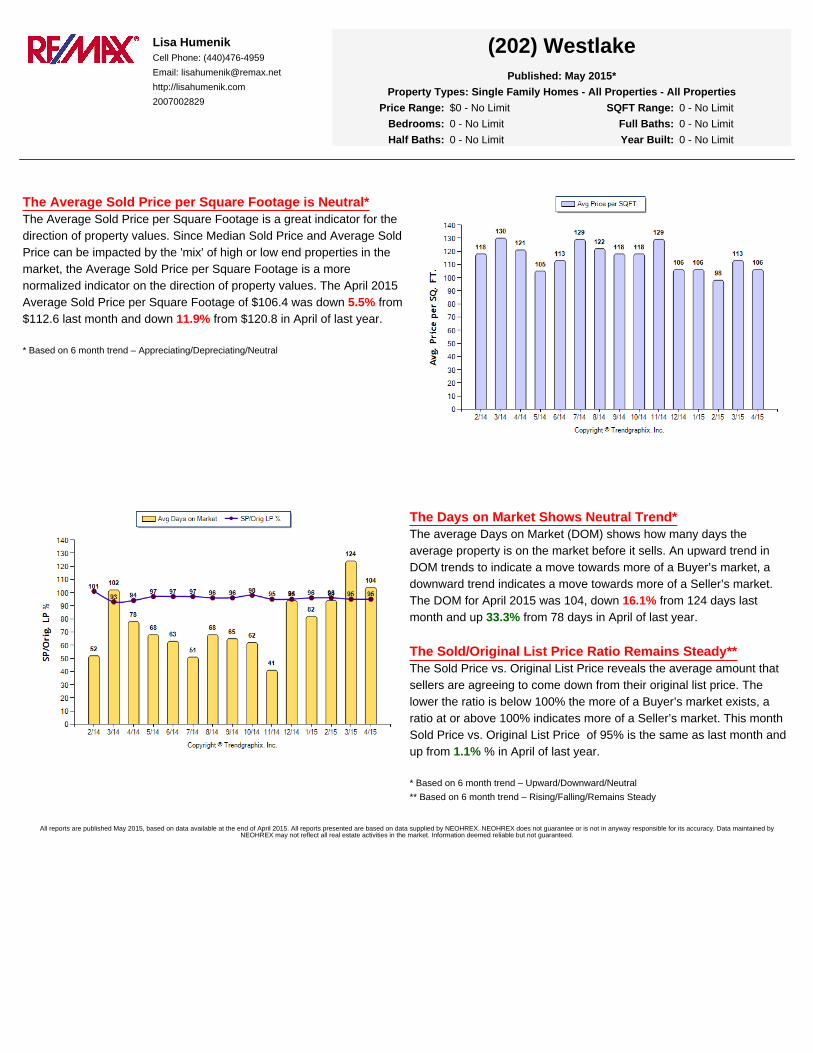
The Average Sold Price per Square Footage is Neutral*The Average Sold Price per Square Footage is a great indicator for thedirection of property values. Since Median Sold Price and Average SoldPrice can be impacted by the 'mix' of high or low end properties in themarket, the Average Sold Price per Square Footage is a morenormalized indicator on the direction of property values. The April 2015Average Sold Price per Square Footage of $106.4 was down 5.5% from$112.6 last month and down 11.9% from $120.8 in April of last year.
* Based on 6 month trend – Appreciating/Depreciating/Neutral
The Days on Market Shows Neutral Trend*The average Days on Market (DOM) shows how many days theaverage property is on the market before it sells. An upward trend inDOM trends to indicate a move towards more of a Buyer’s market, adownward trend indicates a move towards more of a Seller’s market.The DOM for April 2015 was 104, down 16.1% from 124 days lastmonth and up 33.3% from 78 days in April of last year.
The Sold/Original List Price Ratio Remains Steady**The Sold Price vs. Original List Price reveals the average amount thatsellers are agreeing to come down from their original list price. Thelower the ratio is below 100% the more of a Buyer’s market exists, aratio at or above 100% indicates more of a Seller’s market. This monthSold Price vs. Original List Price of 95% is the same as last month andup from 1.1% % in April of last year.
* Based on 6 month trend – Upward/Downward/Neutral
** Based on 6 month trend – Rising/Falling/Remains Steady
All reports are published May 2015, based on data available at the end of April 2015. All reports presented are based on data supplied by NEOHREX. NEOHREX does not guarantee or is not in anyway responsible for its accuracy. Data maintained byNEOHREX may not reflect all real estate activities in the market. Information deemed reliable but not guaranteed.

Lisa HumenikCell Phone: (440)476-4959
Email: [email protected]
http://lisahumenik.com
2007002829
(202) WestlakePublished: May 2015*
Property Types: Single Family Homes - All Properties - All Properties
Price Range: $0 - No Limit SQFT Range: 0 - No Limit
Bedrooms: 0 - No Limit Full Baths: 0 - No Limit
Half Baths: 0 - No Limit Year Built: 0 - No Limit
The Average For Sale Price is Neutral*The Average For Sale Price in April was $499,000, up 2.9% from$485,000 in April of 2014 and down 1.2% from $505,000 last month.
The Average Sold Price is Neutral*The Average Sold Price in April was $241,000, down 30.1% from$345,000 in April of 2014 and down 13% from $277,000 last month.
The Median Sold Price is Neutral*The Median Sold Price in April was $225,000, down 21.1% from$285,000 in April of 2014 and down 8.9% from $247,000 last month.
* Based on 6 month trend – Appreciating/Depreciating/Neutral
It is a Neutral Market*
A comparatively lower Months of Inventory is more beneficial for sellerswhile a higher months of inventory is better for buyers.
*Buyer’s market: more than 6 months of inventory
Seller’s market: less than 3 months of inventory
Neutral market: 3 – 6 months of inventory
Months of Inventory based on Closed SalesThe April 2015 Months of Inventory based on Closed Sales of 3.9 wasdecreased by 43.8% compared to last year and down 36.3% comparedto last month. April 2015 is Neutral market.
Months of Inventory based on Pended SalesThe April 2015 Months of Inventory based on Pended Sales of 2.8 wasdecreased by 22.5% compared to last year and the same compared tolast month. April 2015 is Seller's market.
All reports are published May 2015, based on data available at the end of April 2015. All reports presented are based on data supplied by NEOHREX. NEOHREX does not guarantee or is not in anyway responsible for its accuracy. Data maintained byNEOHREX may not reflect all real estate activities in the market. Information deemed reliable but not guaranteed.

Lisa HumenikCell Phone: (440)476-4959
Email: [email protected]
http://lisahumenik.com
2007002829
(202) WestlakePublished: May 2015*
Property Types: Single Family Homes - All Properties - All Properties
Price Range: $0 - No Limit SQFT Range: 0 - No Limit
Bedrooms: 0 - No Limit Full Baths: 0 - No Limit
Half Baths: 0 - No Limit Year Built: 0 - No Limit
It is a Neutral Market*
Absorption Rate measures the inverse of Months of Inventory andrepresents how much of the current active listings (as a percentage) arebeing absorbed each month.
*Buyer’s market: 16.67% and below
Seller’s market: 33.33% and above
Neutral market: 16.67% - 33.33%
Absorption Rate based on Closed SalesThe April 2015 Absorption Rate based on Closed Sales of 25.9 wasincreased by 77.5% compared to last year and up 57% compared tolast month.
Absorption Rate based on Pended SalesThe April 2015 Absorption Rate based on Pended Sales of 36.1 wasincreased by 28.4% compared to last year and the same compared tolast month.
All reports are published May 2015, based on data available at the end of April 2015. All reports presented are based on data supplied by NEOHREX. NEOHREX does not guarantee or is not in anyway responsible for its accuracy. Data maintained byNEOHREX may not reflect all real estate activities in the market. Information deemed reliable but not guaranteed.

IF YOU ARE INTERESTED IN SELLING, CONTACT ME
TO DISCUSS YOUR HOME
I’m sure you have questions and concerns…
I would love to talk with you more about what you read here, and help you on the path to
selling your house. My contact information is below. I look forward to hearing from you…
Lisa HumenikRE/MAX Crossroads
NortheastOhioRealEstateSource.com
(440) 476-4959
facebook.com/AmazingNortheastOhioHomes