Embed Size (px)
Citation preview

Randall Gross / Development Economics
USA: 2311 Connecticut Ave Ste 206 Washington DC 20008. Tel 202-332-7430. Fax 332-1853. [email protected] AFRICA: African Development Economic Consultants (ADEC). 27-11-728-1965. Fax 728-8371. [email protected]
1
Westerville, Ohio
UPTOWN MARKET ANALYSIS & Business Development Strategy
Final Report December 30, 2011 City of Westerville Randall Gross / Development Economics
Randall Gross / Development Economics
USA: 2311 Connecticut Ave Ste 206 Washington DC 20008. Tel 202-332-7430. Fax 332-1853. [email protected] AFRICA: African Development Economic Consultants (ADEC). 27-11-728-1965. Fax 728-8371. [email protected]
2
INTRODUCTION
Westerville’s Uptown district is one of a handful of traditional “Main Street” shopping destinations in the Columbus region that continue to attract a loyal clientele to its specialty shops, restaurants, and services. This business district is no doubt one of the reasons that Westerville continues to score highly as one of America’s best places to live. However, constantly-changing shopping patterns, demographic shifts, and emerging competitors can ultimately threaten the vitality of this Westerville hub. Uptown is the “face” of Westerville to prospective residents and businesses. So, maintaining the competitiveness of the Uptown district is critical to the community’s continued economic and fiscal health.
Uptown offers a wonderful mix of specialty stores providing antiques, apparel, home furnishings, books, gifts, art, and other goods in a welcoming environment. Uptown already serves as a destination, with a marketing image associated with the district’s heritage resources. Well-designed, high-quality urban design and streetscaping improvements have helped solidify the district’s historic image. The Uptown district has seen very little vacancy or turnover compared to other main street retail corridors in the region. The Westerville Uptown Merchants Association, along with the Westerville Visitors & Convention Bureau and other organizations, help to promote the city’s business district.
Marketing efforts aimed at the tourism sector and destination shoppers
can help Uptown replace some of the sales lost through leakage to competition from Easton, Polaris, and other newer suburban shopping hubs. There is the need to refine and enhance these marketing strategies to ensure that Uptown remains competitive in this ever-changing and increasingly hostile retail environment. There is also the need to ensure that Uptown’s retail mix remains relevant to the local community and that the needs of Westerville’s businesses and residents are being met. Finally, there is the need to ensure that merchants and residents take an active voice and participate in the marketing and management of the district.
In response to these needs, the City of Westerville contracted Randall
Gross / Development Economics (RGDE) to conduct market research and analysis that would help forecast and identify Uptown’s business potential. Based on this market analysis, RGDE prepared strategies to enhance the functionality, marketing, and development of the district into the future.
Section 1 of this report provides a summary of existing conditions,
including an analysis of Uptown’s location and its attributes as a business district. Section 1 also includes an inventory and description of the current business mix and input from the businesses themselves on existing business conditions. Market research was conducted through surveys of Westerville-area households

Randall Gross / Development Economics
USA: 2311 Connecticut Ave Ste 206 Washington DC 20008. Tel 202-332-7430. Fax 332-1853. [email protected] AFRICA: African Development Economic Consultants (ADEC). 27-11-728-1965. Fax 728-8371. [email protected]
3
as well as of consumers on the street in Uptown. The findings from this survey research are summarized in Section 2. The results of a retail demand analysis are presented in Section 3, describing the overall retail expenditure potentials forecasted for the Uptown Trade Area. In Section 4, Uptown’s share of Trade Area sales potential, translated into demand in square feet of retail space by type of business, is determined based on its positioning within the competitive framework. A recommended “mix” of retail uses is provided based on the market findings. Finally, Section 5 provides strategic recommendations for marketing, management, and development for the Uptown district, based on the market research and findings from the market analysis.

Randall Gross / Development Economics
USA: 2311 Connecticut Ave Ste 206 Washington DC 20008. Tel 202-332-7430. Fax 332-1853. [email protected] AFRICA: African Development Economic Consultants (ADEC). 27-11-728-1965. Fax 728-8371. [email protected]
4
Section 1. EXISTING CONDITIONS
This section provides an overview of existing conditions impacting on the marketability of Uptown as a business district. Location, access, and physical conditions are examined within the local and regional context. An inventory of current uses is described, in terms of the existing business mix within the district and in the surrounding areas. Existing business conditions are also analyzed, based on information collected through dozens of in-person interviews with individual businesses in the district. Finally, the municipal policy framework is described with respect to how certain design and planning considerations impact on business conditions within the district.
Location Uptown is located in Westerville, on the north-eastern suburban edge of Columbus. For the purposes of this analysis, the boundaries of Uptown are loosely defined as the commercial area stretching along State Street (Ohio Route 3), from Lincoln Street south past Walnut Street. The study area encompasses properties extending at least one block on either side of State Street, or two blocks on the side streets where there is more commercial building use. There are key intersections at Main Street and College Avenue. The study area coincides roughly with the Uptown district boundaries defined by the City.
Access and Exposure Access to Uptown is provided most directly by Ohio State Route 3, which forms the backbone of the district. Route 3 (State Street) links the district south (Westerville Road) to downtown Columbus and north to ex-urban towns including Galena, Sunbury, Centerburg, and Mt. Vernon. Eventually, Route 3 links Westerville north to Wooster and Cleveland. Main Street intersects Route 3 in the heart of Uptown and facilitates access west to US23. College Avenue and Walnut Street provide access east to Sunbury Road. However, most metro-wide and inter-city travel is accessed via Interstate 270 (Columbus Loop – Jack Nicklaus Freeway), which links Uptown Westerville to other major highways throughout the region. I-270 provides direct access to key Columbus suburbs and target markets including Dublin, Hilliard, Gahanna, Worthington, and others. I-270 also provides access to OH 315, US33, I-70, I-670, US23, OH 16, US 40, US 62, and I-71, among others.
Interstate 71 is also accessible from Uptown via Polaris Parkway (OH 750), an important east-west connector leading from Westerville into the massive Polaris shopping and business hub in southern Delaware County. Polaris Parkway, which runs parallel to Main Street, encourages leakage from Uptown by allowing easier access from Westerville’s residential areas over to Polaris and shopping areas to the west. On the other hand, Polaris Parkway is also an

Randall Gross / Development Economics
USA: 2311 Connecticut Ave Ste 206 Washington DC 20008. Tel 202-332-7430. Fax 332-1853. [email protected] AFRICA: African Development Economic Consultants (ADEC). 27-11-728-1965. Fax 728-8371. [email protected]
5
opportunity for attracting traffic east to Uptown from growing Delaware County suburbs.
Cleveland Avenue has a similar impact on Uptown, running parallel to
Route 3, providing alternative access to I-270 and (via Schrock Road) to/from other suburban areas like Worthington. Schrock Road is an important commercial corridor that intersects Route 3 just south of the study area. While the character of Schrock Road is very different, its commercial uses do impact on the traffic patterns, image, and competitiveness of Uptown for certain uses.
Traffic Flow I-270 is the primary regional commuter route through the Westerville area, carrying 138,300 vehicles per day (average daily traffic – ADT, west of Route 3) in 2006. About 54,300 vehicles per day travel along Route 3 (State Street) just north of I-270 (at Huber Village Boulevard). However, traffic volumes fall somewhat as one travels further north along State Street into Uptown. For example, there were ADTs (collected from 1990 through 2004) of 38,600 on State Street south of Schrock Road, falling to 31,700 north of Schrock Road, then 23,350 south of Walnut and 21,100 north of Walnut. ADTs fall to a low of about 15,100 north of College, but increase slightly north of Main Street to 16,200. Further north of Polaris Parkway, Route 3 has ADTs of more than 28,000, indicating that significant south-bound traffic is diverted west towards Polaris rather than directly south into Uptown. In general, State Street (Route 3) collects traffic from various neighborhoods in and around Westerville as it travels south towards the I-270 Loop.
Physical Conditions Uptown is oriented as a traditional “Main Street,” with quaint historic buildings lining several “walkable” blocks of State Street. The area is clean and well-manicured, and buildings are generally in good to excellent condition, given their age. The building stock includes vintage Victoriana, structures built with high-craft quality in the 1880s through early 20th Century. But there are also a number of buildings constructed from the 1920s through 1960s, which adds diversity and makes for a more interesting streetscape.

Randall Gross / Development Economics
USA: 2311 Connecticut Ave Ste 206 Washington DC 20008. Tel 202-332-7430. Fax 332-1853. [email protected] AFRICA: African Development Economic Consultants (ADEC). 27-11-728-1965. Fax 728-8371. [email protected]
6
Urban Design The historic buildings are complemented by an attractive urban streetscape, with sidewalks and pedestrian amenities such as benches, bins, and shade trees. There are vintage light posts and attractive signage throughout the Uptown district. There are wide sidewalks along State Street, and attractive pavers at intersections and along certain side streets. Most buildings are one to three stories, making for a human scale in keeping with the late 19th and early 20th century heritage of the district. In many ways, Uptown exhibits “textbook” examples of good, small-town planning and urban design, with pedestrian-friendly streets, conservation of historic resources, attractive facades, (planned) information kiosks, and restrained signage.
If anything, a few elements may be a bit too restrained, where a marketing objective is to create some destination excitement, especially for younger shoppers. Some elements, like the specialty “Uptown” signage on rings at the intersection of State and Main, can be difficult to read from more than a few feet away. If they are meant as gateway elements, then the message is lost on most travelers. Similarly, a few businesses have such under-stated signage that it can be challenging to identify the name of the business on the exterior of the building. But overall, Uptown has the scale and design elements appropriate for an historic “small town” commercial district. A new City-instituted banner program will also help add some vibrant color to the streets, with banners changing by season.

Randall Gross / Development Economics
USA: 2311 Connecticut Ave Ste 206 Washington DC 20008. Tel 202-332-7430. Fax 332-1853. [email protected] AFRICA: African Development Economic Consultants (ADEC). 27-11-728-1965. Fax 728-8371. [email protected]
7
Parking
Free, on-street parking is available throughout the district. During work days, there appears to be sufficient parking available in walking distance from storefronts. Parking during the early evening rush hour, however, can be more challenging as more people are looking for spaces near restaurants. Higher volumes of traffic at those hours also make pull-in/out more difficult for on-street parking. Uptown also boasts at least 11 free parking lots, mainly situated behind the commercial strip, to the east or west of State Street. These lots include two on the north side of Home Street, three between Home and Main Street, three between Main and College, two between College and Park, and one lot south of Park. While these lots are generally not visible from State Street, there are several small directional signs identifying the location of lots. That being said, the availability of parking is not always apparent from State Street. The convergence of rush-hour congestion, filled on-street spaces, and limited guidance for off-street parking can be off-putting for some consumers. Despite the overall “walkability” of Uptown, many shoppers still drive in order to get there and they automatically compare the parking situation in Uptown with that of the suburban mall alternatives.
Existing Use
Uptown is a business district that serves as a hub for retail and personal
services, but also accommodates a mix of office, civic, and residential uses in its “Uptown Mixed-use” zoning designation. To a large extent, Uptown functions as the quintessential town center of a small town. The district attracts shoppers as well as those attending church, visiting City Hall, having their hair cut, or working at a bank. Uptown is the working “downtown” for Westerville.
Overall, there are nearly 80 retail establishments located in ground-floor commercial space within the study area. These businesses have a total of about 150,000 square feet of space, roughly equivalent to a large community shopping center. The district’s retail is in fact oriented to comparison shopping, with nearly 40% of retail space devoted to shoppers goods stores (such as clothing, furniture, or other goods for which people comparison shop). There are about 30 of such shoppers goods stores in the district. Nearly 30% of the retail space is devoted to eating and drinking, in 14 restaurants that include both full-service and limited-service establishments. There are no bars or pubs in Uptown, although several restaurants now serve liquor by the drink (which was only allowed fairly recently).

Randall Gross / Development Economics
USA: 2311 Connecticut Ave Ste 206 Washington DC 20008. Tel 202-332-7430. Fax 332-1853. [email protected] AFRICA: African Development Economic Consultants (ADEC). 27-11-728-1965. Fax 728-8371. [email protected]
8
Relatively speaking, convenience goods play a less significant role in the
district, accounting for about 15% of the retail space. Convenience goods stores include groceries, pharmacies, gas stations, and others where people make “spur-of-the-moment” purchases for necessities. Slightly more space, 16%, is in personal services such as hair and tanning salons or shoe repair shops. There are no dedicated entertainment venues in Uptown, although there are
restaurants that offer live music on an occasional basis.
A detailed inventory of existing retail use is outlined in table on the following page. As shown here, Uptown has nine convenience stores, but no grocery or convenience food stores. Existing convenience includes two specialty food stores (a bakery and a candy shop), two
pharmacies (including Uptown Pharmacy, which has been operating as a pharmacy for over 100 years), one gas station, and several “miscellaneous” convenience businesses including florists, a relatively new wine shop, and a destination tobacconist (Uptown Cigar). There are also 20 personal service establishments, including hair and nail salons, shoe repair, and others.
Shoppers Goods stores include a large number of furniture and home
furnishings stores. All of these are with the “specialty” category, with four art or craft galleries, five antique stores, and two hand-made (Amish) furniture stores (both owned by Amish Originals). Similarly, the apparel stores also fall into the “specialty” category, with two bridal shops and one consignment store. There are also three jewelry stores, a specialty garden supply shop, two specialty gift and novelty stores (including Captivating Canines, specializing in dog-themed gifts), two bookstores (including Foul Play, specializing in mystery books), two musical instrument stores, one sewing store, four sporting goods stores (specializing in bicycles, running gear, guns, and skateboards), and two other miscellaneous specialty stores (Barstow’s – awards, and Grandfather Clock Company).
As noted before, there are 14 restaurants, including 8 limited-service and
6 full-service establishments. The limited service businesses include coffee and tea shops, ice cream shops, and several fast-food restaurants including an all-American Dairy Queen. Full-service restaurants include the very popular Old

Randall Gross / Development Economics
USA: 2311 Connecticut Ave Ste 206 Washington DC 20008. Tel 202-332-7430. Fax 332-1853. [email protected] AFRICA: African Development Economic Consultants (ADEC). 27-11-728-1965. Fax 728-8371. [email protected]
9
Bag of Nails Pub (part of a local chain), Pasquale’s Pizza, Jimmy V’s Grill, Westerville Grill, Thai Grill, and the newest, Clucker’s House of Wings. There are no bars or entertainment venues, as noted previously. This limits nighttime activity in the area. A complete inventory by square footage is shown below.
Table 1. COMMERCIAL SPACE INVENTORY, UPTOWN DISTRICT, WESTERVILLE, 2010
Category Number (Percent) Sq. Ft. (Percent)
Convenience Grocery - 0% - 0% Convenience - 0% - 0% Specialty Food 2 3% 2,505 2% Health/Personal Care 2 3% 11,602 8% Gas/Convenience 1 1% 1,936 1% Florist/Lqr/Tob/Misc 4 5% 6,056 4%
Sub-Total 9 12% 22,099 15%
Shoppers Goods Apparel/Access 3 4% 5,052 3% Jewelry 3 4% 2,615 2% Shoes - 0% - 0% Furniture& Floors 1 1% 10,500 7% Home Furnishings 9 12% 14,299 10% Appliances - 0% - 0% Hardware/Bldg - 0% - 0% Garden Supply 1 1% 1,716 1% Gen Mdse/Dept - 0% - 0% Auto Dealers - 0% - 0% Auto Supply - 0% - 0% Electronics/Comp - 0% - 0% Books/Music 2 3% 2,784 2% Camera/Photo - 0% - 0% Gift, Novelty, Souvenir 2 3% 2,300 2% Hobby/Toy/Game - 0% - 0% Musical Instruments 2 3% 7,582 5% Luggage/Leather - 0% - 0% Office/Stationary - 0% - 0% Sewing/Piece 1 1% 1,075 1% Sporting Goods 3 4% 2,540 2% Misc 3 4% 6,144 4% Sub-Total 30 39% 56,606 38%
Dining & Entertainment Restaurants-LS 8 10% 15,563 11% Restaurants-FS 6 8% 24,388 17% Drinking Establishment - 0% - 0% Entertainment* - 0% - 0%
Sub-Total 14 18% 39,951 27%
Personal Services 20 26% 23,144 16%
TOTAL 73 95% 141,799 96% Existing Vacant 4 5.2% 5,548 3.8%
GRAND TOTAL 77 100% 147,347 100%
Sources: Franklin County Auditor, Business Owners, and Randall Gross / Development Economics.
In general, the business mix includes a high percentage of “specialty” stores within each of the categories, including convenience, shoppers goods, eating places and even personal services. The mix is weighted towards specialty merchandise that helps to generate destination appeal and to compete against

Randall Gross / Development Economics
USA: 2311 Connecticut Ave Ste 206 Washington DC 20008. Tel 202-332-7430. Fax 332-1853. [email protected] AFRICA: African Development Economic Consultants (ADEC). 27-11-728-1965. Fax 728-8371. [email protected]
10
the more standard merchandise found in suburban shopping centers and regional malls. Nearly all of the businesses are independent, locally-owned stores, which also sets Uptown apart from suburban malls and centers. Non-Retail Uses While this study focuses on the market for retail, Uptown also accommodates other uses. Church of the Messiah is an important anchor for the district and occupies a significant amount of land at the northern end of Uptown. The church has plans for expansion, which would potentially eliminate one of the parking lots at the north end of the district. First Presbyterian Church is another important civic anchor for the district. There are also about 33 commercial office uses plus two banks within Uptown, including at least two ground-floor CPA offices. There are also several municipal buildings and a visitor’s center located within the district. Most of the office space is appropriately located in upper-floor spaces, with ground-floor spaces devoted to retail. Having retail on the ground floors helps to enliven the district and make it more pedestrian friendly. Of the office uses, about 20% are in finance (including banks), insurance or real estate. Another 20% are in professional services such as lawyers or graphic designers. About 13% of the office uses are government or non-profit and only 6% in medical or health services. More than 30% are other office uses such as business services and about 13% of the number of spaces marketed for office use is vacant. Several of the vacant office spaces are located in older single-family houses that have been converted or are being leased for commercial use. Thus, such space was not purpose-built for office use. There are also about 55 residential units within the study area, including at least 25 units in upper-floor spaces or multi-family buildings. A few of the other uses in the study area include office/warehouse (e.g., Marriott Execustay), upper-floor storage space, education and training facilities (Generations Performing Arts Company, Hanby School, childcare), other service uses (automotive repair, funeral parlor), art museum, and community uses like the Westerville Public Library. Overall, the district has a diverse building use pattern, dominated by retail on the ground floors but accommodating residential and office uses on upper floors as is desirable in such districts. There are several single-family residential units along State Street that have been converted to office or commercial use, but other residential dwellings on side streets remain as housing.

Randall Gross / Development Economics
USA: 2311 Connecticut Ave Ste 206 Washington DC 20008. Tel 202-332-7430. Fax 332-1853. [email protected] AFRICA: African Development Economic Consultants (ADEC). 27-11-728-1965. Fax 728-8371. [email protected]
11
Surrounding Uses
Commercial uses extend south of the study area towards Schrock Road and beyond to I-270. Route 3 forms a commercial corridor into Columbus, although the quality of retail and commercial uses declines further into the low-income neighborhoods that surround Westerville Road in Columbus. Westerville itself, and areas to the east and west of the study area, contains attractive residential neighborhoods with a mix of vintage and more modern housing. Further north on State Street are newly-developing business and residential areas extending beyond Polaris Parkway. Parallel to State Street is Cleveland Avenue, where new recreation, civic, and business park uses are concentrated. Located within walking distance of Uptown, to the west, is Otterbein University. Otterbein University Otterbein University (formerly Otterbein College) is a four-year, liberal arts institution associated with the United Methodist Church. The university enrollment includes about 2,700 undergraduate and 400 graduate-level students. There are about 260 faculty, plus staff, employed by the university. Thus, Otterbein is an employment hub as well as an anchor educational institution, located not far from the Uptown business district. The 140-acre campus is accented by Towers Hall which is listed in the National Register of Historic Places, having been built in 1872. Otterbein is well-known for its programs in theater, art, and dance, as well as programs in equine studies and other specialty fields in the sciences. Visitor Attractions Westerville has several visitor attractions that speak to the city’s unique history of taking the moral high ground on issues of temperance and slavery. The Hanby House, home of composer and abolitionist Benjamin Hanby, served as a stop on the Underground Railroad. The Anti-Saloon League Museum and the Temperance Row Historic District celebrate Westerville’s heritage as the “Dry Capital of the World.” In the Uptown area, Otterbein University operates the Frank Museum of Art, on Vine Street.
Business Conditions Information on business conditions was collected through about 20 in-person interviews with business owners and staff, as well as through field reconnaissance to visit the businesses and through research of web sites and marketing materials. Relevant information collected through the interviews and other research is summarized below.

Randall Gross / Development Economics
USA: 2311 Connecticut Ave Ste 206 Washington DC 20008. Tel 202-332-7430. Fax 332-1853. [email protected] AFRICA: African Development Economic Consultants (ADEC). 27-11-728-1965. Fax 728-8371. [email protected]
12
Hours of Operation Business hours relate to the marketing of the district and how it competes with shopping malls and other retail nodes. Because many of the businesses are independently-owned and operated, there is quite a diversity and variation in the operating hours within Uptown. Some businesses are open regular working hours, from 9am to 5pm, Monday through Friday or Saturday. Other businesses are open later into the evening and on Sundays. In general, the restaurants and larger stores (such as Amish Originals) or regional chains are open somewhat later than the smaller, independent retail shops. Such shops are often operated by the owner with limited staffing, so it would be difficult for them to operate from early in the morning until late in the evening on a regular basis. In general, relatively few of the retail shops are open evenings past 5pm, and many are closed on Sundays. Size of Business The average size of business is about 2,000 square feet, making Uptown businesses smaller (on average) than the typical store found in a regional shopping mall or center. The retail businesses range in size from about 400 square feet to 10,500 square feet. The smaller businesses tend to be personal service establishments such as hair salons or shoe repair shops, while the larger businesses are furniture stores and restaurants. Ownership Nearly all of the retail businesses are locally-owned, with the exception of chains like Dairy Queen and Bope Sunoco which are still locally-franchised, and CVS. The local ownership is, in itself, a marketing advantage, because it cements the area’s reputation for friendly, personalized service and allows the consumer to deal directly with the owner. There are a few regional chains that have outlets in other parts of the Columbus Metro, including Old Bag of Nails, Jimmy V’s and Graeter’s Ice Cream. Still, these are strong local brands that consumers like and trust. These regional chains help anchor Uptown and compliment the local flavor of the district. Length of Time in Business Uptown retailers have been in business an average of about 18 years, based on interviews with approximately 20 retail establishments. However, several businesses have been operating in Uptown for decades. Uptown Pharmacy, for example, has operated as a pharmacy for over 100 years (in a building built in 1880) and came under current management in 1989 (which is the year included in the overall average). Newer businesses include Meza Wine, Uptown Cigar, and most recently, Clucker’s House of Wings.

Randall Gross / Development Economics
USA: 2311 Connecticut Ave Ste 206 Washington DC 20008. Tel 202-332-7430. Fax 332-1853. [email protected] AFRICA: African Development Economic Consultants (ADEC). 27-11-728-1965. Fax 728-8371. [email protected]
13
Sales Patterns Sales information was collected from the +/-20 businesses interviewed for this study. Based on this sample, it was determined that the businesses generate an average of about $206 per square foot in retail sales. Uptown sales range from about $70 per foot up to $500 per foot, depending on the type and size of store. These sales figures are slightly lower than would be expected for chain stores in a regional mall or shopping center, but they are good for smaller, independent retail districts with less exposure and lower rents. Based on this average, it is estimated that the district generates total annual sales of about $29.2 million. Based on the sample businesses, it appears that gross sales have been increasing in Uptown at an average rate of about 1.9% per year over the past five years. In many cases, retailers had seen increasing sales until the recession of 2009-10, and are now making up for the losses of that period. About 73% of the businesses have seen increasing sales on average over the past five years, 13% have seen stagnant sales (or sales are the same now as they were five years ago), and 13% have seen declining sales compared with five years ago. The annual change in sales volumes varies significantly, from a loss of 13% per year to a gain of 13% per year. In general, the newer stores are seeing a higher rate of sales growth, which is logical as the businesses build up from the small starting base.
Table 2. RETAIL BUSINESS CHARACTERISTICS,
UPTOWN WESTERVILLE, 2010
Factor Amount Note
Average Size 1,942 Square Feet
Average Sales $ 205.70 Per Square Foot
Total Sales (Estimated) $ 29,167,500 Per Year
Local/Westerville 64% of Customer Base
Students/Workers 5% of Customer Base
Commuter-Generated 8% of Customer Base
Destination 22% of Customer Base
Ave Sales Change/Yr 1.9% Per Year over 5 yrs
Ave Rent-Weighted $ 12.72 Per Square Foot
Business Renting 87.5% of Businesses
Sources: Merchants, Building Owners, and
Randall Gross / Dev. Economics.
Source of Market. Uptown businesses report that about two-thirds (64%) of their trade on average is generated by Westerville residents. About 5% is generated by students or workers within Westerville. Thus, nearly 70% of sales are generated from consumers already located within Westerville. Another 8% on average is generated by commuters traveling through Uptown from places in

Randall Gross / Development Economics
USA: 2311 Connecticut Ave Ste 206 Washington DC 20008. Tel 202-332-7430. Fax 332-1853. [email protected] AFRICA: African Development Economic Consultants (ADEC). 27-11-728-1965. Fax 728-8371. [email protected]
14
the north, such as Galena, Powell, and Sunbury. The remaining 22% is generated by destination shoppers and others primarily from within the Columbus Metropolitan Area, especially Worthington, New Albany, Gahanna, and areas on the north side of Columbus. According to the businesses, there are some sales to tourists, especially those to visitors drawn by family, friends, or college students who live or study in Westerville. Marketing & Merchandising Some Uptown businesses engage in aggressive advertising and marketing campaigns, while others do not advertise at all. As small, independent merchants, many of the stores do not have budgets sufficient for mass advertising, but they offer web sites, use social networking media, and participate in group advertising efforts sponsored by the merchant associations. Marketing Entities & Brands. Westerville Uptown Merchants Association (WUMA) promotes the area’s businesses through events and advertising. A key objective is to “make people in the Westerville aware of what they’ve got here.” The organization sponsors coupon campaigns in the Paper Mint (30,000 circulation in Westerville). The WUMA web site features links to member businesses, a Gift Card promotion, a merchants blog, maps, WUMA Facebook page, WUMA on Twitter, e-news and various agency and organization sites. The web site also provides some (limited) history of the area and an overall description, but features few graphics or images to encourage more interaction.
A (separate) Uptown Merchants web site features links to individual store sites, a community calendar, information, videos, newsletter, and ongoing news reports. There is also a link back to WUMA. There is some confusion generated by the presence of two web sites that seem to be offering similar information but with inconsistent imagery and branding. Another entity, the Westerville Visitors and Convention Bureau (WVCB) also markets Westerville, but primarily to an
external market as a visitor destination. The WVCB offers cross-branding with links to the WUMA web site and promotions including the gift card. The name for the area used in marketing, which is very important to building a brand, is also inconsistent and can be confusing. For example, the City of Westerville uses “Uptown Westerville” in its official designations for this area, while the WUMA business organization uses “Westerville Uptown” in its name, and then there is the “Uptown Merchants” web site. It is not clear how the area’s Uptown name

Randall Gross / Development Economics
USA: 2311 Connecticut Ave Ste 206 Washington DC 20008. Tel 202-332-7430. Fax 332-1853. [email protected] AFRICA: African Development Economic Consultants (ADEC). 27-11-728-1965. Fax 728-8371. [email protected]
15
was established or what the significance of that name may be for marketing purposes.1 Marketing materials emphasize that Uptown Westerville is “a great place to shop, work, live, meet, eat & play.” This seems to cover the gambit of possibilities but may be too broad to reach key target markets. The tag line is “A Place for People.” It is not clear how this differentiates Westerville from other shopping or business districts. The CVB and the Westerville Area Chamber of Commerce market the city as having “Cutting Edge Development, with an Old Town Feel.” The latter half of this tag line actually relates directly to the unique characteristics of Uptown, which does have an “old town feel.” Sponsored Events. Key Uptown events include the Uptown Westerville Farmers’ Market (held on Wednesdays, May through October), which features fresh foods, produce, and plants that must be made, raised, or grown in Ohio. This provides an environment for local food artisans and farmers to earn their living. The Uptown Westerville Farmers’ Market invites patrons to not only shop at the market, but to connect with Uptown Westerville as a marketplace destination and community. The market is considered a City of Westerville community partner. In conjunction with the Westerville Area Resource Ministry (WARM), the market management team created the WARM Fresh Green Program, a program that helps make fresh, healthy farmers’ market foods available to anyone in the Westerville City Schools district no matter their need.
The Saturday Uptown Market (held June through September) features baked goods, kitchenware, art and craft, and other merchandise and hosts community parties and events. Both markets are held at the corner of Home and State streets in the Church of the Messiah parking lot (which may be taken for expansion of the church). These markets have proven to be very popular among local residents. WUMA also sponsors its own business promotion events including Midnight Madness (Halloween) and Home for the Holidays (Christmas). Midnight Madness features costumed characters, treats, hay wagon rides, special effects, and sale prices at local merchants. The Holiday event is oriented more to promotion of holiday sales through gift cards. The Westerville VCB sponsors 4th Fridays, a community block party held on the 4th Friday of every month from April through September. Each month features a different theme (such as Dog Days of Summer in August when visitors are encouraged to bring their dogs). These events attract up to 100 vendors offering a variety of merchandise as well as live music, street performers, and special events. Unique Merchandising. Many of Uptown’s businesses carry one-of-a-kind products or use unique merchandising strategies that are not found
1 Images of Uptown branding sourced from City of Westerville, Westerville Uptown Merchants Association and Uptown Merchants web site.
Randall Gross / Development Economics
USA: 2311 Connecticut Ave Ste 206 Washington DC 20008. Tel 202-332-7430. Fax 332-1853. [email protected] AFRICA: African Development Economic Consultants (ADEC). 27-11-728-1965. Fax 728-8371. [email protected]
16
anywhere else. For example, Captivating Canine’s specializes in “gifts for dog lovers.” As the largest and most diverse store of its kind in the Midwest (offering items featuring every breed), the business occasionally attracts destination shoppers from as far away as Chicago, Indianapolis, and Pittsburgh. Outside Envy also sells unique merchandise, patio and garden-themed products (with a target of 15% made locally). Schneider’s Bakery offers home-made donuts and milk for $1.00 at 1:30am on Fridays, attracting scores of college students for (relatively healthful) late-night snacks. The shop has been known to attract up to 200 college students to line up for the late-night bargain on a regular basis, and has 500 members on Facebook. Meza wine store offers regular tastings that draw a primarily local crowd.
Local Sourced, Hand-Made, Organic Products. A key theme that already runs through the merchandising of Uptown stores is attention to including locally-sourced and hand-made products. While the definition of “local” differs from store to store, there is a common, apparently ad-hoc theme in the merchandising that appears to have some traction for consumers. Java Central and other shops feature locally-made art and craft products. Outside Envy features locally-produced garden materials. Amish Originals features only furniture hand-made by Amish communities in Ohio. Hey Diddle Diddle has hand-made products which set it apart from children’s shops in the malls. Encircle features hand-made “Americana” functional art. The Thai Grill offers local produce and organic foods. Blue Turtle Tea & Spice Company sells organic and fair trade merchandise. Building Tenure Based on the interviews and review of property records, it is estimated that about 88% of the businesses in Uptown are renting their spaces. The high share of rental tenure may help ensure more liquidity for small business owners, but it also heightens instability as businesses are more likely to come and go with swings in the economy. Businesses also have less control over their expenses, which can cause a squeeze on their bottom line if rents continue to increase while sales plummet. Property records indicate that there are a number of individual building owners, although several do control more than three properties each. Rents Based on interviews with businesses as well as property owners, it would appear that first-floor commercial rents average approximately $12.70 per square foot in Uptown. By comparison, Polaris retail rents range from $16.00/sf for neighborhood center space, to $19.00/sf for pad sites and $30.00/sf+ for regional mall space. These rents help to put the sales figures into perspective. At $206 per square foot, Uptown sales are about 60% of what would be expected for a regional mall shop. Uptown rents are about 67% of commercial rents for pad sites but only 42% of maximum mall rents. Uptown rents are nevertheless

Randall Gross / Development Economics
USA: 2311 Connecticut Ave Ste 206 Washington DC 20008. Tel 202-332-7430. Fax 332-1853. [email protected] AFRICA: African Development Economic Consultants (ADEC). 27-11-728-1965. Fax 728-8371. [email protected]
17
consistent with those in the broader sub-market beyond Polaris and higher than those in the specialty sector (as discussed in more detail in Section 3).
Policy Framework There are several Municipal Government policies aimed specifically to enhancing Uptown’s physical appearance in order to maximize its pedestrian-friendly context and consumer appeal. The City has also made an important commitment to the Uptown District by maintaining City Hall within the district and by undertaking various streetscaping and wayfinding improvements. Several specific policies are outlined briefly, below. Uptown Westerville Design Guidelines The City established an architectural review district in Uptown in 1973. As part of the review process, there are design guidelines targeted specifically for the Uptown area to help control clutter and enhance the overall attractiveness of the district. Exterior changes within the district are subject to approval by the Uptown Review Board. The Review Board approves design elements such as signage changes applied within the Uptown historic district. The guidelines focus on creating “harmony” within the district and appropriately emphasize the need to allow for “diversity and flexibility” in signage. Local Economic Development Incentives Uptown is located within one of the City’s four designated Community Reinvestment Areas (East Broadway CRA). New construction or significant rehabilitation within the CRA is eligible for property tax abatements. The City has historically provided limited tax abatement for retail properties, with some exceptions. Typically, projects seeking this incentive are evaluated on factors such as appropriateness for Westerville, significant project investment, increase in employment opportunities and potential for long-term viability in the Community. The City also offers an Income Tax Off-Set Program and Direct Loan and Grant Program, although these are applied city-wide. The City’s Economic Development Administrator oversees these incentive programs. The City is currently considering the establishment of a Façade Improvement Program which would likely be administered by the Westerville Industry and Commerce Corporation (WICC). Redevelopment The City is pursuing redevelopment of key sites, such as the site of the former Kyoto Tea House at 109 South State Street and adjoining properties in Uptown. Due to unique circumstances resulting in significant deterioration to the buildings on this site and bank foreclosure proceedings, the City has acquired these parcels and issued a Request for Proposals from developers. Through this

Randall Gross / Development Economics
USA: 2311 Connecticut Ave Ste 206 Washington DC 20008. Tel 202-332-7430. Fax 332-1853. [email protected] AFRICA: African Development Economic Consultants (ADEC). 27-11-728-1965. Fax 728-8371. [email protected]
18
process the City is seeking to leverage and control their redevelopment. The specific RFP for the Kyoto Tea House site specifies key objectives including high-quality integration with the historic district, inclusion of housing or mixed-use development with a “worthy” architectural presence, contribution to the economic vitality of Uptown, environmental sustainability, and high-quality design.
Summary Uptown Westerville is a vibrant, traditional shopping and business hub serving residents of Westerville as well as destination shoppers from throughout the Columbus region. The area offers a mix of businesses, many of which are locally-owned and operated enterprises offering a range of “specialty” merchandise. There is a thematic focus on providing high-quality, locally-produced and hand-made products at some of the businesses. There are also traditional businesses like bakeries and pharmacies that have long-served the market and have developed a loyal clientele despite competition from chains. At the same time, there are several gaps in the existing business mix, including convenience food, entertainment, non-specialty shoppers goods, and drinking establishments. Demand for filling these gaps is assessed in the sections of this report to follow.
The consumer environment is attractive and appealing, and the City has made various investments in the urban infrastructure. Parking is available, although not always visible. Some businesses note that availability of parking is the most serious issue impacting on their sales. Nevertheless, Uptown businesses have performed relatively well despite a national recession, with sales increasing over the long-term at or near the rate of inflation. Overall, sales are generally in line with the rent structure.
Several businesses promote themselves through dedicated advertising
budgets. Furthermore, there are several entities successfully marketing Uptown and Westerville overall, although there is inconsistency and dilution of the brand message. Local policies help to regulate design within the district but also provide some incentives for further development and rehabilitation. In general, the Uptown district is performing well by most standards and offers an interesting and successful mix of specialty businesses in a walkable environment that helps to cement Westerville’s high ratings as a place to live.

Randall Gross / Development Economics
USA: 2311 Connecticut Ave Ste 206 Washington DC 20008. Tel 202-332-7430. Fax 332-1853. [email protected] AFRICA: African Development Economic Consultants (ADEC). 27-11-728-1965. Fax 728-8371. [email protected]
19
Section 2. MARKET RESEARCH: SURVEY RESULTS This section provides a summary of results from two separate surveys conducted to provide input to the Uptown Market Study. The surveys generate information relating to existing market perceptions and helps to identify some of the key issues to be addressed in the market analysis and through strategic planning. The first survey was conducted of households within the Westerville area, using an online questionnaire designed by the consultant. This survey was meant to capture input from residents who may or may not visit Uptown for their shopping. As residents of the area, their input is also helpful in providing suggestions on the type of business district and environment that they seek in Uptown.
The second survey was conducted of consumers who were visiting Uptown for shopping or other purposes in late 2010/early 2011. This survey sought input from people who were visiting Uptown, regardless of whether they lived in Westerville or not. This survey was administered through in-person (intercept) interviews conducted by students of Dr. Leesa J. Kern at Otterbein University and City Staff, based on a questionnaire designed by the consultant. A special training session was held with the students to prepare them for this assignment. The students who helped administer the survey are acknowledged in the Appendix of this report, while key findings from both surveys are summarized below.
Household (Online) Survey The household survey was administered with the help of Westerville municipal staff, through an online questionnaire using SurveyMonkey.com. The survey garnered a total of 155 responses, 81% of whom are Westerville residents. Of those who responded to the survey, 67% live in zip code 43081, 22% in 43082, and 3% in 43231. More than two-thirds (67%) of respondents are females. The majority of respondents are between the ages of 35 and 54, with more than one-third aged 35 to 44. Only 4% are under the age of 21, and 8% were over the age of 65. “Baby boomers” (ages

Randall Gross / Development Economics
USA: 2311 Connecticut Ave Ste 206 Washington DC 20008. Tel 202-332-7430. Fax 332-1853. [email protected] AFRICA: African Development Economic Consultants (ADEC). 27-11-728-1965. Fax 728-8371. [email protected]
20
47 to 65) represent the largest single share of the population. Not surprisingly, a large share (43%) of survey respondents fell within this age cohort. Respondents generally had high incomes, with nearly 50% having household incomes of more than $100,000 per year (and 18% having incomes of more than $150,000 per year). Only 3% of the household survey respondents have incomes of less than $35,000 per year, suggesting that the interested respondents tended to be women in affluent, baby-boom households. Shopping Habits These respondents tend to be fairly regular shoppers in Uptown, although they are not typically shopping there for every day goods or services. More than 80% shop in Uptown at least once per month, including more than 15% who shop there every day. None of the respondents said that they never shop in Uptown, suggesting that the respondents tend to be interested, regular shoppers.
Items Purchased. The respondents are most often visiting Uptown to dine out at restaurants there. Nearly 90% listed restaurants as the type of business that they regularly visit in Uptown. Services, such as hair and nail salons, are the next most-visited group of businesses. Yet, only 40% regularly visit these businesses. About 30% regularly purchase “general merchandise” in Uptown. Respondents do
not shop in Uptown frequently for most other items, with 20% or less visiting regularly for groceries, medicines, apparel & accessories, furniture & home furnishings, hardware & building supplies, etc. Only a handful shop regularly in

Randall Gross / Development Economics
USA: 2311 Connecticut Ave Ste 206 Washington DC 20008. Tel 202-332-7430. Fax 332-1853. [email protected] AFRICA: African Development Economic Consultants (ADEC). 27-11-728-1965. Fax 728-8371. [email protected]
21
Uptown for shoes, electronics, or entertainment. In fact, only one out of 155 respondents claimed that they visit Uptown regularly for entertainment. Among the other items for which respondents regularly visit Uptown, are ice cream (Graeter’s), coffee/tea shops, musical instruments, dance class, wine, and gifts. Meanwhile, respondents noted that they regularly purchase most items elsewhere. The largest share (more than 90%) regularly purchases groceries and pharmaceuticals in locations other than Uptown. Similarly, more than 80% purchase apparel & accessories, shoes, electronics, and entertainment elsewhere. In addition to retail purchasing, respondents mentioned that they generally do their banking and other errands elsewhere.
Competitive Locations. Polaris is most competitive for dining and entertainment, as well as for shoppers goods including apparel & accessories, shoes, furniture & home furnishings, and appliances & electronics. Polaris is also very competitive for general merchandise stores.
1. Groceries; 2. Apparel & Accessories; 3. Shoes; 4. Furniture & Home Furnishings; 5. Appliances, 6. Hardware; 7. Auto Supply; 8. General Merchandise; 9. Restaurants; 10. Entertainment; 11. Personal Services; 12. Other.
Easton, like Polaris, is a regional destination that is highly competitive for
shoppers goods stores, dining, and entertainment. Other parts of Westerville (outside of Uptown) are competitive for convenience goods like groceries and

Randall Gross / Development Economics
USA: 2311 Connecticut Ave Ste 206 Washington DC 20008. Tel 202-332-7430. Fax 332-1853. [email protected] AFRICA: African Development Economic Consultants (ADEC). 27-11-728-1965. Fax 728-8371. [email protected]
22
pharmacies, as well as for hardware & garden supply, automotive supply, general merchandise, and personal services. Gahanna is competitive for other goods and services not mentioned here. In general, Polaris is the most competitive shopping location, followed by other parts of Westerville, Easton, and in a few cases, Gahanna. Among the other competitive locations mentioned were downtown Columbus, New Albany, Genoa township, north Columbus. Reasons for Visiting Uptown. The primary reason that household survey respondents visit Uptown is for dining out, accounting for 50% of all responses. Interestingly, the second most important reason that respondents visit Uptown is for work (17%), followed by errands (13%). Only 11% of respondents listed shopping as a reason for visiting Uptown. This suggests the need to enhance Uptown’s role as a shopping destination, versus a location primarily for dining out. Average Spend. The vast majority of respondents spend between $10 and $50 during their visit to Uptown. This is consistent with the pricing structure, particularly for restaurants in the area. Very few respondents spend over $100, although about 15% spend between $50 and $100 per visit. Preferences Respondents were asked their preference for the types of stores that they would like to see in Uptown. By far the largest share of respondents noted a preference for more entertainment venues in Uptown. Nearly 60% of responses favored more entertainment. The need for additional restaurants garnered about 50% of the responses. The need for general merchandise and apparel & accessory stores was each noted in more than 40% of responses. The need for a grocery store and/or pharmacy was noted in about 35% of responses and a shoe store in 20%

Randall Gross / Development Economics
USA: 2311 Connecticut Ave Ste 206 Washington DC 20008. Tel 202-332-7430. Fax 332-1853. [email protected] AFRICA: African Development Economic Consultants (ADEC). 27-11-728-1965. Fax 728-8371. [email protected]
23
of responses. No one expressed an interest in having automotive supply stores. These preferences are summarized on the chart below.
Preferences for (or against) specific types of stores were also mentioned,
including “more modern stuff / less antiques,” convenience store, “better farmers’ market”, “No Walmarts,” fabric store, office supplies & stationary store, movie theater, a Le Chatelaine-type restaurant, B&B, bookstore, men’s clothing, more reasonably-priced stores, small grocer like Wieland’s, “fun” stores, restaurants with liquor, bars, no “loud/chaotic environment,” and Walmart. Strengths. Uptown’s key strengths, according to online survey respondents, are the local/independent stores (as opposed to chains) and the quaint/historic architecture that defines the place. Also important to respondents is Uptown’s “walkability,” meaning that it is pedestrian friendly and pleasant for walking. Among Uptown’s other strengths, respondents listed 4th Fridays, art galleries (which have “done a great job”),

Randall Gross / Development Economics
USA: 2311 Connecticut Ave Ste 206 Washington DC 20008. Tel 202-332-7430. Fax 332-1853. [email protected] AFRICA: African Development Economic Consultants (ADEC). 27-11-728-1965. Fax 728-8371. [email protected]
24
friendly/hometown feel, good customer service, and “all of the above.” Weaknesses. The primary weakness that respondents observed about Uptown is the need for more diverse stores, which garnered 37% of responses. Also considered a serious weakness is the lack of accessible parking, listed in nearly 20% of responses. Other weaknesses included a general lack of stores
(not enough stores) and lack of things to see or do. Other comments included the need for more “mom and pop” restaurants. A number of people commented that the stores are not open late enough on weekdays and that they need to open on Sundays. For example, some mentioned that they visit Uptown for dinner but by then the stores are closed and there is nothing to do (and, by extension, nowhere to spend their money). Others noted that there is too much
traffic and parking is “terrible.” Several complained that the apparel sold in Uptown did not match their style or taste and that it was “too pricey and not practical.” One person mentioned the need to create more casual outdoor dining spaces like Worthington. Recurring themes include the need for a grocery, evening store hours, better parking (especially at dinnertime), and entertainment. Wheelchair access was noted as a problem for some people. One person offered the concept of having a Candle Lab (a store in Worthington) teamed with the existing wine shop in Uptown to create a more unique destination.
Consumer (Intercept) Survey An in-person shopper’s intercept survey was conducted by students from Otterbein University and City staff. About 110 people were interviewed at various times, dates, and locations on the street in Uptown. The survey was supposed to represent a random sample of current shoppers, to the extent that this was possible. Overall, the survey tended to be more representative of the general population and of the actual shoppers in Uptown, as opposed to the more self-selective online survey.

Randall Gross / Development Economics
USA: 2311 Connecticut Ave Ste 206 Washington DC 20008. Tel 202-332-7430. Fax 332-1853. [email protected] AFRICA: African Development Economic Consultants (ADEC). 27-11-728-1965. Fax 728-8371. [email protected]
25
About 56% of the intercept survey respondents were female, thus providing a more accurate demographic sample. About 91% of respondents were white, 5% African-American, and 2% Hispanic, based on the students’ observations. About 45% of respondents were aged 20 to 40, and another 41% were between the ages of 41 and 60. About 4% were under the age of 20 and 7% over 60, similar to the household survey.
The majority of surveyed Uptown shoppers live nearby, with 53% in zip code 43081 and 14% in 43082. Thus, a total of 67% of respondents live in these two zip codes (versus a more skewed 89% in the online survey). There were also small groups of respondents from 43064, 43054, and 43068, but no large clusters outside of 43081 and 43082. In general, this survey captured a broader and more realistic market base than the online survey. Similarly, intercept survey incomes more accurately reflected the broader market, with a large share (39%) having household incomes in the $50,000 to $75,000 range. Only 9% had incomes in excess of $100,000 per year, while nearly 40% had incomes of less than $35,000 per year. Thus, despite the relative affluence of area households (as demonstrated through the online survey), the actual existing market base in Uptown is more diverse and covers a much broader range of incomes. Shopping Habits About 30% of consumers interviewed for this survey shop in Uptown an average of once or twice per month. About 25% shop there once or twice per week, and 20% only shop there several times per year. A handful of respondents said that they shop in Uptown every day, and an equal number said that they never shop in Uptown. Consumers dine out at restaurants in Uptown, and restaurant food is one of the primary purchases that the consumers make. Other items that consumers purchase regularly in Uptown are other food & beverage items (e.g., wine), apparel & accessories, specialty goods (e.g., gifts), personal services, and home furnishings.
Competitive Locations. As with the household (online) survey, the most competitive shopping location listed by consumers was Polaris. Easton was also an important competitor. Other competitive locations include Tuttle Crossing,

Randall Gross / Development Economics
USA: 2311 Connecticut Ave Ste 206 Washington DC 20008. Tel 202-332-7430. Fax 332-1853. [email protected] AFRICA: African Development Economic Consultants (ADEC). 27-11-728-1965. Fax 728-8371. [email protected]
26
Dublin, and The Short North, among others. The most competitive locations are summarized in the chart shown below.
Other areas not included in the chart that were mentioned by consumers were Clintonville, Lake County, Schrock Road, Walmart/Target, Best Buy, Lowe’s, Kohl’s, Giant Eagle, Racine OH, and discount stores.
Reason for Visiting Uptown. As with the online survey, dining out is the primary reason for visiting Uptown. However, the reasons for visiting are much more diverse among the actual shoppers interviewed through the intercept survey. About 19% are there to dine out, but 17% are there just to take a walk. Many people visit Uptown because it is a pleasant place to walk, whether for exercise, people watch, window shop, or just for an outing with the family. About 14% are there for the primary purpose of shopping. Around 11% are there because they are running an errand and another 10% are there for work.
About 10% of respondents were in Uptown because they were visiting, either as a guest of someone or as a tourist. Nearly 20% of the respondents who were interviewed were there for some other reason. Among the other purposes of their visit to Uptown were: attending school or

Randall Gross / Development Economics
USA: 2311 Connecticut Ave Ste 206 Washington DC 20008. Tel 202-332-7430. Fax 332-1853. [email protected] AFRICA: African Development Economic Consultants (ADEC). 27-11-728-1965. Fax 728-8371. [email protected]
27
college, getting an ice cream for the kids, visiting friends or family, attending a football game, and getting their hair done, among others. The lower incomes noted earlier for some respondents may relate to their status as young college students. These students, along with tourists, workers, and others, are all part of the existing market in addition to residents of Westerville zip codes.
Average Spend. The Uptown shopper households are spending on average about $98 per month on groceries, $55 per month on restaurants, $50 on clothing, $36 on personal services and $33 on hardware in the district. They are spending an average of $43.58 per visit to Uptown, which is consistent with the average spend in the household survey. Preferences Among the shoppers interviewed for the intercept survey, the largest share would prefer to see the addition of groceries, restaurants, and apparel & accessory stores in Uptown. A large share also wanted to see “other” businesses, which was primarily identified as entertainment venues such as movie theaters or bowling alleys, game stores, or live music venues. Other preferences that were mentioned include craft stores, bookstores, bars, and art centers. Strengths. The shoppers interviewed for the intercept survey recognized similar strengths in Uptown as did the respondents who completed the online survey, albeit prioritized slightly differently. Among these were walkability (18%), the quaint architecture (17%), and local / independent stores (12%). Consumers also ranked highly the “nice people” of Uptown (15%). As in the household survey, consumers generally felt that Uptown is safe and secure, and offers some good restaurants and shopping. None of the respondents said that there were “no” strengths to Uptown’s business district. Other strengths that people mentioned included “it reminds me of old times,” cleanliness, events (especially 4th Fridays), and the fact that it’s relatively quiet. These strengths are summarized in the following chart, based on the responses from the consumer intercept survey.

Randall Gross / Development Economics
USA: 2311 Connecticut Ave Ste 206 Washington DC 20008. Tel 202-332-7430. Fax 332-1853. [email protected] AFRICA: African Development Economic Consultants (ADEC). 27-11-728-1965. Fax 728-8371. [email protected]
28
Weaknesses. Uptown’s most serious weakness, the one most often noted by actual consumers on the street, is the difficulty of parking there. This issue was raised in nearly one-third of responses, far above any other issue. As
in the household survey, other important problems relate to the lack of diversity in the business mix (19%) and the volume of stores for shopping (15%). A number of people also mentioned the store hours as a weakness, since many working people cannot access stores in Uptown after work because the stores close too early. Several people mentioned that they refrain from visiting Uptown in winter because it is too cold to walk outside.

Randall Gross / Development Economics
USA: 2311 Connecticut Ave Ste 206 Washington DC 20008. Tel 202-332-7430. Fax 332-1853. [email protected] AFRICA: African Development Economic Consultants (ADEC). 27-11-728-1965. Fax 728-8371. [email protected]
29
Visitors
It is important to understand the experience of visitors from outside of Westerville, since they constitute an important destination market source. Of those visiting from outside of Westerville, more than one-third were drawn to Uptown by a specific store. Another third were there to visit friends or family who live in Westerville (including college students at Otterbein), about 18% were there on errands and 11% were just passing through and decided to stop. Only 3% came to Uptown specifically because of the ambience or as a tourist destination.
Among the other places Uptown’s customers visited were Sunbury and New Albany as well as local destinations like Otterbein University, the library, Polaris, various banks, car repair businesses, and Westerville City offices. Among the specific stores that had drawn customers to Uptown from outside of Westerville were Old Bag of Nails, Pasquale’s, Beehive, Encircle, Heart’s Content (since changed to Abby Rose and relocated to another Uptown space), Schneider’s, Chocolaterie Stam, and Gallery 202. Very few visitors said that it was their first time to visit or shop in Uptown, In fact, 95% of visitors had shopped there before. This suggests that Uptown has penetrated an existing market but has not been expanding its market beyond a loyal base of customers. About three out of four visitors drove themselves by car to Uptown. Typically, they take I-270 to Route 3/State. However, `16% of visitors either walked or biked into Uptown from work or home. Many of these people are students. About 8% rode with friends or family, but no one took public transportation to Uptown. Consumer Recommendations Consumers were also asked to recommend stores or activities that would attract people to Uptown. Among the responses were only a few specific store recommendations, such as Trader Joe’s and Kroger. Most suggested the addition of more stores (scale) and more diversity, more variety of restaurants, more entertainment (including both family entertainment and bars, especially sports bars), more local/independent stores, more stores that appeal to young people, fun events, and better parking. This last item was emphasized by a number of people.
Summary Two surveys were conducted to gain insights into existing Uptown consumer preferences and to provide some basic input to the market analysis. The online survey of Westerville-area households found that an affluent group of (primarily women) shoppers are looking for a larger and broader mix of stores, and in particular, more specialty groceries, apparel, entertainment, and nighttime

Randall Gross / Development Economics
USA: 2311 Connecticut Ave Ste 206 Washington DC 20008. Tel 202-332-7430. Fax 332-1853. [email protected] AFRICA: African Development Economic Consultants (ADEC). 27-11-728-1965. Fax 728-8371. [email protected]
30
activities to keep them in Uptown after dinner. Shops close too early for many working families. The intercept survey of consumers on Uptown’s streets found a broader mix of shoppers (including college students, tourists, workers, and those passing through) with different demographics but a similar desire for a larger and more diverse mix of stores and more entertainment in Uptown. Both groups shared a common issue with the existing parking situation, which no doubt prevents other shoppers (not captured through the surveys) from even stopping in Uptown. At the same time, both groups also felt that the key strengths of the area are its “walkability,” local/independent businesses, and quaint architecture. In fact, a surprisingly large number of people visit Uptown simply to take a walk. Despite these strengths, existing visitors to Uptown from outside of the area are drawn more by specific stores or to visit family and friends. Few tourists are drawn to Uptown as a destination, at present. But, this may result from a lack of destination marketing, entertainment, and visitor attractions. Additional information has been gleaned on existing market conditions from businesses, as described in the following section.

Randall Gross / Development Economics
USA: 2311 Connecticut Ave Ste 206 Washington DC 20008. Tel 202-332-7430. Fax 332-1853. [email protected] AFRICA: African Development Economic Consultants (ADEC). 27-11-728-1965. Fax 728-8371. [email protected]
31
Section 3. RETAIL DEMAND ANALYSIS This section summarizes findings from an analysis of retail demand within the Uptown Westerville Trade Area. A brief summary of existing retail market conditions is provided, followed by a definition of the trade area for Uptown. Within this trade area, demographic trends and forecasts are examined as the basis for determining market demand. Overall trade-area expenditure potentials are then forecasted for specific types of retail goods and services, constituting overall demand for retail within the trade area.
Existing Market Conditions The Columbus regional retail market has been impacted negatively by the recession of 2009-10, but has started showing tentative signs of recovery. Colliers reports that the Columbus market absorbed about 58,000 square feet of retail space during the last quarter of 2010, the third consecutive quarter with positive absorption. Overall, 2010 saw positive absorption of 275,000 square feet. Retail vacancy rates peaked in mid-2009 at 13.25%, but fell consistently since then to 11.9% by end of 2010. Construction dissipated during most of 2009-10, but almost 200,000 square feet was completed in late 2010, including a 56,000 square-foot Hobby Lobby. Rents remained depressed at $11.05/sf (neighborhood) and $12.50/sf (power center), due to the relatively high vacancy rates, and are only likely to increase again as vacancy falls below 8.0%.2 Sub-Markets Westerville forms part of the Northeast Sub-market, one of 11 retail sub-markets in the Columbus region. This sub-market is by far the largest, with 15.1 million square feet (27%) out of the total 56.0 million in the market. Polaris and other key retail nodes are concentrated within this relatively affluent sub-market. The Northeast is performing well, with 7.3% vacancy compared with the 11.9% overall rate. Northeast saw negative absorption of about 15,800 square feet during 4th quarter 2010, but the sub-market had overall positive absorption of 132,200 square feet for the year, representing almost 50% of total absorption in the Columbus market. Rents are averaging $12.04 (neighborhood) to $12.85 (power center) in this sub-market, wholly consistent with the average rents seen in Uptown Westerville. Northeast power center rents are near the lower range of the regional market, although neighborhood rents are relatively high. Projects closer to Polaris obviously have higher-than-average rents as noted previously. Specialty shopping centers, which may have some comparability with Uptown,
2 Greater Columbus Region Retail Trends Report, Q4 2010, Colliers International

Randall Gross / Development Economics
USA: 2311 Connecticut Ave Ste 206 Washington DC 20008. Tel 202-332-7430. Fax 332-1853. [email protected] AFRICA: African Development Economic Consultants (ADEC). 27-11-728-1965. Fax 728-8371. [email protected]
32
tend to have lower rents at $10.00 per square foot, and average vacancy of 15.2%.3
Uptown Trade Area Definition The retail trade area was defined for Uptown based on field reconnaissance, business interviews, consumer market and survey research, and analysis of various factors including road patterns, commutation, natural boundaries, highway networks, and others. The trade area is that region of households from which 70 to 80% of Uptown sales should be generated. Based on these inputs, the trade area was defined to include much of the northern half of the Columbus area in Franklin and Delaware counties. More specifically, the trade area was disaggregated into specific sub-areas (not the same as “sub-markets”) including the following: Primary Trade Area (PTA) A primary or “natural” trade area for Uptown includes the areas of Westerville surrounding Uptown along Route 3. For the purposes of this analysis, the sub-area was defined to include Census Tracts 70.10, 70.20, and 71.93 in Franklin County and 117.10, 117.30, 117.40, and 117.60 in Delaware County. In general, this area is bounded by Schrock Road to the south, Hoover Reservoir on the east, Big Walnut Road on the north, and Alum Creek/Worthington Road on the west. This area is shown (in red) on the map below.
3 Ibid.

Randall Gross / Development Economics
USA: 2311 Connecticut Ave Ste 206 Washington DC 20008. Tel 202-332-7430. Fax 332-1853. [email protected] AFRICA: African Development Economic Consultants (ADEC). 27-11-728-1965. Fax 728-8371. [email protected]
33
Commuter Trade Area A “commuter trade area” was also defined, to include those households that fall within the natural commuter flow through Uptown but are excluded from the primary trade area. This commuter trade area generally includes the region flowing from the north around Route 3 (or from the west on Main Street) as trunk access routes. This sub-area includes households in zip codes 43081, 43082, 43240, 43021, and 43074. Galena and Sunbury are included in this sub-area, shown (in green) on the map below.
Destination Trade Areas There are three main “destination trade areas” defined where Uptown would draw from a regional household base for destination shopping trips. These sub-areas include primarily Columbus and suburban areas to the Southeast, South, and West. The Southeast sub-area includes households in zip codes 43054, 43230, 43004, and 43062, consisting of areas such as Gahanna, New Albany, Pataskala, and portions of Reynoldsburg. The South sub-market includes households in zip codes 43231, 43229, and 43085, consisting of areas such as Worthington and neighborhoods in north Columbus such as along Dublin-Granville Road. The West sub-area includes households in zip codes 43035, 43065, 43235, 43017, 43016 and portions of 43026, consisting of areas such as Lewis Center, Powell, Dublin, Hilliard, and neighborhoods in north-west Columbus such as along Dublin-Granville Road. The following map generally shows the boundary (in blue) of this broader destination sub-area.

Randall Gross / Development Economics
USA: 2311 Connecticut Ave Ste 206 Washington DC 20008. Tel 202-332-7430. Fax 332-1853. [email protected] AFRICA: African Development Economic Consultants (ADEC). 27-11-728-1965. Fax 728-8371. [email protected]
34
As shown on this map, the trade area generally includes areas accessible to I-270, which is a primary commuter route in the Columbus region and a key transportation access route for those shoppers visiting Uptown Westerville from the various parts of northern Columbus. The trade area is also focused on those markets north of I-70, within Franklin and Delaware counties.4 In-Flow & Other Market Sources Another 20% of Uptown sales should normally be generated as “in-flow” from outside of this trade area, including other parts of Columbus and the metropolitan area, as well as from tourists. College students and workers within Uptown are also considered as part of the market, but are treated differently from households. A majority of Otterbein students live in dormitory housing and are therefore not included in the household base. Their consumer behavior is therefore treated separately in the market analysis.
Demographic Trends Demographic trends within the trade area were analyzed based on data generated by Mid-Ohio Regional Planning Commission (MORPC) and Claritas, Inc. Population, household, and average household income trends are summarized below. Additional analysis was conducted to examine more detailed
4 Base maps sourced from Google maps. Zip code overlays sourced from USNaviguide.

Randall Gross / Development Economics
USA: 2311 Connecticut Ave Ste 206 Washington DC 20008. Tel 202-332-7430. Fax 332-1853. [email protected] AFRICA: African Development Economic Consultants (ADEC). 27-11-728-1965. Fax 728-8371. [email protected]
35
demographic trends such as in age cohorts, family composition, ethnic and racial group composition, and other factors as relevant to the analysis.
Table 3. DEMOGRAPHIC TRENDS, RETAIL TRADE AREA,
UPTOWN WESTERVILLE, 1990-2010
1990-2010 Change
Factor 1990 2000 2010 Number Percent
PRIMARY
Population 22,525 30,950 38,573 16,048 71.2%
Households 7,542 10,572 13,158 5,616 74.5%
HH Income $ 86,315 $ 110,780 $ 113,829 $ 27,514 31.9%
COMMUTE
Population 43,688 54,568 70,482 26,794 61.3%
Households 15,837 21,321 27,773 11,936 75.4%
HH Income $ 94,278 $ 100,408 $ 97,295 $ 3,017 3.2%
SOUTHEAST
Population 57,251 85,403 114,251 57,000 99.6%
Households 20,278 32,521 44,317 24,039 118.5%
HH Income $ 81,562 $ 99,120 $ 94,281 $ 12,719 15.6%
SOUTH
Population 82,585 85,448 84,842 2,257 2.7%
Households 34,339 37,002 37,101 2,762 8.0%
HH Income $ 75,219 $ 73,117 $ 61,744 $ (13,475) -17.9%
WEST
Population 48,988 73,394 98,185 49,197 100.4%
Households 18,723 29,024 38,562 19,839 106.0%
HH Income $ 103,968 $ 113,856 $ 105,445 $ 1,477 1.4%
Note: Income expressed in constant 2010 dollars.
Sources: Claritas, Inc. and Randall Gross / Development Economics.
Population Population within the overall trade area is 406,333, which represents about 22.9% of the total population of the Columbus Metropolitan Area. However, the Primary Trade Area (PTA) has a total population of about 38,600, representing less than 2.2% of the total Metro Area population base. Population throughout the trade area has increased during the last 20 years. Within the PTA, population increased by 71.2% since 1990, for a rapid average annual increase of 4.2%. Population increased at an even faster rate in the Southeast and West sub-areas, at about 100% (5.9% per year) each. Only the South sub-area (primarily encompassing neighborhoods in north Columbus) did population growth remain relatively slow, at just 0.2% per year. Since 2000, population in

Randall Gross / Development Economics
USA: 2311 Connecticut Ave Ste 206 Washington DC 20008. Tel 202-332-7430. Fax 332-1853. [email protected] AFRICA: African Development Economic Consultants (ADEC). 27-11-728-1965. Fax 728-8371. [email protected]
36
this sub-area actually fell by 600 or about 1.0%. The northern neighborhoods of Columbus have suffered from continued outflow of population. Meanwhile, suburban areas, especially in southern Delaware County, have benefited from an economic boom accompanying new development like Polaris and the associated business base. Households The number of households within the trade area has increased at an even faster rate than population, largely because of a continued decrease in average household size. With growing population and shrinking households, the number of households increased at a rapid rate. Within the PTA, there are about 13,100 households, up by 5,600 or 74.5% from 1990. Households increased by 106% in the West sub-area and 119% in the Southeast sub-area. Even in the South sub-area, the number of households increased by about 8%, or almost three times as fast as population. This suggests a rapid shift to singles, elderly, and “DINKS” (dual income / no kid) households, replacing families with children in north Columbus neighborhoods. Since households are the primary buying unit for retail goods and services, growth in households is a positive factor feeding demand for retail within the trade area. The number of households within the South sub-area increased slightly, even though the population in that area fell, since 2000. Household Income The other key factor affecting retail demand is household income. Household incomes within the Primary Trade Area are by far the highest of the overall trade area, at an average of $113,800 per year. The next highest incomes, at $105,500, are found in the West sub-area. Not surprisingly, incomes are lowest in the South sub-area, which includes relatively low income neighborhoods in north/east Columbus. Here, the average household income is $61,700 per year. Even so, it should be stated that these relatively “low” incomes are still more than $10,000 above the national average. Real incomes (adjusted for inflation) increased throughout the trade area since 1990, with the exception of the South sub-area. Household incomes increased by 31.9% in the Primary Trade Area, by far the fastest rate of growth in the overall trade area. Incomes also increased rapidly in the Southeast sub-area. However, income growth has been slower in other parts of the trade area and, as noted above, fell in the South sub-area (by almost 18% in real – constant dollar – terms). Since 2000, incomes have fallen in real terms in all parts of the trade area outside of the PTA. Slower income growth, coupled with two recessions, helped push down average incomes over the last ten-year period in much of the country. Growing, affluent communities like those found in the PTA are the exception to this trend.

Randall Gross / Development Economics
USA: 2311 Connecticut Ave Ste 206 Washington DC 20008. Tel 202-332-7430. Fax 332-1853. [email protected] AFRICA: African Development Economic Consultants (ADEC). 27-11-728-1965. Fax 728-8371. [email protected]
37
Demographic Forecasts
Based on regional projections and data provided through Claritas, Inc., trade area demographics were forecasted through 2015. These forecasts are summarized in the table below for population, households and household income within each of the sub-areas.
Table 4. DEMOGRAPHIC FORECASTS, RETAIL TRADE
AREA, UPTOWN WESTERVILLE, 2010-2015
2010-2015 Change
Factor 2010 2015 Number Percent
PRIMARY
Population 38,573 42,031 3,458 9.0%
Households 13,158 14,310 1,152 8.8%
HH Income $ 113,829 $ 118,529 $ 4,700 4.1%
COMMUTE
Population 70,482 77,003 6,521 9.3%
Households 27,773 30,476 2,703 9.7%
HH Income $ 97,295 $ 98,502 $ 1,206 1.2%
SOUTHEAST
Population 114,251 122,071 7,820 6.8%
Households 44,317 47,646 3,329 7.5%
HH Income $ 94,281 $ 96,582 $ 2,301 2.4%
SOUTH
Population 84,842 85,201 359 0.4%
Households 37,101 37,374 273 0.7%
HH Income $ 61,744 $ 59,343 $ (2,401) -3.9%
WEST
Population 98,185 107,843 9,658 9.8%
Households 38,562 42,329 3,767 9.8%
HH Income $ 105,445 $ 108,561 $ 3,116 3.0%
Note: Income expressed in constant 2010 dollars.
Sources: Claritas, Inc. and Randall Gross / Development Economics.
Population and Households Continued but slowing growth is anticipated in all portions of the trade area, including the South sub-area. Within the PTA, population is expected to increase by 9.0% to about 42,000 by 2015. Households will increase by 8.8% to 14,300. Here, there is a reversal in household trends with an increase in average

Randall Gross / Development Economics
USA: 2311 Connecticut Ave Ste 206 Washington DC 20008. Tel 202-332-7430. Fax 332-1853. [email protected] AFRICA: African Development Economic Consultants (ADEC). 27-11-728-1965. Fax 728-8371. [email protected]
38
household size. The baby “boomlet” is generating more households with children, and many of these families will chose to live in areas like Westerville that have good schools and a pleasant, safe environment in which to raise children. Population and household growth will be slightly higher in the Commuter and West sub-areas, but lower in the Southeast. The South sub-area will see a relatively minor increase in population of about 0.4% and growth in households of 0.7% (indicating that household size is continuing to shrink somewhat in the urban neighborhoods). The fact that this area will see even modest growth is a positive reversal from past trends. Household Incomes There will be only modest increases in real incomes over the next five years, as the region and the nation gradually pull away from the effects of 2009-10 recession. Affluent areas like the PTA will see the fastest increases in income growth, expected at 4.1% over the five-year period to a total of $118,500. Lower-income areas will see static income growth or even continued declines. The South sub-area will lose another 3.9% of household income over the next five years, to an average of just under $60,000 or about one-half of those in the PTA.
Retail Demand Demand for retail is determined based on the share of total income spent on retail goods and services within the trade area. This amount is forecasted based on the demographic projections discussed above. Total Personal Income (TPI) is forecasted for the trade area and its component parts below, and then retail demand is calculated based on the share of this income that trade area households will be expected to spend on retail goods and services. Total Personal Income (TPI) Total Personal Income (TPI) is estimated at about $14.7 billion within the entire trade area. Of this amount, $1.5 billion is concentrated within the primary trade area (PTA), accounting for 10.2% of the total. Thus, even though the PTA accounts for only 8.1% of trade area “rooftops” (households), it has a higher share of the total income because incomes are relatively high within the PTA. Still, the larger share of TPI is in areas outside of the PTA, particularly in the Southeast and West sub-areas. Over the next five years, trade area TPI is expected to increase by $1.38 billion or 9.4%. This increase results from the overall growth in population and household base, coupled with an expected modest increase in incomes. The PTA will see the highest rate of growth in TPI, at 13.2%, adding total income of about $198.4 million. The West sub-area will also see a rapid increase in TPI. By comparison, the South sub-area will see a loss in TPI of about 3.2% or $72.9 million, over the five-year period. Even with a modest growth in household base, the South sub-area will continue to see shrinking incomes and the lasting effects of the recession.

Randall Gross / Development Economics
USA: 2311 Connecticut Ave Ste 206 Washington DC 20008. Tel 202-332-7430. Fax 332-1853. [email protected] AFRICA: African Development Economic Consultants (ADEC). 27-11-728-1965. Fax 728-8371. [email protected]
39
Table 5 TPI FORECASTS, UPTOWN WESTERVILLE
RETAIL TRADE AREA, 2010-2015
TPI (000) 2010-2015 Change
Trade Area 2010 2015 Amount Percent
Primary $ 1,497,762 $ 1,696,146 $ 198,384 13.2%
Commute $ 2,702,180 $ 3,001,937 $ 299,757 11.1%
Southeast $ 4,178,251 $ 4,601,757 $ 423,505 10.1%
South $ 2,290,764 $ 2,217,887 $ (72,877) -3.2%
West $ 4,066,170 $ 4,595,269 $ 529,099 13.0%
Total $14,735,127 $16,112,995 $1,377,869 9.4%
Notes: Total personal income (TPI) expressed in
thousands of constant 2010 dollars.
Source: Randall Gross / Development Economics.
Household Expenditure Potentials Total retail expenditure potentials were forecasted based on the trade area TPI and on the share of that income trade-area households typically spend on each type of retail good or service. Data on the share of income spent on specific retail goods and services is generated by the Census Bureau through annual retail surveys. The amounts spent on each retail good or service is cumulated to derive the total, estimated at $6,485,690,000 in 2010, increasing to $7,076,283,000 by 2015. This represents an expected increase in retail expenditures by trade-area households of $590,593,000 or 9.1% over the five-year period. Thus, growth in the household income base will generate demand for about $590,600,000 in additional retail sales. Much of those retail expenditures will be absorbed by existing businesses throughout the Columbus Metropolitan Area as well as by businesses in other locations where trade-area households may travel. However, a share of that growth may help support new businesses throughout the region. The potential for Uptown Westerville to capture a share of this growth in sales for existing and new businesses is determined in the section that follows. Student Expenditure Potentials Otterbein University student expenditure potentials were calculated separately from those generated by households. Overall, the university has about 2,700 undergraduates and 400 graduate students. The student population is expected to stagnate in Ohio within the near term, due to age cohort demographics, so the university will be seeking growth by attracting more out-of-state and international students. It is anticipated that university enrollment will increase only modestly during the next five years. Information collected through

Randall Gross / Development Economics
USA: 2311 Connecticut Ave Ste 206 Washington DC 20008. Tel 202-332-7430. Fax 332-1853. [email protected] AFRICA: African Development Economic Consultants (ADEC). 27-11-728-1965. Fax 728-8371. [email protected]
40
the consumer intercept survey provided sample data on average student expenditures for items in the typical monthly shopping basket. Based on this input, and other data on student expenditures, average annual off-campus retail expenditures were calculated for the Otterbein student population and forecasted through 2015.
Table 6. STUDENT-GENERATED DEMAND,
UPTOWN WESTERVILLE, 2010-15
Type of Good Sales Square Feet
Convenience $ 656,000 1,835
Shoppers Goods 294,400 1,418
E&D/Entertainment 192,000 1,075
Personal Services 32,000 188
TOTAL $ 1,174,400 4,517
Source: Randall Gross / Development
Economics
Based on this analysis, the students generate annual local off-campus
demand in the local market for about $1.2 million in retail goods and services.
Summary The Columbus retail market is still recovering from the effects of national recession, with depressed rents and relatively high vacancies. However, there are signs of improvements with positive absorption of retail space and improved occupancies. The Northeast sub-market where Westerville is located performs best among all 11 sub-markets in the Columbus region. The Uptown Trade Area encompasses much of this same area, focused around Westerville and area commuters, and on destination markets located in the northern half of Columbus, accessible to I-270. These generally constitute the most affluent markets in the Columbus region, with particularly high incomes clustered within the primary trade area. Population, households and income have increased rapidly within these areas and are expected to continue growing, if more moderately. The growth in household and income base throughout the trade area will generate continued growth in demand for retail goods and services totaling over $590 million over the next five years. Within Westerville, Otterbein University students represent a small but “captured” market for retail businesses in Uptown, generating demand for $1.0 to $1.5 million in sales growth over the next five years.

Randall Gross / Development Economics
USA: 2311 Connecticut Ave Ste 206 Washington DC 20008. Tel 202-332-7430. Fax 332-1853. [email protected] AFRICA: African Development Economic Consultants (ADEC). 27-11-728-1965. Fax 728-8371. [email protected]
41
Section 4. UPTOWN MARKET POTENTIALS Retail market potentials were forecasted for Uptown based on the area’s capture of trade area demand. An analysis was conducted of the competitive retail framework. Capture rates were assigned for each specific type of retail establishment in order to determine the amount of sales that would be captured from the trade area and generated within Uptown. These sales were then translated into square footage based on the typical performance ratios for businesses within each category. Finally, a recommended mix of retail businesses is provided, based on the market findings, for new or expanded retail uses to strengthen the existing Uptown business offering.
Competitive Framework Uptown businesses must compete on a regional basis to capture a portion of the demand generated by households within the trade area. The competitive retail and commercial business nodes and centers were inventoried and assessed as part of an analysis of the competitive framework. Clearly, the major regional shopping hubs like Polaris (Polaris Fashion Place) and Easton (Easton Town Center) compete for much of the shoppers’ goods sales within the trade area. But in addition, Uptown must compete for convenience and everyday retail purchases with neighborhood and community retail centers as well as highway commercial uses in Westerville and surrounding areas. Westerview Plaza, Westerville Shopping Center, Westerville Square (possible renovation), Westerville Plaza, West Park Plaza, Parkview Center, Windsor Bay Shopping Center, Pointe at Polaris Parkway, and Northridge Crossing constitute some of the retail nodes and centers competitive for convenience and shoppers goods sales, just within Westerville itself.
Uptown must also directly compete with specialty centers and nodes throughout the Columbus region for specialty merchandise, dining, and entertainment. Traditional “Main Street” communities and traditional neighborhood developments (TNDs) are particularly competitive with Uptown for specialty shopping in a “walkable” environment. Communities such as Dublin, Gahanna, Powell, Delaware, Worthington, and the Short North and German Village in Columbus feature specialty shopping districts that are particularly competitive. Redevelopment of Upper Arlington’s Kingsdale Shopping Center into a walkable, mixed-use destination will restore yet another highly competitive node.

Randall Gross / Development Economics
USA: 2311 Connecticut Ave Ste 206 Washington DC 20008. Tel 202-332-7430. Fax 332-1853. [email protected] AFRICA: African Development Economic Consultants (ADEC). 27-11-728-1965. Fax 728-8371. [email protected]
42
Uptown Market Potentials Based on the analysis of competitive retail nodes, centers, districts, and malls, capture rates were determined for Uptown for each type of retail good or service establishment. The capture rates were applied to the expenditure potentials within each sub-area and then translated using performance standards into demand for retail space in square feet. Summary of Potentials Overall, the analysis determined that there is existing demand for about 300,000 square feet of retail space within the Uptown district, increasing to 335,800 square feet by 2015. After subtracting out the 141,800 square feet of existing retail use within the district, there will be net market potential for about 194,000 square feet by 2015. If the existing 5,500 square feet of vacant space were filled, there would be net demand for about 188,000 square feet of new retail space use within the corridor. It should be understood that these numbers represent the potential only if existing stores in Uptown did not capture any of the expected growth in the market. Obviously, some of this potential would be captured by existing stores through increased sales above and beyond what they currently generate. Growth in the market will generate additional sales of about $7.1 million for Uptown over the next five years. Some of that growth could be accommodated through increased sales at existing businesses, but not all sales potential is in categories that are represented by existing stores.
Table 7. SUMMARY WARRANTED RETAIL DEMAND BY USE
UPTOWN WESTERVILLE, 2010 AND 2015
Gross Demand (SF) Existing Warranted
Type of Good 2010 2015 Uses Demand
Convenience 43,803 48,792 22,099 26,694
Shoppers Goods 150,012 165,932 56,606 109,326
Eating/Drinking 50,118 55,652 39,951 15,701
Entertainment 36,557 40,368 - 40,368
Personal Services 22,607 25,082 23,144 1,938
TOTAL 303,096 335,826 141,799 194,027
Existing Vacant 5,548
Net New Space 188,479
Source: Randall Gross / Development Economics.
Randall Gross / Development Economics
USA: 2311 Connecticut Ave Ste 206 Washington DC 20008. Tel 202-332-7430. Fax 332-1853. [email protected] AFRICA: African Development Economic Consultants (ADEC). 27-11-728-1965. Fax 728-8371. [email protected]
43
Potential by Type of Store The largest share of warranted (net) demand is in shoppers goods, with a total of about 109,000 square feet of additional demand for retail space that could be captured in Uptown. There is also about 40,000 square feet of entertainment space that could be captured in Uptown, along with 27,000 square feet of convenience goods space, 15,700 square feet of eating & drinking use, and about 2,000 square feet of personal service space. A more detailed summary of the potentials by type of business is found in Appendix Table 1 and described below. Convenience Goods Stores. Demand for convenience goods includes potential for about 16,000 square feet of grocery store space, 2,000 square feet of convenience store, and 3,500 square feet of specialty food space. Thus, there is a total of about 21,500 square feet of potential convenience food store demand in the district by 2015. These numbers represent insufficient floor plate to accommodate most supermarkets or chain convenience stores, which are averaging 55,000 square feet and 4,500 square feet, respectively. However, they do represent opportunities for specialty groceries, small convenience and specialty food stores that would integrate well with Uptown’s specialty retail mix. Stores that serve the current marketing theme of locally-produced, organic, or other specialty food business would be especially appropriate. Shoppers Goods Stores. Uptown currently has an inventory of shoppers goods stores that is heavily weighted to the “specialty” niche portions of certain categories. However, there is potential to broaden the mix in these categories or to expand the specialization to other categories. The first approach may enhance Uptown’s capture of primary trade area sales, while the other approach will help strengthen Uptown’s capture of destination sales. In particular, there is an opportunity to capture more of apparel, accessory, and shoe sales potential. There is warranted demand for up to about 14,000 square feet of apparel sales. The existing apparel mix is limited, and there are opportunities to broaden this mix to include more diverse styles (of women’s and men’s clothing) that will appeal to both older affluent markets as well as younger tastes. There is also significant warranted demand for general merchandise stores. At about 38,000 square feet, this demand is insufficient to support a large department store or “power” store. However, there are specialty brands that can be accommodated within this footprint, an example being Urban Outfitters (not that this particular brand is recommended here). There is also significant shoppers goods demand for gift & novelty stores (5,600 square feet), hobby/toy and game stores (6,900 square feet), electronics stores (3,500 square feet), sporting goods stores (5,600 square feet), and miscellaneous shoppers goods stores (7,900 square feet). There is also excess demand for most other shoppers goods, although again, some of this sales growth potential will be absorbed by existing businesses.

Randall Gross / Development Economics
USA: 2311 Connecticut Ave Ste 206 Washington DC 20008. Tel 202-332-7430. Fax 332-1853. [email protected] AFRICA: African Development Economic Consultants (ADEC). 27-11-728-1965. Fax 728-8371. [email protected]
44
Eating & Drinking. There is warranted demand for additional full-service restaurants in the area, although within the bounds of about 8,000 square feet, total. There is the need to diversify the dining experience in Uptown. At present, there is traditional pub food, Italian, and Thai. There are opportunities for additional ethnic restaurants, the clustering of which can help to create a critical mass to attract a destination dining clientele. Similarly, there is the opportunity to open a drinking establishment in Uptown or at least to expand the drinking component of restaurants. Entertainment. There is significant unmet demand at present and up to about 40,000 square feet of demand within five years for entertainment venues in Uptown. This is a gap identified by residents and consumers alike, which has been confirmed and quantified by the market analysis. There are multiple opportunities to integrate entertainment venues, which at one-time existed in the form of the State Theater in Uptown. Personal Services. The opportunities for additional personal service uses are limited to about 2,000 square feet (sufficient for 1-2 additional businesses or growth in sales to existing businesses), unless unique, specialized businesses are attracted that provide a one-of-a-kind service on a regional basis. Uptown already has a relatively diverse mix of personal service establishments, although the affluence of households in the primary trade area warrants this supply.
Recommended Mix Findings from the market analysis, coupled with input from the survey research and other information, provide the basis for a recommended business mix for Uptown. These recommendations complement the existing business uses that already exist within the district, or expand upon them with additional square footage. Given the strength of the market in this area, there are multiple opportunities for expansion of the existing business district to capture a larger share of the trade area market base. Whether or not this additional retail use can be accommodated within the existing district is explored further in the section that follows, providing strategic development recommendations. The Uptown district can be strengthened and expanded through the addition of a maximum 113,100 square feet of retail/commercial business use. The recommended business mix does not aim to alter the overall character of the Uptown district, which already operates a successful formula oriented to specialty businesses functioning within a walkable, pleasant, traditional Main Street model. However, several new businesses can strengthen the existing mix by expanding the breadth of the primary market base and deepening the market for specialty destination goods.
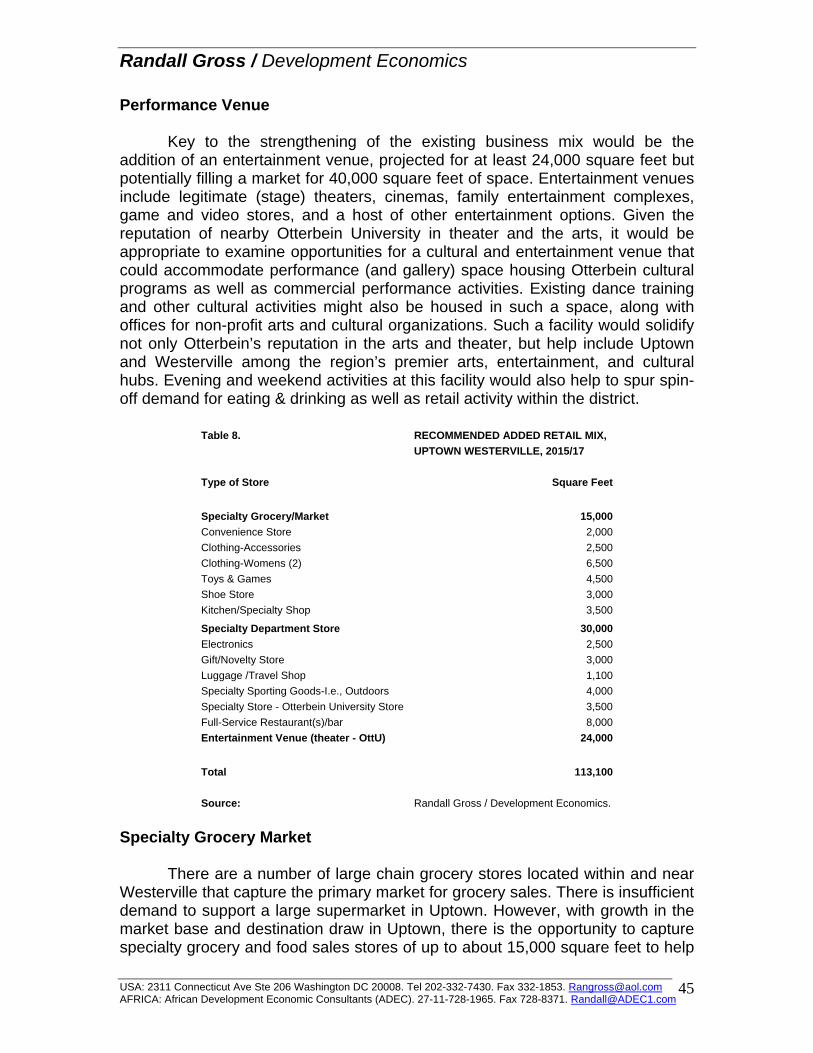
Randall Gross / Development Economics
USA: 2311 Connecticut Ave Ste 206 Washington DC 20008. Tel 202-332-7430. Fax 332-1853. [email protected] AFRICA: African Development Economic Consultants (ADEC). 27-11-728-1965. Fax 728-8371. [email protected]
45
Performance Venue Key to the strengthening of the existing business mix would be the addition of an entertainment venue, projected for at least 24,000 square feet but potentially filling a market for 40,000 square feet of space. Entertainment venues include legitimate (stage) theaters, cinemas, family entertainment complexes, game and video stores, and a host of other entertainment options. Given the reputation of nearby Otterbein University in theater and the arts, it would be appropriate to examine opportunities for a cultural and entertainment venue that could accommodate performance (and gallery) space housing Otterbein cultural programs as well as commercial performance activities. Existing dance training and other cultural activities might also be housed in such a space, along with offices for non-profit arts and cultural organizations. Such a facility would solidify not only Otterbein’s reputation in the arts and theater, but help include Uptown and Westerville among the region’s premier arts, entertainment, and cultural hubs. Evening and weekend activities at this facility would also help to spur spin-off demand for eating & drinking as well as retail activity within the district.
Table 8. RECOMMENDED ADDED RETAIL MIX,
UPTOWN WESTERVILLE, 2015/17
Type of Store Square Feet
Specialty Grocery/Market 15,000
Convenience Store 2,000
Clothing-Accessories 2,500
Clothing-Womens (2) 6,500
Toys & Games 4,500
Shoe Store 3,000
Kitchen/Specialty Shop 3,500
Specialty Department Store 30,000
Electronics 2,500
Gift/Novelty Store 3,000
Luggage /Travel Shop 1,100
Specialty Sporting Goods-I.e., Outdoors 4,000
Specialty Store - Otterbein University Store 3,500
Full-Service Restaurant(s)/bar 8,000
Entertainment Venue (theater - OttU) 24,000
Total 113,100
Source: Randall Gross / Development Economics.
Specialty Grocery Market There are a number of large chain grocery stores located within and near Westerville that capture the primary market for grocery sales. There is insufficient demand to support a large supermarket in Uptown. However, with growth in the market base and destination draw in Uptown, there is the opportunity to capture specialty grocery and food sales stores of up to about 15,000 square feet to help

Randall Gross / Development Economics
USA: 2311 Connecticut Ave Ste 206 Washington DC 20008. Tel 202-332-7430. Fax 332-1853. [email protected] AFRICA: African Development Economic Consultants (ADEC). 27-11-728-1965. Fax 728-8371. [email protected]
46
anchor the district. There are several specialty grocery chains represented in the Columbus market that could have an interest in locating a unit in Uptown. There are also opportunities for creating a specialty food market through collaboration between several smaller, local specialty and convenience food operators (e.g., bakery, butchery, green grocer, etc). Integration of the existing bakery into a larger mixed-specialty food market complex could be highly desirable because it helps to retain the local flavor of Westerville without introducing chain stores. Higher education levels and affluence in the Primary Trade Area help support specialty food stores at a higher rate than would be found in other parts of the market. Specialty Department Store As noted previously, there is potential for a specialty department store within the district and such a store could (along with the entertainment venue and specialty grocer) help anchor the district in the same way that shopping centers are anchored by larger stores. A general merchandise (GM) store of up to 30,000 square feet is recommended to help anchor the district. The challenge is in identifying a local entrepreneur (in keeping with the local flavor), or even in locating specialty GM chains that utilize a floor plate of this modest size. The example has been given of Urban Outfitters (5,000 to 20,000 square feet) along with its sister brand Anthropologie, but there are also others in this market. There may be other opportunities to attract unique GM stores to Westerville as their only unit in the Columbus market. These opportunities can be tested by the consultant through direct outreach. Other Businesses in the Mix Other businesses included in the recommended mix include a 2,500 square-foot accessories store, such as a unique hand-made or locally-designed business selling handbags, belts, hats, or other clothing accessories. About 6,500 square feet of apparel stores is recommended, to include at least one store appealing to the younger female consumer or young budget-conscious mother. A 4,500 square-foot toy & game shop is recommended, particularly one that carries hand-made, organic, or other “sustainable” merchandise for children and adults, Such businesses will complement some of the existing establishments in Uptown that carry children’s clothes or hand-made homeware. A 2,500 to 3,000 square-foot shoe store is recommended, helping to fill an existing gap in the market and cater to growing demand. A 3,500 square-foot kitchen specialty supply shop is also recommended, one which could feature cooking classes, celebrity chef demonstrations, and local / regional food products. Other recommended businesses include a 2,000 to 2,500 square foot electronics store that carries telephone accessories, electronic games and associated products. A total 3,000 square feet of gifts and novelties is recommended, such as in a shop specializing in local tourism products – i.e.,

Randall Gross / Development Economics
USA: 2311 Connecticut Ave Ste 206 Washington DC 20008. Tel 202-332-7430. Fax 332-1853. [email protected] AFRICA: African Development Economic Consultants (ADEC). 27-11-728-1965. Fax 728-8371. [email protected]
47
Underground Railroad and temperance era commemorative items, perhaps celebrating Westerville’s historic moniker as the “Dry Capital of the World.” An 1,100 square-foot luggage, leather and travel shop would also be an appropriate addition to the district. Also related to the gift sector is the opportunity for a 1,000 to 3,000 square-foot shop specializing in Otterbein University-related merchandise. Such a shop would cater not only to university students and their families, but also to visitors, alumni, and local patrons and fans of the school. Building on the “co-branding” of an entertainment or cultural venue with Otterbein, a specialty shop could also offer merchandise oriented to theater arts and performance. Uptown already offers four small, independent sporting goods stores. There is the opportunity to build on this market by offering up to 4,000 square feet in additional selections of complementary sporting goods, such as outdoor equipment (i.e., camping, hiking, boating, fishing gear). Sporting goods stores are among the few retail category businesses that consistently continue to flourish in small town Main Street locations. Finally, the recommended mix includes up to 8,000 square feet of additional restaurant and bar space to help diversify the existing dining mix while adding to the destination draw of the district as a location for dining choices. Such additions could not only help existing restaurants (by cementing the district’s reputation as a dining destination), but also other retail businesses such as the wine shop and others.
Summary Uptown must compete with a broad range of local convenience centers, community shopping centers, regional malls, specialty centers, and similar “Main Street” nodes to capture its “fair share” of market demand. Uptown is well-positioned to capture growth in the market, especially among affluent, well-educated shoppers within the Primary Trade Area and surrounding areas. This growth translates into potential for up to 190,000 square feet of warranted retail space by 2015, particularly for convenience, entertainment, eating & drinking, and shoppers goods. Some of this growth potential will be captured through increased sales at existing Uptown businesses.
Based on the market findings, coupled with survey research and other inputs, there is the opportunity for Uptown to attract an additional 113,000 square feet of retail through a recommended tenant mix that would be anchored by a performance / entertainment venue housing Otterbein University and commercial programming, a specialty food market featuring local products, and a specialty department store. The mix is complemented by the addition of local history and college-related merchandise, apparel and accessory stores, more diverse full-service restaurants, outdoor equipment, shoe store, and other businesses with a focus on locally-made and specialty merchandise.

Randall Gross / Development Economics
USA: 2311 Connecticut Ave Ste 206 Washington DC 20008. Tel 202-332-7430. Fax 332-1853. [email protected] AFRICA: African Development Economic Consultants (ADEC). 27-11-728-1965. Fax 728-8371. [email protected]
48
Section 5. STRATEGIC PLAN A strategic plan has been developed based on the findings of the market analysis and other inputs, to help guide marketing, development, and management within the Uptown business district for the next five to ten years. The strategic plan builds on best practices for marketing such districts but focuses on the particular strengths of Uptown and its target markets. The strategic plan is meant as a starting point for discussion among key stakeholders, including the City of Westerville (planning and economic development departments), Westerville Uptown Merchants Association (WUMA), the CVB, Chamber of Commerce, Otterbein University, and other key players.
Marketing Strategy
A marketing strategy is provided in order to strengthen the destination draw and diversify the market base for Uptown businesses. A discussion of the marketing brand and proposed marketing themes is provided below that could tie businesses together and thereby create greater drawing power. Best practices among several competitors in the region are also discussed. Finally, specific recommendations are made in terms of marketing and business recruitment to help achieve these objectives. Brand and Themes Uptown Westerville already has a strong brand identity relating to its traditional “Main Street” image. Consumers are drawn by Uptown’s attractive environment, its “walkability” and restaurants and specialty stores that focus on the “All-American” family-friendly nature of the community. Whether existing marketing and advertising campaigns serve to strengthen this identity is a matter for further discussion later in this section. But in general, the area has a positive association in the broader market with a pleasant, small town experience. There is, however, the need to articulate and strengthen several key themes that can be used by existing and potential new businesses to help capture the destination market. These themes are explored below. Local & Sustainable Products. Uptown Westerville already has a cluster of businesses that feature products made locally or regionally. A few businesses focus on this element in their marketing. Because the target markets for Uptown tend to be higher-educated and more affluent shoppers, there are benefits to marketing that focuses on the local origins and sustainability of the district’s products. The sustainable qualities of the product are recognized and can appeal to these target higher-educated and affluent markets. Therefore,

Randall Gross / Development Economics
USA: 2311 Connecticut Ave Ste 206 Washington DC 20008. Tel 202-332-7430. Fax 332-1853. [email protected] AFRICA: African Development Economic Consultants (ADEC). 27-11-728-1965. Fax 728-8371. [email protected]
49
drawing more attention to this unique characteristic of Uptown can be beneficial. Efforts to increase the stocking, merchandising, and visibility of these products should be encouraged to help strengthen this concept. “College Town.” Students, their families, and friends represent a small but recognized share of the existing market base within Uptown. More importantly, Otterbein University has a growing reputation and appeal that is already co-branded and marketed with Westerville and its attractive Uptown district. There is the opportunity to enhance this relationship further through more pro-active marketing of Uptown as part of the quintessential American “college town,” which serves to strengthen Uptown’s existing Main Street image. College-oriented areas are attractive to young people for meeting and setting social networks, but they also appeal to adults and seniors for their liveliness, street life and overall livability.
The recruitment and integration of several college-oriented businesses is recommended, such as a clothing store specializing in apparel for youth, gift shop featuring Otterbein University materials, campus-style pub, and/or sporting goods store with camping and other recreation gear. The business(es) should not be targeted solely to Otterbein students, since the breadth of the market is insufficient, but should appeal to college students and visitors throughout the Columbus region.
Also, as recommended previously, there is the opportunity to create a
symbiotic relationship between a commercial operator and the university to establish a cultural and entertainment venue in Uptown that could integrate the university’s theater and arts programs along with commercial entertainment uses. A theater supply or design shop might also be co-branded with the university. Programming & Design Uptown has strong, existing programming and design components as part of its marketing. There are several annual and monthly events sponsored by local organizations in Uptown that help to create a festive atmosphere and raise the exposure of the district. While the Farmers’ Market and Saturday Market are popular with local residents and visitors, there could be some confusion to those who are not regular visitors about the difference between the two markets (other than the days on which they are held and the slightly different seasons), based on the marketing materials. Certainly there are differences between the vendor mix and programming for these two events, but those differences are not as clear from web sites and advertising materials. The 4th Fridays has also proven to be very popular, bringing people to Uptown on a regular basis. The regular wine tastings, art walks, and other regular events sponsored by local organizations also help to successfully enliven Uptown.

Randall Gross / Development Economics
USA: 2311 Connecticut Ave Ste 206 Washington DC 20008. Tel 202-332-7430. Fax 332-1853. [email protected] AFRICA: African Development Economic Consultants (ADEC). 27-11-728-1965. Fax 728-8371. [email protected]
50
There may also be the opportunity for at least one, larger annual event that could generate a “buzz” for Uptown that would help it attract more destination visitors from outside of its normal market base. An Otterbein-related theater and arts festival, for example, might help strengthen the university’s and Uptown’s reputation as an arts hub. Another option might be an Americana Festival to feature local foods, local arts & craft, live music performances, historic re-enactments (i.e., abolitionist speeches or a temperance “march”), and other creative programming. Urban Design. Streetscape and urban design elements also play an important role in marketing for Uptown. As noted before, the Uptown area has high-quality public streetscape infrastructure that is well-designed and maintained. The banner program and flower baskets help splash color into the streetscape. A new kiosk program will integrate maps and valuable information into the physical environment, especially for visitors who may not be aware of the local offerings. That being said, there is a need to attract more day trippers and visitors who are not already familiar with Uptown in order for the kiosk program to have added value for the City. At present, most visitors have been to Uptown before, so the utility of kiosks needs to be established. Programming (such as an annual theater arts festival), advertising, and recruitment of key anchors and businesses will help to attract more destination visitors. Signage is controlled through the district’s review process. While this has resulted in an attractive, uncluttered environment, there may be a need to encourage some creativity in signage design and to ensure that businesses have visible signage. (In some cases, site reconnaissance identified businesses without visible identity signage). The local artist community might be encouraged to become more active in actually producing colorful and attractive signs for the businesses in the area (in coordination with the review board), again strengthening the concept of sustainable, local production. For example, when new businesses move into the district, or when existing businesses desire a new sign, local artisans might be available on call to assist in the design and production of the signage. Some of this may already be done on an ad hoc basis, but the City could help formalize this as a program. Directional signage is an area that could use more attention. First, there is the need for more creative approaches to directing traffic into designated parking areas. Since there appears to be a disconnect between the availability of parking and the perceptions of consumers, a high priority should be to focus on signage or creative mechanisms to direct drivers to accessible parking. There is also the need to direct regional commuters and tourists from the Interstate highway system into Uptown for destination touring and shopping. Added directional signage on and/or from I-270 and I-71 could be very helpful in increasing Uptown’s exposure to pass-through traffic on the interstates. Directional signage on Route 3 from I-270 is also recommended.

Randall Gross / Development Economics
USA: 2311 Connecticut Ave Ste 206 Washington DC 20008. Tel 202-332-7430. Fax 332-1853. [email protected] AFRICA: African Development Economic Consultants (ADEC). 27-11-728-1965. Fax 728-8371. [email protected]
51
Gateways. There may also be a need to re-examine the gateway design programs for the Uptown area to enhance the visibility of gateways and identity markers. The streetscape elements (e.g., vintage street lamps) generally help to create a separate identity for Uptown. This identity could be strengthened by creating more visible gateway and identity markers. At present the identity “rings” found at the intersection of State and Main streets, while very attractive, are sometimes difficult to read from a passing car or even by pedestrians.
Perhaps there are other design approaches for signaling entry into the district that would encourage commuters to stop. This is particularly relevant at the southern end of the district, which is marked by the Sunoco Gas Station and the CVS. Certainly these are successful and generally attractive businesses but, ironically, they are two of the only chain stores in the district. The image of Uptown is therefore set by these two businesses and there is a need to determine 1) whether there is not a better place to mark the entrance into the district and 2) whether there are certain gateway elements that would help further set this entrance apart. At a very minimum, there is a need to encourage further landscaping of the Sunoco and to examine incentives for establishing some unique design characteristics for this store (in keeping with the branded colors, logos and signage). Marketing Program A full strategic marketing plan should be developed for WUMA, in collaboration with sister organizations and with the full support of the City of Westerville. This marketing plan should focus on marketing mechanisms, including advertising budgets, for reaching target markets more effectively and consistently. Consistency is key - at present, there are two separate merchant web sites marketing Uptown which seem to offer similar information yet with different imagery and brand identity. The City of Westerville, the WVCB, and Chamber also market Uptown in various attractive ways but again without a consistent brand and marketing identity.
A high priority would be to establish consistency in the brand (including the use of consistent logos and materials) translated through color and images. Given that various groups are using different logos to identify Uptown, there is a need for better coordination. Variations on the consistent logo could be designed for target markets. Thus, variation in the message should relate not to which organization happens to be marketing Uptown, but to the target markets for Uptown businesses. The marketing plan should establish budgets for each element, including the following:

Randall Gross / Development Economics
USA: 2311 Connecticut Ave Ste 206 Washington DC 20008. Tel 202-332-7430. Fax 332-1853. [email protected] AFRICA: African Development Economic Consultants (ADEC). 27-11-728-1965. Fax 728-8371. [email protected]
52
Advertising Promotions (coupons, etc) Web site Social media (Facebook, Twitter, etc) Programming
o Regular events and Holidays o Annual event
Signage (i.e., a budget for assisting merchants in hiring local artists)
Advertising & Promotions. The present advertising approach is focused on a weekly shopper’s newspaper distributed to about 30,000 households, but mainly in the Westerville area. There is a need to expand advertising to destination shoppers, particularly affluent, well-educated “day tripper” households within the destination trade area. The types of media that reach this market are typically fashion-oriented and aficionado magazines, theater programs, and targeted web sites rather than mass-market broadcast media or discount papers. Uptown’s brand is now weighed heavily to specialty markets, rather than the discount and used merchandise markets that may have dominated in the past.
Tourist marketing should be oriented to those tourists that are already
visiting the Columbus area as a destination, particularly through packages with other family-friendly attractions. A clear opportunity is some form of joint packaging with the Columbus Zoo and Aquarium. Dublin has initiated programs to co-market with the zoo and there are opportunities for Westerville to do the same. Co-branding, promotions, and other marketing collaborations with theater and arts organizations would also benefit Uptown, given its cadre of art galleries as well as the presence of Otterbein University and its exceptional theater program. Web Site. As noted previously, there is currently some confusion caused by the presence of two web sites dedicated to Uptown businesses. There is a need for one, strong, and very interactive web site that offers promotions online and opportunities for rewards. The main WUMA web site is thoughtful and attractive, but has a long list of links as a focus on the main page. The web site would benefit from integration of more images of Uptown and its shops and events, as well as artwork created by the local artisans. Separate pages might focus on key themes like local, sustainable products and food, the college town atmosphere/shopping, or special events. Social Media. Uptown has successfully linked into social media such as Facebook and Twitter. There may be an opportunity for more pro-active engagement with target markets such as through “crowd-sourcing” techniques that bring groups of niche markets together for cooking demonstrations, dining out, or other events and to gather their input on what else they would like to see happen in Uptown.

Randall Gross / Development Economics
USA: 2311 Connecticut Ave Ste 206 Washington DC 20008. Tel 202-332-7430. Fax 332-1853. [email protected] AFRICA: African Development Economic Consultants (ADEC). 27-11-728-1965. Fax 728-8371. [email protected]
53
Business Recruitment A recommended business mix has been provided in this report as a guide for attracting and recruiting businesses that would help to fill existing market gaps and also reach the potential market base. A focus would be given to attracting (or establishing) anchor uses such as a cultural/entertainment venue, general merchandise store, and specialty local food market. However, there are other target businesses that are also critical for strengthening the existing mix. Business recruitment can be accomplished through several approaches, depending on the target use. In the case of an anchor entertainment/cultural venue, the approach should focus on gaining buy-in from Otterbein University (or other cultural program operator) as a partner in establishing such as venture. Then, outreach would be conducted to entertainment organizations with an interest in reaching affluent, well-educated markets like Westerville and others in the region. The food market may also take an approach of integrating some existing local business enterprises as equity stakeholders. For example, specialty food businesses like the bakery may have an interest in being part of a larger food venue with destination market potential. Outreach to kitchenware businesses, specialty grocers, or local entrepreneurs might be appropriate for integrating these uses into the broader food market concept. Identifying local entrepreneurs with experience and interest in specialty businesses would help to retain a strong element of local ownership. Incentives such as low-interest building improvement, merchandise stock, or equipment loans might be targeted specifically to locally-owned businesses. An overall outreach program should be developed for attracting and recruiting some of the other businesses, such as shoe stores or sporting goods stores that otherwise may not find an experienced local entrepreneur.
Development Recommendations Uptown has a fairly solid urban fabric and there are few opportunities within the heart of the district along State Street for physical expansion. However, there are opportunities for densification and expansion to the east and west, and to some extent in the southern portions of the district which are less “walkable.” While it is not recommended that the district be expanded too far beyond its relatively tight pedestrian-oriented core, the opportunities for densification should be explored further in order to create more critical mass as a regional destination. Overall, there is a need to identify redevelopment sites for future expansion of the district, including three key sites for mixed-use redevelopment to accommodate anchor uses along with ancillary retail as recommended in the Business Mix.

Randall Gross / Development Economics
USA: 2311 Connecticut Ave Ste 206 Washington DC 20008. Tel 202-332-7430. Fax 332-1853. [email protected] AFRICA: African Development Economic Consultants (ADEC). 27-11-728-1965. Fax 728-8371. [email protected]
54
South & North “Anchor” Sites Potential for infill and densification include a few scattered individual sites located in the southern portions of the district, There are advantages for maintaining some of the lower density sites (such as older houses), which contribute to the “small town” character of Westerville and provide “breathing” room within the district. That being said, several vacant sites should either be programmed for parks, event space, and/or heritage functions; or they should be developed to accommodate mixed-use including ground-floor retail. The southern end of the district, either north of Walnut or just outside of the district south of Walnut, would be appropriate as a location for one of the “anchors” recommended for the business mix.
An appropriate anchor may be a general merchandise specialty store or a food market. The site should be large enough to accommodate the 15,000 square-foot grocery store or the 30,000 square-foot general merchandise store, plus ancillary retail or line shops consistent with the recommended mix. If one of the proposed “anchor” uses is designated for the southern end of the district, then the other should be targeted or attracted to the northern end of the district. Perhaps the best site at the northern end of the district would be the Parking Lot on East Home Street that is presently owned by the Church of the Messiah, as well as the municipal parking lot. However, it is understood that the church has planned development of additional facilities on this site. There is the possibility that the church facility could be integrated into a mixed-use complex with a commercial use (and ideally, structured parking), depending on the objectives of the church and the uses included in the new facility. As such, there is the opportunity for integration of proposed and potential new uses at this site. Otherwise, there are few site opportunities for anchor development at the northern end of the district or beyond, which is dominated by single-family houses. Cultural & Entertainment Center The third “anchor” use, an entertainment and/or cultural venue, should ideally be situated within the heart of the district as close as possible to the center. In a previous era, this function was accommodated at the State Theater, but this facility has since been converted to retail use. The site would need to be sufficient and appropriate to accommodate the proposed 20,000 to 30,000 (e.g., 24,000) square-foot facility as well as ancillary retail shops. Infill Development There is also the need to examine other opportunities for expansion of the business base through infill and redevelopment. Again, a key long-term opportunity may relate to the possibility of creating more of a walkable district in

Randall Gross / Development Economics
USA: 2311 Connecticut Ave Ste 206 Washington DC 20008. Tel 202-332-7430. Fax 332-1853. [email protected] AFRICA: African Development Economic Consultants (ADEC). 27-11-728-1965. Fax 728-8371. [email protected]
55
the blocks formed by State Street (west), East College or East Main (south), North Vine Street (east) and East Home or East Lincoln Street (north). These blocks are already included in the special Uptown district for zoning purposes and there are existing commercial and mixed uses within these blocks. Some of the other retail uses recommended based on the market analysis would be appropriate for this area, particularly if clustered with and/or anchored by one of the three “anchor” uses. Expansion of the business district to the east would help to create more of a “walkable” district which distributes auto and pedestrian traffic somewhat beyond the narrow State Street Corridor. The zoning district and design standards appear to already place significant controls on the form of development within the district, so there is less fear than in other locations that new development will distract from the historic context and walkable character of the district. Nevertheless, it is important for the City to encourage the highest-quality and most appropriate scale of development consistent with the local context, as it has with the Tea House site.
District Management Management of Uptown’s streetscape, marketing, and development is a critical factor in its success. Making sure that the organizational structure assigns responsibility for various functions appropriately, that there is continued stakeholder participation, and that key actions are carried out effectively and consistently is paramount. Uptown, unlike many other commercial districts, has a relatively successful set of structures in place, along with interested and committed stakeholders. Several opportunities for strengthening these structures even further are discussed below. Organizational Structure There is an existing framework for accomplishing necessary actions within Uptown supported by several different organizations and agencies. Westerville Uptown Merchants Association (WUMA) has primary responsibility for organizing the merchants, disseminating information, and marketing the district as a place to shop and dine. Specifically, the WUMA mission is to:
“…present ourselves as a unified and cohesive voice on behalf of our member businesses in marketing, advertising and maintaining and strong business atmosphere in the uptown area.”5
The Westerville Area Chamber of Commerce and the Westerville
Convention and Visitors Bureau have responsibility for promoting the interests of local business and marketing the broader business base of Westerville. The Chamber also counts as part of its mission to enhance the community’s quality of
5 Westerville Uptown Merchants Association website.

Randall Gross / Development Economics
USA: 2311 Connecticut Ave Ste 206 Washington DC 20008. Tel 202-332-7430. Fax 332-1853. [email protected] AFRICA: African Development Economic Consultants (ADEC). 27-11-728-1965. Fax 728-8371. [email protected]
56
life and promote its growth. The Westerville Convention and Visitors Bureau aims to attract tourists and other visitors to the city.
Various individual businesses and non-profit organizations have taken on responsibility for specific niche activities, such as art walks or wine tastings that help to enliven the district. The City of Westerville’s Department of Planning & Development has primary responsibility for planning, regulation, development facilitation, and streetscape improvements within Uptown (and citywide), while the Economic Development Administrator has responsibility for overseeing administration of the city’s incentive programs, for assisting existing businesses, and for recruiting new businesses to the city. Other municipal agencies provide various services in Uptown. Recommendations for enhancing and strengthening management in the district are summarized below. Marketing Management Several organizations have responsibility for marketing in Westerville, including the marketing and promotion of Uptown businesses. Clearly, WUMA is most closely aligned with the Uptown business district itself, drawing its membership from within the district. A more focused marketing effort, including advertising, events and other components, is recommended for WUMA, as outlined earlier in this section. The target markets for WUMA should relate to Westerville residents but also to destination shoppers from households within the trade area (primarily the northern half of Franklin County and surrounding areas). The Westerville Visitors and Convention Bureau (WVCB) has been very active in promoting regular events in Uptown. While the WVCB does participate in regional tourism initiatives (i.e., antiques tours), there is a need to also focus the WVCB more on attracting tourists who visit the Columbus region and on building relationships with area tourist attractions. Several marketing initiatives are outlined earlier in this section, such as the concept of co-branding with the Columbus Zoo for tourists and day trippers. The WVCB might focus on advertising and promotions in area hotels, tourism-oriented web sites, and targeted materials. For example, few of the primary web-based Columbus shopping guides for tourists even identify Westerville as a location for shopping in the region. A high priority would be to at least make sure that free shopping guides aimed at tourists include Westerville in the menu of shopping (as well as tourism) options for visitors. Other initiatives might relate to more pro-active co-branding associated with Otterbein University, since the largest share of existing out-of-town visitors appear to be family and friends of university students. Business recruitment should be the purview of the City of Westerville’s Economic Development staff members, who, among other things, identify sites and facilities for business locations. While Uptown’s business recruitment strategy is very different than that for Westerville’s office parks and other “green field” sites, the efforts in Uptown are equally important if somewhat more

Randall Gross / Development Economics
USA: 2311 Connecticut Ave Ste 206 Washington DC 20008. Tel 202-332-7430. Fax 332-1853. [email protected] AFRICA: African Development Economic Consultants (ADEC). 27-11-728-1965. Fax 728-8371. [email protected]
57
complicated by the redevelopment focus. Economic development works closely with the Planning department on redevelopment efforts within Uptown. Funding. Funding for marketing efforts might be generated through participation in programs such as the Main Street Program or the establishment of a business improvement district (BID), subject to Ohio State law on the operation of BIDs. Many BIDS are established where the funds generated by a property levy are targeted to the funding of district-wide marketing and business recruitment efforts. In some locations, such funds might also be used for urban design elements, cleaning and maintenance, management, information services, safety, and security. Many of these elements are already provided through the network of various public and private services in Uptown, but marketing at present is wholly dependent on dues raised directly from merchants. A levy would help distribute the burden of funding marketing operations more evenly to property owners as well as merchants. Parking & Traffic Management There is a need for a parking & traffic management plan to guide the City and ensure sufficient capacity as well as visibility and exposure for parking to support current business and future growth within the Uptown district. Despite the best efforts of city planners and urbanists to encourage walking and use of public transit within these districts, a destination like Uptown in the Columbus region will (at least for the near term) require parking to accommodate consumers. Oftentimes, there is sufficient parking capacity within an urban commercial district but this capacity is not well-managed or readily apparent to the consumer. This may represent the case in Uptown, but a parking management assessment would identify opportunities for improvement. Experience suggests that the issues with parking often relate more to perceptions than reality. Certainly there are issues with students “hopping” from space to space to stay within time limits and store employees using valuable street-front spaces. Such issues can be controlled through policy and better enforcement of existing rules. But there may also be an issue perhaps with visibility. Uptown must compete with shopping malls and centers that have ample, free, visible “seas” of parking at their front doors. Even though consumers often must walk great distances across these parking lots to reach the business, their perception is of convenient, free parking. An urban business district should not, of course, displace street-front businesses with parking lots, especially when the very “walkability” of the district is what attracts people to Uptown. Rather, the key is to enhance visibility such as through directional signage, including creative approaches to guiding drivers to parking areas. There may also be the opportunity for businesses or WUMA (in coordination with the City) to invest in valets to assist with parking at peak periods such as dinnertime. Promoting free valet parking at certain hours could be part of the overall marketing pitch that sets Uptown apart from other districts.
Randall Gross / Development Economics
USA: 2311 Connecticut Ave Ste 206 Washington DC 20008. Tel 202-332-7430. Fax 332-1853. [email protected] AFRICA: African Development Economic Consultants (ADEC). 27-11-728-1965. Fax 728-8371. [email protected]
58
Traffic Management. The consumer’s perception of high traffic volumes on State Street (despite the relatively modest numbers) relates to “congestion” in the urban environment and the slowing of traffic through Uptown during peak hours. There is a variety of tools that can be employed through planning and traffic engineering to alleviate this issue, not the least of which is the diversion of some traffic to parallel streets and gradual expansion of Uptown businesses to the east and west. This would help create more of a “grid” or district that somewhat disperses traffic, as opposed to a “funnel” pattern for all traffic to move north and south along State Street. There may not be the traffic volumes or LOS (level-of-service) issues to warrant such diversions, but it’s just an example of a tool that can be used to address congestion issues. Probably more important in the short term is the need to create more efficient parking circulation so that traffic does not slow as consumers search for street parking.
Action Plan The following Action Plan provides steps towards implementation of several of the key recommendations generated by this market analysis. The Action Plan includes descriptions of specific steps to be undertaken within the next two years, coupled with the timetable for these actions, responsible parties, indicative costs, and possible sources of funding. Ultimately, these efforts are meant to strengthen the existing Uptown district as a community amenity, a shopping destination, and a wonderful component of Westerville’s high quality of life.

Randall Gross / Development Economics
USA: 2311 Connecticut Ave Ste 206 Washington DC 20008. Tel 202-332-7430. Fax 332-1853. [email protected] AFRICA: African Development Economic Consultants (ADEC). 27-11-728-1965. Fax 728-8371. [email protected]
59
ACTION PLAN
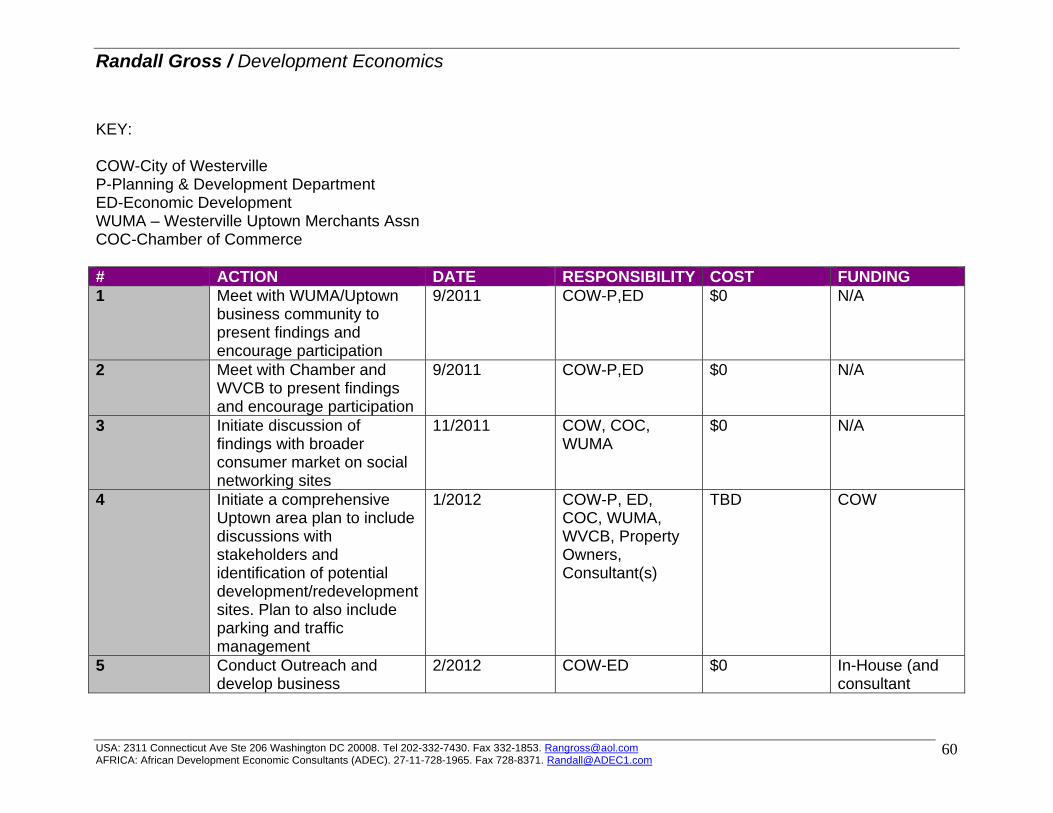
Randall Gross / Development Economics
USA: 2311 Connecticut Ave Ste 206 Washington DC 20008. Tel 202-332-7430. Fax 332-1853. [email protected] AFRICA: African Development Economic Consultants (ADEC). 27-11-728-1965. Fax 728-8371. [email protected]
60
KEY: COW-City of Westerville P-Planning & Development Department ED-Economic Development WUMA – Westerville Uptown Merchants Assn COC-Chamber of Commerce # ACTION DATE RESPONSIBILITY COST FUNDING 1 Meet with WUMA/Uptown
business community to present findings and encourage participation
9/2011 COW-P,ED $0 N/A
2 Meet with Chamber and WVCB to present findings and encourage participation
9/2011 COW-P,ED $0 N/A
3 Initiate discussion of findings with broader consumer market on social networking sites
11/2011 COW, COC, WUMA
$0 N/A
4 Initiate a comprehensive Uptown area plan to include discussions with stakeholders and identification of potential development/redevelopment sites. Plan to also include parking and traffic management
1/2012 COW-P, ED, COC, WUMA, WVCB, Property Owners, Consultant(s)
TBD COW
5 Conduct Outreach and develop business
2/2012 COW-ED $0 In-House (and consultant
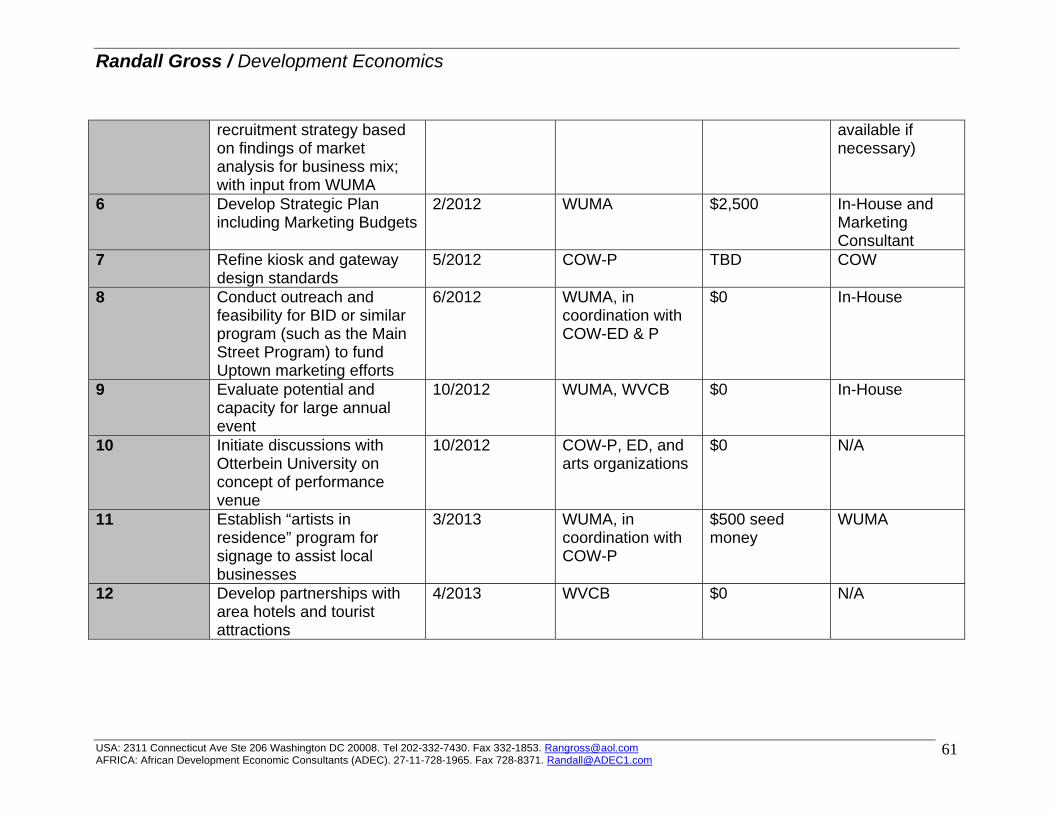
Randall Gross / Development Economics
USA: 2311 Connecticut Ave Ste 206 Washington DC 20008. Tel 202-332-7430. Fax 332-1853. [email protected] AFRICA: African Development Economic Consultants (ADEC). 27-11-728-1965. Fax 728-8371. [email protected]
61
recruitment strategy based on findings of market analysis for business mix; with input from WUMA
available if necessary)
6 Develop Strategic Plan including Marketing Budgets
2/2012 WUMA $2,500 In-House and Marketing Consultant
7 Refine kiosk and gateway design standards
5/2012 COW-P TBD COW
8 Conduct outreach and feasibility for BID or similar program (such as the Main Street Program) to fund Uptown marketing efforts
6/2012 WUMA, in coordination with COW-ED & P
$0 In-House
9 Evaluate potential and capacity for large annual event
10/2012 WUMA, WVCB $0 In-House
10 Initiate discussions with Otterbein University on concept of performance venue
10/2012 COW-P, ED, and arts organizations
$0 N/A
11 Establish “artists in residence” program for signage to assist local businesses
3/2013 WUMA, in coordination with COW-P
$500 seed money
WUMA
12 Develop partnerships with area hotels and tourist attractions
4/2013 WVCB $0 N/A

Randall Gross / Development Economics
USA: 2311 Connecticut Ave Ste 206 Washington DC 20008. Tel 202-332-7430. Fax 332-1853. [email protected] AFRICA: African Development Economic Consultants (ADEC). 27-11-728-1965. Fax 728-8371. [email protected]
62
(page left intentionally blank)

Randall Gross / Development Economics
USA: 2311 Connecticut Ave Ste 206 Washington DC 20008. Tel 202-332-7430. Fax 332-1853. [email protected] AFRICA: African Development Economic Consultants (ADEC). 27-11-728-1965. Fax 728-8371. [email protected]
63
Appendix Tables

Randall Gross / Development Economics
USA: 2311 Connecticut Ave Ste 206 Washington DC 20008. Tel 202-332-7430. Fax 332-1853. [email protected] AFRICA: African Development Economic Consultants (ADEC). 27-11-728-1965. Fax 728-8371. [email protected]
64
Table A1. WARRANTED RETAIL DEMAND BY USE,
UPTOWN WESTERVILLE, 2010 AND 2015
Gross Demand (Sq Ft) Existing Warranted Type of Good 2010 2015 Uses Demand
Convenience
Grocery 14,293 16,078 - 16,078
Convenience 1,776 1,992 - 1,992
Specialty Food 5,337 5,968 2,505 3,463
Health/Pers Care 10,572 11,906 11,602 304
Gas 4,045 4,544 1,936 2,608
Misc Conv 7,781 8,304 6,056 2,249
Sub-Total 43,803 48,792 22,099 26,694
Shoppers Goods
Apparel/Access 17,295 19,071 5,052 14,020
Jewelry 3,260 3,607 2,615 992
Shoes 3,885 4,278 - 4,278
Furniture 12,574 13,950 10,500 3,450
Home Furnishings 15,108 16,617 14,299 2,319
Appliances 2,183 2,415 - 2,415
Hardware/Bldg 1,651 1,797 - 1,797
Garden Supply 3,621 3,998 1,716 2,282
Gen Mdse/Dept 34,664 38,488 - 38,488
Auto Dealers 2,304 2,547 - 2,547
Auto Supply 2,554 2,843 - 2,843
Electronics/Comp 3,169 3,529 - 3,529
Books/Music 3,515 3,927 2,784 1,143
Camera/Photo 464 513 - 513
Gift, Novelty, Svr 7,189 7,917 2,300 5,617
Hobby/Toy/Game 6,280 6,925 - 6,925
Musical Instruments 7,321 8,118 7,582 536
Office/Stationary 1,855 2,042 - 2,042
Sewing/Piece 989 1,093 1,075 18
Sporting Goods 7,398 8,163 2,540 5,623
Msc S.G. 12,732 14,094 6,144 7,950
Sub-Total 150,012 165,932 56,606 109,326
Dining & Entertainment
Restaurant-LS 14,174 15,794 15,563 232
Restaurant-FS 29,287 32,508 24,388 8,120
Drinking Establshmt 6,656 7,350 - 7,350
Entertainment 36,557 40,368 - 40,368
Sub-Total 86,674 96,020 39,951 56,069
Personal Services 22,607 25,082 23,144 1,938
TOTAL 303,096 335,826 141,799 194,027
Existing Vacant 5,548 Net New Space 188,479
Source: Randall Gross / Development Economics.