Embed Size (px)
Citation preview

Western Victoria Renewable Integration
July 2019
Project Assessment Conclusions Report
© 2019 Australian Energy Market Operator Limited.
The material in this publication may be used in accordance with the copyright permissions on AEMO’s website.
Important notice
PURPOSE
AEMO has prepared this Project Assessment Conclusions Report to meet the requirements of clause 5.16.4 of
the National Electricity Rules.
DISCLAIMER
This document or the information in it may be subsequently updated or amended.
This document does not constitute legal or business advice, and should not be relied on as a substitute for
obtaining detailed advice about the National Electricity Law, the National Electricity Rules, or any other
applicable laws, procedures or policies. AEMO has made every reasonable effort to ensure the quality of the
information in this document but cannot guarantee its accuracy or completeness.
Accordingly, to the maximum extent permitted by law, AEMO and its officers, employees and consultants
involved in the preparation of this document:
• make no representation or warranty, express or implied, as to the currency, accuracy, reliability or
completeness of the information in this document; and
• are not liable (whether by reason of negligence or otherwise) for any statements or representations in this
document, or any omissions from it, or for any use or reliance on the information in it.
Note that transmission line routes identified in this document are indicative only. The actual transmission line
routes will be determined during the detailed design and route assessment phase, after conclusion of the
RIT-T process.
VERSION CONTROL
Version Release date Changes
1 19/7/2019 First issued.
© AEMO 2019 | Western Victoria Renewable Integration PACR 3
Executive summary
In 2017, AEMO commenced a Regulatory Investment Test for Transmission1 (RIT-T) to assess the technical
feasibility and economic benefits of addressing limitations in the Western Victoria2 transmission network.
In recent years, the transition in the energy markets has made Western Victoria an attractive location for
new generation projects due to the quality of its renewable energy resources, namely wind and solar.
However, the transmission infrastructure in this region is insufficient to allow efficient access to all the new
and committed generation seeking to connect to it. Without proper planning and timely investment in the
Western Victorian transmission network, these limitations are expected to increase electricity costs over
the long term, due to the increasing cost of generation dispatch and the cost of future investment in
generation capacity.
The start of the Western Victoria RIT-T process coincided with the release of the 2017 Finkel review3, an
independent review established by the Council of Australian Governments (COAG) Energy Council and led by
Australia’s Chief Scientist, which recommended the development of renewable energy zones (REZs) to
efficiently facilitate new generation connections across Australia. AEMO investigated this recommendation
further in its July 2018 Integrated System Plan (ISP)4, which highlighted transmission investments in Western
Victoria as a priority Group 1 project, because of its high-quality wind and solar resources and high interest
from potential generators. In December 2018, the COAG Energy Council agreed on an approach, set out by
the Energy Security Board, to deliver Group 1 projects.
Against this background, and after extensive market modelling and stakeholder consultation, AEMO has
produced this third and final report of the RIT-T process, which confirms the initial investment plans proposed
in the preceding report, to improve transmission capacity in Western Victoria. The preferred option was found
to have the highest net market benefits5 under all assessed scenarios and sensitivities.
This Project Assessment Conclusions Report (PACR) confirms the preferred option recommended in
the Project Assessment Draft Report (PADR)6, and the updated information and assessment presented
in this PACR has further strengthened this recommendation.
The preferred option will support additional generation connections in the Western Victoria
region, and includes the following major components:
• Short term (present to 2021): Minor transmission line augmentations, including wind monitoring
and upgrading station limiting transmission plant, carried out for the Red Cliffs to Wemen to
Kerang to Bendigo, and Moorabool to Terang to Ballarat, 220 kilovolt (kV) transmission lines.
• Medium term (2021 to 2025):
– By 2024: A new North Ballarat terminal station and new 220 kV double circuit transmission lines
from North Ballarat to Bulgana (via Waubra).
– By 2025: New 500 kV double circuit transmission lines from Sydenham to North Ballarat
connecting two new 1,000 megavolt amperes (MVA) 500/220 kV transformers at North Ballarat.
1 Clause 5.16.4 of the National Electricity Rules, at https://www.aemc.gov.au/sites/default/files/2018-07/NER%20-%20v111.pdf.
2 “Western Victoria” in this RIT-T is defined as Central Highlands, Wimmera Southern Mallee, Mallee, Loddon Campaspe, and parts of the Great South Coast.
3 At https://www.energy.gov.au/government-priorities/energy-markets/independent-review-future-security-national-electricity-market.
4 At https://www.aemo.com.au/-/media/Files/Electricity/NEM/Planning_and_Forecasting/ISP/2018/Integrated-System-Plan-2018_final.pdf.
5 The present value of net economic benefit to all those who produce, consume and transport electricity in the market.
6 At http://aemo.com.au/-/media/Files/Electricity/NEM/Planning_and_Forecasting/Victorian_Transmission/2018/Western-Victoria-Renewable-Integration-RIT-
T-PADR.PDF.

© AEMO 2019 | Western Victoria Renewable Integration PACR 4
The preferred option is shown in Figure 1, with further details in Table 1.
The preferred option is consistent with the recommendations of the 2018 ISP.
It is estimated to cost $370 million and deliver gross market benefits of $670 million and net
market benefits of $300 million (all figures in present value). This net market benefit is
achieved through:
• Significant reductions in the capital and dispatch cost of generation.
• Facilitation of future transmission network expansion.
• Improvements to the Victoria to New South Wales interconnector transfer limit.
Figure 1 Preferred option for Western Victoria Renewable Integration RIT-T
Note: the locations of the proposed new terminal station and new transmission lines shown in this figure are illustrative only. Matters
such as route selection will be considered after the conclusion of the RIT-T process.
Identified need
Western Victoria is experiencing significant committed renewable generation development, with large
amounts of additional generation expected to be operational in the near term.
Around 2,000 megawatts (MW) of committed new renewable generation will be built, or is undergoing
commissioning, in the Western Victoria region by 2020. AEMO projects that a further 3,000 MW of new
generation will be constructed in the region by 2025, and a further 1,000 MW of new generation will be
constructed by 2030, based on proposed new connections in the region and the announced increase to the

© AEMO 2019 | Western Victoria Renewable Integration PACR 5
Victorian Government’s Victorian Renewable Energy Target (VRET). The numbers include 800 MW of
additional new generation that has become committed since the publication of the PADR in December 2018.
Generators connecting to the 220 kV transmission system in Western Victoria are expected to be heavily
constrained by the thermal capacity of the existing transmission network7. AEMO expects that these
limitations, if not addressed, may result in:
• Inefficient development of new generation – new generation is likely to be developed in areas with lower
quality resources but higher transmission network capacity.
• Inefficient generation dispatch – generation in Western Victoria is likely to be constrained due to limited
transmission network capacity, requiring more expensive generation to be dispatched at a higher price.
These inefficiencies are expected to lead to higher costs to consumers.
Credible options
Six credible options were assessed in the PADR stage for their relative net market benefits:
• The top two options, B3 and C2, were further assessed in depth in this PACR stage, and are summarised
in Table 18.
• The other four options, which ranked lowest under all scenarios and sensitivities, have not been assessed
in the same depth at this stage of the process because their net market benefits would not exceed the top
two preferred options, even with the changes in assumptions applied to this assessment from the PADR.
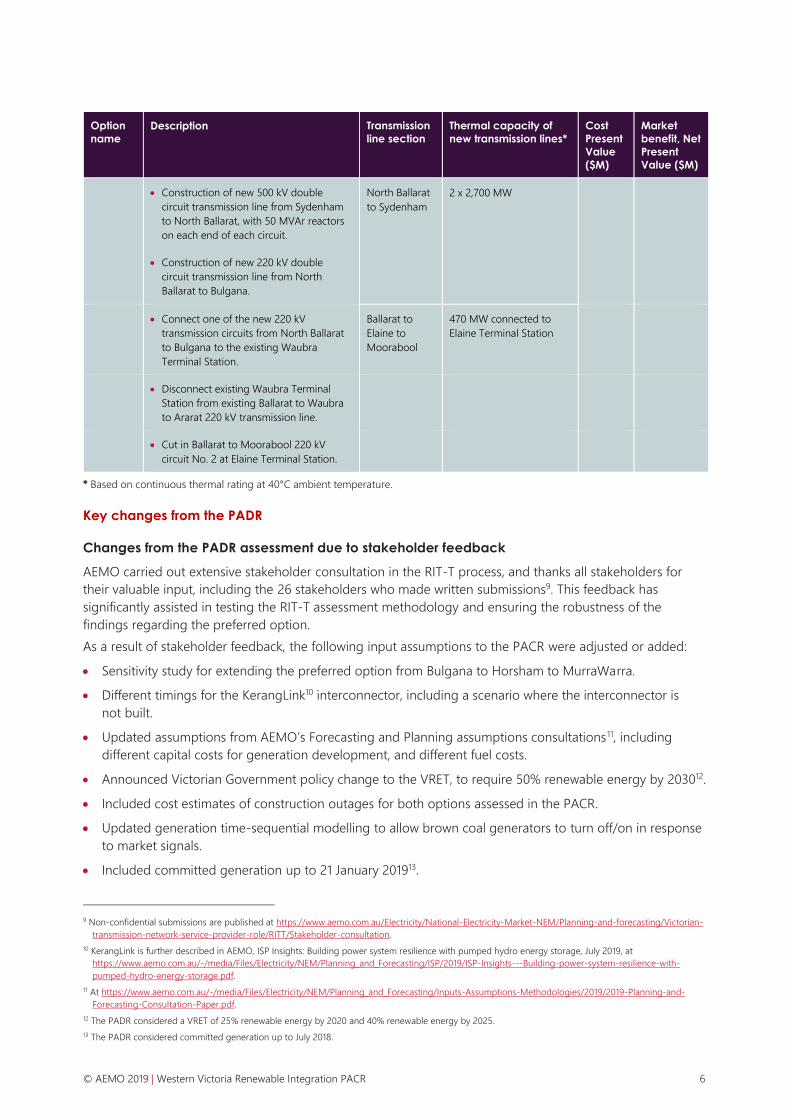
Table 1 Options further assessed in the PACR stage
Option
name
Description Transmission
line section
Thermal capacity of
new transmission lines*
Cost
Present
Value
($M)
Market
benefit, Net
Present
Value ($M)
B3 • Minor augmentations for Red Cliffs to
Wemen to Kerang to Bendigo, and
Moorabool to Terang to Ballarat, 220 kV
transmission lines.
Minor
augmentations
Approximately 10%
increase to existing
transmission line capacity
287 247
• Construction of new 220 kV double
circuit transmission line from Moorabool
to Elaine to Ballarat to Bulgana.
Bulgana to
Ballarat
2 x 750 MW
• Retire Ballarat to Moorabool 220 kV
circuit No. 1, and cut in Ballarat to
Moorabool circuit No. 2 at Elaine.
Ballarat to
Elaine to
Moorabool
2 x 750 MW
C2
(Preferred
Option)
• Minor augmentations for Red Cliffs to
Wemen to Kerang to Bendigo, and
Moorabool to Terang to Ballarat, 220 kV
transmission lines.
Minor
augmentations
Approximately 10%
increase to existing
transmission line capacity
370 301
• Construction of new North Ballarat
Terminal Station, with 2 x 1,000 MVA
500/220 kV transformers.
Bulgana to
North Ballarat
2 x 750 MW
• Connect North Ballarat Terminal Station
to existing Ballarat to Bendigo 220 kV
single circuit transmission line.
7 Generators proposing to connect to the 500 kV transmission system are not expected to be impacted by thermal constraints in Western Victoria.
8 Additional work since the PADR has identified scope changes to both Options B3 and C2, discussed further in the following sections.
© AEMO 2019 | Western Victoria Renewable Integration PACR 6
Option
name
Description Transmission
line section
Thermal capacity of
new transmission lines*
Cost
Present
Value
($M)
Market
benefit, Net
Present
Value ($M)
• Construction of new 500 kV double
circuit transmission line from Sydenham
to North Ballarat, with 50 MVAr reactors
on each end of each circuit.
North Ballarat
to Sydenham
2 x 2,700 MW
• Construction of new 220 kV double
circuit transmission line from North
Ballarat to Bulgana.
• Connect one of the new 220 kV
transmission circuits from North Ballarat
to Bulgana to the existing Waubra
Terminal Station.
Ballarat to
Elaine to
Moorabool
470 MW connected to
Elaine Terminal Station
• Disconnect existing Waubra Terminal
Station from existing Ballarat to Waubra
to Ararat 220 kV transmission line.
• Cut in Ballarat to Moorabool 220 kV
circuit No. 2 at Elaine Terminal Station.
* Based on continuous thermal rating at 40°C ambient temperature.
Key changes from the PADR
Changes from the PADR assessment due to stakeholder feedback
AEMO carried out extensive stakeholder consultation in the RIT-T process, and thanks all stakeholders for
their valuable input, including the 26 stakeholders who made written submissions9. This feedback has
significantly assisted in testing the RIT-T assessment methodology and ensuring the robustness of the
findings regarding the preferred option.
As a result of stakeholder feedback, the following input assumptions to the PACR were adjusted or added:
• Sensitivity study for extending the preferred option from Bulgana to Horsham to MurraWarra.
• Different timings for the KerangLink10 interconnector, including a scenario where the interconnector is
not built.
• Updated assumptions from AEMO’s Forecasting and Planning assumptions consultations11, including
different capital costs for generation development, and different fuel costs.
• Announced Victorian Government policy change to the VRET, to require 50% renewable energy by 203012.
• Included cost estimates of construction outages for both options assessed in the PACR.
• Updated generation time-sequential modelling to allow brown coal generators to turn off/on in response
to market signals.
• Included committed generation up to 21 January 201913.
9 Non-confidential submissions are published at https://www.aemo.com.au/Electricity/National-Electricity-Market-NEM/Planning-and-forecasting/Victorian-
transmission-network-service-provider-role/RITT/Stakeholder-consultation.
10 KerangLink is further described in AEMO, ISP Insights: Building power system resilience with pumped hydro energy storage, July 2019, at
https://www.aemo.com.au/-/media/Files/Electricity/NEM/Planning_and_Forecasting/ISP/2019/ISP-Insights---Building-power-system-resilience-with-
pumped-hydro-energy-storage.pdf.
11 At https://www.aemo.com.au/-/media/Files/Electricity/NEM/Planning_and_Forecasting/Inputs-Assumptions-Methodologies/2019/2019-Planning-and-
Forecasting-Consultation-Paper.pdf.
12 The PADR considered a VRET of 25% renewable energy by 2020 and 40% renewable energy by 2025.
13 The PADR considered committed generation up to July 2018.

© AEMO 2019 | Western Victoria Renewable Integration PACR 7
Changes from the PADR assessment due to updated information
• New interconnector development – updated proposed timings for the new South Australia to New South
Wales interconnector, the Victoria to New South Wales interconnector upgrade, and the New South Wales
to Queensland interconnector upgrade.
• Improvement to the stability limits of the existing Victoria to New South Wales interconnector.
• Refinements to Option B3:
– The PADR specified that power flow controllers may be required to manage transmission line flows
between Ballarat to Bulgana.
– The PACR proposes instead to connect one of the proposed Bulgana to Ballarat circuits to Waubra
Terminal Station, and disconnect Waubra Terminal Station from the existing Ballarat to Waubra to
Ararat to Crowlands to Bulgana 220 kV transmission line, to manage transmission line flows between
Ballarat to Bulgana.
• Refinements to Option C2:
– The PADR specified that power flow controllers may be required to manage transmission line flows
between North Ballarat to Bulgana. The PADR also allowed for a new 220 kV double circuit
transmission line between Ballarat to North Ballarat Terminal Station.
– The PACR proposes instead to:
○ Connect one of the proposed Bulgana to North Ballarat circuits to Waubra Terminal Station and
disconnect Waubra Terminal Station from the existing Ballarat to Waubra to Ararat to Crowlands to
Bulgana 220 kV transmission line to manage transmission line flows between Ballarat to Bulgana.
○ Install additional circuit breakers at Ballarat Terminal Station to establish a bus splitting control
scheme following a critical contingency.
○ Connect the existing Ballarat to Bendigo 220 kV transmission line to North Ballarat Terminal Station,
forming a new Ballarat to North Ballarat to Bendigo 220 kV transmission line.
○ Install 4 x 50 megavolt amperes – reactive (MVAr) reactors on each end of the 500 kV transmission
lines from Sydenham to North Ballarat Terminal Station.
Market benefits
The assessment conducted under this RIT-T has involved detailed market modelling using a market dispatch
model, combined with the development of alternative generation expansion plans.
The market benefits estimated for both Options B3 and C2 have increased since the publication of the PADR,
due to an increase in fuel cost savings, because:
• More renewable generation has become committed.
• The options assessed in the PACR improve the Victoria to New South Wales interconnector export
capacity, resulting in higher export of new renewable generation.
The weighted net market benefits of each of Options B3 and C2 under each scenario, together with the
sensitivities which reduce market benefits, are provided in Table 2. The analysis shows that Option C2 has the
highest net market benefits14 under all assessed scenarios and sensitivities. It is therefore the preferred option.
14 The present value of net economic benefit to all those who produce, consume, and transport electricity in the market

© AEMO 2019 | Western Victoria Renewable Integration PACR 8
Table 2 Weighted net market benefits
Scenario
weighting*
Equal weighting 60% Neutral 60% Slow Change 60% Fast Change
Sensitivities Benefit ($M) Benefit ($M) Benefit ($M) Benefit ($M)
Option B3 Base
assumptions
247 196 157 334
Discount rate
10%
63 40 29 91
Cost x 1.3 174 123 84 261
Deferred
KerangLink
247 196 157 334
Option C2 Base
assumptions
301 257 214 418
Discount rate
10%
75 56 45 116
Cost x 1.3 229 187 145 349
Deferred
KerangLink
272 226 181 385
* Scenarios are described in Section 5.1.2 of this document, and scenario weightings are described in Section 5.2.5.
The preferred option will:
• Minimise network congestion and facilitate more efficient generation dispatch.
• Reduce the capital cost of new generation by enabling more efficient generation connections.
• Improve the capacity of the existing Victoria to New South Wales interconnector.
• Enable future transmission network expansion from Victoria to New South Wales.
These improvements will, in turn, help to reduce the cost of electricity for consumers in the long term.
Beyond this RIT-T
Additional investments in Western Victoria
Western Victoria is continuing to experience high demand for renewable generation. While the preferred
option identified in this RIT-T will reduce the most urgent congestion on Western Victorian generators,
additional transmission network augmentations beyond the scope of this RIT-T will likely be required to
further accommodate future generation connections.
AEMO’s 2019 Victorian Annual Planning Report15 (VAPR) has identified that the withdrawal of further thermal
plant from the Latrobe Valley may result in supply shortfalls, system strength gaps, reactive power issues, or
other consequential power system impacts. While participants are expected to provide adequate notice
before decommissioning, there are risks that a substantial plant failure or force majeure event could cause an
early or unexpected plant retirement.
As a prudent risk mitigation strategy, AEMO has also commenced preliminary studies on options to improve
interconnection between Victoria and New South Wales in the long term, unlocking opportunities for
additional renewables in Victoria and delivering reliability benefits in the event of future plant closures or
15 At http://aemo.com.au/-/media/Files/Electricity/NEM/Planning_and_Forecasting/VAPR/2019/Victorian-Annual-Planning-Report-2019.pdf.

© AEMO 2019 | Western Victoria Renewable Integration PACR 9
declining reliability in the Latrobe Valley. AEMO expects to build on these studies to commence another RIT-T
process in the near future.
Western Victoria Transmission Network Project
This report represents the final stage of the Western Victorian Renewable Integration RIT-T process. AEMO
has commenced a tender process to procure the services required to deliver the contestable augmentations
within the preferred option. The services will include design, construction, operation, and ownership of the
new infrastructure (the Western Victoria Transmission Network Project, or Project).
Further information
AEMO is committed to keeping stakeholders informed of the progress of the Project following the conclusion
of the RIT-T process. AEMO will provide further updates in the coming months, including announcements on
contracts awarded in relation to the Project (anticipated to be the end of 2019), and upcoming stakeholder
engagement activities.
Stakeholder consultation on the Project route is expected to commence in 2020.
For further details, or to be placed on our mailing list, please e-mail [email protected].

© AEMO 2019 | Western Victoria Renewable Integration PACR 10
Contents
Executive summary 3
1. Introduction 14
1.1 Overview 14
1.2 Stakeholder consultation 14
1.3 Declared Shared Network 14
1.4 Further enquiries 15
2. Identified need 16
2.1 Integrated System Plan 16
2.2 Drivers for augmentation 16
2.3 Victorian Annual Planning Report (VAPR) 17
3. Credible options 18
3.1 Minor augmentations 18
3.2 Credible options assessed in the PADR 18
3.3 Credible investment options further assessed in PACR stage 20
4. Submissions 23
5. Methodology and assumptions 27
5.1 Assumptions from the PADR 27
5.2 Assumptions that have been updated from the PADR 32
6. Market benefits 41
6.1 Classes of market benefits not expected to be material 41
6.2 Quantification of classes of material market benefits for each option 42
6.3 Net market benefit assessment 43
7. Conclusion 51
7.1 Preferred option 51
7.2 Project implementation 52
7.3 Procurement of transmission network augmentation 52
A1. Compliance with NER 54
A2. Committed generation 55
A3. Minor augmentations 56
A3.1 Kerang to Wemen to Red Cliffs 220 kV transmission line (KGTS-WETS-RCTS) 56
A3.2 Bendigo to Kerang 220 kV transmission line (BETS-KGTS) 56
A3.3 Moorabool to Terang 220 kV transmission line (MLTS-TGTS) 57
© AEMO 2019 | Western Victoria Renewable Integration PACR 11
A3.4 Ballarat to Terang 220 kV transmission line (BATS-TGTS) 57
A4. Stakeholder consultation materials 58
A5. PADR submission period, engagements undertaken 59
A6. Options assessed in the PADR 61
A6.1 Net market benefits from the PADR 61
A6.2 Option B2 – Construction of a new double circuit 220 kV line from Moorabool to Elaine
to Ballarat to Bulgana to Horsham 62
A6.3 Option B4 – Rebuild existing 220 kV line from Moorabool to Elaine to Ballarat to
Bulgana 63
A6.4 Option C1 – Construction of new double circuit 500 kV line from Sydenham to Ararat 64
A6.5 Option E1 – Battery at various terminal stations 65
A7. Western Victoria transmission line ratings 66
A8. Load flows for Options B3 and C2 69
A8.1 Option B3 69
A8.2 Option C2 70
A8.3 Interaction with existing control schemes 72
A9. Option C2 additional details 74
A9.1 Transmission line utilisation 74
A9.2 Interconnector utilisation 76
A9.3 KerangLink utilisation (2018 ISP) 77
A10. Option C2 high-level technical characteristics 78
A10.1 Network configuration diagrams 79
Tables Table 1 Options further assessed in the PACR stage 5
Table 2 Weighted net market benefits 8
Table 3 Minor network augmentations for Western Victorian Renewable Integration RIT-T 18
Table 4 Weighted net market benefits for each augmentation option and reasonable
scenario from the PADR 19
Table 5 Non-confidential submissions to the PADR 23
Table 6 Matters raised in submissions and AEMO responses 23
Table 7 Asset life of generation and PACR options 32
Table 8 Sensitivity studies in this PACR 33
Table 9 Weightings applied to reasonable scenarios 35
© AEMO 2019 | Western Victoria Renewable Integration PACR 12
Table 10 Improvement to Victoria to New South Wales interconnector export limit 36
Table 11 Interconnector developments assumed in this PACR 37
Table 12 Outage cost for Option B3 38
Table 13 Outage cost for Option C2 39
Table 14 Capital cost estimates of each option from different parties 40
Table 15 Weighted net market benefits for each augmentation option 44
Table 16 Net market benefits for extending Option C2 50
Table 17 Information provided in this PACR, as required by NER 5.16.4 54
Table 18 Committed generation considered in the Western Victoria Renewable Integration
RIT-T 55
Table 19 Engagements undertaken during PADR submission period 59
Table 20 Weighted net market benefits for each augmentation option and reasonable
scenario from the PADR 61
Table 21 Thermal ratings of key transmission line in Western Victoria study area 66
Table 22 Projected load flow for 220 kV transmission lines in Western Victoria before and
after Option B3 is implemented 70
Table 23 Projected load flow for 220 kV transmission lines in Western Victoria before and
after Option C2 is implemented 71
Table 24 Ballarat 220 kV bus split control scheme 72
Figures Figure 1 Preferred option for Western Victoria Renewable Integration RIT-T 4
Figure 2 Comparison of annual energy consumption in 2017 and 2018 ESOO forecasts 28
Figure 3 Market modelling process 29
Figure 4 Comparing fuel cost of coal, Neutral scenario 34
Figure 5 Comparing fuel cost of gas, Neutral scenario 35
Figure 6 Gross market benefits and annualised costs of Option B3, Neutral scenario 45
Figure 7 Impact on generation dispatch of Option B3, 2033-34 45
Figure 8 Reduction in curtailment of renewable generation, Option B3 46
Figure 9 Fuel cost saving benefits across all scenarios, Option B3 46
Figure 10 Gross market benefits and annualised costs of Option C2, Neutral scenario 47
Figure 11 Impact on generation dispatch of Option C2, 2033-34 48
Figure 12 Reduction in curtailment of renewable generation, Option C2 48
Figure 13 Fuel cost saving benefits across all scenarios, Option C2 49
Figure 14 Ballarat to Ararat 220 kV transmission line utilisation, Neutral scenario 74

© AEMO 2019 | Western Victoria Renewable Integration PACR 13
Figure 15 Ballarat to North Ballarat 220 kV transmission line utilisation, Neutral scenario 75
Figure 16 Elaine to Moorabool 220 kV transmission line utilisation, Neutral scenario 75
Figure 17 Victorian interconnector flow in 2025 under the Neutral scenario 76
Figure 18 Victorian interconnector flow in 2030 under the Neutral scenario 77
Figure 19 Projected utilisation of the Victoria to New South Wales interconnector, Neutral
(left) and Neutral with storage initiatives (right) – from 2018 ISP Appendices 77
Figure 20 Single line diagram of current network configuration 79
Figure 21 Proposed single line diagram of Option C2 – subject to detailed design 80
© AEMO 2019 | Western Victoria Renewable Integration PACR 14
1. Introduction
1.1 Overview
This Project Assessment Conclusions Report (PACR) has been prepared by the Australian Energy Market
Operator Limited (AEMO) in accordance with the requirements of National Electricity Rules (NER) clause 5.1616
for a Regulatory Investment Test for Transmission (RIT-T)17.
The purpose of a RIT-T is to identify the credible option for meeting an identified need that maximises net
economic benefit for all those who produce, consume, and transport electricity in the market.
The RIT-T process involves the publication of three reports. For this RIT-T:
• The Project Specification Consultation Report (PSCR), which sought feedback on the identified need and
proposed credible options to address the need, was published in April 201718.
• The Project Assessment Draft Report (PADR), which identified and sought feedback on the preferred
option which delivers the highest net economic benefit and other issues, was published in
December 201819.
• This Project Assessment Conclusions Report (PACR) specifies AEMO’s conclusion as to the preferred
option, and, among other things, provides a summary of the submissions received on the PADR.
1.2 Stakeholder consultation
AEMO carried out extensive stakeholder consultation throughout the RIT-T process, with the objectives of:
• Ensuring the robustness of the RIT-T findings.
• Validating the study assumptions.
• Communicating the process and identified need driving the RIT-T, as well as describing the credible
options and assessments considered in the PADR.
• Ensuring stakeholders were aware of the opportunity to make a submission.
AEMO used a variety of methods to consult with stakeholders with differing levels of knowledge and interest
in the project, including forums, roundtables, teleconferencing, online engagement, calls to the dedicated
toll-free phone number, and emails. Appendix A4 lists key materials made available to stakeholders, and
Appendix A5 summarises engagement activities undertaken following the release of the PADR.
This PACR stage assessment took into account the PADR submissions and feedback received from
stakeholders. See Section 4 for information on submissions received and AEMO’s responses.
1.3 Declared Shared Network
The transmission network proposed to be augmented in Western Victoria forms part of the Victorian
Declared Shared Network.
16 At https://www.aemc.gov.au/regulation/energy-rules/national-electricity-rules/current.
17 Refer to Appendix A1 for a list of PACR requirements.
18 At https://www.aemo.com.au/-/media/Files/Electricity/NEM/Planning_and_Forecasting/Victorian_Transmission/2017/Western-Victoria-Renewable-
Integration---Project-Specification-Consultation-Report_FINAL.pdf.
19 At https://www.aemo.com.au/-/media/Files/Electricity/NEM/Planning_and_Forecasting/Victorian_Transmission/2018/Western-Victoria-Renewable-
Integration-RIT-T-PADR.PDF.

© AEMO 2019 | Western Victoria Renewable Integration PACR 15
AEMO’s functions under the National Electricity Law include planning, authorising, contracting for , and
directing augmentation of the Declared Shared Network.
In deciding whether a proposed augmentation to the Declared Shared Network should proceed, AEMO is
required to undertake a cost-benefit analysis. As the preferred option involves a number of augmentations to
the Declared Shared Network, the RIT-T meets this requirement in relation to those augmentations.
1.4 Further enquiries
AEMO is committed to keeping stakeholders informed of the progress of Western Victorian Transmission
Network Project following the conclusion of the RIT-T process. AEMO will provide further updates in the
coming months, including announcements on the Project and upcoming stakeholder engagement activities.
Stakeholder consultation on the Project route is expected to commence in 2020.
For further details, please e-mail [email protected].

© AEMO 2019 | Western Victoria Renewable Integration PACR 16
2. Identified need
The need for transmission investment, as identified in the PADR, is unchanged. Investment is required to
reduce constraints20 on anticipated new and existing generation in Western Victoria, to deliver an increase in
benefits to both energy consumers and energy producers (that is, an increase in the sum of consumer and
producer surplus in the National Electricity Market [NEM]) through significant reductions in the capital cost
and dispatch cost of generation over the longer term.
2.1 Integrated System Plan
The augmentation outlined in this RIT-T was identified as a priority Group 1 project in AEMO’s 2018 Integrated
System Plan (ISP) for the National Electricity Market (NEM), which recommended it be delivered as soon as
possible. In December 2018, the Council of Australian Governments (COAG) Energy Council agreed on an
approach, set out by the Energy Security Board21 (ESB) to deliver the Group 1 projects, and the ESB published
a consultation paper in May 2018 to convert the ISP into action22.
In parallel, AEMO is working to progress the transmission investments identified in this RIT-T.
2.1.1 Renewable energy zones
The 2018 ISP identified three priority three renewable energy zones (REZs) in Victoria:
1. Western Victoria REZ – includes the transmission network from Red Cliffs to Horsham to Ballarat to
Moorabool, or Sydenham.
2. Moyne REZ – includes the transmission network from Ballarat to Terang and Terang to Moorabool.
3. Murray River REZ – includes the transmission network from Buronga to Red Cliffs to Kerang to Bendigo
and Sydenham, and the potential connection to a new South Australian interconnector between
mid-north South Australia and Wagga Wagga in New South Wales, via Buronga.
2.2 Drivers for augmentation
Western Victoria REZ
The main driver for Horsham to Ballarat augmentation is development of large-scale renewable (mainly wind)
generation in the area.
Most of the generation is intended to flow from Horsham towards the 500 kilovolt (kV) network at
Moorabool. The transmission line flows in the Moorabool to Geelong to Keilor 220 kV path also increase, due
to the large amount of generation in the Horsham to Ballarat corridor.
With no major augmentations along the Horsham to Ballarat transmission path, or the Murray River REZ, and
with the newly committed generation specified in Appendix A2, the most overloaded transmission line section
will be between Waubra and Ballarat. If constraints on the Ballarat to Waubra 220 kV transmission line are
removed, the Ballarat to Moorabool 220 kV transmission line will become constrained.
If there is a trip of the Red Cliffs to Horsham line, the Horsham to Ballarat line becomes radial, with most
of the generation flowing towards Ballarat (a small percentage of generation will also be supplying load
at Horsham).
20 Under both system normal or contingency conditions.
21 Information about the Energy Security Board is at http://www.coagenergycouncil.gov.au/market-bodies/energy-security-board.
22 At http://www.coagenergycouncil.gov.au/publications/energy-security-board-%E2%80%93-converting-integrated-system-plan-action-consultation-paper.

© AEMO 2019 | Western Victoria Renewable Integration PACR 17
Following major augmentation of the Horsham to Ballarat to Moorabool 220 kV path, the Geelong to Keilor
220 kV path could become the main limitation to deliver generation in this REZ to the load centres, and is
discussed further in Section 6.3.1.
Moyne REZ
Augmentation of the Terang to Moorabool line is primarily driven by new wind generation connecting to
Terang Terminal Station (both transmission and distribution connections). Generation connecting in the
Western Victoria REZ will also increase transmission line flows on the Ballarat to Terang to Moorabool
transmission lines.
Most of the generation is intended to flow towards Ballarat or towards Moorabool, from Terang.
Murray River REZ
The key driver for Murray River augmentation is the development of large-scale renewable (mainly solar)
generation in this area, and major generation retirements in Victoria.
The main generation interest within this REZ is around the Red Cliffs and Kerang area, which has limited local
demand. Small-scale incremental developments will therefore have limited benefit, because the generation
facilitated by these developments cannot be entirely absorbed locally. A transmission path would be required
to allow for efficient transport of generation to the Melbourne load centre, or to other states, provided it is
economic to do so.
If no further augmentations are carried out, the most overloaded transmission line section is between Red
Cliffs to Wemen to Kerang. The 2018 ISP identified this transmission line augmentation as a Group 3 project.
The 2018 ISP also estimated that a new Victoria to New South Wales interconnector (called KerangLink23),
running through the Murray River REZ, may be required by 2035.
2.3 Victorian Annual Planning Report (VAPR)
AEMO’s 2019 VAPR24 has identified that the withdrawal of further thermal plant from the Latrobe Valley may
result in supply shortfalls, system strength gaps, reactive power issues, or other consequential power system
impacts. While participants are expected to provide adequate notice before decommissioning, there are risks
that a substantial plant failure or force majeure event could cause an early or unexpected plant retirement.
As a prudent risk mitigation strategy, AEMO has also commenced preliminary studies on options to improve
interconnection between Victoria and New South Wales in the long term, unlocking opportunities for
additional renewables in Victoria and delivering reliability benefits in the event of future plant closures or
declining reliability in the Latrobe Valley. AEMO expects to build on these studies to commence another RIT-T
process in the near future.
23 KerangLink is further described in AEMO, ISP Insights: Building power system resilience with pumped hydro energy storage, July 2019, at
https://www.aemo.com.au/-/media/Files/Electricity/NEM/Planning_and_Forecasting/ISP/2019/ISP-Insights---Building-power-system-resilience-with-
pumped-hydro-energy-storage.pdf.
24 At http://aemo.com.au/-/media/Files/Electricity/NEM/Planning_and_Forecasting/VAPR/2019/Victorian-Annual-Planning-Report-2019.pdf.

© AEMO 2019 | Western Victoria Renewable Integration PACR 18
3. Credible options
3.1 Minor augmentations
The PADR identified several non-contestable25 minor augmentations to existing infrastructure to be delivered
by AusNet Services26 as the owner and operator of this infrastructure, and listed in Table 3.
Table 3 Minor network augmentations for Western Victorian Renewable Integration RIT-T
Project description Capital expenditure
cost, $M (nominal)
10-year operational
expenditure costs, $M
Estimated in service
date
Ballarat to Waubra to Ararat to Horsham
220 kV transmission line minor upgrade
(committed project, for information only)
0.85 0.21 In service
Horsham to Red Cliffs 220 kV transmission
line minor upgrade (committed project, for
information only)
1.45 0.29 October 2019
Red Cliffs to Wemen to Kerang 220 kV
transmission line minor upgrade 2.6 0.27 2021
Bendigo to Kerang 220 kV transmission line
minor upgrade 1.7 0.21 2021
Moorabool to Terang 220 kV transmission
line minor upgrade 0.5 0.21 2021
Ballarat to Terang 220 kV transmission line
minor upgrade 0.7 0.21 2021
The uncommitted minor augmentations listed in the table above have a total capital cost of approximately
$5.5 million. If these upgrades are deployed by 2021, they will return a net market benefit of $1 million. The
minor augmentations are assumed to be included to the scope of the credible options assessed in this PACR.
Refer to Appendix A3 for further information on the scope of works of these minor augmentations.
3.2 Credible options assessed in the PADR
The PADR assessed a range of credible options, listed in Table 4 below. The PADR assessment found two
options (Option B3 and Option C2, described further in the next sections) to have the highest net market
benefits under the assessed scenarios and sensitivities.
This PACR only focuses on the top two options from the PADR, and whether any changes in assumptions will
change their net market benefits and rankings.
Other options identified in the PADR have not been assessed in depth at this stage of the process, since their
net market benefits would not exceed the top two preferred options, even with the changes in assumptions
applied to this assessment from the PADR. This is because:
• Option B2 – will have similar market benefits to extending Option C2, as described in Section 6.3.4,
meaning it will have an incremental gross benefit of between $16 million and $38 million (in net present
25 NER 8.11.6 sets out the criteria for determining if an augmentation is non-contestable augmentation.
26 AusNet Services owns and operates the majority of Victoria’s electricity transmission network. See https://www.ausnetservices.com.au/Misc-Pages/Links/
About-Us for more information.

© AEMO 2019 | Western Victoria Renewable Integration PACR 19
value (NPV) terms), when compared to Option B3. This option has an incremental cost of $51 million (in
present value terms), so the incremental benefits of this option would be less than its incremental cost.
• Option B4 – will have less market benefits than Option B3, but higher costs, due to its outage
requirements, so this option will always have less net market benefits than Option B3.
• Option C1 – will have similar capital and dispatch benefits as Option C2, but less transmission network
investment benefits, so this option will always have less net market benefits than Option C2.
• Option E1 – had negative net market benefits under all scenarios and sensitivities in the PADR, and the
changes to assumptions in the PACR are not expected to result in positive net market benefits under any
scenarios or sensitivities.
Appendix A6 has more information on options considered in the PADR but not assessed further in the PACR.
Table 4 Weighted net market benefits for each augmentation option and reasonable scenario from
the PADR
Option Description Cost ($M,
nominal)
Neutral
($M)
Neutral
with
storage
initiatives
($M)
Slow
change
($M)
Fast
change
($M)
Weighted
benefit
($M, NPV)
Scenario weighting 25% 25% 25% 25%
B2 • Construction of a new 220 kV double
circuit transmission line from
Moorabool to Elaine to Ballarat to
Bulgana to Horsham.
• Retire Ballarat to Moorabool 220 kV
circuit No. 1, and cut in Ballarat to
Moorabool 220kV circuit No. 2 at
Elaine.
• Allow sufficient powerflow controllers
to manage transmission line flows
between Ballarat to Bulgana to
Horsham.
406 13 -25 -14 81 14
B4 • Rebuild existing Moorabool to Elaine
to Ballarat to Bulgana single circuit
220 kV transmission line as a 220 kV
double circuit transmission line.
• Retire the existing Moorabool to
Ballarat to Bulgana 220 kV
transmission lines to enable existing
easement to be re-used for a new
double circuit line. Cut in Ballarat to
Moorabool 220 kV circuit No. 2
at Elaine.
• Dynamic reactive compensation
required to manage voltages.
367 57 9 30 133 57
C1 • Construction of a new 500 kV double
circuit transmission line from
Sydenham to Ararat.
• 2 x 1,000 MVA 500/220 kV
transformers at Ararat.
• Allow for line switched reactors for
the 500 kV transmission lines.
• Cut in Ballarat to Moorabool 220 kV
circuit No. 2 at Elaine.
443 65 19 38 135 64
E1 Battery at Ararat Terminal Station. 117 -74 -72 -98 -60 -76
© AEMO 2019 | Western Victoria Renewable Integration PACR 20
3.3 Credible investment options further assessed in PACR stage
The top two options in the PADR had the highest net market benefits under certain scenarios and sensitivities.
Therefore, both options were assessed in depth in the PACR stage. For both options:
• The minor augmentations identified in Table 3 should be added to the scope of works and capital costs of
the option.
• The transmission lines shown in this report are for illustrative purposes only. The RIT-T process does not
determine a project route, which will be developed after the conclusion of the RIT-T.
• The cost estimates provided have an accuracy of ±30% (see Section 5.2.12 for methodology applied).
• Project sequencing and construction will be determined after the conclusion of the RIT-T process, by a
competitive tender. Estimated commissioning dates here have been informed by high-level assessment by
AEMO.
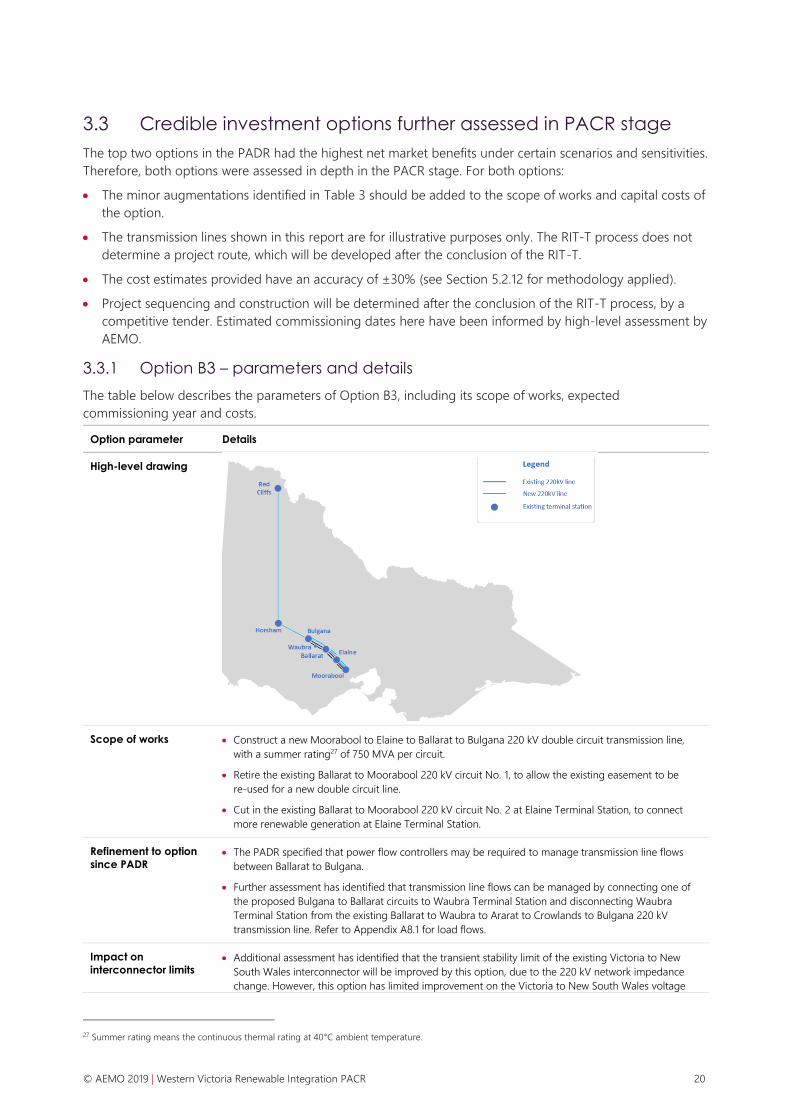
3.3.1 Option B3 – parameters and details
The table below describes the parameters of Option B3, including its scope of works, expected
commissioning year and costs.
Option parameter Details
High-level drawing
Scope of works • Construct a new Moorabool to Elaine to Ballarat to Bulgana 220 kV double circuit transmission line,
with a summer rating27 of 750 MVA per circuit.
• Retire the existing Ballarat to Moorabool 220 kV circuit No. 1, to allow the existing easement to be
re-used for a new double circuit line.
• Cut in the existing Ballarat to Moorabool 220 kV circuit No. 2 at Elaine Terminal Station, to connect
more renewable generation at Elaine Terminal Station.
Refinement to option
since PADR • The PADR specified that power flow controllers may be required to manage transmission line flows
between Ballarat to Bulgana.
• Further assessment has identified that transmission line flows can be managed by connecting one of
the proposed Bulgana to Ballarat circuits to Waubra Terminal Station and disconnecting Waubra
Terminal Station from the existing Ballarat to Waubra to Ararat to Crowlands to Bulgana 220 kV
transmission line. Refer to Appendix A8.1 for load flows.
Impact on
interconnector limits • Additional assessment has identified that the transient stability limit of the existing Victoria to New
South Wales interconnector will be improved by this option, due to the 220 kV network impedance
change. However, this option has limited improvement on the Victoria to New South Wales voltage
27 Summer rating means the continuous thermal rating at 40°C ambient temperature.

© AEMO 2019 | Western Victoria Renewable Integration PACR 21
Option parameter Details
stability limit for high export from Victoria to New South Wales. This change in interconnector export
capability is not likely to have a material inter-network impact. Refer to Section 5.2.6 for further details.
• The Western Victoria augmentation does not have a negative impact on the South Australia – New
South Wales or Murraylink interconnectors. As most of the limitations in north-west Victoria are due to
thermal limits and the need to avoid voltage collapse, the proposed Western Victoria network changes
would improve these limits by providing more capacity and voltage support. The benefits are expected
to be similar for both Option B3 and Option C2, and are not quantified because it will not change the
RIT-T conclusion. Refer to Appendix A8.3.1 for further information.
Construction type Greenfield
Expected
commissioning year By 2024
Estimated capital cost
(nominal) $335 million
Estimated outage cost
(nominal) $10 million
Ongoing operating
cost 3.8% of capital cost
3.3.2 Option C2 – parameters and details
This table describes the parameters of Option C2, including its scope of works, expected commissioning year
and costs.
Option parameter Details
High-level drawing
Scope of works • Establish a new terminal station close to Ballarat, called North Ballarat Terminal Station, with 2 x
1,000 MVA 500/220 kV transformers.
– Connect the existing Ballarat to Bendigo 220 kV transmission line at the new North Ballarat Terminal
Station to form the Ballarat to North Ballarat to Bendigo 220 kV transmission line.
• Construct a new Sydenham to North Ballarat 500 kV double circuit transmission line with a summer
rating28 of 2,700 MVA per circuit. Allow for transmission line reactors on both ends of the 500 kV
transmission lines.
• Construct a new North Ballarat to Bulgana 220 kV double circuit transmission line, with a summer
rating of 750 MVA per circuit. Connect one of the new 220 kV transmission circuits from North Ballarat
28 Summer rating means the continuous thermal rating at 40°C ambient temperature.

© AEMO 2019 | Western Victoria Renewable Integration PACR 22
Option parameter Details
to Bulgana to the existing Waubra Terminal Station. Disconnect the existing Waubra Terminal Station
from the existing Ballarat to Waubra to Ararat 220 kV transmission line.
• Terminate the existing Ballarat to Moorabool No.2 220 kV transmission line at Elaine Terminal Station,
forming the Ballarat to Elaine No.2 line and the Elaine to Moorabool No.2 line.
Additional
considerations • The proposed augmentation will increase the fault level at nearby transmission and distribution
busses. The increased fault levels are below the fault level limits in NER clause 9.3A, but it will be above
the station rating at some locations. AEMO has coordinated with the local Distribution Network
Service Provider (Powercor) to identify high fault levels at Ballarat North Zone Substation (BAN), which
is estimated to require an augmentation costing $2 million to resolve. AEMO will continue to assess
maximum fault levels in Victoria in its Annual Fault Level Review (AFLR), which is shared with Victorian
Network Service Providers in December each year.
Refinement to option
since PADR • The PADR specified that power flow controllers may be required to manage transmission line flows
between Ballarat to Bulgana. See Appendix A8.2 for more on load flows.
• Further assessment has identified that transmission line flows can be managed by:
– Connecting one of the proposed Bulgana to North Ballarat circuits to Waubra Terminal Station and
disconnecting Waubra Terminal Station from the existing Ballarat to Waubra to Ararat to Crowlands
to Bulgana 220 kV transmission line.
– Installing additional circuit breakers at Ballarat Terminal Station to establish a bus splitting control
scheme following a critical contingency.
• The PADR cost estimates allowed for a new 220 kV double circuit transmission line between Ballarat to
North Ballarat Terminal Station. Further assessment has shown that the bus splitting control scheme
referred to above will reduce expected flows between Ballarat and North Ballarat. Therefore, the
existing Ballarat to Bendigo 220 kV transmission line can be connected to North Ballarat Terminal
Station, forming a new Ballarat to North Ballarat to Bendigo 220 kV transmission line.
• Additional assessments have identified the need for 4 x 50 MVAr reactors on each end of the 500 kV
transmission lines from Sydenham to North Ballarat Terminal Station.
• Connection of the new 500 kV transmission lines to Sydenham will need to be coordinated with the
asset replacements works proposed for Sydenham Terminal Station29.
Impact on
interconnector limits • Additional assessment has identified that the transient stability limit of the existing Victoria to New
South Wales interconnector will be improved by this option, due to the impedance change of the
220 kV and 500 kV transmission network, as well as an improvement to the pre-contingency voltage
and angle of the 500 kV buses. This option will improve the Victoria to New South Wales voltage
stability limit for high export from Victoria to New South Wales. This change in interconnector export
capability is not likely to have a material inter-network impact. Refer to Section 5.2.6 for further details.
• The Western Victoria augmentation does not have a negative impact on the South Australia – New
South Wales or Murraylink interconnectors. As most of the limitations in north-west Victoria are due to
thermal limits and the need to avoid voltage collapse, the proposed Western Victoria network changes
would improve these limits by providing more capacity and voltage support. The benefits are expected
to be similar for both Option B3 and Option C2, and are not quantified because it will not change the
RIT-T conclusion. Refer to Appendix A8.3.1 for further information.
Construction type Greenfield
Expected
commissioning year By 2025
Estimated capital cost
(nominal) $473 million
Estimated outage cost
(nominal) $4 million
Ongoing operating
cost 3.5% of capital cost
29 See AusNet Services’ Asset Renewal Plan, at https://aemo.com.au/-/media/Files/Electricity/NEM/Planning_and_Forecasting/VAPR/2019/AusNet-Services-
asset-renewal-plan-2019_Final.pdf.
© AEMO 2019 | Western Victoria Renewable Integration PACR 23
4. Submissions
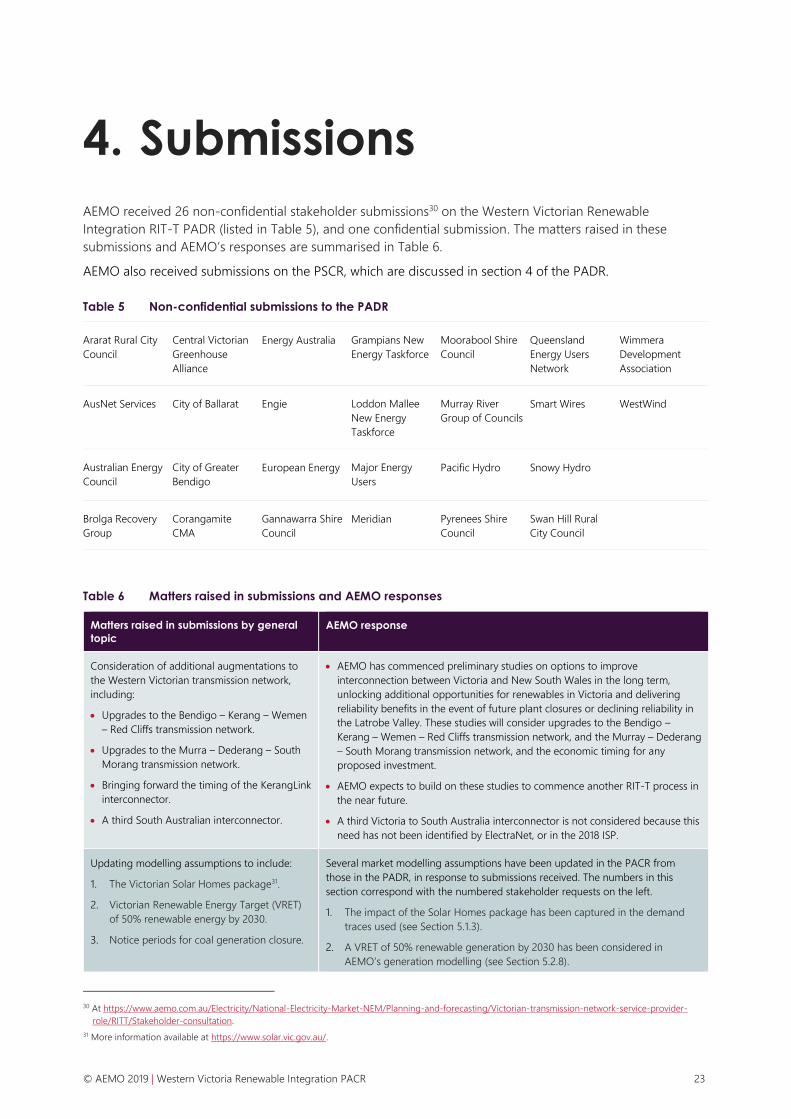
AEMO received 26 non-confidential stakeholder submissions30 on the Western Victorian Renewable
Integration RIT-T PADR (listed in Table 5), and one confidential submission. The matters raised in these
submissions and AEMO’s responses are summarised in Table 6.
AEMO also received submissions on the PSCR, which are discussed in section 4 of the PADR.
Table 5 Non-confidential submissions to the PADR
Ararat Rural City
Council
Central Victorian
Greenhouse
Alliance
Energy Australia Grampians New
Energy Taskforce
Moorabool Shire
Council
Queensland
Energy Users
Network
Wimmera
Development
Association
AusNet Services City of Ballarat Engie Loddon Mallee
New Energy
Taskforce
Murray River
Group of Councils
Smart Wires WestWind
Australian Energy
Council
City of Greater
Bendigo
European Energy Major Energy
Users
Pacific Hydro Snowy Hydro
Brolga Recovery
Group
Corangamite
CMA
Gannawarra Shire
Council
Meridian Pyrenees Shire
Council
Swan Hill Rural
City Council
Table 6 Matters raised in submissions and AEMO responses
Matters raised in submissions by general
topic
AEMO response
Consideration of additional augmentations to
the Western Victorian transmission network,
including:
• Upgrades to the Bendigo – Kerang – Wemen
– Red Cliffs transmission network.
• Upgrades to the Murra – Dederang – South
Morang transmission network.
• Bringing forward the timing of the KerangLink
interconnector.
• A third South Australian interconnector.
• AEMO has commenced preliminary studies on options to improve
interconnection between Victoria and New South Wales in the long term,
unlocking additional opportunities for renewables in Victoria and delivering
reliability benefits in the event of future plant closures or declining reliability in
the Latrobe Valley. These studies will consider upgrades to the Bendigo –
Kerang – Wemen – Red Cliffs transmission network, and the Murray – Dederang
– South Morang transmission network, and the economic timing for any
proposed investment.
• AEMO expects to build on these studies to commence another RIT-T process in
the near future.
• A third Victoria to South Australia interconnector is not considered because this
need has not been identified by ElectraNet, or in the 2018 ISP.
Updating modelling assumptions to include:
1. The Victorian Solar Homes package31.
2. Victorian Renewable Energy Target (VRET)
of 50% renewable energy by 2030.
3. Notice periods for coal generation closure.
Several market modelling assumptions have been updated in the PACR from
those in the PADR, in response to submissions received. The numbers in this
section correspond with the numbered stakeholder requests on the left.
1. The impact of the Solar Homes package has been captured in the demand
traces used (see Section 5.1.3).
2. A VRET of 50% renewable generation by 2030 has been considered in
AEMO’s generation modelling (see Section 5.2.8).
30 At https://www.aemo.com.au/Electricity/National-Electricity-Market-NEM/Planning-and-forecasting/Victorian-transmission-network-service-provider-
role/RITT/Stakeholder-consultation.
31 More information available at https://www.solar.vic.gov.au/.

© AEMO 2019 | Western Victoria Renewable Integration PACR 24
Matters raised in submissions by general
topic
AEMO response
4. Ancillary service costs associated with
increased intermittent supply.
5. Costs of outages for the assessed options.
6. Costs of decommissioning transmission
assets.
7. Updated assumptions that have emerged
since the 2018 ISP.
8. The Murray River REZ solar potential and
regional data.
9. A higher discount rate.
10. An alternative interconnector path from
Victoria to New South Wales.
3. The augmentations in this RIT-T are driven by new renewable generation and
the VRET. The RIT-T found that augmentations would deliver net market
benefits before any Victorian coal generation closure has occurred. Therefore,
the notice period for coal generation closure will not change the preferred
option arising out of this RIT-T. Early coal generation closure is likely to
increase the market benefits of the preferred option under this RIT-T.
4. AEMO’s time-sequential modelling showed that ancillary service costs
associated with increased intermittent supply will not be affected by the
options considered in this PACR (see Section 6.1.1).
5. AEMO has considered additional construction outage costs for implementing
the options considered in this PACR (see Section 5.2.11).
6. The options considered in the PACR already consider the costs of
decommissioning assets in its total cost.
7. The PACR uses new information published in the 2019 Modelling Assumptions
Workbook32 on capital costs and considered the impact on different fuel
costs.
8. AEMO is aware of the high interest in new solar connections in the Murray
River REZ, and has considered committed generation since the PADR, and as
listed in Appendix A2. The new generation uptake modelled in this PACR is
lower than the generation interest from the market because:
– Forecast demand in Victoria is flattening over the modelling horizon. Refer
to Section 5.1.3 for demand forecasts.
– There are currently limited major generation retirements expected in
Victoria within the modelling period (some brown coal is assumed to retire
in Victoria towards the end of the modelling period, in the 2033 financial
year).
– AEMO’s least-cost market modelling will allow new generation capacity
only to meet customer demand and committed renewable energy targets,
as required by the RIT-T application guidelines33. This new generation
capacity modelled in the PACR (including solar generation) is less than the
known market interest in developing new generation.
– Further augmentations in Western Victoria will be subject to timing of
major generation retirements.
9. The base discount rate of 6% is consistent with the central commercial
discount rate recommended by Energy Networks Australia (ENA) in their RIT-T
Economic Assessment Handbook34. Sensitivity studies have shown that the
preferred option does not change even when the discount rate is raised to
10%.
10. The 2018 ISP assessed seven different options for a major Victoria to New
South Wales interconnector augmentation, and selected the KerangLink
interconnector as the option that provides the highest net market benefits.
This PACR addresses the uncertainty in the future interconnector
augmentation by assessing a scenario with no additional interconnection
between Victoria to New South Wales, and also applying different possible
timings to the KerangLink interconnector.
Further information on:
1. The impact of the options on
interconnectors.
The numbers in this section correspond with the numbered stakeholder requests
on the left.
1. Impact of options on interconnectors are discussed in Section 3.3.
2. Next steps after the conclusion of the RIT-T are in Section 7.3.
32 At https://www.aemo.com.au/-/media/Files/Electricity/NEM/Planning_and_Forecasting/Inputs-Assumptions-Methodologies/2019/2019-Input-and-
Assumptions-workbook.xlsx.
33 At https://www.aer.gov.au/networks-pipelines/guidelines-schemes-models-reviews/rit-t-and-rit-d-application-guidelines-2018.
34 At https://www.energynetworks.com.au/sites/default/files/ena_rit-t_handbook_15_march_2019.pdf.

© AEMO 2019 | Western Victoria Renewable Integration PACR 25
Matters raised in submissions by general
topic
AEMO response
2. How changes to scenarios and assumptions
modelled for this RIT-T would be
considered after the RIT-T process.
3. The cost of wholesale electricity produced
from non-subsidised wind and solar farms
with batteries.
4. How project costs were calculated.
5. What consultations have been carried out.
6. Which input assumptions are the outcome
of market modelling, and which input
assumptions are fixed.
7. The costs and benefits of each of the major
stages of the project.
3. An assessment of wholesale electricity prices by fuel/technology type is not
required as part of the RIT-T.
4. Project costs are further discussed in Section 5.2.11, and Section 5.2.12.
5. AEMO’s consultation activities are discussed in Appendix A5.
6. The fuel and capital cost savings are the outcome of market modelling. The
timing of the KerangLink interconnector is the outcome of market modelling
carried out in the 2018 ISP.
7. The cost and benefits of options are discussed in Section 6.3. and the costs
and benefits of each major stage of the preferred option are discussed in
Section 6.3.5.
Market benefit assessments:
• Further assessment on option value benefits.
• Whether generation dispatch using Short Run
Marginal Cost is appropriate.
• That capital efficiency be considered in the
assessment which may reverse the ranking of
the two preferred options.
• Further explore the robustness of Options C2
and B3.
• Transmission infrastructure should be
connected to dispatchable generation.
• Option value benefits are assessed by including new scenarios, as
recommended by the RIT-T application guidelines and discussed in
Section 5.2.2.
• Short Run Marginal Cost generation dispatch modelling is used to identify the
least-cost generation required to meet customer demand, as recommended in
the RIT-T application guidelines.
• The RIT-T states that “the preferred option is the credible option that maximises
the net economic benefit … compared to all other credible options”.
• AEMO has further explored the market benefits of both Option B3 and Option
C2, and has recommended the option with the highest net market benefits
across all scenarios and sensitivities as the preferred option. The preferred
option does not change when considering the impact of early coal retirement,
reduced customer demand, or higher uptake of demand response. The
preferred option is expected to have high utilisation after it is commissioned.
Refer to Appendix A9 for expected transmission line utilisations.
• AEMO’s market modelling has shown that the option proposed has low impact
on the amount of dispatchable generation.
Easements and planning permits:
• The RIT-T should consider easements and
land requirements for the credible options.
• The RIT-T should consider the cost of
obtaining planning approvals, including the
potential need to underground the proposed
new transmission lines, to meet planning
requirements.
AEMO has used the best information available to estimate the cost of proposed
options, with an accuracy of approximately ±30%. The final cost of the
contestable components of the preferred option will be obtained through a
competitive tender process, and the final costs of the non-contestable
components of the preferred option will be the subject of offers from the
incumbent transmission network service providers (TNSPs). AEMO will continue to
consult with stakeholders to identify a solution that satisfies the technical,
economic, planning and environmental challenges identified whilst remaining
cognisant of community and consumer impacts.
Matters outside of the RIT-T process:
• Sustainable management of natural assets.
• Impacts on Brolga habitat.
• Impacts on the community, including social,
land use, amenity, environmental, and
cumulative impacts on community when
combined with other local and State projects.
• Social licence, community sentiment and best
practice community engagement, including
community benefit sharing and
neighbourhood benefit programs.
• The RIT-T process is constrained with respect
to the delivery of timely investment.
• The assessments in this PACR have been conducted in accordance with the
RIT-T and application guidelines made by the Australian Energy Regulator
(AER). It is important to recognise that the test and the application guidelines
specifically exclude consideration of certain matters.
• AEMO appreciates and acknowledges the important environmental, amenity,
cultural, and community matters raised by stakeholders. AEMO has ensured
that these matters have been captured for inclusion in the scope of works that
the successful tenderer must consider in delivering the Project. The ensuing
Project will consider the best solution with regards to technical design, route
development, and environmental and planning approvals, while remaining
cognisant of community and consumer impacts.
• The CoGaTI recommendations, including the details of the proposed reforms
and transitional arrangements, are due at the end of 2019, and the proposed
reforms are targeted to commence from July 2022. Due to the urgency of the
identified need in this RIT-T, AEMO will begin the process of delivering the

© AEMO 2019 | Western Victoria Renewable Integration PACR 26
Matters raised in submissions by general
topic
AEMO response
• AEMO should consider the impact of the
Coordination of Generation and Transmission
Investment35 (CoGaTI) reforms prior to
concluding the RIT-T.
Project under the current arrangements and will consider the impact of any
material changes to assumptions, including regulatory changes introduced by
the CoGaTI review throughout the delivery of the Project.
Credible options considered in the RIT-T:
Power flow controllers provider greater network
benefits than fixed series capacitors.
The PADR budget estimate allowed for power flow controllers to manage
transmission line flows between Bulgana to North Ballarat. The PACR assessment
however has found that moving the Waubra Terminal Station connection,
together with the control scheme described in Section A8.2.1 is the most cost-
effective way to manage transmission line flows.
35 At https://www.aemc.gov.au/market-reviews-advice/coordination-generation-and-transmission-investment-implementation-access-and.
© AEMO 2019 | Western Victoria Renewable Integration PACR 27
5. Methodology and assumptions
5.1 Assumptions from the PADR
This section describes modelling assumptions used in this PACR that are the same as those used in
the PADR36.
5.1.1 Discount rate
A base discount rate of 6% (real, pre-tax) has been used in the NPV analysis, for all credible options. This is
consistent with the central commercial discount rate recommended by Energy Networks Australia (ENA) in its
RIT-T Economic Assessment Handbook37.
Sensitivity testing has been conducted on the base discount rate, with a lower bound discount rate of 3%,
and an upper bound discount rate of 10%. The change in discount rate did not change the outcome as to the
preferred option.
5.1.2 Reasonable scenarios
The RIT-T is a cost benefit analysis that includes an assessment of reasonable scenarios of future supply and
demand if each credible option were implemented, compared to the situation where no option is
implemented. A reasonable scenario represents a set of variables or parameters that are not expected to
change across each of the credible options or the base case.
This RIT-T analysis included four reasonable scenarios from the 2018 ISP, summarised below38, and one new
scenario to address stakeholder submissions:
1. Neutral – central projections of economic growth, future demand growth, fuel costs, technology cost
reductions, and distributed energy resources (DER) aggregation growth.
2. Neutral with storage initiatives – all the scenario settings of the Neutral scenario, combined with the
proposed Snowy 2.0 and Battery of the Nation pumped hydro storage projects, and associated
augmentations of the transmission network.
3. Slow change – compared with the Neutral scenario, assumed weaker economic and demand
consumption growth, lower levels of investments in energy efficiency, slower uptake of electric vehicles,
slower cost reductions in renewable generation technologies, and greater aggregation of DER.
4. Fast change – compared with the Neutral scenario, assumed stronger economic and demand growth,
higher levels of investments in energy efficiency, faster uptake of electric vehicles, faster cost reductions in
renewable generation technologies, and less aggregation of DER.
5. (New) No interconnector development (NoIC) – used the same assumptions as the Neutral scenario,
with no uncommitted interconnector developments. Refer to Section 5.2.2 for details.
All scenarios were assessed using two sets of generation capital costs, as described in Section 5.2.3.
36 At https://www.aemo.com.au/-/media/Files/Electricity/NEM/Planning_and_Forecasting/Victorian_Transmission/2018/Western-Victoria-Renewable-
Integration-RIT-T-PADR.PDF.
37 At https://www.energynetworks.com.au/sites/default/files/ena_rit-t_handbook_15_march_2019.pdf.
38 More detail on 2018 ISP scenario settings is in Section 2.7 of the 2018 ISP, at http://www.aemo.com.au/Electricity/National-Electricity-Market-
NEM/Planning-and-forecasting/Integrated-System-Plan.

© AEMO 2019 | Western Victoria Renewable Integration PACR 28
The scenarios assumed the following market and policy settings:
• Emissions trajectories – reduce emissions to 28% on 2005 levels by 2030.
• VRET – an expanded VRET target, as described in Section 5.2.8.
• Queensland Renewable Energy Target (QRET) – 50% renewables by 2030.
5.1.3 Demand
The PADR modelling was carried out based on the 2017 Electricity Statement of Opportunities (ESOO)
demand forecasts, consistent with the 2018 ISP. 2018 ESOO demand forecasts have since been published,
showing stronger projected demand growth than the previous forecasts39.
The Victorian Government’s Solar Homes package was announced in August 2018, after modelling for the
2018 ESOO was completed. AEMO considers that the impact of this program will reduce operational demand
by increasing rates of rooftop solar photovoltaic (PV) installation and reducing energy consumption from the
grid, and that continuing to use the 2017 ESOO forecast in the PACR will adequately capture this impact on
projected demand. Figure 2 compares the 2017 and 2018 ESOO demand forecasts.
The PACR therefore continued to use the 2017 ESOO demand forecasts in its market modelling.
Figure 2 Comparison of annual energy consumption in 2017 and 2018 ESOO forecasts
Note: the 2018 ESOO replaced previous Strong and Weak scenarios with Fast change and Slow change respectively. The differences are
outlined in the 2018 ESOO.
Probability of Exceedance
The PACR modelling used 50% Probability of Exceedance (POE)40 projections, to reflect an expectation of
typical maximum demand conditions. Market modelling in the early stages of this RIT-T using both 50% POE
and 10% POE demand traces (which reflect an expectation of more extreme maximum demand conditions,
39 2017 and 2018 ESOOs are at http://www.aemo.com.au/Electricity/National-Electricity-Market-NEM/Planning-and-forecasting/NEM-Electricity-Statement-
of-Opportunities.
40 Probability of exceedance (POE) means the probability, as a percentage, that a maximum demand forecast will be met or exceeded (for example, due to
weather conditions). For example, a 10% POE forecast is expected to be met or exceeded, on average, only one year in 10, so considers more extreme
weather (also called 1-in-10-year conditions) than a 50% POE forecast, which is expected to be met or exceeded, on average, one year in two.

© AEMO 2019 | Western Victoria Renewable Integration PACR 29
driven by variations in weather conditions) showed there was an immaterial impact on net market benefits.
Therefore, all additional market modelling for the PACR was carried out using 50% POE demand traces only.
5.1.4 Market modelling methodology
AEMO uses market dispatch modelling to estimate the market benefits associated with credible options. This
is done by comparing the ‘state of the world’ in the base case (or ‘do nothing’ case) with the ‘state of the
world’ with each credible option in place.
The ‘state of the world’ is essentially a reasonable and consistent description of the NEM outcomes expected
in each case, and includes the type, quantity, and timing of future generation, storage, and transmission
investment, as well as the market dispatch outcomes over the modelling period.
AEMO maintains four mutually-interacting planning models, shown in Figure 3. These models incorporate the
assumptions about future development described by the scenarios, and simulate the operation of energy
networks to determine a reasonable view as to how those networks may develop under different demand,
technology, policy, and environmental conditions.
Figure 3 Market modelling process
This PACR primarily used two of these market models for its analysis:
• Capacity Outlook Model – determines the most cost-efficient long-term trajectory of generator and
transmission investments and retirements to maintain power system reliability. Two variants exist and were
used in the analysis:
– Long-Term Integrated Model (IM) – co-optimised model which considers interdependencies
between gas and electricity markets to determine optimal thermal generation investments, retirements,
transmission, and pipeline investment plans, over the longest time horizon (25 years or beyond).
– Detailed Long-Term (DLT) Model – co-optimised model of the electricity system in isolation to the
gas market, optimising new generation investments and sub-regional transmission developments,
© AEMO 2019 | Western Victoria Renewable Integration PACR 30
using inter-regional transmission and other long-lived thermal generation development decisions
produced by the IM capacity outlook model. The DLT model is a more granular capacity outlook
approach that provides chronological, detailed representations of the long term via a multi-step solve,
thus with reduced foresight relative to the IM.
• Time-Sequential Model – carries out an hourly simulation of generation dispatch and regional demand
while considering various power system limitations, generator forced outages, variable generation
availability, and bidding models. This model validates insights on power system reliability, available
generation reserves, emerging network limitations, and other operational concerns. Depending on the
study this model is used for, the generation and transmission outlook from the capacity outlook model
may be incorporated.
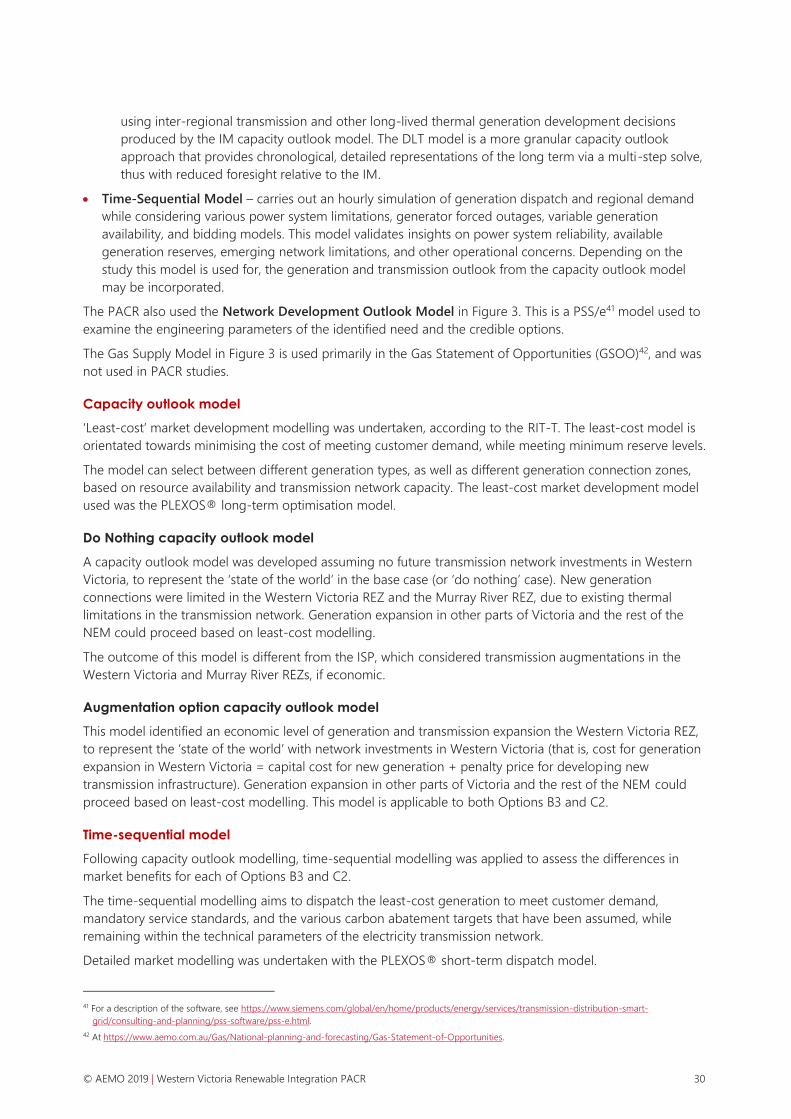
The PACR also used the Network Development Outlook Model in Figure 3. This is a PSS/e41 model used to
examine the engineering parameters of the identified need and the credible options.
The Gas Supply Model in Figure 3 is used primarily in the Gas Statement of Opportunities (GSOO)42, and was
not used in PACR studies.
Capacity outlook model
‘Least-cost’ market development modelling was undertaken, according to the RIT-T. The least-cost model is
orientated towards minimising the cost of meeting customer demand, while meeting minimum reserve levels.
The model can select between different generation types, as well as different generation connection zones,
based on resource availability and transmission network capacity. The least-cost market development model
used was the PLEXOS® long-term optimisation model.
Do Nothing capacity outlook model
A capacity outlook model was developed assuming no future transmission network investments in Western
Victoria, to represent the ‘state of the world’ in the base case (or ‘do nothing’ case). New generation
connections were limited in the Western Victoria REZ and the Murray River REZ, due to existing thermal
limitations in the transmission network. Generation expansion in other parts of Victoria and the rest of the
NEM could proceed based on least-cost modelling.
The outcome of this model is different from the ISP, which considered transmission augmentations in the
Western Victoria and Murray River REZs, if economic.
Augmentation option capacity outlook model
This model identified an economic level of generation and transmission expansion the Western Victoria REZ,
to represent the ‘state of the world’ with network investments in Western Victoria (that is, cost for generation
expansion in Western Victoria = capital cost for new generation + penalty price for developing new
transmission infrastructure). Generation expansion in other parts of Victoria and the rest of the NEM could
proceed based on least-cost modelling. This model is applicable to both Options B3 and C2.
Time-sequential model
Following capacity outlook modelling, time-sequential modelling was applied to assess the differences in
market benefits for each of Options B3 and C2.
The time-sequential modelling aims to dispatch the least-cost generation to meet customer demand,
mandatory service standards, and the various carbon abatement targets that have been assumed, while
remaining within the technical parameters of the electricity transmission network.
Detailed market modelling was undertaken with the PLEXOS® short-term dispatch model.
41 For a description of the software, see https://www.siemens.com/global/en/home/products/energy/services/transmission-distribution-smart-
grid/consulting-and-planning/pss-software/pss-e.html.
42 At https://www.aemo.com.au/Gas/National-planning-and-forecasting/Gas-Statement-of-Opportunities.

© AEMO 2019 | Western Victoria Renewable Integration PACR 31
Model parameters
• Generation and interconnector expansion plans were obtained from the capacity outlook model
described above.
• Generator reliability, technical, and financial settings were obtained from the 2018 ISP assumptions
workbook43, except where assumption changes are noted in Section 5.2.
• Generation and demand side resources were dispatched to meet load in order from lowest to highest
short-run marginal cost.
• Transmission network parameters included in the modelling are described in Section 5.1.5.
• An improvement to coal generation dispatch is described in Section 5.2.9.
Model outputs
This model produced an hourly pricing and dispatch solution for generation, which was used to calculate
operational benefits (reduction in fuel and operation and maintenance costs). These benefits primarily stem
from reduced curtailment of renewable generation output.
5.1.5 Transmission network parameters
Constraint equations and dynamic rating traces are two key inputs to the time-sequential model.
Constraint equations
Constraint equations are a mathematical representation of transmission network parameters that AEMO uses
to manage power system limitations, generation dispatch, and frequency control ancillary services (FCAS)
requirements.
Thermal constraint equations were built for each augmentation option described in Section 3 under system
normal and contingency [(N-0)44 and (N-1)45] conditions for all transmission plant in the study area with a
voltage level of 220 kV and above. Constraint equations were validated against results of power system
simulation studies under different demand, interconnector, and generation dispatch scenarios.
Constraint equations for network stability limitations, and thermal capacity limitations outside of the study
area were obtained from the 2018 ISP46.
In general, the following types of constraints were considered:
• Thermal capacity – for managing the power flow on a transmission element so it does not exceed a
rating (either continuous or short term) under normal conditions or following a credible contingency47.
• Voltage stability – for managing transmission voltages and reactive power margin so they remain at
acceptable levels after a credible contingency.
• Transient stability – for managing network flows to ensure the continued synchronism of all generators
on the power system following a credible contingency.
• Oscillatory stability – for managing network flows to ensure the damping of power system oscillations is
adequate under system normal and following a credible contingency.
43 At https://www.aemo.com.au/-/media/Files/Electricity/NEM/Planning_and_Forecasting/ISP/2018/2018-Integrated-System-Plan--Modelling-
Assumptions.xlsx.
44 Steady state operating condition with the power system in a secure operating state.
45 The unexpected disconnection of one operating generating unit, or the unexpected disconnection of one major item of transmission plant (such as
transmission line, transformer or reactive plant).
46 2018 ISP modelling database, at https://www.aemo.com.au/Electricity/National-Electricity-Market-NEM/Planning-and-forecasting/Integrated-System-
Plan/ISP-database.
47 The unexpected disconnection of one operating generating unit, or the unexpected disconnection of one major item of transmission plant (such as
transmission line, transformer or reactive plant).
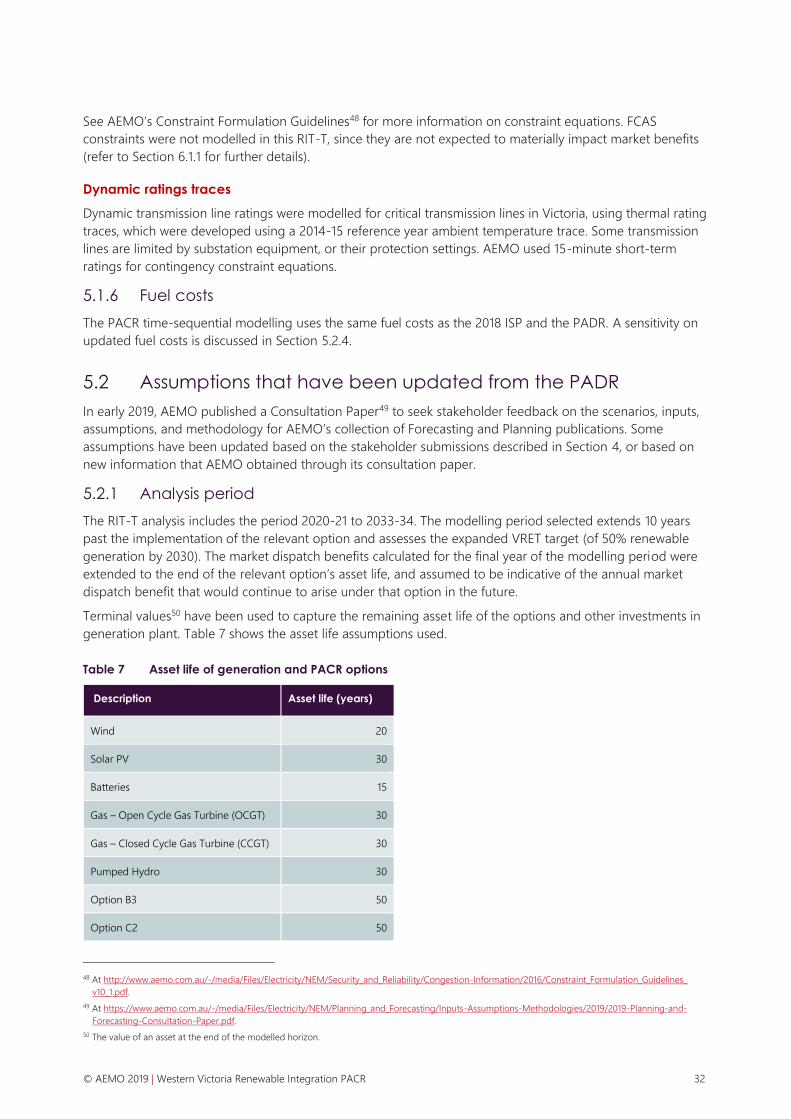
© AEMO 2019 | Western Victoria Renewable Integration PACR 32
See AEMO’s Constraint Formulation Guidelines48 for more information on constraint equations. FCAS
constraints were not modelled in this RIT-T, since they are not expected to materially impact market benefits
(refer to Section 6.1.1 for further details).
Dynamic ratings traces
Dynamic transmission line ratings were modelled for critical transmission lines in Victoria, using thermal rating
traces, which were developed using a 2014-15 reference year ambient temperature trace. Some transmission
lines are limited by substation equipment, or their protection settings. AEMO used 15-minute short-term
ratings for contingency constraint equations.
5.1.6 Fuel costs
The PACR time-sequential modelling uses the same fuel costs as the 2018 ISP and the PADR. A sensitivity on
updated fuel costs is discussed in Section 5.2.4.
5.2 Assumptions that have been updated from the PADR
In early 2019, AEMO published a Consultation Paper49 to seek stakeholder feedback on the scenarios, inputs,
assumptions, and methodology for AEMO’s collection of Forecasting and Planning publications. Some
assumptions have been updated based on the stakeholder submissions described in Section 4, or based on
new information that AEMO obtained through its consultation paper.
5.2.1 Analysis period
The RIT-T analysis includes the period 2020-21 to 2033-34. The modelling period selected extends 10 years
past the implementation of the relevant option and assesses the expanded VRET target (of 50% renewable
generation by 2030). The market dispatch benefits calculated for the final year of the modelling period were
extended to the end of the relevant option’s asset life, and assumed to be indicative of the annual market
dispatch benefit that would continue to arise under that option in the future.
Terminal values50 have been used to capture the remaining asset life of the options and other investments in
generation plant. Table 7 shows the asset life assumptions used.
Table 7 Asset life of generation and PACR options
Description Asset life (years)
Wind 20
Solar PV 30
Batteries 15
Gas – Open Cycle Gas Turbine (OCGT) 30
Gas – Closed Cycle Gas Turbine (CCGT) 30
Pumped Hydro 30
Option B3 50
Option C2 50
48 At http://www.aemo.com.au/-/media/Files/Electricity/NEM/Security_and_Reliability/Congestion-Information/2016/Constraint_Formulation_Guidelines_
v10_1.pdf.
49 At https://www.aemo.com.au/-/media/Files/Electricity/NEM/Planning_and_Forecasting/Inputs-Assumptions-Methodologies/2019/2019-Planning-and-
Forecasting-Consultation-Paper.pdf.
50 The value of an asset at the end of the modelled horizon.

© AEMO 2019 | Western Victoria Renewable Integration PACR 33
5.2.2 New scenarios and sensitivities
New scenarios and sensitivity studies were added to PACR assessments to address stakeholder submissions.
New scenarios
The No interconnector development (NoIC) scenario assumed that the New South Wales to Queensland,
Victoria to New South Wales, and South Australia to New South Wales interconnectors described in
Section 5.2.7 do not come into service.
Additional sensitivities
In addition to the base assumptions described above, this RIT-T used sensitivity studies to examine key risks
to market benefits. This is essential, given the need to plan and recommend investment in an industry in
transition, where there is a level of inherent uncertainty. The description and purpose of each sensitivity study
is described in Table 8 below.
Table 8 Sensitivity studies in this PACR
Parameter Sensitivity
Project cost ±30% (same as PADR).
Discount rate +4% and -3% (PADR considered ±3%).
Scenario weightings As described in Section 5.2.5.
KerangLink timing ± 5 years (from the 2018 ISP timing of 2035).
Capital cost of new generation As described in Section 5.2.3.
Generation fuel cost As described in Section 5.2.4.
Extend option In response to stakeholder feedback, a sensitivity to Option C2 was tested, where the new
220 kV double circuit transmission line is extended from Bulgana to Horsham to MurraWarra.
5.2.3 Capital costs for generation development
Two sets of generation capital costs were applied.
These were based on the Commonwealth Scientific and Industrial Research Organisation’s Global and Local
Learning Model (CSIRO GALLM) build cost projections, and published in AEMO’s 2019 Planning and
Forecasting Consultation Paper51.
The build costs are dependent on global technology deployment, and are named "4-degrees" and
"2-degrees" based on global climate policy goals. Further details on projections of electricity generation
technology costs are available on the CSIRO website52. The 4-degrees capital costs were given a 70%
weighting, and the 2-degrees capital costs were given a 30% weighting (see Section 5.2.5).
5.2.4 Fuel costs
The 2019 Planning and Forecasting Consultation Paper identified updated fuel costs, which are compared to
the 2018 ISP fuel costs in Figure 4 and Figure 5.
51 At https://www.aemo.com.au/-/media/Files/Electricity/NEM/Planning_and_Forecasting/Inputs-Assumptions-Methodologies/2019/2019-Planning-and-
Forecasting-Consultation-Paper.pdf.
52 At https://publications.csiro.au/rpr/download?pid=csiro:EP189502&dsid=DS1.

© AEMO 2019 | Western Victoria Renewable Integration PACR 34
The comparison shows that:
• Black and brown coal price forecasts are higher overall, but black coal has a larger increase.
• Gas price forecasts are lower between 2019-2025, but higher from 2026-35
The change in fuel cost is not expected to impact the generation dispatch outcomes of this RIT-T, because it
does not change the merit order of generation, and renewable generation and brown coal are still expected
to be dispatched before other forms of generation in the NEM (such as gas and black coal).
If the PACR time-sequential modelling incorporated the 2019 fuel costs described in this section, net market
benefits would be expected to increase, because:
• Renewable generation has a fuel cost of zero, and the fuel cost of Victorian brown coal is not forecast to
increase by much, relative to other generation fuel sources. Therefore, the difference between the fuel
cost of renewable generation, and Victorian brown coal versus other sources of generation, would have
increased, and also increased the fuel cost savings.
• In 2020-27, the options assessed in the PACR have a higher fuel cost compared to the Do Nothing option
(Refer to Section 6.3 for details). The projected increase in coal prices would worsen the increase in
generation costs, but the projected decrease in gas prices would provide fuel cost savings. The overall
changes are expected to even out, and will not change the preferred option, or the PACR conclusion.
The overall outcome of the changes in fuel cost is that the net market benefits of both Options B3 and C2 will
increase, but there is no expected impact on the ranking of the options.
Figure 4 Comparing fuel cost of coal, Neutral scenario

© AEMO 2019 | Western Victoria Renewable Integration PACR 35
Figure 5 Comparing fuel cost of gas, Neutral scenario
5.2.5 Weightings applied to each scenario
Four separate weightings were applied to the reasonable scenarios to test if different weightings have an
impact on the preferred option. The ordering of options did not change. “4-deg” and “2-deg” in the table
below refers to the 4-degrees and 2-degrees capital costs described in Section 5.2.3.
Table 9 Weightings applied to reasonable scenarios
Scenario
weightings
Neu
tral 4
-deg
Neu
tral+
sto
rag
e
4-d
eg
Slo
w c
han
ge
4-d
eg
Fast
ch
an
ge
4-d
eg
No
IC
4-d
eg
Neu
tral
2-d
eg
Neu
tral+
sto
rag
e
2-d
eg
Slo
w c
han
ge
2-d
eg
Fast
ch
an
ge
2-d
eg
No
IC
2-d
eg
Scenario weighting A
– all equal 14% 14% 14% 14% 14% 6% 6% 6% 6% 6%
Scenario weighting B
– 60 % Neutral 21% 21% 9% 9% 9% 9% 9% 4% 4% 4%
Scenario weighting C
– 60% Slow change 7% 7% 42% 7% 7% 3% 3% 18% 3% 3%
Scenario weighting D
– 60% Fast change 7% 7% 7% 42% 7% 3% 3% 3% 18% 3%
5.2.6 Improvement to Victoria to New South Wales interconnector limits
AEMO studied the impact of the proposed options on the Victoria to New South Wales transient and voltage
stability limits, under periods of high Victoria to New South Wales export. Multiple high export snapshots
representing a variety of different network operating conditions were used for this study. The study was
carried out using PSS/e dynamic simulations.

© AEMO 2019 | Western Victoria Renewable Integration PACR 36
In general, the following steps were taken:
• The study cases were modified to represent the Do Nothing scenario, and each option.
• Victoria to New South Wales export was progressively increased in the study cases, to find the limit where
the cases became unstable, based on the criteria described in the next sections.
• The maximum stable transfer limit was recorded for:
– Do Nothing.
– Option B3.
– Option C2.
Transient stability limit
For this purpose, a study case is considered unstable if one of the following criteria is met:
• More than four machine rotor angles deviate greater than 160 degrees.
• Rotor angle deviation spread between all machines greater than 360 degrees.
• Standard deviation of angle deviation spread less than or equal to 3 degrees for a duration of 2 seconds.
• Out-of-step conditions detected.
Voltage stability limit
NER S5.1.8 states that the reactive power margin (expressed as a capacitive reactive power [in MVAr]) must
not be less than one percent of the maximum fault level (in MVA) at any connection point.
For this purpose, a study case is considered stable if the following criteria are met:
• The minimum reactive power margin at every monitored bus is maintained.
• The pre-contingent and post-contingent minimum voltage at every monitored bus is within
operating limits.
Improvement on interconnector export limit
Table 10 shows the improvement in Victoria to New South Wales export limit that has been assumed in
market modelling, under both Option B3 and Option C2, and based on the assessment described above.
Table 10 Improvement to Victoria to New South Wales interconnector export limit
Constraint description Option B3 MW
improvement
Option C2 MW
improvement
Prevent transient instability for a fault and trip of the Hazelwood to South
Morang 500 kV transmission line.
115 170
Avoid voltage collapse around Murray for loss of all Portland Aluminium
Smelter potlines.
- 122
Note: the increase to interconnector export capability assumes that Option B3 or Option C2 (as applicable), a new South Australia to New
South Wale interconnector, a new South Morang 500/330 kV transformer and uprating of the South Morang – Dederang 330 kV and the
Canberra – Upper Tumut 330 kV lines are in service.
5.2.7 Interconnector development
The timing of the new South Australia to New South Wales interconnector, together with an augmentation
from Buronga to Red Cliffs, has been updated based on ElectraNet’s PACR53 for the South Australian Energy
Transformation RIT-T.
53 At https://www.electranet.com.au/wp-content/uploads/projects/2016/11/SA-Energy-Transformation-PACR.pdf.
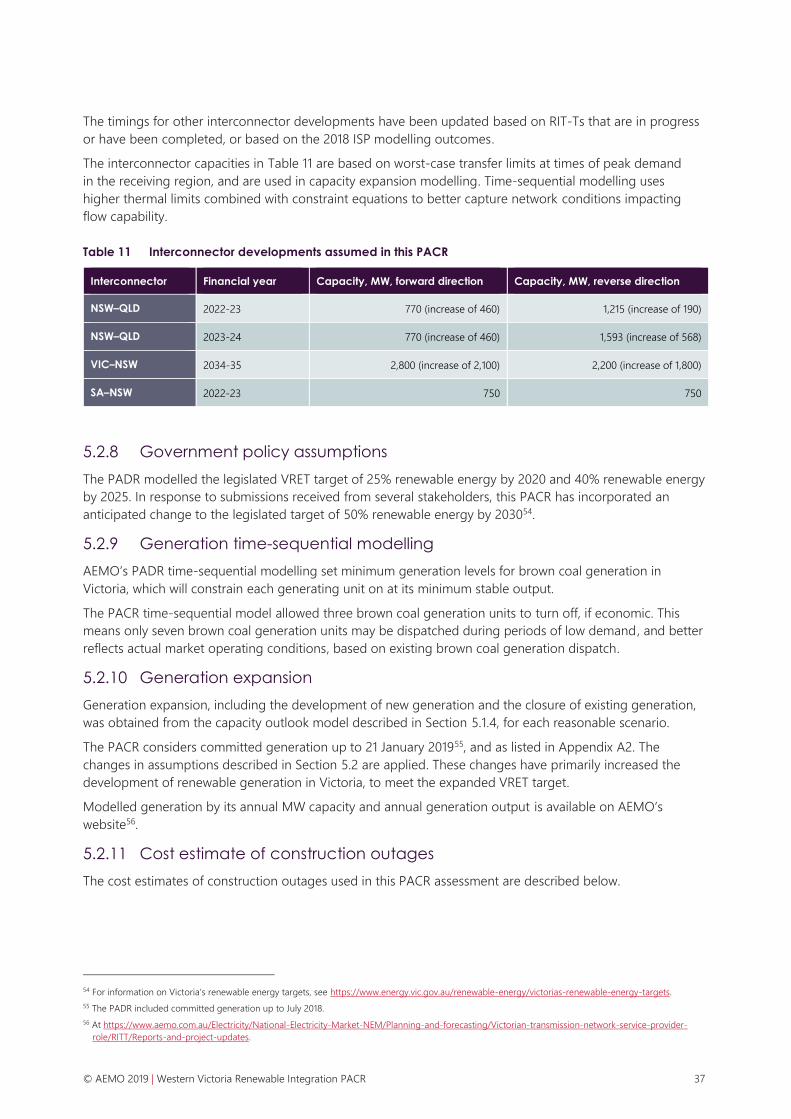
© AEMO 2019 | Western Victoria Renewable Integration PACR 37
The timings for other interconnector developments have been updated based on RIT-Ts that are in progress
or have been completed, or based on the 2018 ISP modelling outcomes.
The interconnector capacities in Table 11 are based on worst-case transfer limits at times of peak demand
in the receiving region, and are used in capacity expansion modelling. Time-sequential modelling uses
higher thermal limits combined with constraint equations to better capture network conditions impacting
flow capability.
Table 11 Interconnector developments assumed in this PACR
Interconnector Financial year Capacity, MW, forward direction Capacity, MW, reverse direction
NSW–QLD 2022-23 770 (increase of 460) 1,215 (increase of 190)
NSW–QLD 2023-24 770 (increase of 460) 1,593 (increase of 568)
VIC–NSW 2034-35 2,800 (increase of 2,100) 2,200 (increase of 1,800)
SA–NSW 2022-23 750 750
5.2.8 Government policy assumptions
The PADR modelled the legislated VRET target of 25% renewable energy by 2020 and 40% renewable energy
by 2025. In response to submissions received from several stakeholders, this PACR has incorporated an
anticipated change to the legislated target of 50% renewable energy by 203054.
5.2.9 Generation time-sequential modelling
AEMO’s PADR time-sequential modelling set minimum generation levels for brown coal generation in
Victoria, which will constrain each generating unit on at its minimum stable output.
The PACR time-sequential model allowed three brown coal generation units to turn off, if economic. This
means only seven brown coal generation units may be dispatched during periods of low demand, and better
reflects actual market operating conditions, based on existing brown coal generation dispatch.
5.2.10 Generation expansion
Generation expansion, including the development of new generation and the closure of existing generation,
was obtained from the capacity outlook model described in Section 5.1.4, for each reasonable scenario.
The PACR considers committed generation up to 21 January 201955, and as listed in Appendix A2. The
changes in assumptions described in Section 5.2 are applied. These changes have primarily increased the
development of renewable generation in Victoria, to meet the expanded VRET target.
Modelled generation by its annual MW capacity and annual generation output is available on AEMO’s
website56.
5.2.11 Cost estimate of construction outages
The cost estimates of construction outages used in this PACR assessment are described below.
54 For information on Victoria’s renewable energy targets, see https://www.energy.vic.gov.au/renewable-energy/victorias-renewable-energy-targets.
55 The PADR included committed generation up to July 2018.
56 At https://www.aemo.com.au/Electricity/National-Electricity-Market-NEM/Planning-and-forecasting/Victorian-transmission-network-service-provider-
role/RITT/Reports-and-project-updates.
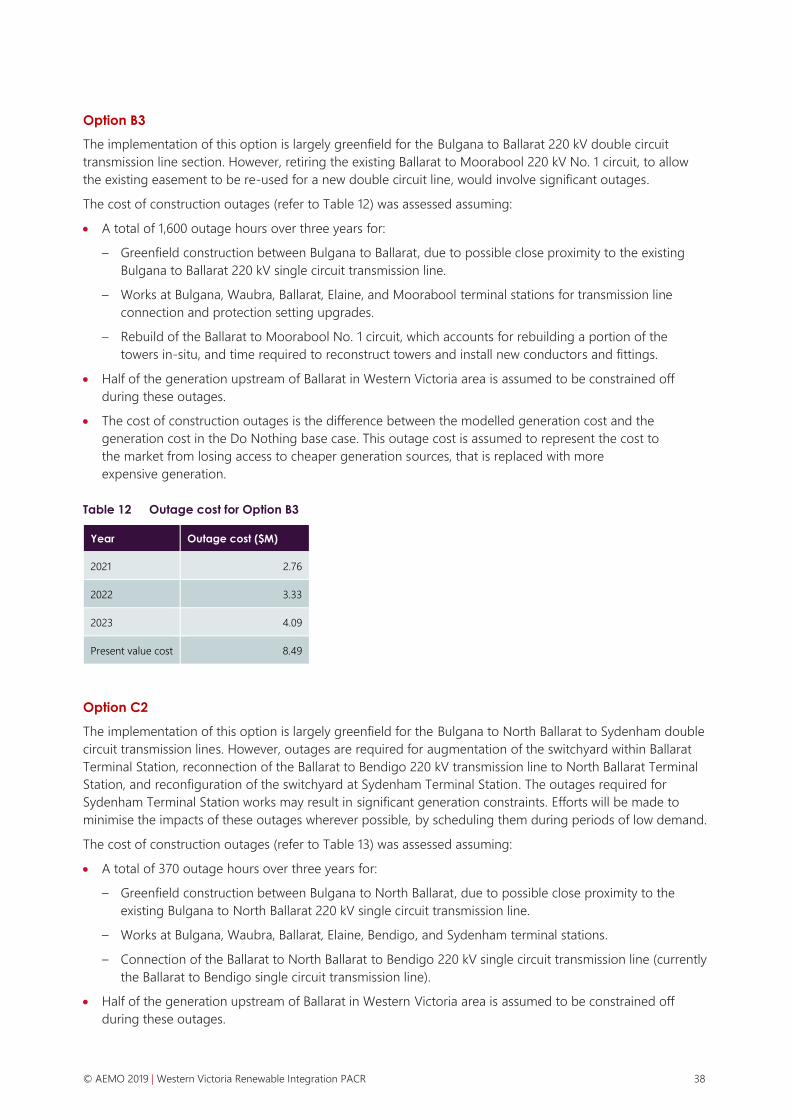
© AEMO 2019 | Western Victoria Renewable Integration PACR 38
Option B3
The implementation of this option is largely greenfield for the Bulgana to Ballarat 220 kV double circuit
transmission line section. However, retiring the existing Ballarat to Moorabool 220 kV No. 1 circuit, to allow
the existing easement to be re-used for a new double circuit line, would involve significant outages.
The cost of construction outages (refer to Table 12) was assessed assuming:
• A total of 1,600 outage hours over three years for:
– Greenfield construction between Bulgana to Ballarat, due to possible close proximity to the existing
Bulgana to Ballarat 220 kV single circuit transmission line.
– Works at Bulgana, Waubra, Ballarat, Elaine, and Moorabool terminal stations for transmission line
connection and protection setting upgrades.
– Rebuild of the Ballarat to Moorabool No. 1 circuit, which accounts for rebuilding a portion of the
towers in-situ, and time required to reconstruct towers and install new conductors and fittings.
• Half of the generation upstream of Ballarat in Western Victoria area is assumed to be constrained off
during these outages.
• The cost of construction outages is the difference between the modelled generation cost and the
generation cost in the Do Nothing base case. This outage cost is assumed to represent the cost to
the market from losing access to cheaper generation sources, that is replaced with more
expensive generation.
Table 12 Outage cost for Option B3
Year Outage cost ($M)
2021 2.76
2022 3.33
2023 4.09
Present value cost 8.49
Option C2
The implementation of this option is largely greenfield for the Bulgana to North Ballarat to Sydenham double
circuit transmission lines. However, outages are required for augmentation of the switchyard within Ballarat
Terminal Station, reconnection of the Ballarat to Bendigo 220 kV transmission line to North Ballarat Terminal
Station, and reconfiguration of the switchyard at Sydenham Terminal Station. The outages required for
Sydenham Terminal Station works may result in significant generation constraints. Efforts will be made to
minimise the impacts of these outages wherever possible, by scheduling them during periods of low demand.
The cost of construction outages (refer to Table 13) was assessed assuming:
• A total of 370 outage hours over three years for:
– Greenfield construction between Bulgana to North Ballarat, due to possible close proximity to the
existing Bulgana to North Ballarat 220 kV single circuit transmission line.
– Works at Bulgana, Waubra, Ballarat, Elaine, Bendigo, and Sydenham terminal stations.
– Connection of the Ballarat to North Ballarat to Bendigo 220 kV single circuit transmission line (currently
the Ballarat to Bendigo single circuit transmission line).
• Half of the generation upstream of Ballarat in Western Victoria area is assumed to be constrained off
during these outages.

© AEMO 2019 | Western Victoria Renewable Integration PACR 39
• The cost of construction outages is the difference between the modelled generation cost and the
generation cost in the Do Nothing base case. This outage cost is assumed to represent the cost to
the market from losing access to cheaper generation sources, that is replaced with more
expensive generation.
• In addition to the outages above, connection of the North Ballarat to Sydenham 500 kV double circuit
transmission lines in 2024 is expected to result in short-term generation constraints while several 500 kV
transmission lines are out of service during construction.
– During this outage, AEMO assumes that the local gas generation in Western Victoria is constrained
on and will displace cheaper coal generation from the Latrobe Valley, resulting in a potential
market impact.
Table 13 Outage cost for Option C2
Year Outage cost ($M)
2022 0.75
2023 0.92
2024 1.88
Present value cost 2.75
5.2.12 Capital cost estimates
The cost of each option was estimated by obtaining quotes from three different vendors, and AusNet
Services, for transmission line works, which are the main cost component.
In addition, AusNet Services provided cost estimates for:
• Contracts (sub‐contracting).
• Administration and overheads.
• Project management.
• Division of costs between capital expenditure and operating expenditure.
• All station upgrade works, including:
– Plant and equipment.
– Civils.
– Internal labour.
Capital expenditure for cost estimates have been further considered in the PACR and have an accuracy of
±30%. Operational expenditure has also been further considered.
Table 14 shows the estimated capital costs for the options assessed in the PACR received from different
parties. The average cost has been applied for cost benefit assessments. The cost of construction outages
described in Section 5.2.11 should be added to the capital costs in the table.
The final cost of the preferred option will be obtained through a competitive tender process, as described in
Section 7.3.

© AEMO 2019 | Western Victoria Renewable Integration PACR 40
Table 14 Capital cost estimates of each option from different parties
Option Average capital
cost ($M,
nominal, used in
NPV calculations)
Capital cost
– AusNet
Services
estimate
($M,
nominal)
Capital cost
– Vendor A
estimate
($M,
nominal)
Capital cost
– Vendor B
estimate
($M,
nominal)
Capital cost
– Vendor C
estimate
($M,
nominal)
Operating costs
(as a
percentage of
capital costs)
Option B3 335 354 325 304 357 3.8%
Option C2 –
220 kV
component
188 200 182 168 202 3.5%
Option C2 –
500 kV
component and
new terminal
station
285 321 283 250 287

© AEMO 2019 | Western Victoria Renewable Integration PACR 41
6. Market benefits
The market benefits assessment in this PACR has been updated, based on new information
and matters raised in stakeholder submissions.
The preferred option is Option C2, unchanged from the PADR:
• Option C2 has the highest projected net market benefits across all scenarios and
sensitivities assessed in this PACR.
• The market benefits are mainly due to savings in fuel and capital costs, facilitating future
transmission expansion, and improvement to interconnector stability limits.
The market benefits for Option B3 and Option C2 have increased since the publication of
the PADR.
6.1 Classes of market benefits not expected to be material
PADR Section 6.1 identified classes of market benefits that were not expected to be material to this RIT-T.
A class of market benefit is considered immaterial if either:
• The class is unlikely to materially affect the assessment outcome of the credible options for this RIT-T, or
• The estimated cost of undertaking the analysis to quantify market benefits of the class will be
disproportionate to the scale, size, and potential benefits of the credible options being considered.
The classes of market benefits that are still considered immaterial are:
• Changes in ancillary services costs – AEMO has assessed if the options will impact ancillary service costs
and concluded that there is no expected change to the costs of FCAS, Network Control Ancillary Services
(NCAS), or System Restart Ancillary Services (SRAS) because of the options being considered. These costs
are therefore not material to the outcome of the RIT-T assessment. See Section 6.1.1 for more information.
• Changes in voluntary/involuntary load curtailment – this RIT-T is driven by new generation connections
and there is no expected change to voluntary or involuntary load curtailment because of the options
being considered.
• Competition benefits – competition in Victoria is expected to increase over the modelling period, as more
generation enters the market. However, there are no material competition benefits expected as a result of
augmentations proposed by this RIT-T, because Victoria currently has multiple different generation service
providers and is connected to the NEM via three interconnectors. Although some of the options
considered in this RIT-T help to improve interconnector limits, they are unlikely to impact competition
benefits in other states.
• Negative of any penalty for not meeting the renewable energy target – the 2030 VRET target of at least
50% renewable generation by 2030 was met in the Do Nothing case for all reasonable scenarios.
Therefore, this class of market benefit is not material to the PACR.
• Changes in network losses – market modelling shows that network losses increase over time57, however
this is largely due to renewable generation development in remote areas. The options considered in this
PACR will have a similar impact on losses, and this will not change the outcome of the preferred option.
57 Losses are the difference between the total generation and total demand.
© AEMO 2019 | Western Victoria Renewable Integration PACR 42
6.1.1 Changes in ancillary services costs
In response to stakeholder submissions, AEMO re-assessed whether Options B3 and C2 (referred to as the
options in this section) would result in an increase in ancillary services costs. The following sections
demonstrate that the options will not materially change ancillary service costs, compared to the Do Nothing
scenario.
All modelled generation outputs are available on AEMO’s website58.
Voltage control ancillary service (VCAS)
Under low demand conditions, over-voltages can occur in Victoria following a credible contingency. The
options have allowed for sufficient reactive compensation to prevent further voltage overloads, and therefore
should not have an impact on VCAS costs.
System restart ancillary service (SRAS)
SRAS is historically provided by gas, hydro, and coal generation in the NEM. AEMO’s market modelling shows
that the options will not decrease the number of generators that can provide SRAS, and may increase the
number of generators providing SRAS by enabling more generation connections. The options are therefore
not expected to materially increase SRAS costs.
Frequency control ancillary service (FCAS)
FCAS requirements can increase if there is a large increase in intermittent generation. AEMO’s market
modelling shows that the options do not materially increase FCAS costs, because the level of intermittent
generation modelled is limited to that required to meet the VRET. The VRET is met in all scenarios.
Fault level shortfalls
Fault level shortfalls could occur with an increase in inverter-connected generation and a decrease in
synchronous generation. AEMO’s market modelling shows that the options are projected to slightly increase
the output of synchronous generation in Victoria, so should not increase the risk of fault level shortfalls,
compared to the Do Nothing option.
6.2 Quantification of classes of material market benefits for
each option
The classes of market benefits that are material in the case of this RIT-T are:
• Changes in fuel consumption arising through different patterns of generation dispatch.
• Changes in cost to parties other than the transmission network service provider (TNSP), due to:
– Differences in the timing of the installation of new plant.
– Differences in capital costs of different plant.
– Differences in the operational and maintenance costs of different plant.
• Differences in the timing of transmission investment.
• Additional option value – this PACR assessed option value benefits using the additional scenarios and
sensitivities described in Section 5.2.2. Option value benefits are not separately itemised.
The main market benefits of each of Options B3 and C2 are described in Section 6.3.1 and 6.3.2.
58 At https://www.aemo.com.au/Electricity/National-Electricity-Market-NEM/Planning-and-forecasting/Victorian-transmission-network-service-provider-
role/RITT/Reports-and-project-updates.

© AEMO 2019 | Western Victoria Renewable Integration PACR 43
6.2.1 Changes in fuel consumption
AEMO calculated the difference in total generation costs between the Do Nothing base case and cases with
each of Options B3 and C2 in place. If cases with the option in place have a lower total generation cost than
the Do Nothing case, then the market benefit is positive.
Generation costs include fuel consumption cost, variable operation and maintenance cost, and any emissions
costs. Generation costs are calculated for the entire NEM and will therefore capture benefits to states other
than Victoria. Refer to “Market benefits calculations” on AEMO’s website59 for the breakdown of fuel cost
savings by each state and for each year.
The PLEXOS® model is optimised to always identify the least-cost generation dispatch.
6.2.2 Changes in costs for other parties
“Other parties” in the context of this analysis refers to costs incurred by market participants60 due to:
• Differences in the timing of the installation of new generation, where the deferral of capital investments is
a positive market benefit.
• Differences in the capital cost of generation investment, where reducing costs is a positive market benefit.
AEMO modelled the least-cost generation expansion required to meet customer demand under various
scenarios, using the Capacity outlook model described in Section 5.1.4. The modelling showed that
transmission network augmentations in Victoria tended to result in a lower-cost generation expansion plan,
due to:
• Deferral of new generation capacity built.
• Reducing the total megawatt capacity of new generation built.
The difference between capital costs under the Do Nothing base case and the option cases represents the
market benefits of the studied option. Capital cost savings are calculated for the entire NEM and will
therefore capture benefits to states other than Victoria. Refer to “Market benefits calculations” on AEMO’s
website61 for further information on the capital cost savings identified in this PACR.
6.2.3 Differences in the timing of transmission investment
AEMO’s 2018 ISP identified that transmission augmentation from Sydenham to Ballarat to Kerang to
Darlington Point in New South Wales will be required by 2035. Part of this augmentation is within the study
area of this RIT-T. Therefore, in meeting the identified need of this RIT-T, Option C2 in this RIT-T takes into
account the benefits of reducing the future cost of KerangLink, compared to Option B3.
6.2.4 System strength improvements
All the new transmission lines proposed in this RIT-T will increase fault levels at the terminal stations they are
connecting to, and therefore increase system strength. These benefits have not been quantified for the
purposes of the RIT-T.
6.3 Net market benefit assessment
Refer to “Market benefits calculations” on AEMO’s website62 for net market benefits under each assessed
scenario and sensitivity.
59 At https://www.aemo.com.au/Electricity/National-Electricity-Market-NEM/Planning-and-forecasting/Victorian-transmission-network-service-provider-
role/RITT/Reports-and-project-updates.
60 Parties other than AEMO in its capacity as one of the Victorian TNSPs, or AusNet Services.
61 At https://www.aemo.com.au/Electricity/National-Electricity-Market-NEM/Planning-and-forecasting/Victorian-transmission-network-service-provider-
role/RITT/Reports-and-project-updates.
62 At https://www.aemo.com.au/Electricity/National-Electricity-Market-NEM/Planning-and-forecasting/Victorian-transmission-network-service-provider-
role/RITT/Reports-and-project-updates.
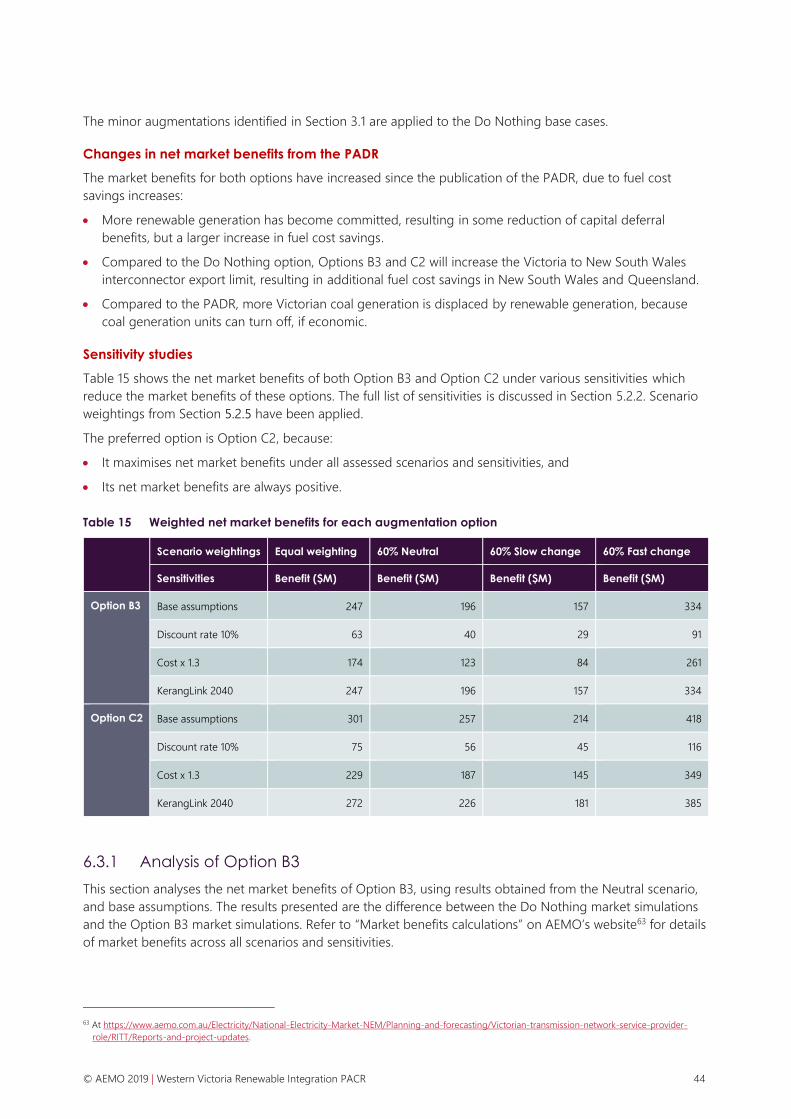
© AEMO 2019 | Western Victoria Renewable Integration PACR 44
The minor augmentations identified in Section 3.1 are applied to the Do Nothing base cases.
Changes in net market benefits from the PADR
The market benefits for both options have increased since the publication of the PADR, due to fuel cost
savings increases:
• More renewable generation has become committed, resulting in some reduction of capital deferral
benefits, but a larger increase in fuel cost savings.
• Compared to the Do Nothing option, Options B3 and C2 will increase the Victoria to New South Wales
interconnector export limit, resulting in additional fuel cost savings in New South Wales and Queensland.
• Compared to the PADR, more Victorian coal generation is displaced by renewable generation, because
coal generation units can turn off, if economic.
Sensitivity studies
Table 15 shows the net market benefits of both Option B3 and Option C2 under various sensitivities which
reduce the market benefits of these options. The full list of sensitivities is discussed in Section 5.2.2. Scenario
weightings from Section 5.2.5 have been applied.
The preferred option is Option C2, because:
• It maximises net market benefits under all assessed scenarios and sensitivities, and
• Its net market benefits are always positive.
Table 15 Weighted net market benefits for each augmentation option
Scenario weightings Equal weighting 60% Neutral 60% Slow change 60% Fast change
Sensitivities Benefit ($M) Benefit ($M) Benefit ($M) Benefit ($M)
Option B3 Base assumptions 247 196 157 334
Discount rate 10% 63 40 29 91
Cost x 1.3 174 123 84 261
KerangLink 2040 247 196 157 334
Option C2 Base assumptions 301 257 214 418
Discount rate 10% 75 56 45 116
Cost x 1.3 229 187 145 349
KerangLink 2040 272 226 181 385
6.3.1 Analysis of Option B3
This section analyses the net market benefits of Option B3, using results obtained from the Neutral scenario,
and base assumptions. The results presented are the difference between the Do Nothing market simulations
and the Option B3 market simulations. Refer to “Market benefits calculations” on AEMO’s website63 for details
of market benefits across all scenarios and sensitivities.
63 At https://www.aemo.com.au/Electricity/National-Electricity-Market-NEM/Planning-and-forecasting/Victorian-transmission-network-service-provider-
role/RITT/Reports-and-project-updates.

© AEMO 2019 | Western Victoria Renewable Integration PACR 45
Figure 6 shows the annual gross net market benefits of Option B3, categorised as capital deferral benefits and
fuel cost benefits. The annualised gross market benefits of this option will exceed its annualised investment
cost from 2023.
Fuel cost savings are negative before Option B3 is implemented, due to projected constraints on committed
renewable generation, and because the Do Nothing scenario results in more renewable generation in
Victoria. Fuel cost savings grow as demand increases, and become positive after 2028.
There are capital savings before implementation of Option B3, because generator behaviour is expected to
change following knowledge of a proposed augmentation.
The market benefits from 2034 are extended to the end of the asset’s engineering life, and are shown in the
figures up to 2040.
Figure 6 Gross market benefits and annualised costs of Option B3, Neutral scenario
Figure 7 shows the projected difference in generation dispatch, for the Do Nothing and Option B3 market
simulations, in 2034. A positive number indicates that generation has increased when Option B3 is applied
and a negative number indicates that generation has decreased.
Figure 7 Impact on generation dispatch of Option B3, 2033-34

© AEMO 2019 | Western Victoria Renewable Integration PACR 46
The fuel cost savings are primarily from displacing black co al generation in New South Wales and
Queensland, and displacing gas generation in New South Wales, Queensland, and South Australia. Brown
coal generation in Victoria increases after the preferred option is applied, because of higher exports after the
increase in Victorian export capacity.
Figure 8 shows the projected decrease in curtailment of renewable generation in Victoria. The augmentation
primarily enables more wind generation.
Figure 8 Reduction in curtailment of renewable generation, Option B3
Figure 9 shows the projected fuel cost savings of Option B3, under different reasonable scenarios. The fuel
cost savings for the Fast change and NoIC scenarios are higher than other scenarios:
• Under the NoIC scenario, because more local gas generation is projected to be displaced.
• Under the Fast change scenario, due to increased demand.
Figure 9 Fuel cost saving benefits across all scenarios, Option B3
NeutralWS is the Neutral with storage scenario.
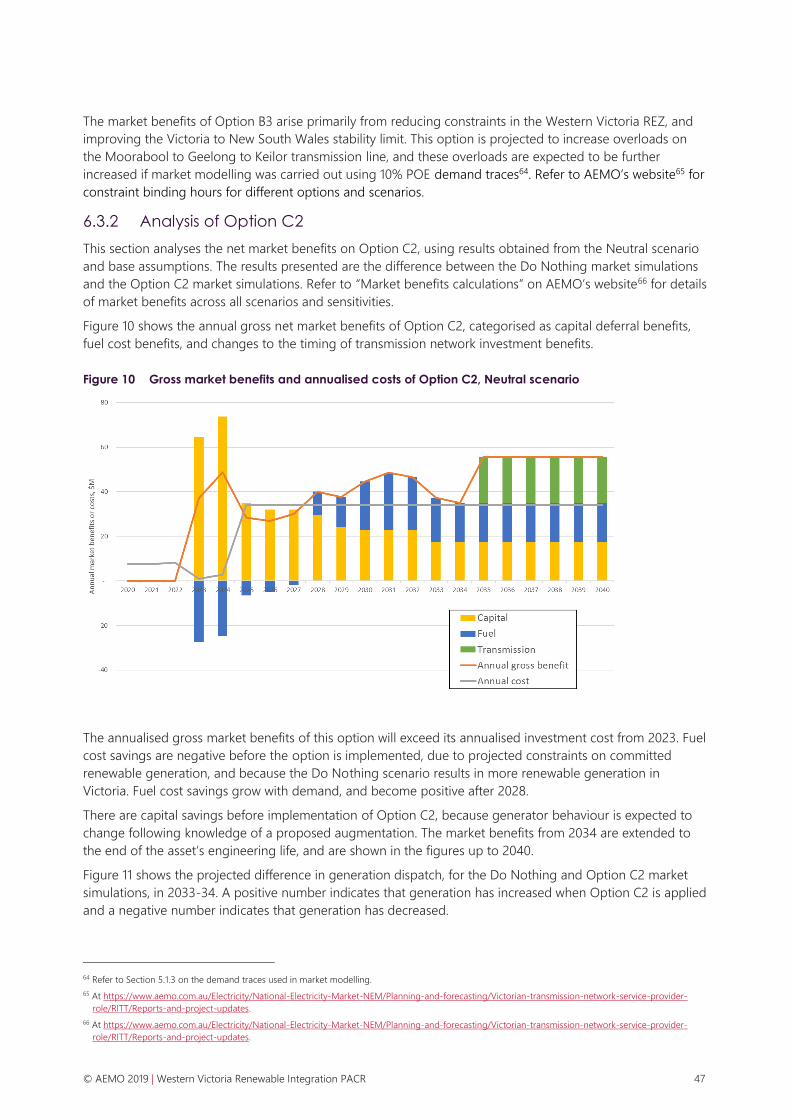
© AEMO 2019 | Western Victoria Renewable Integration PACR 47
The market benefits of Option B3 arise primarily from reducing constraints in the Western Victoria REZ, and
improving the Victoria to New South Wales stability limit. This option is projected to increase overloads on
the Moorabool to Geelong to Keilor transmission line, and these overloads are expected to be further
increased if market modelling was carried out using 10% POE demand traces64. Refer to AEMO’s website65 for
constraint binding hours for different options and scenarios.
6.3.2 Analysis of Option C2
This section analyses the net market benefits on Option C2, using results obtained from the Neutral scenario
and base assumptions. The results presented are the difference between the Do Nothing market simulations
and the Option C2 market simulations. Refer to “Market benefits calculations” on AEMO’s website66 for details
of market benefits across all scenarios and sensitivities.
Figure 10 shows the annual gross net market benefits of Option C2, categorised as capital deferral benefits,
fuel cost benefits, and changes to the timing of transmission network investment benefits.
Figure 10 Gross market benefits and annualised costs of Option C2, Neutral scenario
The annualised gross market benefits of this option will exceed its annualised investment cost from 2023. Fuel
cost savings are negative before the option is implemented, due to projected constraints on committed
renewable generation, and because the Do Nothing scenario results in more renewable generation in
Victoria. Fuel cost savings grow with demand, and become positive after 2028.
There are capital savings before implementation of Option C2, because generator behaviour is expected to
change following knowledge of a proposed augmentation. The market benefits from 2034 are extended to
the end of the asset’s engineering life, and are shown in the figures up to 2040.
Figure 11 shows the projected difference in generation dispatch, for the Do Nothing and Option C2 market
simulations, in 2033-34. A positive number indicates that generation has increased when Option C2 is applied
and a negative number indicates that generation has decreased.
64 Refer to Section 5.1.3 on the demand traces used in market modelling.
65 At https://www.aemo.com.au/Electricity/National-Electricity-Market-NEM/Planning-and-forecasting/Victorian-transmission-network-service-provider-
role/RITT/Reports-and-project-updates.
66 At https://www.aemo.com.au/Electricity/National-Electricity-Market-NEM/Planning-and-forecasting/Victorian-transmission-network-service-provider-
role/RITT/Reports-and-project-updates.
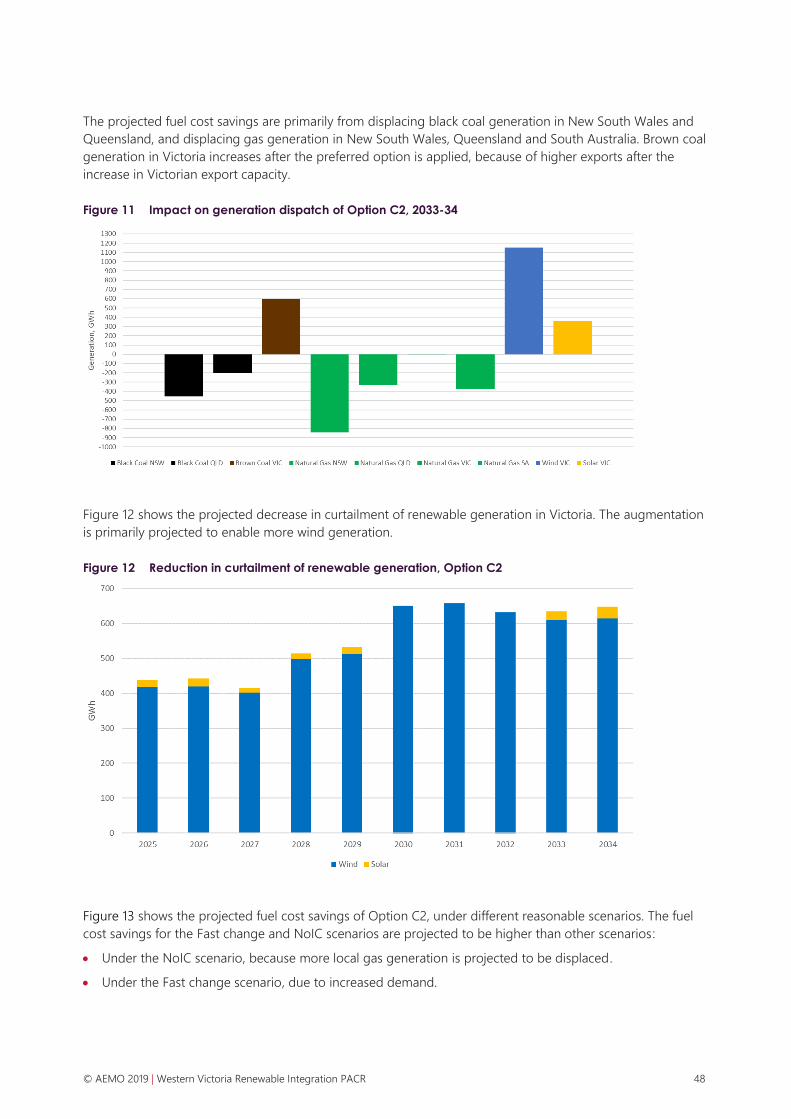
© AEMO 2019 | Western Victoria Renewable Integration PACR 48
The projected fuel cost savings are primarily from displacing black coal generation in New South Wales and
Queensland, and displacing gas generation in New South Wales, Queensland and South Australia. Brown coal
generation in Victoria increases after the preferred option is applied, because of higher exports after the
increase in Victorian export capacity.
Figure 11 Impact on generation dispatch of Option C2, 2033-34
Figure 12 shows the projected decrease in curtailment of renewable generation in Victoria. The augmentation
is primarily projected to enable more wind generation.
Figure 12 Reduction in curtailment of renewable generation, Option C2
Figure 13 shows the projected fuel cost savings of Option C2, under different reasonable scenarios. The fuel
cost savings for the Fast change and NoIC scenarios are projected to be higher than other scenarios:
• Under the NoIC scenario, because more local gas generation is projected to be displaced.
• Under the Fast change scenario, due to increased demand.

© AEMO 2019 | Western Victoria Renewable Integration PACR 49
Figure 13 Fuel cost saving benefits across all scenarios, Option C2
NeutralWS is the Neutral with storage scenario.
The projected market benefits of Option C2 are primarily from reducing constraints in the Western Victoria
REZ, and improving the Victoria to New South Wales stability limit. Refer to AEMO’s website67 for constraint
binding hours for different options and scenarios.
6.3.3 Comparing Option B3 to Option C2
• Both options provide similar benefits to the Western Victoria REZ, and primarily enable more
wind generation.
• Option C2 has the following additional benefits over Option B3:
– Option C2 does not increase overloads on the Moorabool to Geelong to Keilor transmission lines.
– Option C2 enables a higher Victoria to New South Wales transfer capacity, which results in higher
projected fuel cost savings.
– Option C2 facilitates the future KerangLink transmission augmentation, and therefore has benefits in
changing the timing for transmission investment.
• Overall, Option C2 has the highest net market benefit across all tested scenarios and sensitivities.
6.3.4 Extending Option C2
In response to stakeholder submissions, AEMO studied a sensitivity where the 220 kV double circuit
transmission lines in Option C2 are extended from Bulgana to Horsham to Murra Warra. This would enable
additional generation connections in the Western Victoria REZ north of Bulgana.
This option would increase the cost of Option C2 by $85 million (present value cost).
AEMO carried out market modelling using the Neutral and Fast change scenarios, which are expected to
provide the highest net market benefits. The incremental market benefits of this option (compared to the
market benefits of Option C2) have been compared against its incremental cost.
The results, summarised in Table 16, show that this sensitivity provided a negative net market benefit.
67 At https://www.aemo.com.au/Electricity/National-Electricity-Market-NEM/Planning-and-forecasting/Victorian-transmission-network-service-provider-
role/RITT/Reports-and-project-updates.

© AEMO 2019 | Western Victoria Renewable Integration PACR 50
Table 16 Net market benefits for extending Option C2
Option description Neutral
scenario,
net benefit,
$M
Fast change
scenario, net
benefit, $M
• Implement Option C2, consisting of a new North Ballarat Terminal Station, with 2 x 1,000 MVA
500/220 kV transformers, a new Sydenham to North Ballarat 500 kV double circuit transmission
line, and a new North Ballarat to Bulgana 220 kV double circuit transmission line
• Construct an additional 220 kV double circuit transmission line from Bulgana to Horsham to
Murra Warra Terminal Station.
-$68M -$46M
6.3.5 Timing of preferred option
Market modelling shows that the optimal timing of the major network augmentation component of the
preferred option (Option C2) is around 2023, as described in Section 6.3.2, however this timing is considered
to be unachievable, particularly considering legislative requirements for land, easements, planning, and
environmental approvals.
The expected timing for the preferred option is to deliver:
• The minor augmentations by 2021.
• The new North Ballarat terminal station and new 220 kV double circuit transmission lines from North
Ballarat to Bulgana by 2024.
• The new 500 kV double circuit transmission lines from Sydenham to North Ballarat, connecting two new
1,000 MVA 500/220 kV transformers at North Ballarat, by 2025.
AEMO has commenced a tender process for the design, construction, operation, and ownership of the
contestable augmentations within the preferred option. Refer to Section 7.3 for further information.
Market benefits of each stage of preferred option
AEMO considers that the commissioning of the 220 kV component of the major network augmentation will
alleviate the most urgent congestion affecting existing and committed generators. However, both the 220 kV
and 500 kV augmentations are required to maximise the net market benefits identified in the assessment and
reported in this PACR.
AEMO carried out additional market modelling with only the minor augmentations and 220 kV component of
the preferred option in service over the full analysis period described in Section 5.2.1.
The modelling shows that:
• The minor augmentations, by 2021, will deliver a net market benefits of $1 million (in present value terms).
• A new North Ballarat terminal station and new 220 kilovolt (kV) double circuit transmission lines from
North Ballarat to Bulgana, by 2024, will deliver net market benefits of $184 million (in present value terms).
• New 500 kV double circuit transmission lines from Sydenham to North Ballarat, connecting two new 1,000
MVA 500/220 kV transformers at North Ballarat, by 2025, will deliver net market benefits of $116 million (in
present value terms).

© AEMO 2019 | Western Victoria Renewable Integration PACR 51
7. Conclusion
The preferred option includes the following augmentations:
• Minor transmission line augmentations, including wind monitoring and upgrading
station limiting transmission plant, carried out for the Red Cliffs to Wemen to Kerang to
Bendigo, and Moorabool to Terang to Ballarat, 220 kV transmission lines.
• Construction of a new North Ballarat Terminal Station, with 2 x 1,000 MVA 500/220 kV
transformers.
• Connecting North Ballarat Terminal Station to the existing Ballarat to Bendigo 220 kV
single circuit transmission line.
• Construction of a new 500 kV double circuit line from Sydenham to North Ballarat, with
50 MVAr reactors on each end of each circuit.
• Construction of a new 220 kV double circuit line from North Ballarat to Bulgana.
• Connecting one of the new 220 kV transmission circuits from North Ballarat to Bulgana
to the existing Waubra Terminal Station.
• Disconnecting the existing Waubra Terminal Station from the existing Ballarat to Waubra
to Ararat 220 kV transmission line.
• Cutting in the Ballarat to Moorabool 220 kV circuit No. 2 at Elaine Terminal Station.
This option returns the highest projected net market benefits under all assessed scenarios
and sensitivities. The preferred option also supports future efficient development of the
national transmission network, including a future Victoria to New South Wales
interconnector, consistent with the 2018 ISP.
7.1 Preferred option
The NER requires the PACR to identify the preferred option under the RIT-T, which should be the credible
option that maximises net market benefits.
The RIT-T analysis shows that Option C2 (construction of new double circuit 500 kV transmission line from
Sydenham to North Ballarat, and a new 220 kV double circuit transmission line from North Ballarat to Bulgana
(via Waubra) identified in Appendix A10, together with minor transmission line upgrades in Appendix A3),
maximises net market benefits. Accordingly, together, the augmentations comprising Option C2 constitute
the preferred option and satisfy the regulatory investment test for transmission.
The preferred option is consistent with the recommendations of the PADR and the 2018 ISP, and is estimated
to deliver net market benefits of approximately $300 million (in present value terms), through significant
reductions in the capital cost and dispatch cost of generation over the longer term, improving the capacity of
the existing Victoria to New South Wales interconnector, and enabling future transmission network expansion
from Victoria to New South Wales.
The total capital cost used in calculating these net market benefits is estimated at $370 million, and the
gross market benefits are estimated at $670 million (in present value terms).
An upgrade to the Western Victorian transmission network is an important element of the long-term strategic
development of the NEM, and one of the immediate priorities identified by AEMO in the 2018 ISP. The

© AEMO 2019 | Western Victoria Renewable Integration PACR 52
preferred option would relieve constraints on committed and existing renewable generation in the region and
help reduce the cost of electricity for consumers in the long term.
The preferred option is unlikely to have a material inter-network impact.
For more information on the preferred option, refer to:
• Appendix A3 for details on the minor augmentations.
• Appendix A8 for load flow snapshots.
• Appendix A9 for projected transmission line utilisations.
• Appendix A10 for the high-level technical characteristics of the preferred option, and single line diagrams.
7.2 Project implementation
The delivery of the preferred option will include the following high-level activities:
• Procurement.
• Planning, environmental, cultural, and other approvals.
• Stakeholder and community engagement.
• Detailed route and technical design, including assembly of land and easements.
• Construction and testing.
• Long-term operation and maintenance.
AEMO will undertake the process set out in the National Electricity Law and the NER to seek to procure the
contestable and non-contestable elements of the Project.
AEMO is committed to keeping stakeholders informed of the progress of Western Victoria Transmission
Network Project (the Project) following the conclusion of the RIT-T process. AEMO will provide further
updates in the coming months, including announcements on contracts awarded for the design, construction,
operation, and ownership of the new infrastructure (anticipated to be the end of 2019), and upcoming
stakeholder engagement activities.
Stakeholder consultation on the Project route is expected to commence in 2020.
7.3 Procurement of transmission network augmentation
To meet the delivery dates outlined in the PACR, AEMO has started the procurement process for the
preferred option by taking the following actions:
• Minor augmentations – AEMO and AusNet Services have made a submission to the Australian Energy
Regulator (AER) to include the minor augmentations described in Appendix A3 in AusNet Services’ 2018
Network Capability Incentive Parameter Action Plan (NCIPAP). A response is anticipated in July 2019.
• In January 2019, AEMO issued a Call for Expressions of Interest (CEI)68 from parties interested in designing,
constructing, operating, and owning the contestable components of the proposed preferred option
identified in the PADR. AEMO received several expressions of interest in response to the CEI.
• AEMO has issued a competitive closed invitation to tender to allow selected CEI respondents to
commence their consideration of the contestable components of the preferred option, subject to
completion of the RIT-T process. AEMO has also issued requests for offer to the incumbent TNSPs to
commence their consideration of the non-contestable portions of the preferred option, subject to
completion of the RIT-T process.
68 At https://www.aemo.com.au/-/media/Files/Electricity/NEM/Planning_and_Forecasting/Victorian_Transmission/2019/Call-for-Expressions-of-Interest-
Western-Victoria-Transmission-Network-Project.pdf.

© AEMO 2019 | Western Victoria Renewable Integration PACR 53
• Now that the PACR has been issued, and once the RIT-T process is concluded, AEMO intends to proceed
with the competitive tender process for the contestable portions of the final preferred option and the
process for obtaining offers for the non-contestable portions of the final preferred option.
• AEMO will announce the outcome of the tender process in the coming months.

© AEMO 2019 | Western Victoria Renewable Integration PACR 54
A1. Compliance with NER
This PACR provides all the information specified in NER 5.16.4, and as outlined in the table below:
Table 17 Information provided in this PACR, as required by NER 5.16.4
Description Report section
A description of each credible option assessed. 3
A summary of, and commentary on, the submissions to the project assessment draft report. 4
A quantification of the costs, including a breakdown of operating and capital expenditure, and classes of
material market benefit.
5.2.11, 5.2.12, 0
A detailed description of the methodologies used in quantifying each class of material market benefit
and cost.
5
Reasons why the RIT-T proponent has determined that a class or classes of market benefit are not
material.
6.1
The identification of any class of market benefit estimated to arise outside the region of the Transmission
Network Service Provider affected by the RIT-T project, and quantification of the value of such market
benefits (in aggregate across all regions).
6
The results of a net present value analysis and accompanying explanatory statements regarding the
results.
6.3
The identification of the proposed preferred option, with:
• Details of the technical characteristics;
• Estimated commissioning date. Project sequencing and construction will be determined after the
conclusion of the RIT-T process, by a competitive tender;
• If the proposed preferred option is likely to have a material inter-network impact and if the
Transmission Network Service Provider affected by the RIT-T project has received an augmentation
technical report, that report; and
• A statement and the accompanying detailed analysis that the preferred option satisfies the regulatory
investment test for transmission.
3.3.2, 6.3, 7

© AEMO 2019 | Western Victoria Renewable Integration PACR 55
A2. Committed generation
The table below provides an update to committed generation modelled in the Western Victorian Renewable
Integration RIT-T. Additional committed generation since the publication of the PADR is in bold. This
information is obtained from AEMO’s generation information page69. Refer to AEMO’s website for a map of
new generation enquiries, applications as well as committed and operational generators70.
Table 18 Committed generation considered in the Western Victoria Renewable Integration RIT-T
Name Network Generation type Capacity (MW) REZ
Ballarat Energy Storage System Transmission Storage 30 Western Victoria
Bannerton Solar Farm Distribution Solar 88 Murray River
Bulgana Wind Farm Transmission Wind 204 Western Victoria
Bulgana Energy Storage Transmission Storage 21 Western Victoria
Crowlands Wind Farm Transmission Wind 80 Western Victoria
Gannawarra Solar Farm Stage 1 Distribution Solar 50 Murray River
Gannawarra Energy Storage System Distribution Storage 25 Murray River
Karadoc Solar Farm Distribution Solar 90 Murray River
Kiata Wind Farm Distribution Wind 30 Western Victoria
Lal Lal Wind Farm Elaine Transmission Wind 79 Western Victoria
Moorabool Wind Farm Transmission Wind 320 Western Victoria
Mount Gellibrand Wind Farm Distribution Wind 132 Moyne
Murra Warra Wind Farm Transmission Wind 226 Western Victoria
Salt Creek Wind Farm Distribution Wind 54 Moyne
Stockyard Hill Wind Farm Transmission Wind 532 Moyne
Wemen Solar Farm Distribution Solar 88 Murray River
Yatpool Solar Farm Distribution Solar 81 Murray River
Cohuna Solar Farm Distribution Solar 27 Murray River
Dundonnell Wind Farm Transmission Wind 336 Moyne
Kiamal Solar Farm - Stage 1 Transmission Solar 200 Murray River
Lal Lal Wind Energy Facility - Yendon
end
Distribution Wind 144 Western Victoria
Numurkah Solar Farm Transmission Solar 100 Murray River
69 At https://www.aemo.com.au/Electricity/National-Electricity-Market-NEM/Planning-and-forecasting/Generation-information. Commitment criteria are
outlined under the Background information tab in each regional spreadsheet.
70 At https://www.aemo.com.au/-/media/Files/Electricity/NEM/Network_Connections/Maps/VIC-Generation-V2019-04.pdf, published in April 2019.
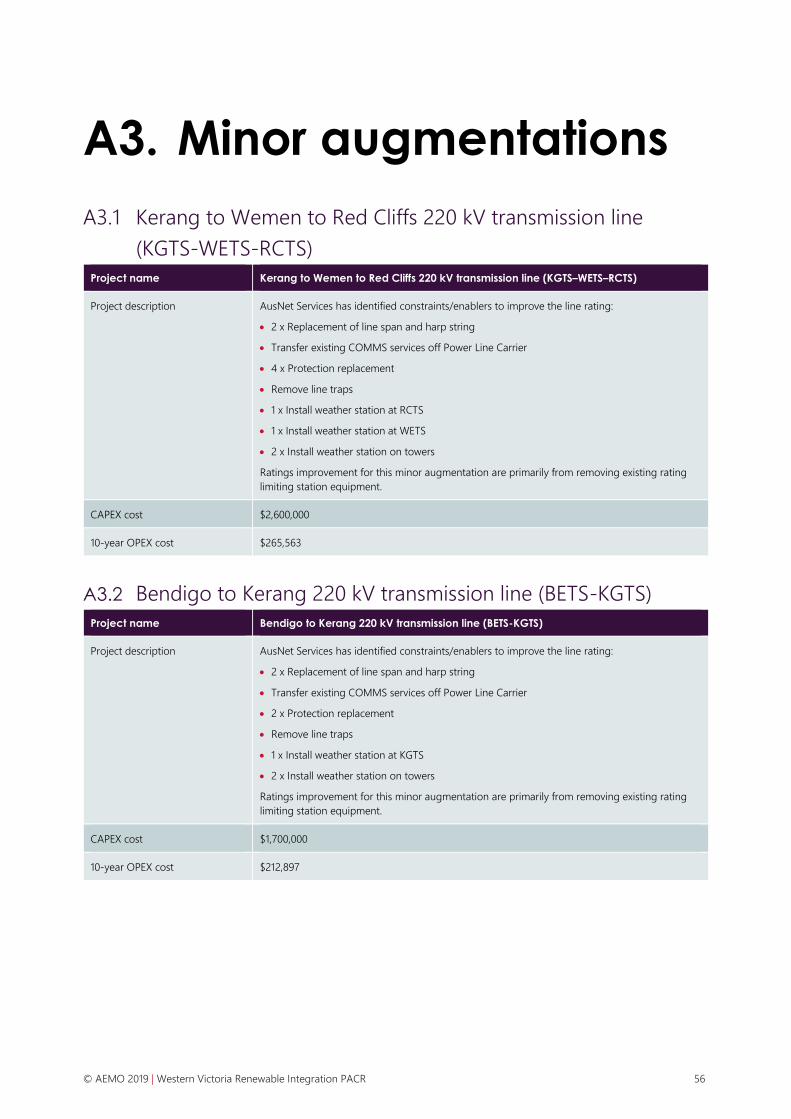
© AEMO 2019 | Western Victoria Renewable Integration PACR 56
A3. Minor augmentations
A3.1 Kerang to Wemen to Red Cliffs 220 kV transmission line
(KGTS-WETS-RCTS)
Project name Kerang to Wemen to Red Cliffs 220 kV transmission line (KGTS–WETS–RCTS)
Project description AusNet Services has identified constraints/enablers to improve the line rating:
• 2 x Replacement of line span and harp string
• Transfer existing COMMS services off Power Line Carrier
• 4 x Protection replacement
• Remove line traps
• 1 x Install weather station at RCTS
• 1 x Install weather station at WETS
• 2 x Install weather station on towers
Ratings improvement for this minor augmentation are primarily from removing existing rating
limiting station equipment.
CAPEX cost $2,600,000
10-year OPEX cost $265,563
A3.2 Bendigo to Kerang 220 kV transmission line (BETS-KGTS)
Project name Bendigo to Kerang 220 kV transmission line (BETS-KGTS)
Project description AusNet Services has identified constraints/enablers to improve the line rating:
• 2 x Replacement of line span and harp string
• Transfer existing COMMS services off Power Line Carrier
• 2 x Protection replacement
• Remove line traps
• 1 x Install weather station at KGTS
• 2 x Install weather station on towers
Ratings improvement for this minor augmentation are primarily from removing existing rating
limiting station equipment.
CAPEX cost $1,700,000
10-year OPEX cost $212,897

© AEMO 2019 | Western Victoria Renewable Integration PACR 57
A3.3 Moorabool to Terang 220 kV transmission line (MLTS-TGTS)
Project name Moorabool to Terang 220 kV transmission line (MLTS-TGTS)
Project description AusNet Services has identified constraints/enablers to improve the line rating:
• Replacement of a line span
• 1 x Install weather station at TGTS
• 2 x Install weather station on towers
Ratings improvement for this minor augmentation are primarily from enabling dynamic wind
monitoring on the transmission lines.
CAPEX cost $500,000
10-year OPEX cost $212,897
A3.4 Ballarat to Terang 220 kV transmission line (BATS-TGTS)
Project name Ballarat to Terang 220 kV transmission line (BATS-TGTS)
Project description AusNet Services has identified constraints/enablers to improve the line rating:
• 1 x Replacement of line span and harp string at BATS
• 2 x Protection modification
• 1 x Install weather station at TGTS
• 2 x Install weather station on towers
Ratings improvement for this minor augmentation are primarily from enabling dynamic wind
monitoring on the transmission lines.
CAPEX cost $700,000
10-year OPEX cost $212,897

© AEMO 2019 | Western Victoria Renewable Integration PACR 58
A4. Stakeholder consultation materials
AEMO published key collateral to assist stakeholders with their understanding of the project:
• Western Victoria RIT-T fact sheet71.
• Western Victoria RIT-T Project Update72.
• Industry forum slide pack and supporting materials73.
• Podcast on Western Victoria Renewable Integration74.
• Media release on the PADR75.
• Dedicated project webpages created on AEMO’s corporate website76.
• Dedicated 1800 number and email address assigned to the project77.
71At http://aemo.com.au/-/media/Files/Electricity/NEM/Planning_and_Forecasting/Victorian_Transmission/2018/071218-Initial-RIT-T-Fact-Sheet.pdf.
72 At http://aemo.com.au/-/media/Files/Electricity/NEM/Planning_and_Forecasting/Victorian_Transmission/2018/WVRI-Project-Update-2.pdf.
73 At http://aemo.com.au/Electricity/National-Electricity-Market-NEM/Planning-and-forecasting/Victorian-transmission-network-service-provider-
role/RITT/Stakeholder-consultation,
74 At http://energylive.aemo.com.au/Insights/Podcast-Western-Victoria-renewable-integration.
75 At http://energylive.aemo.com.au/News/Transmission-capacity-improvement-media-release.
76 At http://aemo.com.au/Electricity/National-Electricity-Market-NEM/Planning-and-forecasting/Victorian-transmission-network-service-provider-role/RITT.
77 At http://aemo.com.au/Electricity/National-Electricity-Market-NEM/Planning-and-forecasting/Victorian-transmission-network-service-provider-
role/RITT/Key-contacts.

© AEMO 2019 | Western Victoria Renewable Integration PACR 59
A5. PADR submission period, engagements undertaken
The table below summarises AEMO’s stakeholder engagement activities during the PADR consultation period.
Table 19 Engagements undertaken during PADR submission period
Stakeholder
group
Stakeholder Method
Community
members • Local community within potential
vicinity of preferred option
• Victoria-wide community
• Advertising in state and local newspapers: The Age (x2), the Herald
Sun (x2), Stawell Times News (x2), Ballarat Courier (x2), Ballarat
Times (x2), Ararat Advertiser (x2), Ararat Times (x2), Stanwell Times
(x2), Daylesford Advocate (x2), Pyrenees Advocate (x2), Melton and
Moorabool Star Weekly (x2) - (Jan/Feb 2019)
• Online engagement
• Project email, website, toll-free phone number (Dec 2018 -
ongoing)
Consumer
representatives • AER Consumer Challenge Panel
• Energy Consumers Australia
• Major Energy Users
• Public Interest Advisory Centre
• Queensland Energy Users Network
• St Vincent de Paul Society
• Uniting Communities
• Presentation at AEMO Consumer Forum (14 November 2018)
• Individual briefings provided to Consumer representative groups
(February 2019)
Industry and
Market
Participants
• Academic stakeholders
• Banking sector
• Generators
• Property developers
• Renewable energy stakeholders
• Retailers
• Transmission service providers
• Wind/solar farm developers
• Industry forums x 2 (high level summary forum on 19 December
2018 and deep-dive session on 30 January 2019)
• AEMO Communications
• Online engagement
• Targeted email content
Local councils
across Western
Victoria
• Ararat Rural City Council
• City of Ballarat
• Hepburn Shire Council
• Melton City Council
• Moorabool Shire Council
• Northern Grampians Shire Council
• Pyrenees Shire Council
• Face-to-face engagement with all local councils

© AEMO 2019 | Western Victoria Renewable Integration PACR 60
Stakeholder
group
Stakeholder Method
Members of
Parliament (MPs) • Local state and federal MPs
representing Western Victoria
• Face-to-face engagement
• Formal correspondence
Victorian
Government • Department of Environment, Land,
Water and Planning
• Department of Economic
Development, Jobs, Transport and
Resources
• Department of Premier and
Cabinet
• Face-to-face engagement
• Formal correspondence
Commonwealth
Government • Department of Environment and
Energy
• Teleconference
• Face-to-face engagement
Regulators and
policy-makers • Australian Energy Regulator
• Australian Energy Market
Commission
• Face-to-face engagement
• Formal correspondence
Industry bodies/
associations • Australian Energy Council
• Clean Energy Council
• Energy Networks Australia
• Face-to-face engagement
• Formal correspondence
Special interest
groups • Grampians New Energy Taskforce
• Loddon Mallee New Energy
Taskforce
• Murray River Group of Councils
• Wimmera Development
Association
• Face-to-face engagement
• Individual briefings via Skype
• Formal correspondence
Indigenous
groups Registered Aboriginal Parties
• Barengi Gadjin Land Council
Aboriginal Corporation
• Dja Dja Wurrung Clans Aboriginal
Corporation
• Martang Pty Ltd
• Wathaurung Aboriginal
Corporation
• Wurundjeri Land and
Compensation Cultural Heritage
Council Aboriginal Corporation
Traditional Owner Groups
• Boon Wurrung Foundation
• Bunurong Land Council Aboriginal
Corporation
• Wurundjeri Land and
Compensation Cultural Heritage
Council Aboriginal Corporation
• Face-to-face engagement

© AEMO 2019 | Western Victoria Renewable Integration PACR 61
A6. Options assessed in the PADR
A6.1 Net market benefits from the PADR
Table 20 Weighted net market benefits for each augmentation option and reasonable scenario from the
PADR
Option Description Cost ($M,
2018-19)
Neutral
($M)
Neutral
with
storage
initiatives
($M)
Slow
change
($M)
Fast
change
($M)
Weighted
benefit
($M,
NPV)
Scenario weighting 25% 25% 25% 25%
B2 Construction of a new 220 kV double
circuit line from Moorabool to Elaine
to Ballarat to Bulgana to Horsham.
Retire Ballarat to Moorabool 220 kV
circuit No. 1, and cut in Ballarat to
Moorabool 220kV circuit No. 2 at
Elaine.
Allow sufficient powerflow
controllers to manage transmission
line flows between Ballarat to
Bulgana to Horsham.
406 13 -25 -14 81 14
B4 Rebuild existing Moorabool to Elaine
to Ballarat to Bulgana single circuit
220 kV transmission line as a 220 kV
double circuit transmission line.
Retire the existing Moorabool to
Ballarat to Bulgana 220 kV
transmission lines to enable existing
easement to be re-used for a new
double circuit line. Cut in Ballarat to
Moorabool 220 kV circuit No. 2 at
Elaine.
Dynamic reactive compensation
required to manage voltages.
367 57 9 30 133 57
C1 Construction of a new 500 kV double
circuit line from Sydenham to Ararat.
2 x 1,000 MVA 500/220 kV
transformers at Ararat
Allow for line switched reactors for
the 500 kV transmission lines.
Cut in Ballarat to Moorabool 220 kV
circuit No. 2 at Elaine.
443 65 19 38 135 64
E1 Battery at Ararat Terminal Station 117 -74 -72 -98 -60 -76
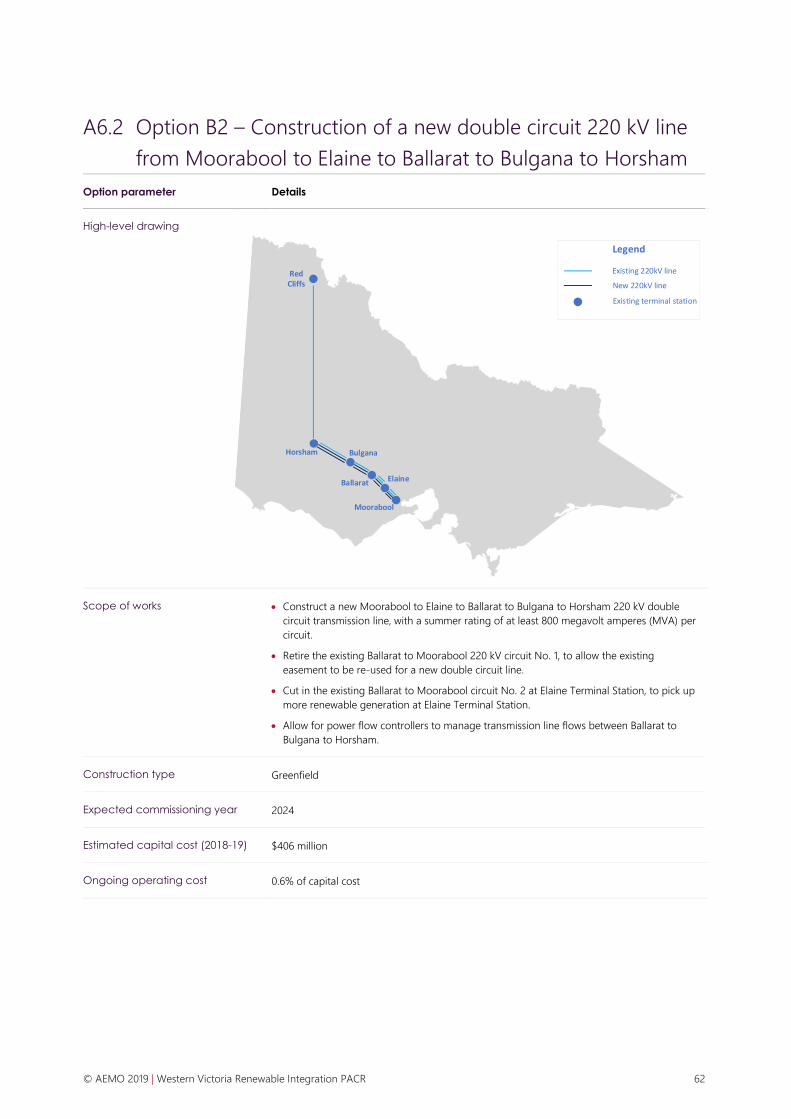
© AEMO 2019 | Western Victoria Renewable Integration PACR 62
A6.2 Option B2 – Construction of a new double circuit 220 kV line
from Moorabool to Elaine to Ballarat to Bulgana to Horsham
Option parameter Details
High-level drawing
Red Cliffs
Horsham
Moorabool
ElaineBallarat
Legend
New 220kV line
Existing terminal station
Existing 220kV line
Bulgana
Scope of works • Construct a new Moorabool to Elaine to Ballarat to Bulgana to Horsham 220 kV double
circuit transmission line, with a summer rating of at least 800 megavolt amperes (MVA) per
circuit.
• Retire the existing Ballarat to Moorabool 220 kV circuit No. 1, to allow the existing
easement to be re-used for a new double circuit line.
• Cut in the existing Ballarat to Moorabool circuit No. 2 at Elaine Terminal Station, to pick up
more renewable generation at Elaine Terminal Station.
• Allow for power flow controllers to manage transmission line flows between Ballarat to
Bulgana to Horsham.
Construction type Greenfield
Expected commissioning year 2024
Estimated capital cost (2018-19) $406 million
Ongoing operating cost 0.6% of capital cost

© AEMO 2019 | Western Victoria Renewable Integration PACR 63
A6.3 Option B4 – Rebuild existing 220 kV line from Moorabool to
Elaine to Ballarat to Bulgana
Option parameter Details
High-level drawing
Red Cliffs
Horsham
Moorabool
ElaineBallarat
Legend
Rebuilt 220kV line
Existing terminal station
Existing 220kV line
Bulgana
Scope of works • Rebuild the existing single circuit Moorabool to Elaine to Ballarat to Bulgana 220 kV
transmission line as a double circuit 220 kV transmission line, with a summer rating of at
least 800 MVA per circuit.
• Retire the existing Ballarat to Moorabool 220 kV circuit No. 1, to enable existing easement to
be re-used for a new double circuit line.
• Cut in the existing Ballarat to Moorabool 220 kV circuit No. 2 at Elaine Terminal Station, to
pick up more renewable generation at Elaine Terminal Station.
• Dynamic reactive compensation required, to manage voltages.
Construction type Brownfield
Expected commissioning year 2024
Estimated capital cost (2018-19) $367 million
Ongoing operating cost 0.6% of capital cost

© AEMO 2019 | Western Victoria Renewable Integration PACR 64
A6.4 Option C1 – Construction of new double circuit 500 kV line
from Sydenham to Ararat
Option parameter Details
High-level drawing
Scope of works • Construct a new Sydenham to Ararat 500 kV double circuit transmission line with a
summer rating of up to 3,000 MVA per circuit.
• Allow for transmission line reactors on one or both ends of the 500 kV transmission
lines.
• 2 x 1,000 MVA 500/220 kV transformers at Ararat.
• Cut in Ballarat to Moorabool 220 kV circuit No. 2 at Elaine Terminal Station, to pick up
more renewable generation at Elaine Terminal Station.
Construction type Greenfield
Expected commissioning year 2025
Estimated capital cost (2018-19) $443 million
Ongoing operating cost 0.7% of capital cost

© AEMO 2019 | Western Victoria Renewable Integration PACR 65
A6.5 Option E1 – Battery at various terminal stations
Option parameter Details
High-level drawing
Red Cliffs
Horsham
Legend
Energy Storage System
Existing terminal station
Existing 220kV line
Ararat
Moorabool
Elaine
Ballarat
Scope of works 100 MW/400 MWh energy storage system at the following locations:
• Ararat Terminal Station (Option E1, this option had the highest market benefits of these
storage options, which are further discussed in the PADR).
• Horsham Terminal Station (Option E2, this option had lower market benefits than Option E1,
and was not assessed further in the PADR).
• Red Cliffs Terminal Station (Option E3, this option had lower market benefits than Option E1,
and was not assessed further in the PADR).
Expected commissioning year 2020
Estimated capital cost (2018-19) $117 million

© AEMO 2019 | Western Victoria Renewable Integration PACR 66
A7. Western Victoria transmission line ratings
The thermal ratings provided are estimated based on ambient temperature, and historical wind speeds during
periods of moderate wind generation (if wind monitoring and historical data is available). Actual thermal
ratings will depend on real time operating conditions.
Table 21 Thermal ratings of key transmission line in Western Victoria study area
Transmission line
rating (MVA)
Ambient temperature,
°C
Continuous rating with wind
monitoring, MVA
15 min rating with wind
monitoring*, MVA
Ballarat to Horsham 5.0 661.40 695.17
10.0 636.47 668.97
15.0 610.53 641.70
20.0 583.43 613.21
25.0 555.00 583.34
30.0 525.05 551.85
35.0 493.27 518.46
40.0 459.30 482.76
45.0 422.62 444.19
Ballarat to Moorabool
No. 1 5.0 472.32 535.27
10.0 448.62 508.41
15.0 423.59 480.05
20.0 396.99 449.90
25.0 368.48 417.59
30.0 337.56 382.55
35.0 303.51 343.96
40.0 265.12 300.45
45.0 220.14 249.48
Ballarat to Moorabool
No. 2 and Ballarat to
Elaine to Moorabool
5.0 669.67 711.47
10.0 645.06 685.55
15.0 619.47 658.62
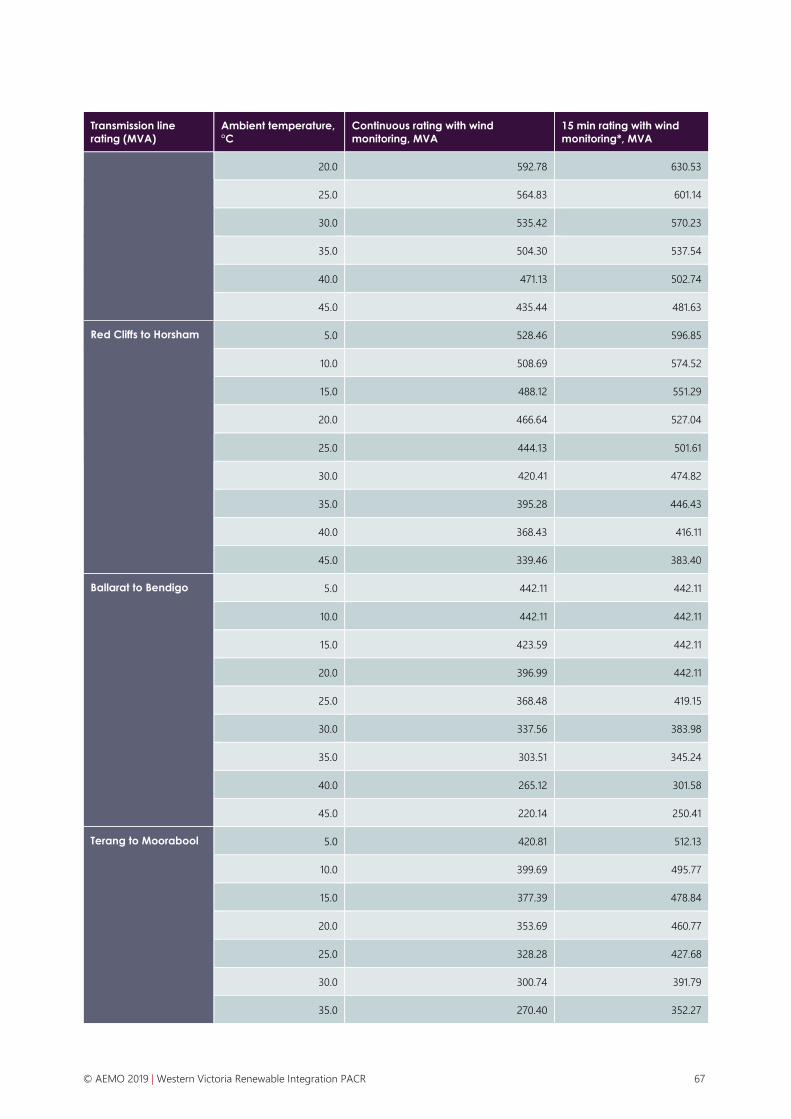
© AEMO 2019 | Western Victoria Renewable Integration PACR 67
Transmission line
rating (MVA)
Ambient temperature,
°C
Continuous rating with wind
monitoring, MVA
15 min rating with wind
monitoring*, MVA
20.0 592.78 630.53
25.0 564.83 601.14
30.0 535.42 570.23
35.0 504.30 537.54
40.0 471.13 502.74
45.0 435.44 481.63
Red Cliffs to Horsham 5.0 528.46 596.85
10.0 508.69 574.52
15.0 488.12 551.29
20.0 466.64 527.04
25.0 444.13 501.61
30.0 420.41 474.82
35.0 395.28 446.43
40.0 368.43 416.11
45.0 339.46 383.40
Ballarat to Bendigo 5.0 442.11 442.11
10.0 442.11 442.11
15.0 423.59 442.11
20.0 396.99 442.11
25.0 368.48 419.15
30.0 337.56 383.98
35.0 303.51 345.24
40.0 265.12 301.58
45.0 220.14 250.41
Terang to Moorabool 5.0 420.81 512.13
10.0 399.69 495.77
15.0 377.39 478.84
20.0 353.69 460.77
25.0 328.28 427.68
30.0 300.74 391.79
35.0 270.40 352.27

© AEMO 2019 | Western Victoria Renewable Integration PACR 68
Transmission line
rating (MVA)
Ambient temperature,
°C
Continuous rating with wind
monitoring, MVA
15 min rating with wind
monitoring*, MVA
40.0 236.20 307.71
45.0 196.12 255.50
Ballarat to Terang 5.0 455.36 559.80
10.0 439.13 538.86
15.0 422.27 517.07
20.0 404.72 494.32
25.0 386.36 470.47
30.0 367.09 445.35
35.0 346.76 418.72
40.0 325.15 390.28
45.0 302.00 359.60
Red Cliffs to Wemen to
Kerang 5.0 494.67 528.12
10.0 464.52 495.93
15.0 432.26 461.49
20.0 397.40 424.27
25.0 359.17 383.46
30.0 316.35 337.74
35.0 266.75 284.79
40.0 205.50 219.39
45.0 115.35 123.15
Kerang to Bendigo 5.0 463.64 550.22
10.0 446.29 529.64
15.0 428.25 508.22
20.0 409.40 485.86
25.0 389.65 462.42
30.0 368.84 437.72
35.0 346.79 411.55
40.0 323.24 383.60
45.0 297.82 353.44
* Different wind speeds are assumed, based on available historical data.

© AEMO 2019 | Western Victoria Renewable Integration PACR 69
A8. Load flows for Options B3 and C2
These results show how Options B3 and C2 can reduce overloads on transmission lines in Western Victoria.
A8.1 Option B3
Table 22 provides a snapshot of transmission line flows of the 220 kV network in the Western Victoria area,
and the following transmission network configuration:
• No augmentation – This snapshot assumes the existing transmission network configuration, with no
further transmission network augmentations.
• Option B3, PADR – This snapshot assumes Option B3 is implemented, but Waubra Terminal Station
remains connected to the existing Ballarat – Waubra – Ararat – Crowlands – Bulgana 220 kV transmission
line, which is consistent with the PADR. The load flows show that the Ballarat – Waubra 220 kV
transmission line may still be at risk of overloads during periods of high temperature and high wind
generation, and that this transmission line is more heavily loaded than the new Bulgana to Ballarat double
circuit line, even though it has a lower thermal rating. The PADR budget estimate allowed for power flow
controllers to manage transmission line flows between Bulgana to Ballarat, but the PACR assessment has
found that moving the Waubra Terminal Station connection is the most cost-effective way to manage
transmission line flows.
• Option B3, PACR – This snapshot assumes that Option B3 is implemented, and Waubra Terminal Station
is now connected to one of the new Bulgana – Ballarat transmission circuits. The transmission line flow on
the existing Ballarat – Waubra – Ararat – Crowlands – Bulgana transmission line has decreased, while the
flow on the new Bulgana – Ballarat circuits has increased.

© AEMO 2019 | Western Victoria Renewable Integration PACR 70
Table 22 Projected load flow for 220 kV transmission lines in Western Victoria before and after Option B3 is
implemented
Transmission line No augmentation*,
MW
Option B3, PADR MW Option B3, PACR,
MW
Ballarat – Waubra – Ararat / Ballarat – Ararat 1,047 412 337
Bulgana – Crowlands 626 404 252
Bulgana – Horsham – Murra Warra 470 474 475
Bulgana – Waubra – North Ballarat (new) 449
Bulgana – North Ballarat (new) 379 (No. 1 and No. 2 circuits) 409
Horsham – Red Cliffs 348 349 349
Red Cliffs – Wemen – Kerang 156 156 156
Bendigo – Kerang 199 162 162
Ballarat – Elaine – Moorabool 627 391 382
Ballarat – North Ballarat 210 211 211
* Transmission line flows shown are not operationally realistic because generation will be constrained to prevent these high transmission
line flows from occurring.
Other assumptions common to all snapshots are:
• Victorian demand of 6,500 MW.
• 70 per cent of wind generation in Western Victoria is dispatched.
• 40 per cent of solar generation in Western Victoria is dispatched.
• Interconnector flows of:
– Victoria to New South Wales interconnector: 1,107 MW.
– Victoria to South Australia interconnector: 267 MW.
– Murraylink: 0 MW.
• Post contingency transmission line flows, after a critical N-1 outage.
A8.2 Option C2
Table 23 provides a snapshot of transmission line flows of the 220 kV network in the Western Victoria area,
and the following transmission network configuration:
• No augmentation – this snapshot assumes the existing transmission network configuration, with no
further transmission network augmentations.
• Option C2, PADR – this snapshot assumes that Option C2 is implemented, but Waubra Terminal Station
remains connected to the existing Ballarat – Waubra – Ararat – Crowlands – Bulgana 220 kV transmission
line, and without the Ballarat bus splitting control scheme described in Section A8.2.1, which is consistent
with the PADR.
– The load flows show that the Ballarat – Waubra 220 kV transmission line may still be at risk of
overloads during periods of high temperature and high wind generation, and that this transmission line
is more heavily loaded than the new Bulgana to North Ballarat double circuit line, even though it has a
lower thermal rating.

© AEMO 2019 | Western Victoria Renewable Integration PACR 71
– The PADR budget estimate allowed for power flow controllers to manage transmission line flows
between Bulgana to North Ballarat, but the PACR assessment has found that moving the Waubra
Terminal Station connection, together with the control scheme described in Section A8.2.1 is the most
cost-effective way to manage transmission line flows.
• Option C2, PACR – this snapshot assumes that Option C2 is implemented, Waubra Terminal Station is
now connected to one of the new Bulgana – North Ballarat transmission circuits, and the Ballarat bus
splitting control scheme described in Section A8.2.1 is implemented.
– The transmission line flow on the existing Ballarat – Waubra – Ararat – Crowlands – Bulgana
transmission line has decreased, while the flow on the new Bulgana – North Ballarat circuits has
increased.
Other assumptions common to all snapshots are:
• Victorian demand of 6,500 MW.
• 70% of wind generation in Western Victoria is dispatched.
• 40% of solar generation in Western Victoria is dispatched.
• Interconnector flows of:
– Victoria to New South Wales interconnector: 1,107 MW.
– Victoria to South Australia interconnector: 267 MW.
– Murraylink: 0 MW.
• Post contingency transmission line flows, after a critical N-1 outage.
Table 23 Projected load flow for 220 kV transmission lines in Western Victoria before and after Option C2 is
implemented
Transmission line No augmentation*
(MW)
Option C2, PADR (MW) Option C2, PACR
(MW)
Ballarat – Waubra – Ararat / Ballarat – Ararat 1,047 431 249**
Bulgana – Crowlands 626 403 251**
Bulgana – Horsham – Murra Warra 470 471 472
Bulgana – Waubra – North Ballarat (new) 487**
Bulgana – North Ballarat (new) 377 (No. 1 and No. 2 circuits) 389**
Horsham – Red Cliffs 348 349 349
Red Cliffs – Wemen – Kerang 156 156 156
Bendigo – Kerang 199 160 160
Ballarat – Elaine – Moorabool 627 385 380
Ballarat – North Ballarat 210 292 49**
North Ballarat – Bendigo 214 157 49**
* Transmission line flows shown are not operationally realistic because generation will be constrained to prevent these high transmission
line flows from occurring.
** The Ballarat 220 kV bus will be split post-contingency to manage flows on the Ballarat-Ararat-Crowlands and Ballarat-North Ballarat-
Bendigo 220 kV transmission lines.

© AEMO 2019 | Western Victoria Renewable Integration PACR 72
A8.2.1 Ballarat bus splitting control scheme
The PACR assessment shows that a cost-effective way to manage transmission line flows on the Ballarat –
Waubra – Crowlands – Bulgana transmission line and the Ballarat – North Ballarat transmission line is to:
• Move the Waubra Terminal Station connection to one of the new North Ballarat to Bulgana
transmission circuits.
• Implement a bus splitting scheme at the Ballarat 220 kV bus, together with an auto-close control scheme
for the B1 220/66 kV transformer at Ballarat.
The 220 kV bus split control scheme is required to prevent thermal overloads on some 220 kV transmission
lines, following a credible contingency, as listed in Table 24.
Table 24 Ballarat 220 kV bus split control scheme
Contingency Potential overload
Trip of Bulgana to Waubra to North Ballarat
220 kV transmission line Prevent overload of Ararat to Ballarat 220 kV transmission line, and North
Ballarat to Ballarat 220 kV transmission line
Trip of Bulgana to North Ballarat 220 kV
transmission line Prevent overload of Ararat to Ballarat 220 kV transmission line, and North
Ballarat to Ballarat 220 kV transmission line
Upon detection of one of the above conditions, the 220 kV bus at Ballarat will be split, and have the following
connections:
• Ballarat No. 1 220 kV bus:
– Ballarat – Moorabool No. 1.
– Ballarat – North Ballarat.
– B1 220/66 kV transformer.
– B2 220/66 kV transformer.
• Ballarat No. 2 220 kV bus:
– Ballarat – Terang.
– Ballarat – Elaine No. 2.
– Ballarat – Elaine No. 2.
Following operation of the Ballarat 220 kV bus split scheme, the Ballarat B1 Auto close scheme will be armed.
If armed, and upon detection of a Ballarat No. 1 Bus outage, an auto close signal will reconnect the Ballarat B1
220/66 kV transformer to the Ballarat No. 2 220 kV bus.
New circuit breakers are required at Ballarat Terminal Station to implement this scheme, to double switch the
Ballarat to Moorabool No. 1 transmission line, the Ballarat to Terang transmission line, and the Ballarat B1
transformer. The improvement to load flows from the implementation of this control scheme is shown in
Table 23 (in Section A8.2).
A8.3 Interaction with existing control schemes
There are several control schemes installed in the Western Victoria area to manage system security and
ensure effective operation for the local network. These control schemes will need to be reviewed, and
modified if necessary, before the commissioning of the preferred option of this RIT-T, to accommodate the
local network changes as a result.

© AEMO 2019 | Western Victoria Renewable Integration PACR 73
The cost for any required modification to the control scheme is expected to be immaterial and will not affect
the ranking of this RIT-T.
A8.3.1 Murraylink run-back schemes
The preferred option of this PACR is likely to reduce reliance on some Murraylink run-back schemes, by
reducing the flows on some of the monitored transmission circuits and reducing the impact of some critical
outages in the Western Victoria area:
• Slow run-back scheme – this control scheme monitors several transmission circuits in the Western Victoria
area, and will reduce Murraylink export from Victoria to South Australia, if the monitored transmission
circuits are too highly loaded.
• Fast run-back scheme – this control scheme monitors several transmission circuits and transformers in the
Western Victoria area, and will reduce Murraylink export from Victoria to South Australia, if the monitored
transmission circuits or transformers trip.
AEMO is reviewing the Murraylink run-back schemes considering the recent new generation connections to
the Western Victoria area. These control scheme will need to be further reviewed before the commissioning
of the preferred option of this PACR, to accommodate the change to the nearby transmission network.

© AEMO 2019 | Western Victoria Renewable Integration PACR 74
A9. Option C2 additional details
A9.1 Transmission line utilisation
The figures in this section show projected transmission line utilisation over the modelling horizon, in the
Neutral scenario. Utilisation is the projected transmission line flow plus operating margin, divided by the
transmission line’s short-term thermal rating.
Figure 14 shows the projected utilisation of the existing Ballarat to Ararat transmission line, after Option C2 is
implemented. The figure shows a transmission line overload less than 5% of the time, by 2030. This overload
will be removed by implementing the Ballarat bus splitting scheme described in Section A8.2.1, and is
therefore not a concern.
Figure 14 Ballarat to Ararat 220 kV transmission line utilisation, Neutral scenario
Figure 15 shows the projected utilisation of the reconfigured Ballarat to North Ballarat transmission line, after
Option C2 is implemented. The figure shows a transmission line overload less than 5% of the time, by 2025.
This overload will be removed by implementing the Ballarat bus splitting scheme described in Section A8.2.1,
and is therefore not a concern.

© AEMO 2019 | Western Victoria Renewable Integration PACR 75
Figure 15 Ballarat to North Ballarat 220 kV transmission line utilisation, Neutral scenario
Figure 16 shows the projected utilisation of the Elaine to Moorabool 220 kV transmission line, after Option C2
is implemented. There are no projected overloads on transmission line within the modelling period.
Figure 16 Elaine to Moorabool 220 kV transmission line utilisation, Neutral scenario

© AEMO 2019 | Western Victoria Renewable Integration PACR 76
A9.2 Interconnector utilisation
The figures in this section show the projected flow on major Victorian interconnectors, under the Neutral
scenario, in 2025 and 2030. A positive value indicates Victorian export to other states.
In 2025, as shown in Figure 17, the modelling indicates that Victoria will be exporting power to New South
Wales around 80% of the time and to South Australia over 90% of the time. Victoria is equally importing and
exporting power from Tasmania.
Figure 17 Victorian interconnector flow in 2025 under the Neutral scenario
In 2030 (see Figure 18), the modelling indicates that Victoria will be exporting power to New South Wales
over 80% of the time, and to South Australia over 85% of the time. Victoria is equally importing and exporting
power from Tasmania.
The projected interconnector utilisation in 2030 is consistent with the findings of the 2018 ISP (discussed in
A9.3). Victoria to New South Wales export is expected to increase after 2035, when the KerangLink
interconnector is assumed to be in service.

© AEMO 2019 | Western Victoria Renewable Integration PACR 77
Figure 18 Victorian interconnector flow in 2030 under the Neutral scenario
A9.3 KerangLink utilisation (2018 ISP)
AEMO’s 2018 ISP Appendices78 published the recent and projected utilisation of the Victoria to New South
Wales interconnector, under both the Neutral and Neutral with storage initiatives scenarios. This included the
North Ballarat to Sydenham 500 kV double circuit transmission line from the recommended option. As Figure
19 shows:
• The interconnector is projected to provide periods of high transfer to New South Wales.
• After the KerangLink interconnector is commissioned, net transfers from Victoria to New South Wales are
projected to increase substantially.
• The interconnector’s peak capacity is projected to be used to improve energy sharing across the NEM.
Figure 19 Projected utilisation of the Victoria to New South Wales interconnector, Neutral (left) and Neutral
with storage initiatives (right) – from 2018 ISP Appendices
78 Figure 18 in 2018 ISP, Appendix Section D.1.2, at http://www.aemo.com.au/Electricity/National-Electricity-Market-NEM/Planning-and-
forecasting/Integrated-System-Plan.

© AEMO 2019 | Western Victoria Renewable Integration PACR 78
A10. Option C2 high-level technical characteristics
The new transmission line parameters of Option C2 are subject to further detailed assessment and
detailed design.
The high-level functional requirements are:
• Establish a new terminal station close to Ballarat, called North Ballarat Terminal Station, with 2 x 1,000 MVA
500/220 kV transformers.
• Connect the existing Ballarat to Bendigo 220 kV transmission line at the new North Ballarat Terminal
Station to form the Ballarat to North Ballarat to Bendigo 220 kV transmission line.
• Construct a new Sydenham to North Ballarat 500 kV double circuit transmission line with a summer
rating79 of 2,700 MVA per circuit. Allow for 50MVAr transmission line reactors on both ends of the 500 kV
transmission lines.
• Construct a new North Ballarat to Bulgana 220 kV double circuit transmission line, with a summer rating of
750 MVA per circuit. One of the new 220 kV transmission circuits from North Ballarat to Bulgana is to be
connected to the existing Waubra Terminal Station. Disconnect the existing Waubra Terminal Station from
the existing Ballarat to Waubra to Ararat 220 kV transmission line.
• Terminate the existing Ballarat to Moorabool No. 2 220 kV transmission line at Elaine Terminal Station,
forming Ballarat to Elaine No. 2 line and Elaine to Moorabool No. 2 line. Install six additional circuit
breakers at Elaine Terminal Station to enable switching of transmission lines.
• No change to the existing Ballarat to Moorabool No. 1 220 kV transmission line.
• Install three additional circuit breakers at Ballarat Terminal Station to establish a bus splitting control
scheme following a critical contingency, and an auto closure control scheme for the Ballarat 220/66 kV
transformers.
• The proposed augmentation will increase the fault level at nearby transmission and distribution busses.
The increased fault levels are below the fault level limits in NER clause 9.3A, but will be above the station
rating at some locations. AEMO has coordinated with the local Distribution Network Service Provider
(Powercor) to identify high fault levels at Ballarat North Zone Substation (BAN), which is estimated to
require an augmentation costing $2 million to resolve. AEMO will continue to assess maximum fault levels
in Victoria in its Annual Fault Level Review (AFLR), which is shared with Victorian Network Service Providers
in December each year.
79 Summer rating assumes an ambient temperature of 40°C.

A10.1 Network configuration diagrams
Figure 20 shows the existing transmission network configuration in the Western Victoria area, and Figure 21 shows the proposed transmission network
configuration, after Option C2 is applied.
Figure 20 Single line diagram of current network configuration

Figure 21 Proposed single line diagram of Option C2 – subject to detailed design