Embed Size (px)
Citation preview
Western NSW District District Data ProfileMurrumbidgee, Far West and Western NSW
2 Contents
Introduction 4
Population – Western NSW 7
Aboriginal and Torres Strait Islander Population 13
Country of Birth 17
Language Spoken at Home 21
Migration Streams 28
Children & Young People 30
Government Schools 30
Early childhood development 42
Vulnerable children and young people 55
Contact with child protection services 59
Economic Environment 61
Education 61
Employment 65
Income 67
Socio-economic advantage and disadvantage 69
Social Environment 71
Community safety and crime 71
Contents
3 Contents
Maternal Health 78
Teenage pregnancy 78
Smoking during pregnancy 80
Australian Mothers Index 81
Disability 83
Need for assistance with core activities 83
Households and Social Housing 85
Households 85
Tenure types 87
Housing affordability 89
Social housing 91
4 Western NSW District Data Profile
IntroductionThis document presents a brief data profile for the Western New South Wales (NSW) district. It contains a series of tables and graphs that show the characteristics of persons, families and communities. It includes demographic, housing, child development, community safety and child protection information.
Where possible, we present this information at the local government area (LGA) level.
In the Western NSW district there are twenty-two LGAS:
• Bathurst Regional
• Blayney
• Bogan
• Bourke
• Brewarrina
• Cabonne
• Cobar
• Coonamble
• Cowra
• Forbes
• Gilgandra
• Lachlan
• Mid-western Regional
• Narromine
• Oberon
• Orange
• Parkes
• Walgett
• Warren
• Warrumbungle Shire
• Weddin
• Western Plains Regional
The data presented in this document is from a number of different sources, including:
• Australian Bureau of Statistics (ABS)
• Bureau of Crime Statistics and Research (BOCSAR)
• NSW Health Stats
• Australian Early Developmental Census (AEDC)
• NSW Government administrative data.
5 Western NSW District Data Profile
The majority of these sources are publicly available. We have provided source statements for each table and graph. This tells you where the data comes from and where you can find more information.
Please note, the information in the original sources may change as authors (e.g. ABS, NSW Healthstats) update the data. As such, we have also recorded the date we accessed the information.
If you would like additional suburb-level and Aboriginal and Torres Strait Islander specific data, the following sources are available to you:
• • The ABS provides demographic, cultural and linguistic diversity, employment and housing data at a suburb level though Quick Stats: https://www.abs.gov.au/websitedbs/D3310114.nsf/Home/2016%20QuickStats. For example, for the Orange suburb, select ‘Orange, NSW: State Suburb (SSC)’ from the drop down menu.
• • The ABS also ranks suburbs on the Socio-Economic Indexes for Areas (SEIFA): http://stat.data.abs.gov.au/Index.aspx?DataSetCode=SEIFA_SSC. For more information on the SEIFA, see page 50.
• • BOSCAR records criminal offences at a suburb level: https://www.bocsar.nsw.gov.au/Pages/bocsar_datasets/Datasets-.aspx. Follow the ‘Suburb’ link in the Geographic breakdown category for a spreadsheet containing all suburb-level crime data.
• • Information about Aboriginal and Torres Strait Islander persons, families and dwellings, including comparisons with non-Indigenous people, is also available at LGA level through the ABS 2016 Census Community Profiles: https://www.abs.gov.au/websitedbs/D3310114.nsf/Home/2016%20Census%20Community%20Profiles. For example, for information about the Aboriginal and Torres Strait Islander population of Orange, select ‘Orange (C), NSW: Local Government Area (LGA)’ from the drop down menu, and follow the link for the ‘Aboriginal and Torres Strait Islander Peoples Profile’.
All data sources are available throughout this report.
Demographics Census 2016
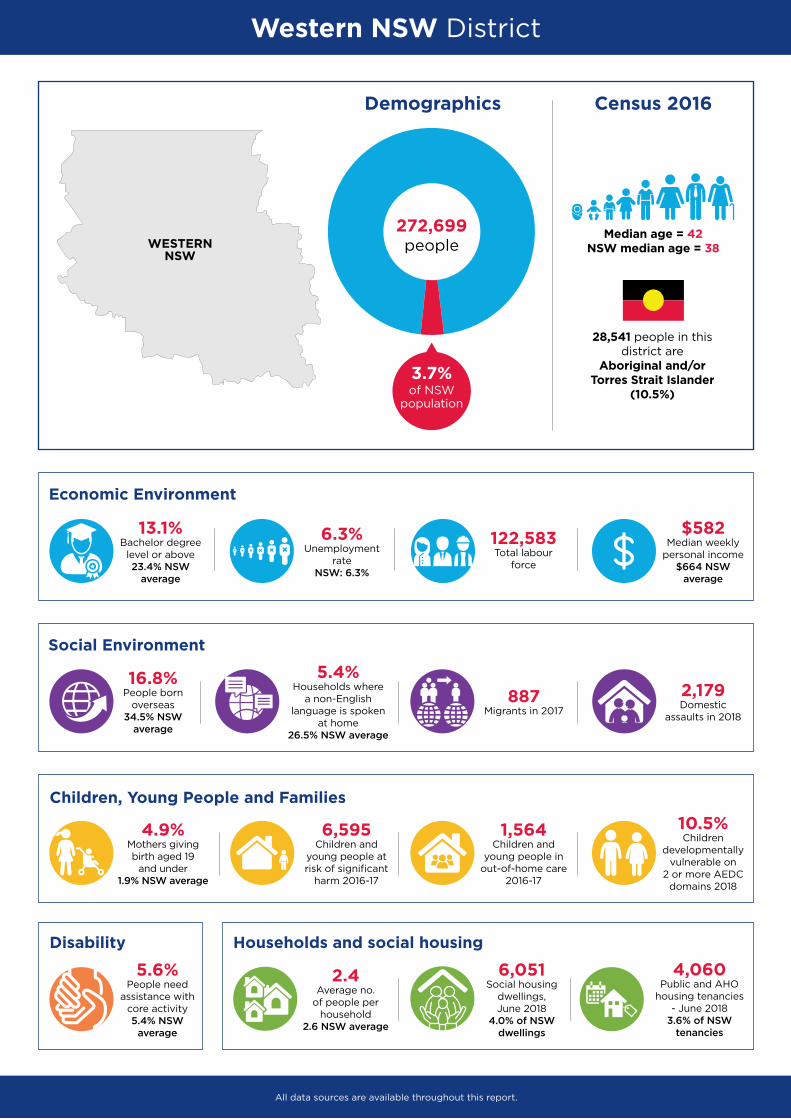
272,699people
3.7%of NSW
population
28,541 people in this district are
Aboriginal and/or Torres Strait Islander
(10.5%)
Median age = 42NSW median age = 38
Western NSW District
Social Environment
16.8%People born
overseas34.5% NSW
average
5.4%Households where
a non-English language is spoken
at home26.5% NSW average
887 Migrants in 2017
2,179Domestic
assaults in 2018
Economic Environment
13.1%Bachelor degree
level or above23.4% NSW
average
6.3%Unemployment
rateNSW: 6.3%
122,583Total labour
force
$582 Median weekly
personal income$664 NSW
average
Children, Young People and Families
1,564Children and
young people in out-of-home care
2016-17
10.5%Children
developmentally vulnerable on
2 or more AEDC domains 2018
6,595Children and
young people at risk of significant
harm 2016-17
4.9%Mothers giving birth aged 19
and under 1.9% NSW average
Disability Households and social housing
6,051Social housing
dwellings, June 2018
4.0% of NSW dwellings
4,060Public and AHO
housing tenancies - June 2018
3.6% of NSW tenancies
2.4Average no.
of people per household
2.6 NSW average
5.6%People need
assistance with core activity5.4% NSW
average
WESTERN NSW
7 Western NSW District Data Profile
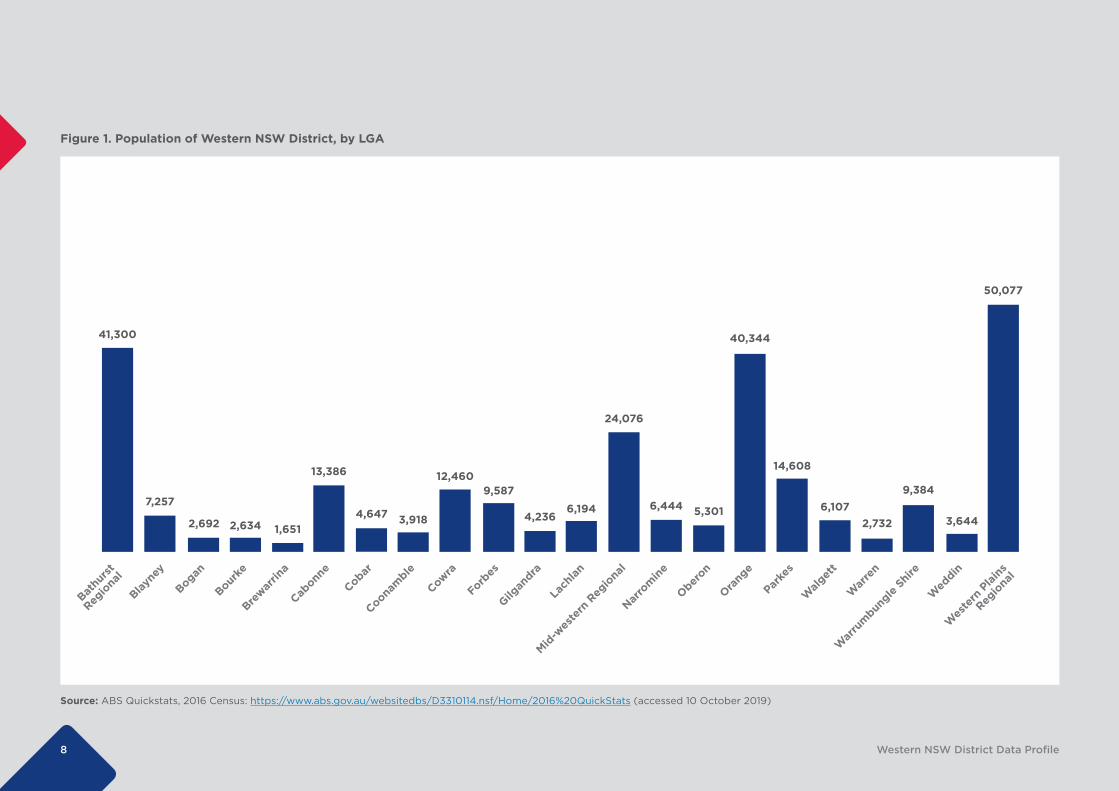
Population – Western NSWThe population in the Western NSW was estimated at 272,699 in the 2016 Census (see Figure 1). This district is made up of twenty-two local government areas (LGAs). The largest LGA is Western Plains Regional with an estimated population of 50,077. The smallest LGA is Brewarrina with an estimated population of 1,651.
8 Western NSW District Data Profile
Figure 1. Population of Western NSW District, by LGA
41,300
Bathu
rst
Regio
nal
Blayne
y
Bogan
Bourke
Brewar
rina
Cabonn
e
Cobar
Coonam
ble
Cowra
Forbes
Lach
lan
7,257
2,692 2,634 1,651
13,386
4,647 3,918
12,4609,587
4,2366,194
24,076
6,444 5,301
40,344
14,608
6,107
Gilgan
dra
Mid-w
este
rn R
egio
nal
Narro
mine
Oberon
Orang
e
Parke
s
Walg
ett
War
ren
War
rum
bungle
Shire
Wed
din
Wes
tern
Plai
ns
Regio
nal
2,732
9,384
3,644
50,077
Source: ABS Quickstats, 2016 Census: https://www.abs.gov.au/websitedbs/D3310114.nsf/Home/2016%20QuickStats (accessed 10 October 2019)
9 Western NSW District Data Profile
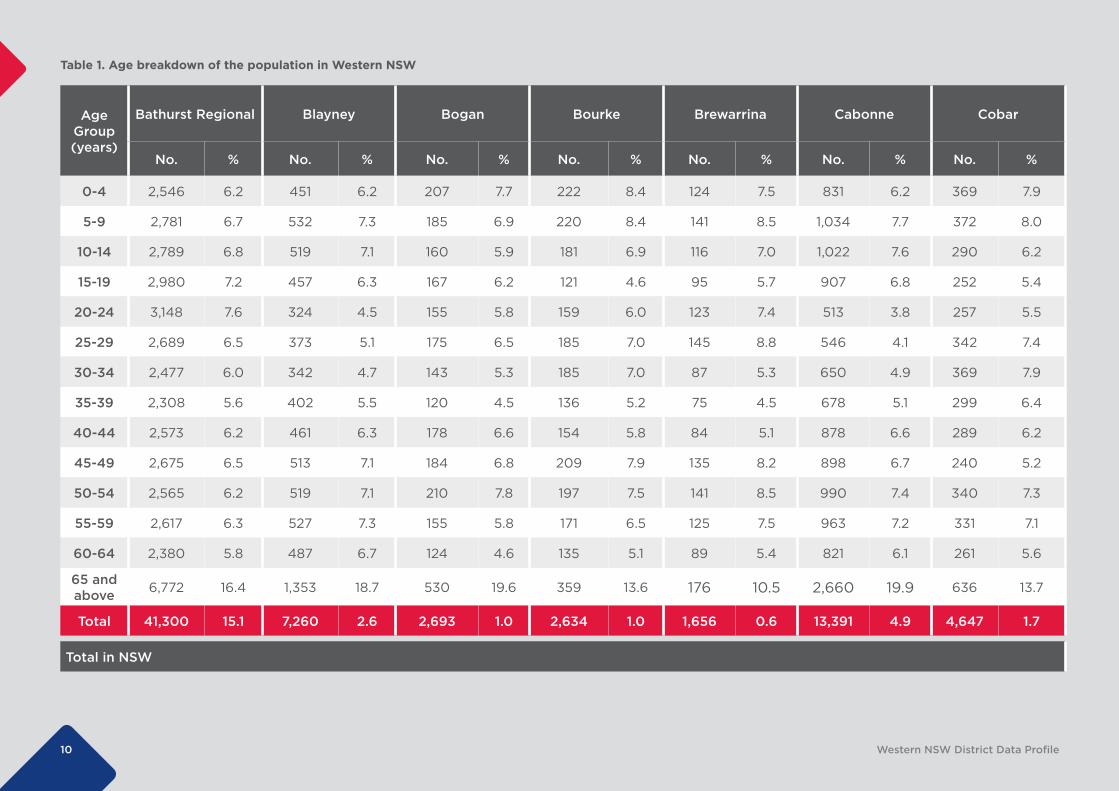
The median age in New South Wales is 38 years of age. In the Western NSW district, the LGAs of Bathurst Regional, Orange, and Western Plains Regional are close to the state average, with their median ages at 37. Weddin has the oldest population with its median age at 51.
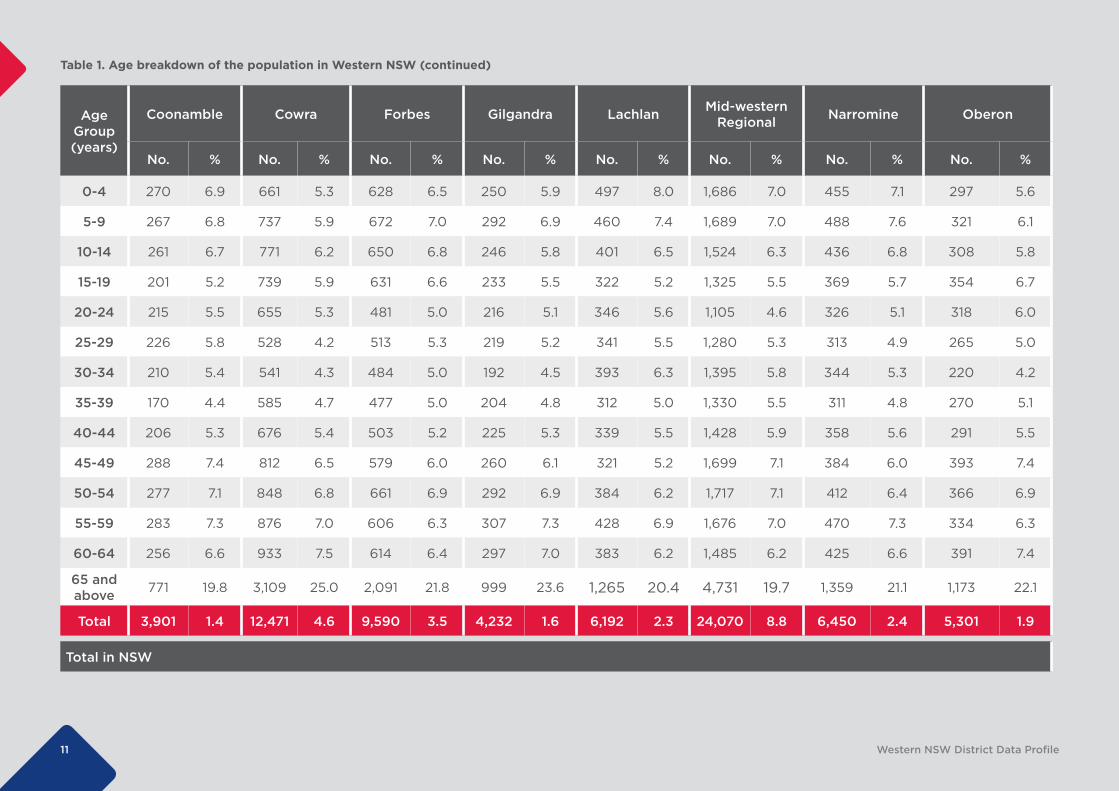
Table 1 shows a breakdown of age for each LGA in Western NSW.
10 Western NSW District Data Profile
Table 1. Age breakdown of the population in Western NSW
Age Group (years)
Bathurst Regional Blayney Bogan Bourke Brewarrina Cabonne Cobar
No. % No. % No. % No. % No. % No. % No. %
0-4 2,546 6.2 451 6.2 207 7.7 222 8.4 124 7.5 831 6.2 369 7.9
5-9 2,781 6.7 532 7.3 185 6.9 220 8.4 141 8.5 1,034 7.7 372 8.0
10-14 2,789 6.8 519 7.1 160 5.9 181 6.9 116 7.0 1,022 7.6 290 6.2
15-19 2,980 7.2 457 6.3 167 6.2 121 4.6 95 5.7 907 6.8 252 5.4
20-24 3,148 7.6 324 4.5 155 5.8 159 6.0 123 7.4 513 3.8 257 5.5
25-29 2,689 6.5 373 5.1 175 6.5 185 7.0 145 8.8 546 4.1 342 7.4
30-34 2,477 6.0 342 4.7 143 5.3 185 7.0 87 5.3 650 4.9 369 7.9
35-39 2,308 5.6 402 5.5 120 4.5 136 5.2 75 4.5 678 5.1 299 6.4
40-44 2,573 6.2 461 6.3 178 6.6 154 5.8 84 5.1 878 6.6 289 6.2
45-49 2,675 6.5 513 7.1 184 6.8 209 7.9 135 8.2 898 6.7 240 5.2
50-54 2,565 6.2 519 7.1 210 7.8 197 7.5 141 8.5 990 7.4 340 7.3
55-59 2,617 6.3 527 7.3 155 5.8 171 6.5 125 7.5 963 7.2 331 7.1
60-64 2,380 5.8 487 6.7 124 4.6 135 5.1 89 5.4 821 6.1 261 5.6
65 and above 6,772 16.4 1,353 18.7 530 19.6 359 13.6 176 10.5 2,660 19.9 636 13.7
Total 41,300 15.1 7,260 2.6 2,693 1.0 2,634 1.0 1,656 0.6 13,391 4.9 4,647 1.7
Total in NSW
11 Western NSW District Data Profile
Table 1. Age breakdown of the population in Western NSW (continued)
Age Group (years)
Coonamble Cowra Forbes Gilgandra Lachlan Mid-western Regional Narromine Oberon
No. % No. % No. % No. % No. % No. % No. % No. %
0-4 270 6.9 661 5.3 628 6.5 250 5.9 497 8.0 1,686 7.0 455 7.1 297 5.6
5-9 267 6.8 737 5.9 672 7.0 292 6.9 460 7.4 1,689 7.0 488 7.6 321 6.1
10-14 261 6.7 771 6.2 650 6.8 246 5.8 401 6.5 1,524 6.3 436 6.8 308 5.8
15-19 201 5.2 739 5.9 631 6.6 233 5.5 322 5.2 1,325 5.5 369 5.7 354 6.7
20-24 215 5.5 655 5.3 481 5.0 216 5.1 346 5.6 1,105 4.6 326 5.1 318 6.0
25-29 226 5.8 528 4.2 513 5.3 219 5.2 341 5.5 1,280 5.3 313 4.9 265 5.0
30-34 210 5.4 541 4.3 484 5.0 192 4.5 393 6.3 1,395 5.8 344 5.3 220 4.2
35-39 170 4.4 585 4.7 477 5.0 204 4.8 312 5.0 1,330 5.5 311 4.8 270 5.1
40-44 206 5.3 676 5.4 503 5.2 225 5.3 339 5.5 1,428 5.9 358 5.6 291 5.5
45-49 288 7.4 812 6.5 579 6.0 260 6.1 321 5.2 1,699 7.1 384 6.0 393 7.4
50-54 277 7.1 848 6.8 661 6.9 292 6.9 384 6.2 1,717 7.1 412 6.4 366 6.9
55-59 283 7.3 876 7.0 606 6.3 307 7.3 428 6.9 1,676 7.0 470 7.3 334 6.3
60-64 256 6.6 933 7.5 614 6.4 297 7.0 383 6.2 1,485 6.2 425 6.6 391 7.4
65 and above 771 19.8 3,109 25.0 2,091 21.8 999 23.6 1,265 20.4 4,731 19.7 1,359 21.1 1,173 22.1
Total 3,901 1.4 12,471 4.6 9,590 3.5 4,232 1.6 6,192 2.3 24,070 8.8 6,450 2.4 5,301 1.9
Total in NSW
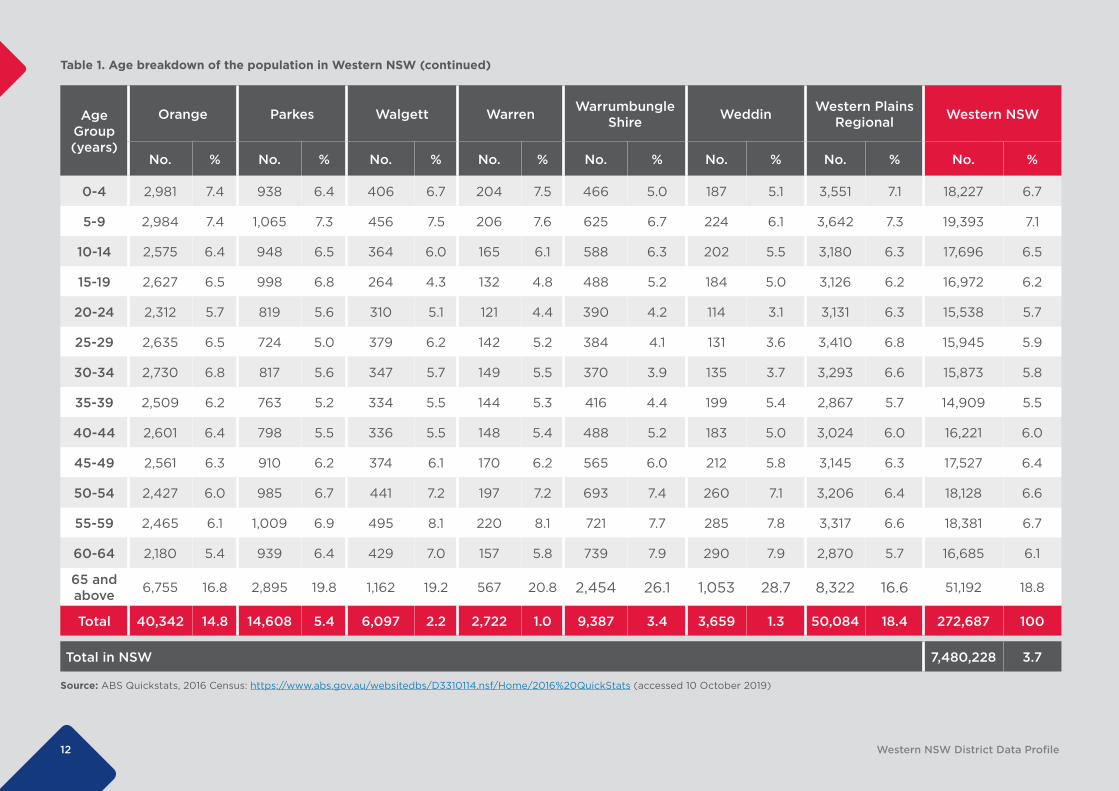
12 Western NSW District Data Profile
Table 1. Age breakdown of the population in Western NSW (continued)
Age Group (years)
Orange Parkes Walgett Warren Warrumbungle Shire Weddin Western Plains
Regional Western NSW
No. % No. % No. % No. % No. % No. % No. % No. %
0-4 2,981 7.4 938 6.4 406 6.7 204 7.5 466 5.0 187 5.1 3,551 7.1 18,227 6.7
5-9 2,984 7.4 1,065 7.3 456 7.5 206 7.6 625 6.7 224 6.1 3,642 7.3 19,393 7.1
10-14 2,575 6.4 948 6.5 364 6.0 165 6.1 588 6.3 202 5.5 3,180 6.3 17,696 6.5
15-19 2,627 6.5 998 6.8 264 4.3 132 4.8 488 5.2 184 5.0 3,126 6.2 16,972 6.2
20-24 2,312 5.7 819 5.6 310 5.1 121 4.4 390 4.2 114 3.1 3,131 6.3 15,538 5.7
25-29 2,635 6.5 724 5.0 379 6.2 142 5.2 384 4.1 131 3.6 3,410 6.8 15,945 5.9
30-34 2,730 6.8 817 5.6 347 5.7 149 5.5 370 3.9 135 3.7 3,293 6.6 15,873 5.8
35-39 2,509 6.2 763 5.2 334 5.5 144 5.3 416 4.4 199 5.4 2,867 5.7 14,909 5.5
40-44 2,601 6.4 798 5.5 336 5.5 148 5.4 488 5.2 183 5.0 3,024 6.0 16,221 6.0
45-49 2,561 6.3 910 6.2 374 6.1 170 6.2 565 6.0 212 5.8 3,145 6.3 17,527 6.4
50-54 2,427 6.0 985 6.7 441 7.2 197 7.2 693 7.4 260 7.1 3,206 6.4 18,128 6.6
55-59 2,465 6.1 1,009 6.9 495 8.1 220 8.1 721 7.7 285 7.8 3,317 6.6 18,381 6.7
60-64 2,180 5.4 939 6.4 429 7.0 157 5.8 739 7.9 290 7.9 2,870 5.7 16,685 6.1
65 and above 6,755 16.8 2,895 19.8 1,162 19.2 567 20.8 2,454 26.1 1,053 28.7 8,322 16.6 51,192 18.8
Total 40,342 14.8 14,608 5.4 6,097 2.2 2,722 1.0 9,387 3.4 3,659 1.3 50,084 18.4 272,687 100
Total in NSW 7,480,228 3.7
Source: ABS Quickstats, 2016 Census: https://www.abs.gov.au/websitedbs/D3310114.nsf/Home/2016%20QuickStats (accessed 10 October 2019)
13 Western NSW District Data Profile
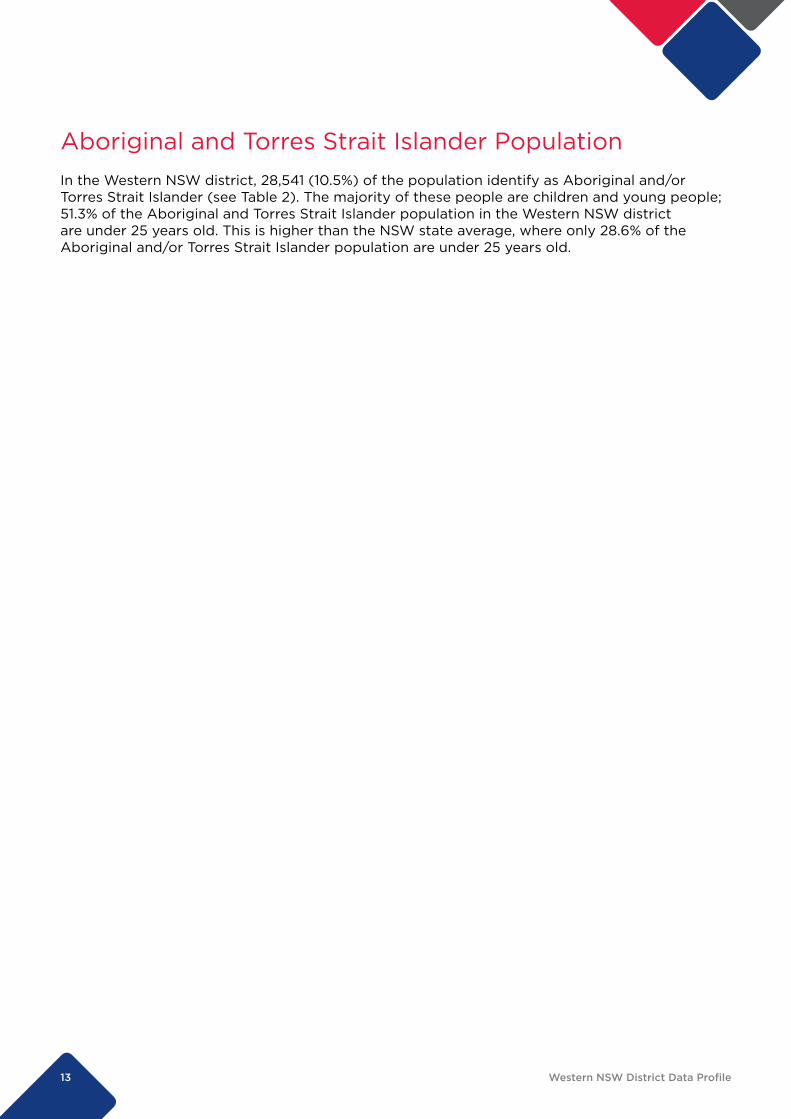
Aboriginal and Torres Strait Islander PopulationIn the Western NSW district, 28,541 (10.5%) of the population identify as Aboriginal and/or Torres Strait Islander (see Table 2). The majority of these people are children and young people; 51.3% of the Aboriginal and Torres Strait Islander population in the Western NSW district are under 25 years old. This is higher than the NSW state average, where only 28.6% of the Aboriginal and/or Torres Strait Islander population are under 25 years old.
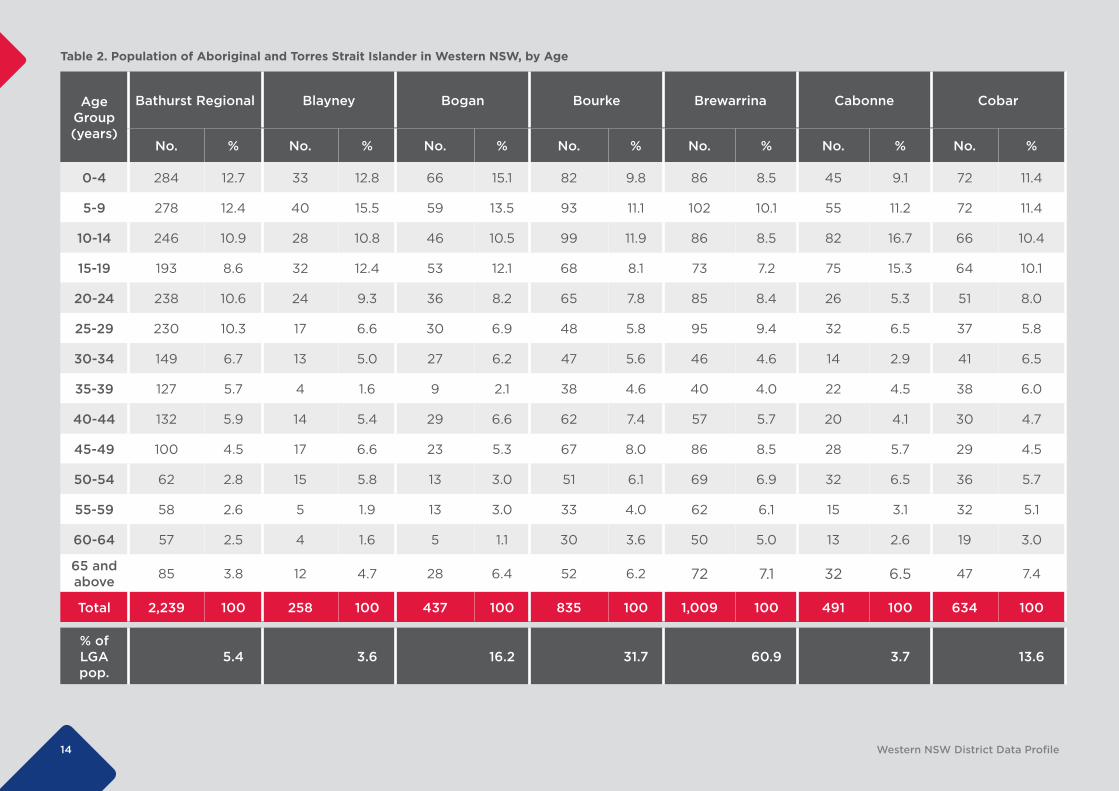
14 Western NSW District Data Profile
Table 2. Population of Aboriginal and Torres Strait Islander in Western NSW, by Age
Age Group (years)
Bathurst Regional Blayney Bogan Bourke Brewarrina Cabonne Cobar
No. % No. % No. % No. % No. % No. % No. %
0-4 284 12.7 33 12.8 66 15.1 82 9.8 86 8.5 45 9.1 72 11.4
5-9 278 12.4 40 15.5 59 13.5 93 11.1 102 10.1 55 11.2 72 11.4
10-14 246 10.9 28 10.8 46 10.5 99 11.9 86 8.5 82 16.7 66 10.4
15-19 193 8.6 32 12.4 53 12.1 68 8.1 73 7.2 75 15.3 64 10.1
20-24 238 10.6 24 9.3 36 8.2 65 7.8 85 8.4 26 5.3 51 8.0
25-29 230 10.3 17 6.6 30 6.9 48 5.8 95 9.4 32 6.5 37 5.8
30-34 149 6.7 13 5.0 27 6.2 47 5.6 46 4.6 14 2.9 41 6.5
35-39 127 5.7 4 1.6 9 2.1 38 4.6 40 4.0 22 4.5 38 6.0
40-44 132 5.9 14 5.4 29 6.6 62 7.4 57 5.7 20 4.1 30 4.7
45-49 100 4.5 17 6.6 23 5.3 67 8.0 86 8.5 28 5.7 29 4.5
50-54 62 2.8 15 5.8 13 3.0 51 6.1 69 6.9 32 6.5 36 5.7
55-59 58 2.6 5 1.9 13 3.0 33 4.0 62 6.1 15 3.1 32 5.1
60-64 57 2.5 4 1.6 5 1.1 30 3.6 50 5.0 13 2.6 19 3.0
65 and above 85 3.8 12 4.7 28 6.4 52 6.2 72 7.1 32 6.5 47 7.4
Total 2,239 100 258 100 437 100 835 100 1,009 100 491 100 634 100
% of LGA pop.
5.4 3.6 16.2 31.7 60.9 3.7 13.6
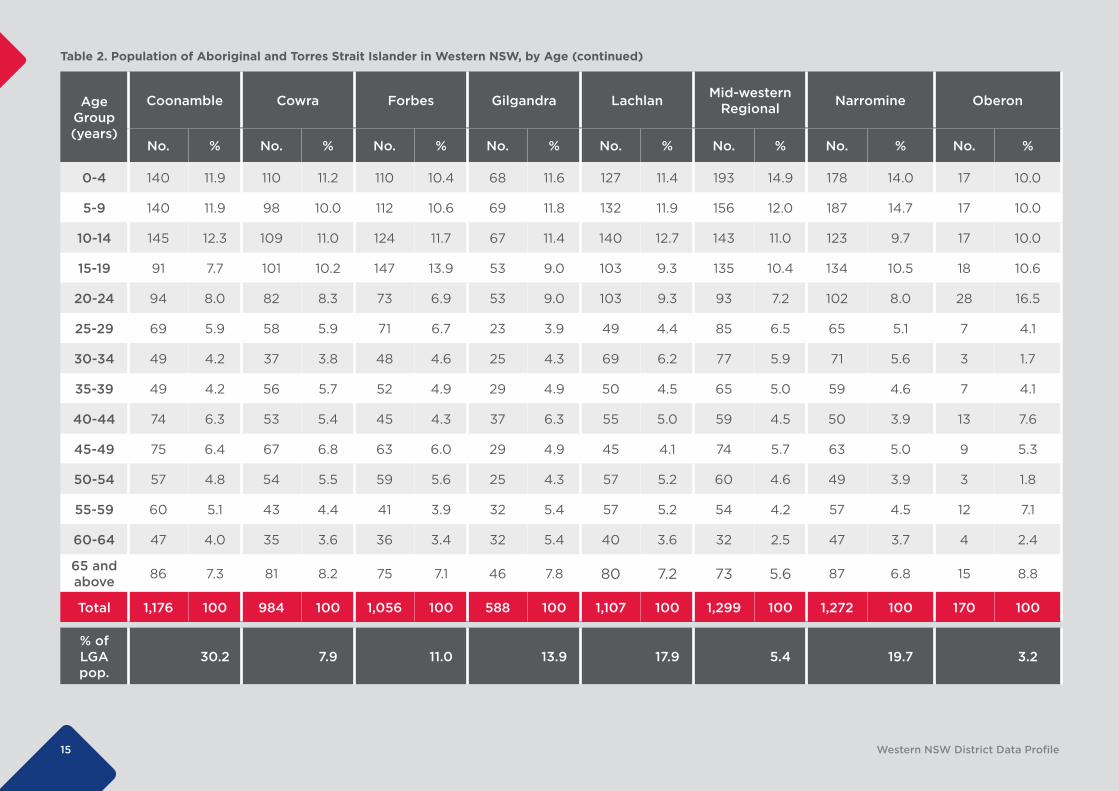
15 Western NSW District Data Profile
Table 2. Population of Aboriginal and Torres Strait Islander in Western NSW, by Age (continued)
Age Group (years)
Coonamble Cowra Forbes Gilgandra Lachlan Mid-western Regional Narromine Oberon
No. % No. % No. % No. % No. % No. % No. % No. %
0-4 140 11.9 110 11.2 110 10.4 68 11.6 127 11.4 193 14.9 178 14.0 17 10.0
5-9 140 11.9 98 10.0 112 10.6 69 11.8 132 11.9 156 12.0 187 14.7 17 10.0
10-14 145 12.3 109 11.0 124 11.7 67 11.4 140 12.7 143 11.0 123 9.7 17 10.0
15-19 91 7.7 101 10.2 147 13.9 53 9.0 103 9.3 135 10.4 134 10.5 18 10.6
20-24 94 8.0 82 8.3 73 6.9 53 9.0 103 9.3 93 7.2 102 8.0 28 16.5
25-29 69 5.9 58 5.9 71 6.7 23 3.9 49 4.4 85 6.5 65 5.1 7 4.1
30-34 49 4.2 37 3.8 48 4.6 25 4.3 69 6.2 77 5.9 71 5.6 3 1.7
35-39 49 4.2 56 5.7 52 4.9 29 4.9 50 4.5 65 5.0 59 4.6 7 4.1
40-44 74 6.3 53 5.4 45 4.3 37 6.3 55 5.0 59 4.5 50 3.9 13 7.6
45-49 75 6.4 67 6.8 63 6.0 29 4.9 45 4.1 74 5.7 63 5.0 9 5.3
50-54 57 4.8 54 5.5 59 5.6 25 4.3 57 5.2 60 4.6 49 3.9 3 1.8
55-59 60 5.1 43 4.4 41 3.9 32 5.4 57 5.2 54 4.2 57 4.5 12 7.1
60-64 47 4.0 35 3.6 36 3.4 32 5.4 40 3.6 32 2.5 47 3.7 4 2.4
65 and above 86 7.3 81 8.2 75 7.1 46 7.8 80 7.2 73 5.6 87 6.8 15 8.8
Total 1,176 100 984 100 1,056 100 588 100 1,107 100 1,299 100 1,272 100 170 100
% of LGA pop.
30.2 7.9 11.0 13.9 17.9 5.4 19.7 3.2
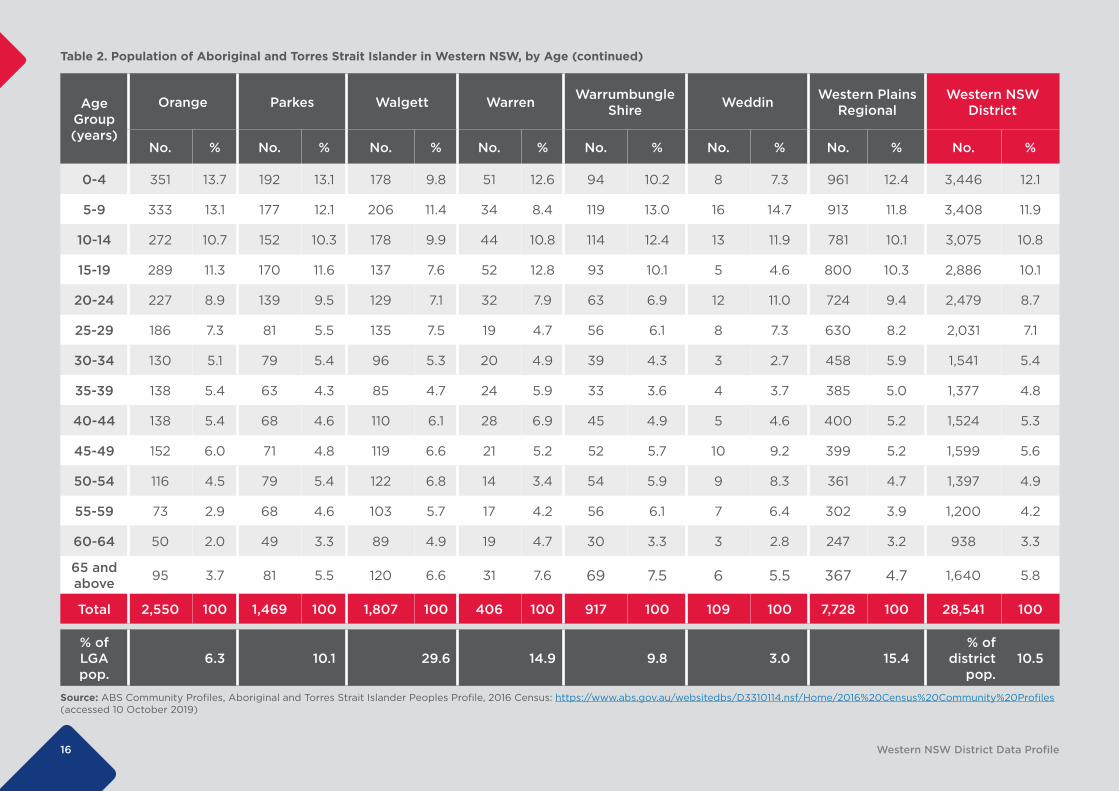
16 Western NSW District Data Profile
Table 2. Population of Aboriginal and Torres Strait Islander in Western NSW, by Age (continued)
Source: ABS Community Profiles, Aboriginal and Torres Strait Islander Peoples Profile, 2016 Census: https://www.abs.gov.au/websitedbs/D3310114.nsf/Home/2016%20Census%20Community%20Profiles (accessed 10 October 2019)
Age Group (years)
Orange Parkes Walgett Warren Warrumbungle Shire Weddin Western Plains
RegionalWestern NSW
District
No. % No. % No. % No. % No. % No. % No. % No. %
0-4 351 13.7 192 13.1 178 9.8 51 12.6 94 10.2 8 7.3 961 12.4 3,446 12.1
5-9 333 13.1 177 12.1 206 11.4 34 8.4 119 13.0 16 14.7 913 11.8 3,408 11.9
10-14 272 10.7 152 10.3 178 9.9 44 10.8 114 12.4 13 11.9 781 10.1 3,075 10.8
15-19 289 11.3 170 11.6 137 7.6 52 12.8 93 10.1 5 4.6 800 10.3 2,886 10.1
20-24 227 8.9 139 9.5 129 7.1 32 7.9 63 6.9 12 11.0 724 9.4 2,479 8.7
25-29 186 7.3 81 5.5 135 7.5 19 4.7 56 6.1 8 7.3 630 8.2 2,031 7.1
30-34 130 5.1 79 5.4 96 5.3 20 4.9 39 4.3 3 2.7 458 5.9 1,541 5.4
35-39 138 5.4 63 4.3 85 4.7 24 5.9 33 3.6 4 3.7 385 5.0 1,377 4.8
40-44 138 5.4 68 4.6 110 6.1 28 6.9 45 4.9 5 4.6 400 5.2 1,524 5.3
45-49 152 6.0 71 4.8 119 6.6 21 5.2 52 5.7 10 9.2 399 5.2 1,599 5.6
50-54 116 4.5 79 5.4 122 6.8 14 3.4 54 5.9 9 8.3 361 4.7 1,397 4.9
55-59 73 2.9 68 4.6 103 5.7 17 4.2 56 6.1 7 6.4 302 3.9 1,200 4.2
60-64 50 2.0 49 3.3 89 4.9 19 4.7 30 3.3 3 2.8 247 3.2 938 3.3
65 and above 95 3.7 81 5.5 120 6.6 31 7.6 69 7.5 6 5.5 367 4.7 1,640 5.8
Total 2,550 100 1,469 100 1,807 100 406 100 917 100 109 100 7,728 100 28,541 100
% of LGA pop.
6.3 10.1 29.6 14.9 9.8 3.0 15.4% of
district pop.
10.5
17 Western NSW District Data Profile
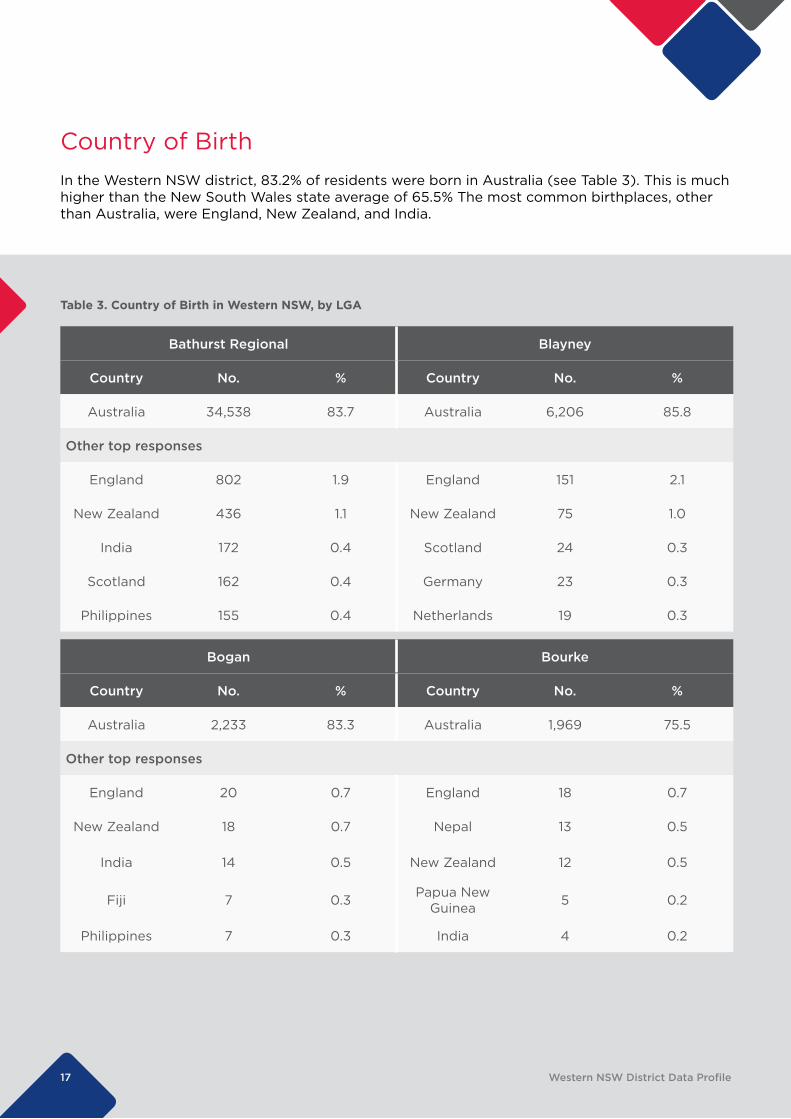
Table 3. Country of Birth in Western NSW, by LGA
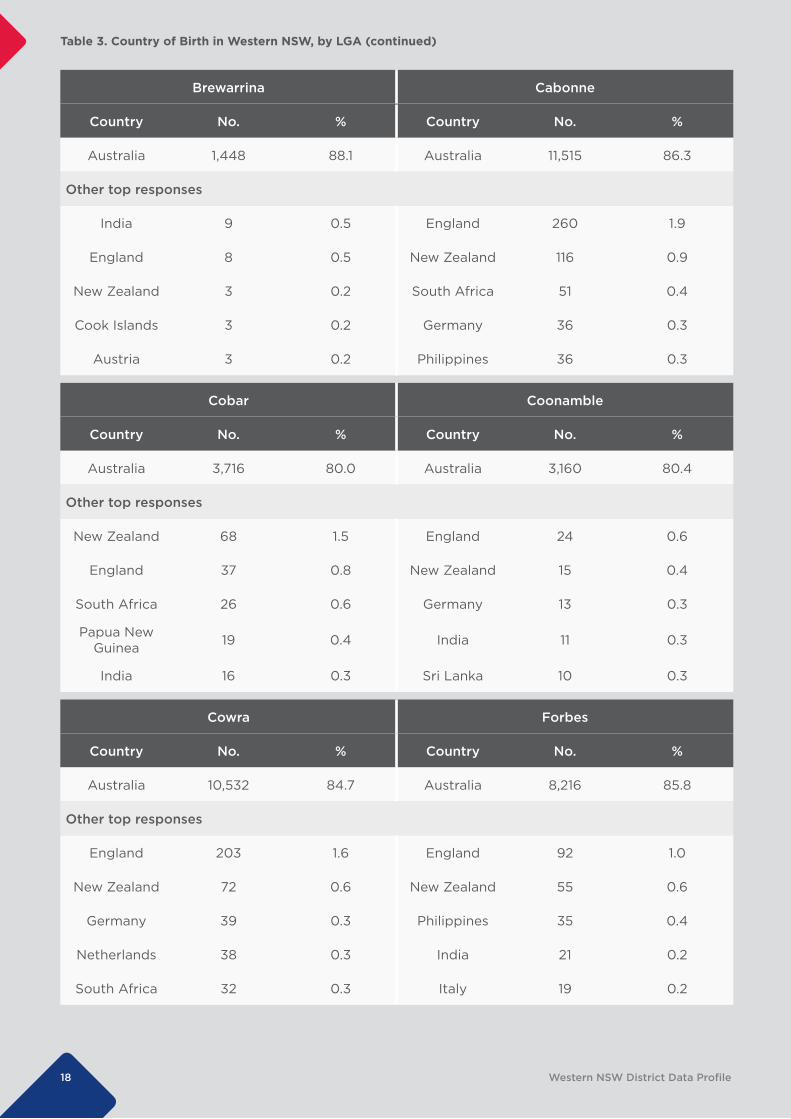
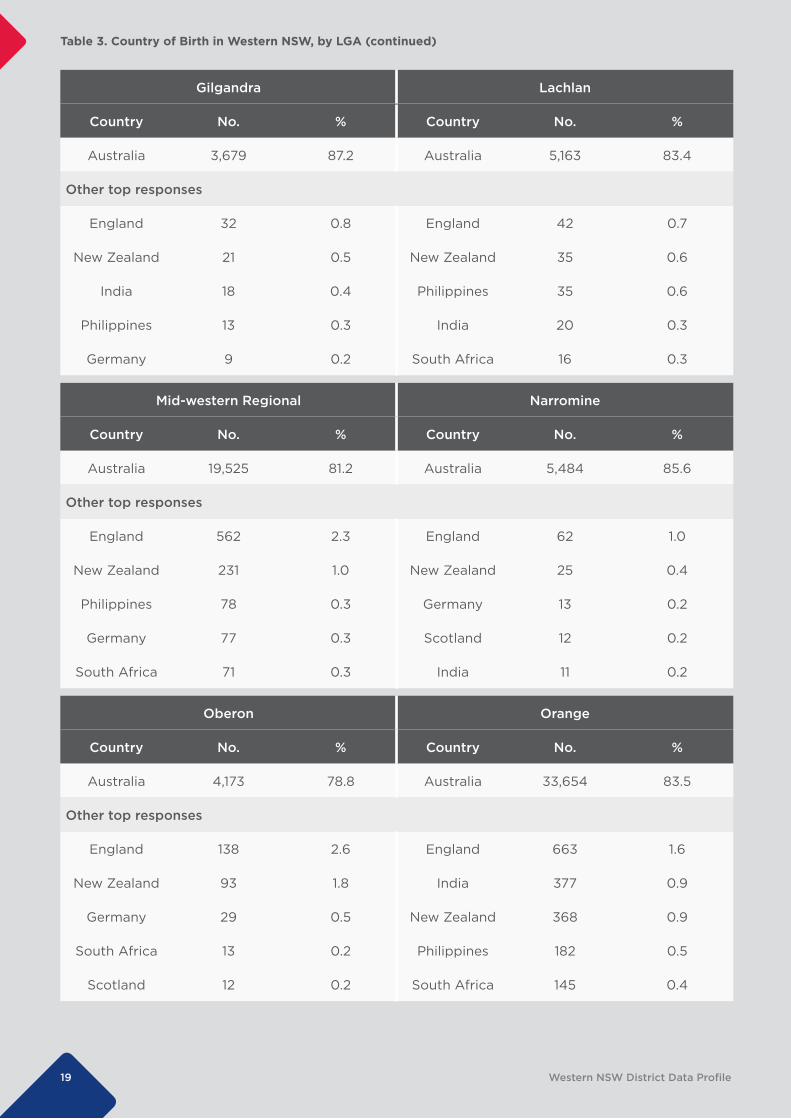
Country of BirthIn the Western NSW district, 83.2% of residents were born in Australia (see Table 3). This is much higher than the New South Wales state average of 65.5% The most common birthplaces, other than Australia, were England, New Zealand, and India.
Bathurst Regional Blayney
Country No. % Country No. %
Australia 34,538 83.7 Australia 6,206 85.8
Other top responses
England 802 1.9 England 151 2.1
New Zealand 436 1.1 New Zealand 75 1.0
India 172 0.4 Scotland 24 0.3
Scotland 162 0.4 Germany 23 0.3
Philippines 155 0.4 Netherlands 19 0.3
Bogan Bourke
Country No. % Country No. %
Australia 2,233 83.3 Australia 1,969 75.5
Other top responses
England 20 0.7 England 18 0.7
New Zealand 18 0.7 Nepal 13 0.5
India 14 0.5 New Zealand 12 0.5
Fiji 7 0.3 Papua New Guinea 5 0.2
Philippines 7 0.3 India 4 0.2
18 Western NSW District Data Profile
Table 3. Country of Birth in Western NSW, by LGA (continued)
Brewarrina Cabonne
Country No. % Country No. %
Australia 1,448 88.1 Australia 11,515 86.3
Other top responses
India 9 0.5 England 260 1.9
England 8 0.5 New Zealand 116 0.9
New Zealand 3 0.2 South Africa 51 0.4
Cook Islands 3 0.2 Germany 36 0.3
Austria 3 0.2 Philippines 36 0.3
Cobar Coonamble
Country No. % Country No. %
Australia 3,716 80.0 Australia 3,160 80.4
Other top responses
New Zealand 68 1.5 England 24 0.6
England 37 0.8 New Zealand 15 0.4
South Africa 26 0.6 Germany 13 0.3
Papua New Guinea 19 0.4 India 11 0.3
India 16 0.3 Sri Lanka 10 0.3
Cowra Forbes
Country No. % Country No. %
Australia 10,532 84.7 Australia 8,216 85.8
Other top responses
England 203 1.6 England 92 1.0
New Zealand 72 0.6 New Zealand 55 0.6
Germany 39 0.3 Philippines 35 0.4
Netherlands 38 0.3 India 21 0.2
South Africa 32 0.3 Italy 19 0.2
19 Western NSW District Data Profile
Gilgandra Lachlan
Country No. % Country No. %
Australia 3,679 87.2 Australia 5,163 83.4
Other top responses
England 32 0.8 England 42 0.7
New Zealand 21 0.5 New Zealand 35 0.6
India 18 0.4 Philippines 35 0.6
Philippines 13 0.3 India 20 0.3
Germany 9 0.2 South Africa 16 0.3
Mid-western Regional Narromine
Country No. % Country No. %
Australia 19,525 81.2 Australia 5,484 85.6
Other top responses
England 562 2.3 England 62 1.0
New Zealand 231 1.0 New Zealand 25 0.4
Philippines 78 0.3 Germany 13 0.2
Germany 77 0.3 Scotland 12 0.2
South Africa 71 0.3 India 11 0.2
Oberon Orange
Country No. % Country No. %
Australia 4,173 78.8 Australia 33,654 83.5
Other top responses
England 138 2.6 England 663 1.6
New Zealand 93 1.8 India 377 0.9
Germany 29 0.5 New Zealand 368 0.9
South Africa 13 0.2 Philippines 182 0.5
Scotland 12 0.2 South Africa 145 0.4
Table 3. Country of Birth in Western NSW, by LGA (continued)
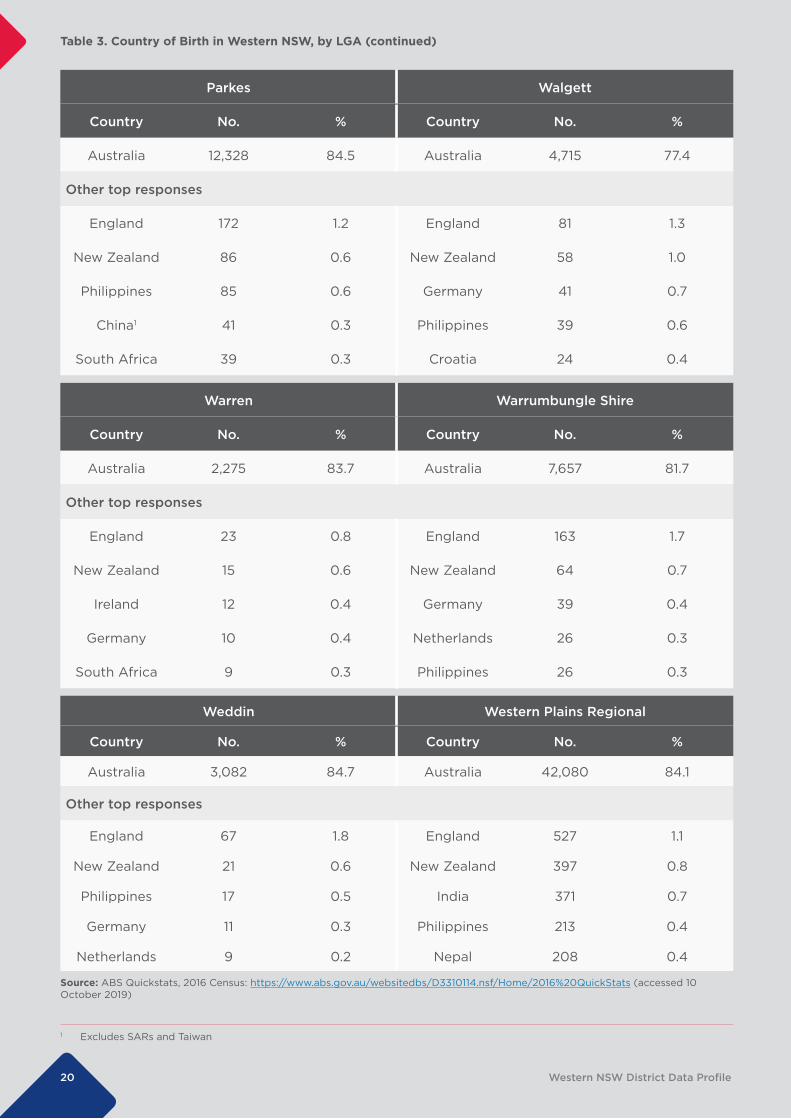
Parkes Walgett
Country No. % Country No. %
Australia 12,328 84.5 Australia 4,715 77.4
Other top responses
England 172 1.2 England 81 1.3
New Zealand 86 0.6 New Zealand 58 1.0
Philippines 85 0.6 Germany 41 0.7
China1 41 0.3 Philippines 39 0.6
South Africa 39 0.3 Croatia 24 0.4
Warren Warrumbungle Shire
Country No. % Country No. %
Australia 2,275 83.7 Australia 7,657 81.7
Other top responses
England 23 0.8 England 163 1.7
New Zealand 15 0.6 New Zealand 64 0.7
Ireland 12 0.4 Germany 39 0.4
Germany 10 0.4 Netherlands 26 0.3
South Africa 9 0.3 Philippines 26 0.3
Weddin Western Plains Regional
Country No. % Country No. %
Australia 3,082 84.7 Australia 42,080 84.1
Other top responses
England 67 1.8 England 527 1.1
New Zealand 21 0.6 New Zealand 397 0.8
Philippines 17 0.5 India 371 0.7
Germany 11 0.3 Philippines 213 0.4
Netherlands 9 0.2 Nepal 208 0.4
1 Excludes SARs and Taiwan
Source: ABS Quickstats, 2016 Census: https://www.abs.gov.au/websitedbs/D3310114.nsf/Home/2016%20QuickStats (accessed 10 October 2019)
Table 3. Country of Birth in Western NSW, by LGA (continued)
20 Western NSW District Data Profile
21 Western NSW District Data Profile
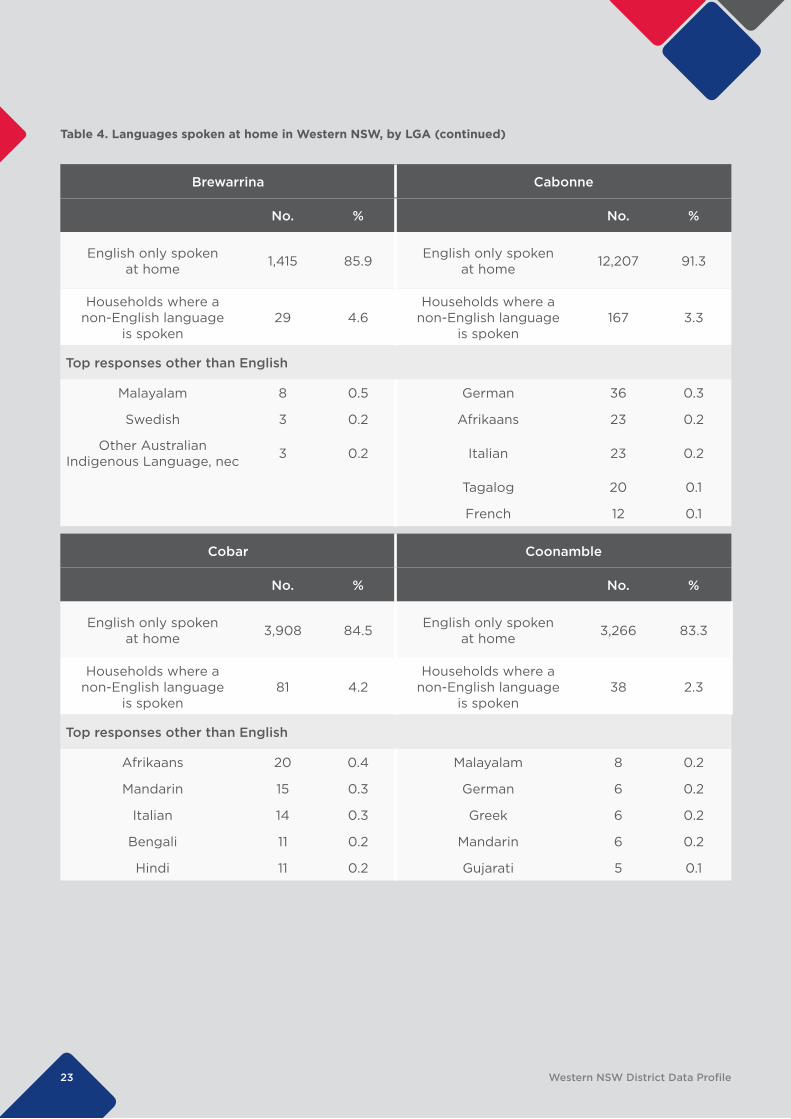
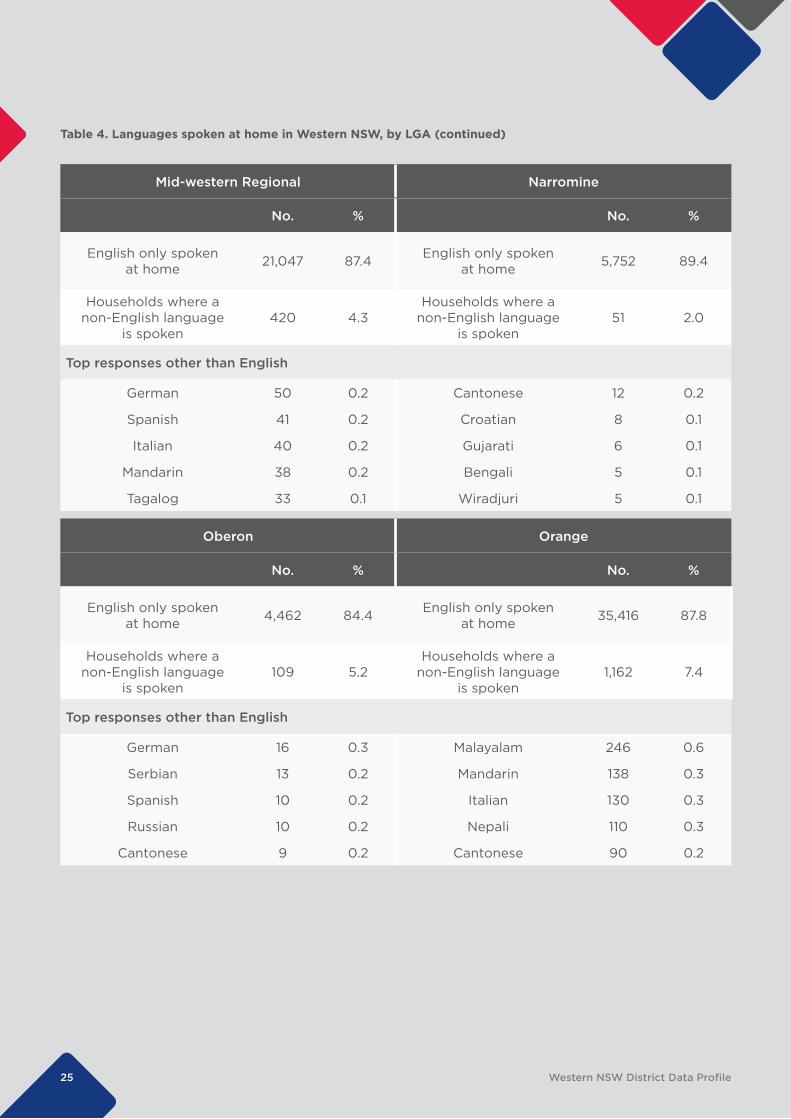
Language Spoken at HomeIn Western NSW, 87.4% of residents spoke only English at home (see Table 4). This is much higher than the New South Wales state average of 68.5%.
The proportion of households where a non-English language was spoken at home was highest in Weddin (7.6%), Orange (7.4%), and Walgett (6.7%).

22 Western NSW District Data Profile
Table 4. Languages spoken at home in Western NSW, by LGA
Bathurst Regional Blayney
No. % No. %
English only spoken at home 35,906 87.0 English only spoken
at home 6,650 91.5
Households where a non-English language
is spoken896 5.8
Households where a non-English language
is spoken76 2.7
Top responses other than English
Mandarin 108 0.3 German 16 0.2
Arabic 101 0.2 Arabic 11 0.2
Cantonese 72 0.2 Cantonese 11 0.2
Punjabi 63 0.2 Tamil 8 0.1
German 62 0.2 French 7 0.1
Bogan Bourke
No. % No. %
English only spoken at home 2,335 87.0 English only spoken
at home 2,048 78.0
Households where a non-English language
is spoken33 3.0
Households where a non-English language
is spoken38 3.3
Top responses other than English
Afrikaans 7 0.3 Nepali 19 0.7
Urdu 7 0.3 Tok Pisin (Neomelanesian) 7 0.3
Filipino 5 0.2 Spanish 4 0.2
Portuguese 4 0.1 Arabic 4 0.2
Vietnamese 4 0.1 Urdu 4 0.2
23 Western NSW District Data Profile
Brewarrina Cabonne
No. % No. %
English only spoken at home 1,415 85.9 English only spoken
at home 12,207 91.3
Households where a non-English language
is spoken29 4.6
Households where a non-English language
is spoken167 3.3
Top responses other than English
Malayalam 8 0.5 German 36 0.3
Swedish 3 0.2 Afrikaans 23 0.2
Other Australian Indigenous Language, nec 3 0.2 Italian 23 0.2
Tagalog 20 0.1
French 12 0.1
Cobar Coonamble
No. % No. %
English only spoken at home 3,908 84.5 English only spoken
at home 3,266 83.3
Households where a non-English language
is spoken81 4.2
Households where a non-English language
is spoken38 2.3
Top responses other than English
Afrikaans 20 0.4 Malayalam 8 0.2
Mandarin 15 0.3 German 6 0.2
Italian 14 0.3 Greek 6 0.2
Bengali 11 0.2 Mandarin 6 0.2
Hindi 11 0.2 Gujarati 5 0.1
Table 4. Languages spoken at home in Western NSW, by LGA (continued)

24 Western NSW District Data Profile
Cowra Forbes
No. % No. %
English only spoken at home 11,090 89.0 English only spoken
at home 8,538 89.0
Households where a non-English language
is spoken198 3.8
Households where a non-English language
is spoken114 3.0
Top responses other than English
Italian 1,920 7.5 Mandarin 31 0.3
Punjabi 793 3.1 Punjabi 18 0.2
Samoan 245 1.0 Tagalog 18 0.2
Gujarati 233 0.9 Vietnamese 15 0.1
Mandarin 223 0.9 Filipino 15 0.1
Gilgandra Lachlan
No. % No. %
English only spoken at home 3,813 90.3 English only spoken
at home 5,366 86.9
Households where a non-English language
is spoken53 3.1
Households where a non-English language
is spoken82 3.3
Top responses other than English
Greek 13 0.3 Tagalog 15 0.2
Malayalam 10 0.2 Filipino 14 0.2
Tagalog 9 0.2 Arabic 12 0.2
Wiradjuri 6 0.1 Greek 8 0.1
Spanish 5 0.1 Thai 8 0.1
Table 4. Languages spoken at home in Western NSW, by LGA (continued)
25 Western NSW District Data Profile
Mid-western Regional Narromine
No. % No. %
English only spoken at home 21,047 87.4 English only spoken
at home 5,752 89.4
Households where a non-English language
is spoken420 4.3
Households where a non-English language
is spoken51 2.0
Top responses other than English
German 50 0.2 Cantonese 12 0.2
Spanish 41 0.2 Croatian 8 0.1
Italian 40 0.2 Gujarati 6 0.1
Mandarin 38 0.2 Bengali 5 0.1
Tagalog 33 0.1 Wiradjuri 5 0.1
Oberon Orange
No. % No. %
English only spoken at home 4,462 84.4 English only spoken
at home 35,416 87.8
Households where a non-English language
is spoken109 5.2
Households where a non-English language
is spoken1,162 7.4
Top responses other than English
German 16 0.3 Malayalam 246 0.6
Serbian 13 0.2 Mandarin 138 0.3
Spanish 10 0.2 Italian 130 0.3
Russian 10 0.2 Nepali 110 0.3
Cantonese 9 0.2 Cantonese 90 0.2
Table 4. Languages spoken at home in Western NSW, by LGA (continued)

26 Western NSW District Data Profile
Parkes Walgett
No. % No. %
English only spoken at home 12,931 88.5 English only spoken
at home 5,042 82.8
Households where a non-English language
is spoken222 3.8
Households where a non-English language
is spoken193 6.7
Top responses other than English
Afrikaans 32 0.2 Serbian 59 1.0
Mandarin 32 0.2 German 36 0.6
Cantonese 31 0.2 Croatian 24 0.4
Tagalog 28 0.2 Urdu 22 0.4
Indonesian 27 0.2 Tagalog 15 0.2
Warren Warrumbungle Shire
No. % No. %
English only spoken at home 2,401 88.3 English only spoken
at home 8,178 87.3
Households where a non-English language
is spoken29 2.6
Households where a non-English language
is spoken141 3.5
Top responses other than English
German 9 0.3 German 24 0.3
Afrikaans 5 0.2 Malayalam 13 0.1
French 5 0.2 Greek 12 0.1
Tagalog 4 0.1 Italian 10 0.1
Filipino 4 0.1 French 7 0.1
Table 4. Languages spoken at home in Western NSW, by LGA (continued)

27 Western NSW District Data Profile
Weddin
No. %
English only spoken at home 3,273 87.8
Households where a non-English language
is spoken40 7.6
Top responses other than English
Cantonese 11 0.3
Tagalog 5 0.1
Filipino 5 0.1
French 3 0.1
Greek 3 0.1
Source: ABS Quickstats, 2016 Census: https://www.abs.gov.au/websitedbs/D3310114.nsf/Home/2016%20QuickStats (accessed 10 October 2019)
Table 4. Languages spoken at home in Western NSW, by LGA (continued)
Western Plains Regional
No. %
English only spoken at home 43,242 86.4
Households where a non-English language
is spoken1,137 6.0
Top responses other than English
Nepali 209 0.4
Mandarin 164 0.3
Malayalam 122 0.2
Tagalog 120 0.2
Sinhalese 103 0.2
28 Western NSW District Data Profile
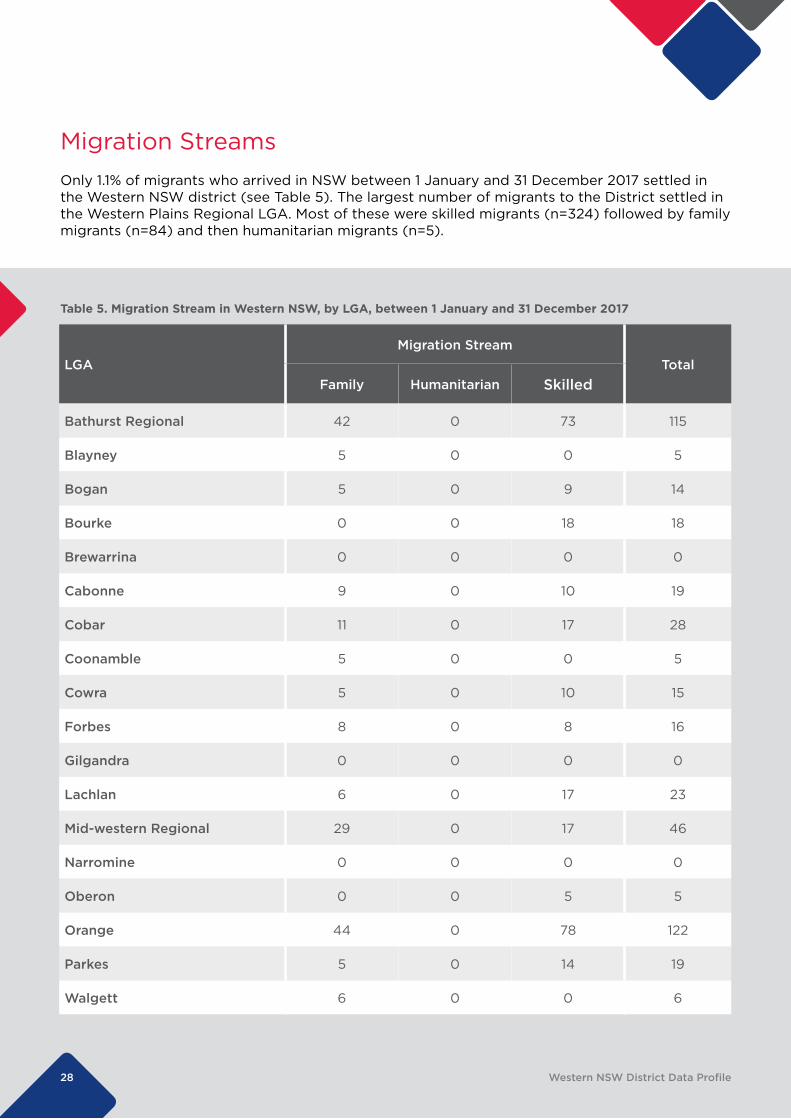
Table 5. Migration Stream in Western NSW, by LGA, between 1 January and 31 December 2017
LGAMigration Stream
TotalFamily Humanitarian Skilled
Bathurst Regional 42 0 73 115
Blayney 5 0 0 5
Bogan 5 0 9 14
Bourke 0 0 18 18
Brewarrina 0 0 0 0
Cabonne 9 0 10 19
Cobar 11 0 17 28
Coonamble 5 0 0 5
Cowra 5 0 10 15
Forbes 8 0 8 16
Gilgandra 0 0 0 0
Lachlan 6 0 17 23
Mid-western Regional 29 0 17 46
Narromine 0 0 0 0
Oberon 0 0 5 5
Orange 44 0 78 122
Parkes 5 0 14 19
Walgett 6 0 0 6
Migration StreamsOnly 1.1% of migrants who arrived in NSW between 1 January and 31 December 2017 settled in the Western NSW district (see Table 5). The largest number of migrants to the District settled in the Western Plains Regional LGA. Most of these were skilled migrants (n=324) followed by family migrants (n=84) and then humanitarian migrants (n=5).
29 Western NSW District Data Profile
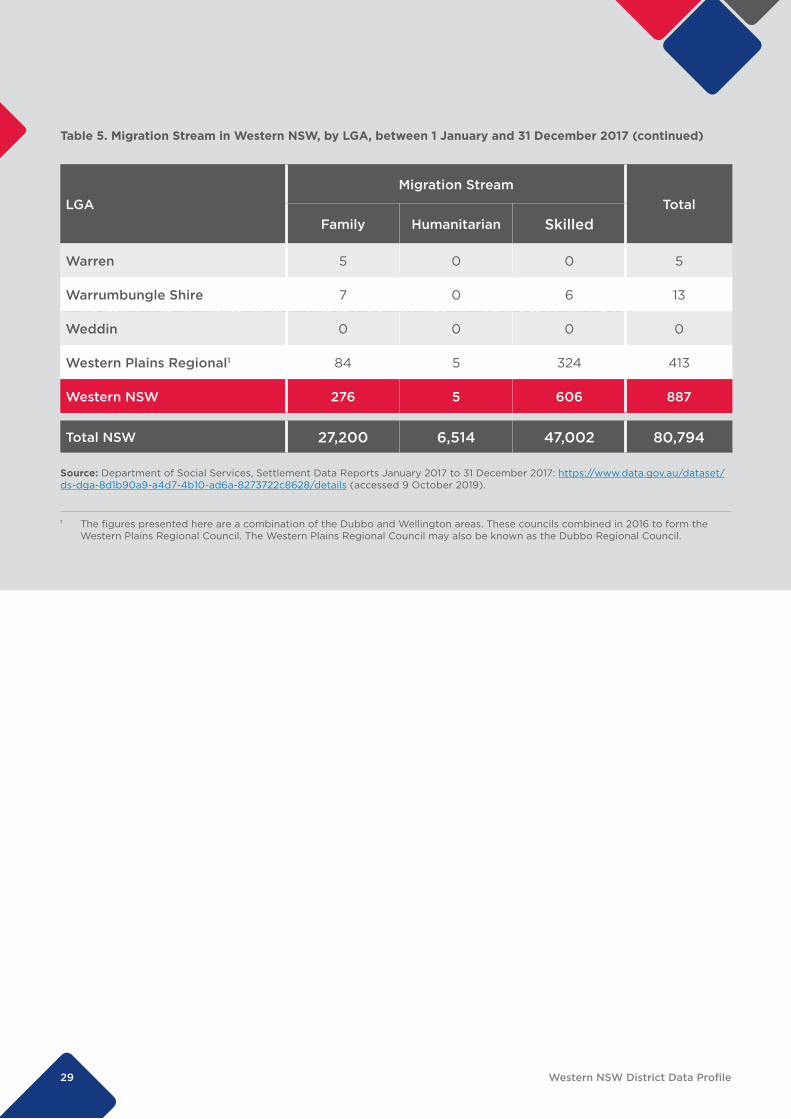
Table 5. Migration Stream in Murrumbidgee, by LGA, between 1 January and 31 December 2017
LGAMigration Stream
TotalFamily Humanitarian Skilled
Warren 5 0 0 5
Warrumbungle Shire 7 0 6 13
Weddin 0 0 0 0
Western Plains Regional1 84 5 324 413
Western NSW 276 5 606 887
Total NSW 27,200 6,514 47,002 80,794
1 The figures presented here are a combination of the Dubbo and Wellington areas. These councils combined in 2016 to form the Western Plains Regional Council. The Western Plains Regional Council may also be known as the Dubbo Regional Council.
Table 5. Migration Stream in Western NSW, by LGA, between 1 January and 31 December 2017 (continued)
Source: Department of Social Services, Settlement Data Reports January 2017 to 31 December 2017: https://www.data.gov.au/dataset/ds-dga-8d1b90a9-a4d7-4b10-ad6a-8273722c8628/details (accessed 9 October 2019).
30 Western NSW District Data Profile
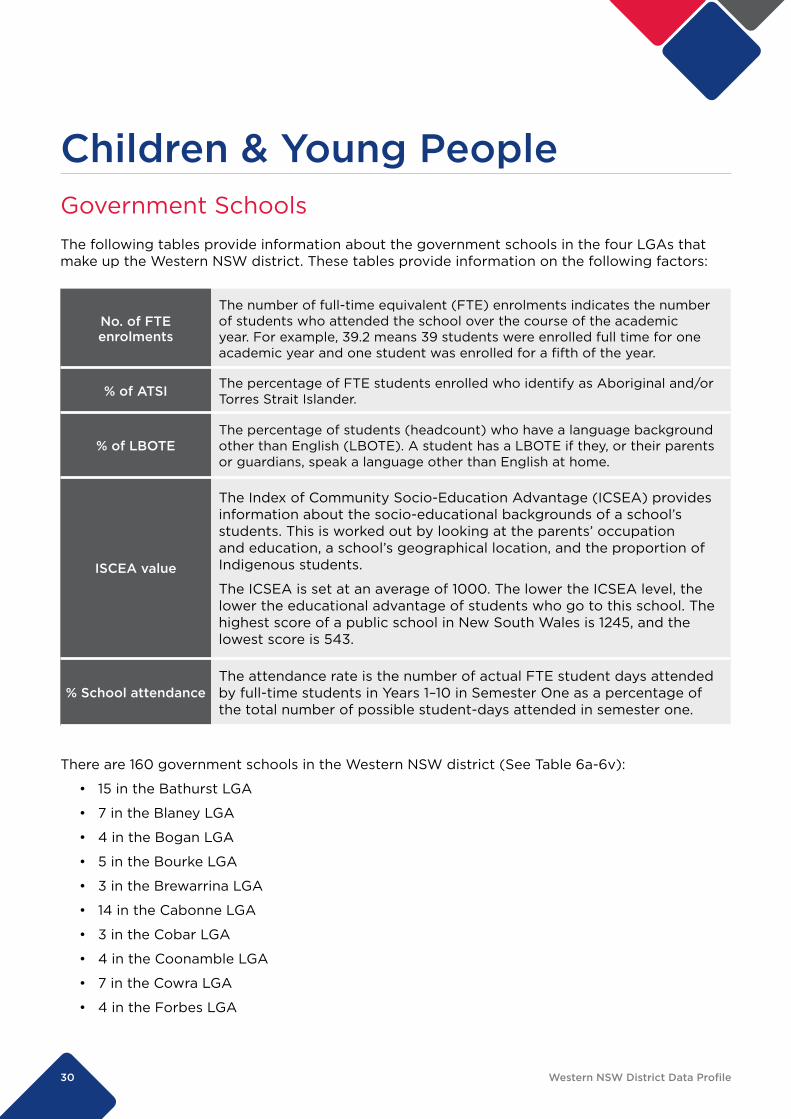
No. of FTE enrolments
The number of full-time equivalent (FTE) enrolments indicates the number of students who attended the school over the course of the academic year. For example, 39.2 means 39 students were enrolled full time for one academic year and one student was enrolled for a fifth of the year.
% of ATSI The percentage of FTE students enrolled who identify as Aboriginal and/or Torres Strait Islander.
% of LBOTEThe percentage of students (headcount) who have a language background other than English (LBOTE). A student has a LBOTE if they, or their parents or guardians, speak a language other than English at home.
ISCEA value
The Index of Community Socio-Education Advantage (ICSEA) provides information about the socio-educational backgrounds of a school’s students. This is worked out by looking at the parents’ occupation and education, a school’s geographical location, and the proportion of Indigenous students.
The ICSEA is set at an average of 1000. The lower the ICSEA level, the lower the educational advantage of students who go to this school. The highest score of a public school in New South Wales is 1245, and the lowest score is 543.
% School attendanceThe attendance rate is the number of actual FTE student days attended by full-time students in Years 1–10 in Semester One as a percentage of the total number of possible student-days attended in semester one.
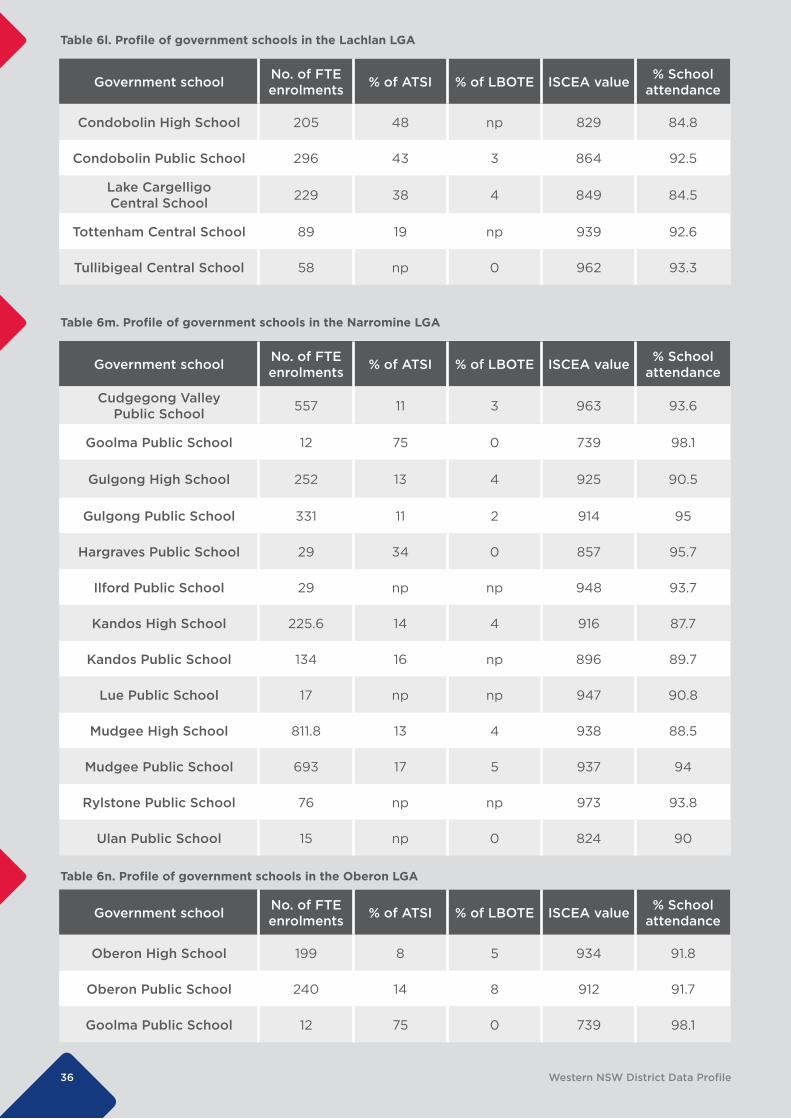
Children & Young PeopleGovernment SchoolsThe following tables provide information about the government schools in the four LGAs that make up the Western NSW district. These tables provide information on the following factors:
There are 160 government schools in the Western NSW district (See Table 6a-6v):
• 15 in the Bathurst LGA
• 7 in the Blaney LGA
• 4 in the Bogan LGA
• 5 in the Bourke LGA
• 3 in the Brewarrina LGA
• 14 in the Cabonne LGA
• 3 in the Cobar LGA
• 4 in the Coonamble LGA
• 7 in the Cowra LGA
• 4 in the Forbes LGA
31 Western NSW District Data Profile
• 3 in the Gilgandra LGA
• 5 in the Lachlan LGA
• 13 in the Mid-Western Region LGA
• 3 in the Narromine LGA
• 3 in the Oberon LGA
• 10 the Orange LGA
• 8 in the Parkes LGA
• 7 in the Walgett LGA
• 7 in the Warrumbungle LGA
• 10 in the Griffith LGA
• 2 in the Warren LGA
• 18 in the Dubbo LGA
• 5 in the Weddin LGA
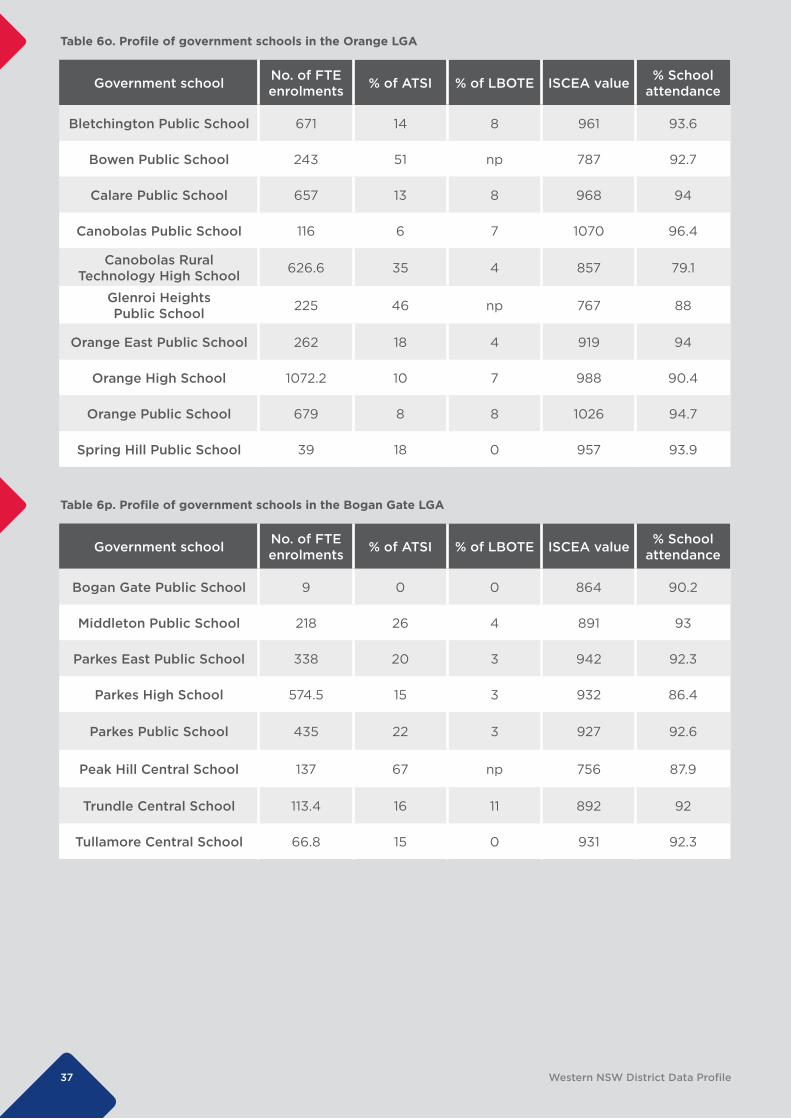
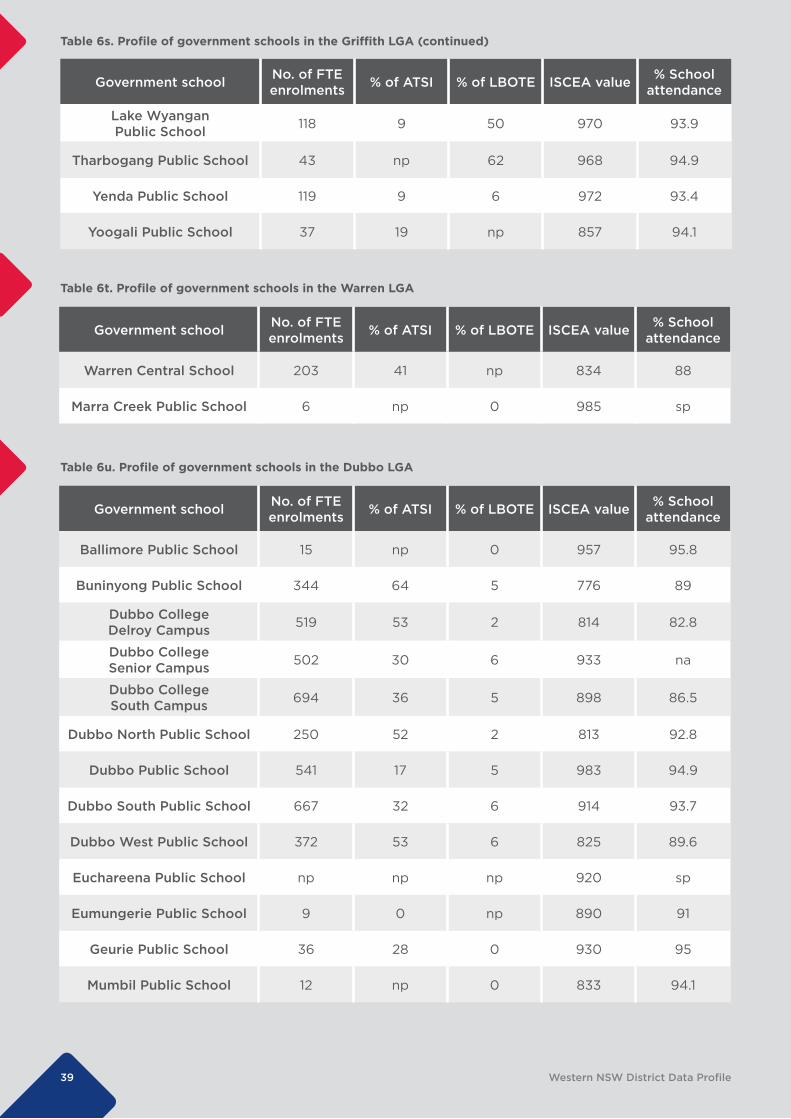
The largest school in the Western NSW district is Denison College of Secondary College Education, Bathurst High Campus in the Bathurst LGA (1072.5 FTE enrolments) followed by Orange High School in the Orange LGA (1072.2 FTE enrolments). The smallest is Sofala Public School in the Bathurst LGA (7 FTE enrolments).
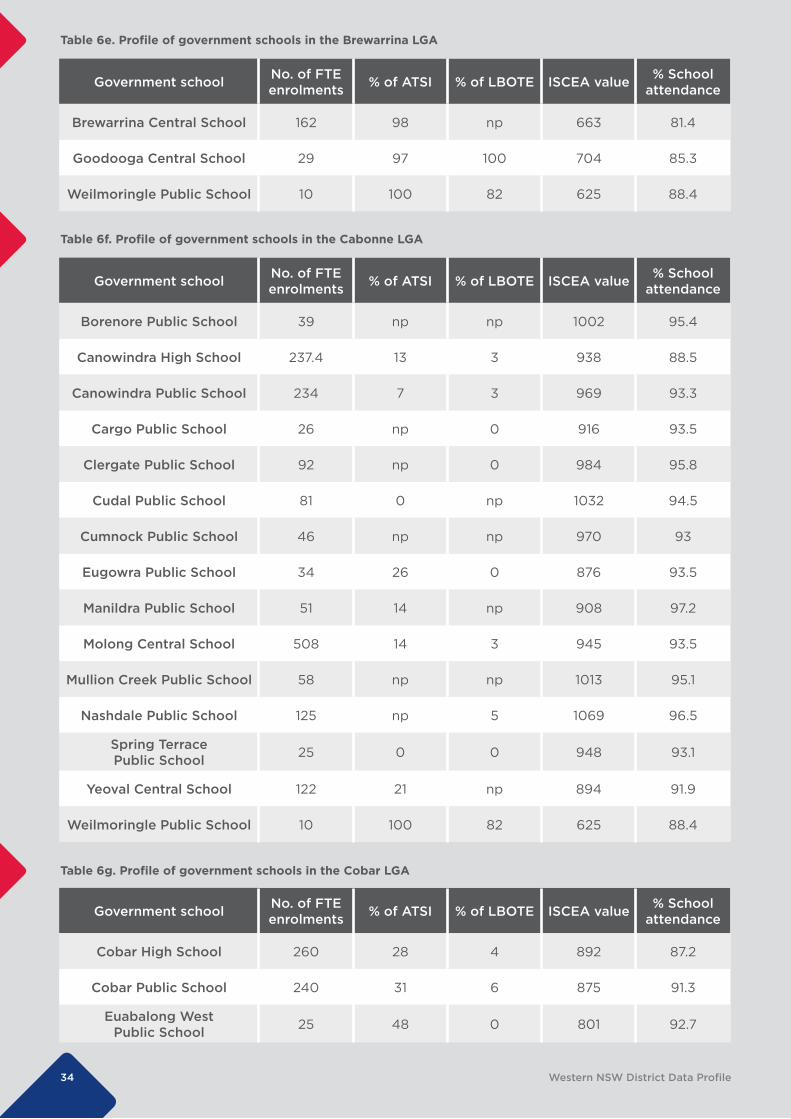
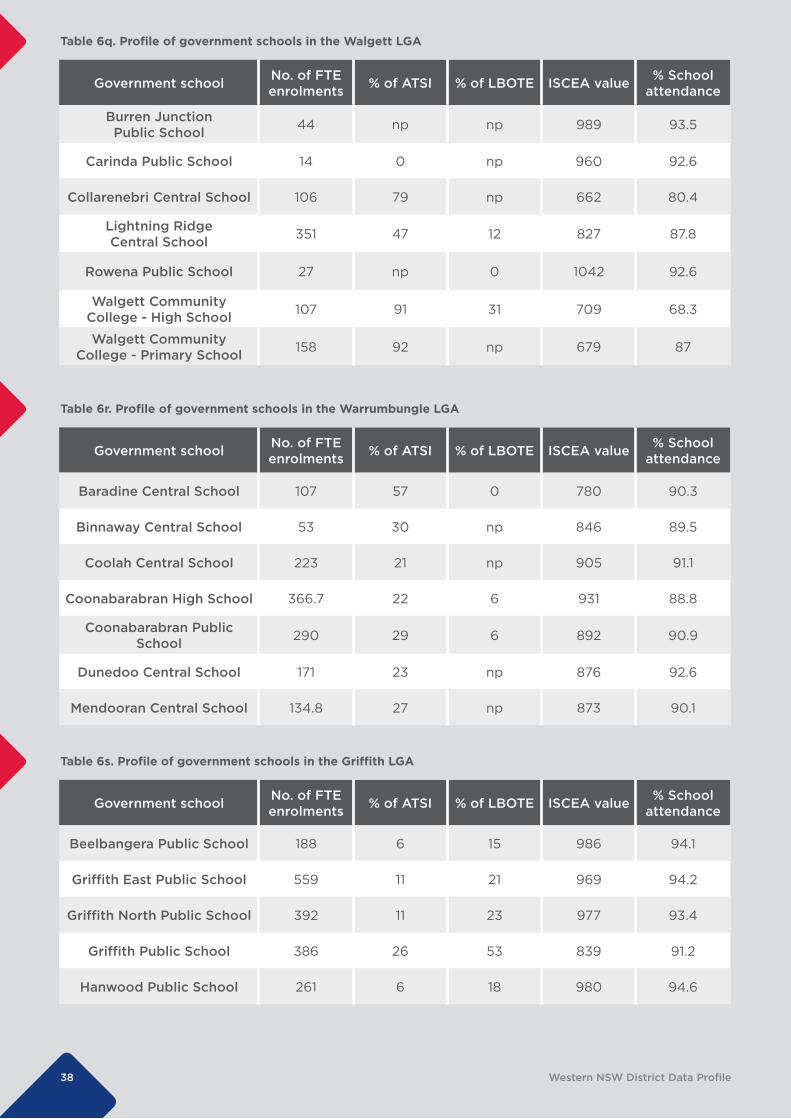
The schools with the largest proportions of Aboriginal and Torres Strait Islander students are Weilmoringle Public School (100%) followed by Brewarrina Central School (98%). Weilmoringle Public School also has the lowest ISCEA score (625) followed by Collarenebri (662) and Brewarrina Central School (663). The school government with highest ISCEA value is Canobolas Public School in Orange (1070).
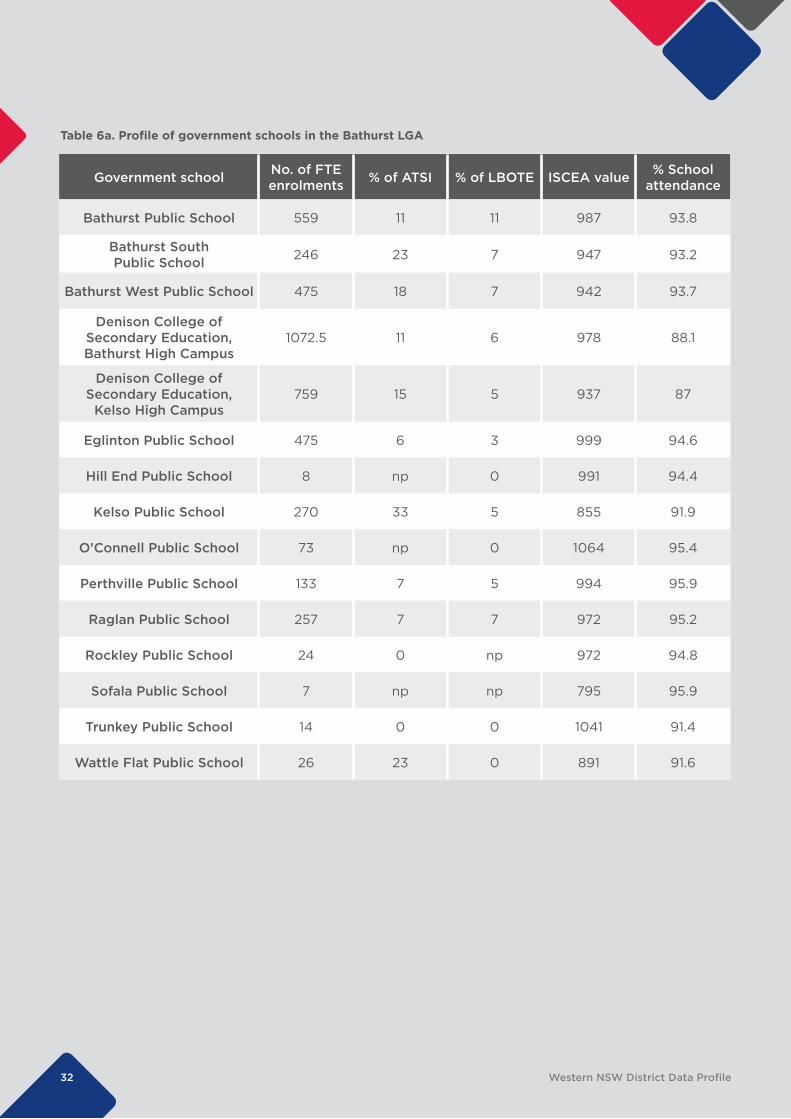
32 Western NSW District Data Profile
Table 6a. Profile of government schools in the Bathurst LGA
Government school No. of FTE enrolments % of ATSI % of LBOTE ISCEA value % School
attendance
Bathurst Public School 559 11 11 987 93.8
Bathurst South Public School 246 23 7 947 93.2
Bathurst West Public School 475 18 7 942 93.7
Denison College of Secondary Education, Bathurst High Campus
1072.5 11 6 978 88.1
Denison College of Secondary Education,
Kelso High Campus759 15 5 937 87
Eglinton Public School 475 6 3 999 94.6
Hill End Public School 8 np 0 991 94.4
Kelso Public School 270 33 5 855 91.9
O'Connell Public School 73 np 0 1064 95.4
Perthville Public School 133 7 5 994 95.9
Raglan Public School 257 7 7 972 95.2
Rockley Public School 24 0 np 972 94.8
Sofala Public School 7 np np 795 95.9
Trunkey Public School 14 0 0 1041 91.4
Wattle Flat Public School 26 23 0 891 91.6
33 Western NSW District Data Profile
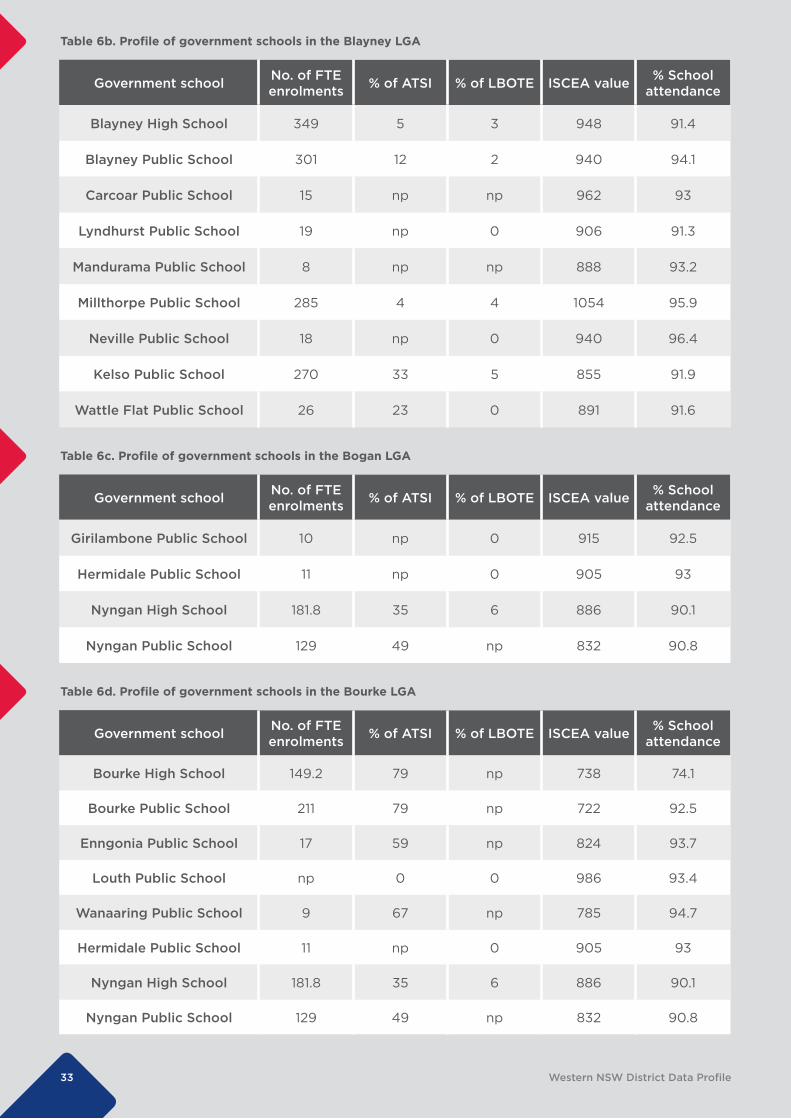
Table 6b. Profile of government schools in the Blayney LGA
Government school No. of FTE enrolments % of ATSI % of LBOTE ISCEA value % School
attendance
Blayney High School 349 5 3 948 91.4
Blayney Public School 301 12 2 940 94.1
Carcoar Public School 15 np np 962 93
Lyndhurst Public School 19 np 0 906 91.3
Mandurama Public School 8 np np 888 93.2
Millthorpe Public School 285 4 4 1054 95.9
Neville Public School 18 np 0 940 96.4
Kelso Public School 270 33 5 855 91.9
Wattle Flat Public School 26 23 0 891 91.6
Table 6c. Profile of government schools in the Bogan LGA
Government school No. of FTE enrolments % of ATSI % of LBOTE ISCEA value % School
attendance
Girilambone Public School 10 np 0 915 92.5
Hermidale Public School 11 np 0 905 93
Nyngan High School 181.8 35 6 886 90.1
Nyngan Public School 129 49 np 832 90.8
Table 6d. Profile of government schools in the Bourke LGA
Government school No. of FTE enrolments % of ATSI % of LBOTE ISCEA value % School
attendance
Bourke High School 149.2 79 np 738 74.1
Bourke Public School 211 79 np 722 92.5
Enngonia Public School 17 59 np 824 93.7
Louth Public School np 0 0 986 93.4
Wanaaring Public School 9 67 np 785 94.7
Hermidale Public School 11 np 0 905 93
Nyngan High School 181.8 35 6 886 90.1
Nyngan Public School 129 49 np 832 90.8
34 Western NSW District Data Profile
Table 6e. Profile of government schools in the Brewarrina LGA
Government school No. of FTE enrolments % of ATSI % of LBOTE ISCEA value % School
attendance
Brewarrina Central School 162 98 np 663 81.4
Goodooga Central School 29 97 100 704 85.3
Weilmoringle Public School 10 100 82 625 88.4
Table 6f. Profile of government schools in the Cabonne LGA
Government school No. of FTE enrolments % of ATSI % of LBOTE ISCEA value % School
attendance
Borenore Public School 39 np np 1002 95.4
Canowindra High School 237.4 13 3 938 88.5
Canowindra Public School 234 7 3 969 93.3
Cargo Public School 26 np 0 916 93.5
Clergate Public School 92 np 0 984 95.8
Cudal Public School 81 0 np 1032 94.5
Cumnock Public School 46 np np 970 93
Eugowra Public School 34 26 0 876 93.5
Manildra Public School 51 14 np 908 97.2
Molong Central School 508 14 3 945 93.5
Mullion Creek Public School 58 np np 1013 95.1
Nashdale Public School 125 np 5 1069 96.5
Spring Terrace Public School 25 0 0 948 93.1
Yeoval Central School 122 21 np 894 91.9
Weilmoringle Public School 10 100 82 625 88.4
Table 6g. Profile of government schools in the Cobar LGA
Government school No. of FTE enrolments % of ATSI % of LBOTE ISCEA value % School
attendance
Cobar High School 260 28 4 892 87.2
Cobar Public School 240 31 6 875 91.3
Euabalong West Public School 25 48 0 801 92.7
35 Western NSW District Data Profile
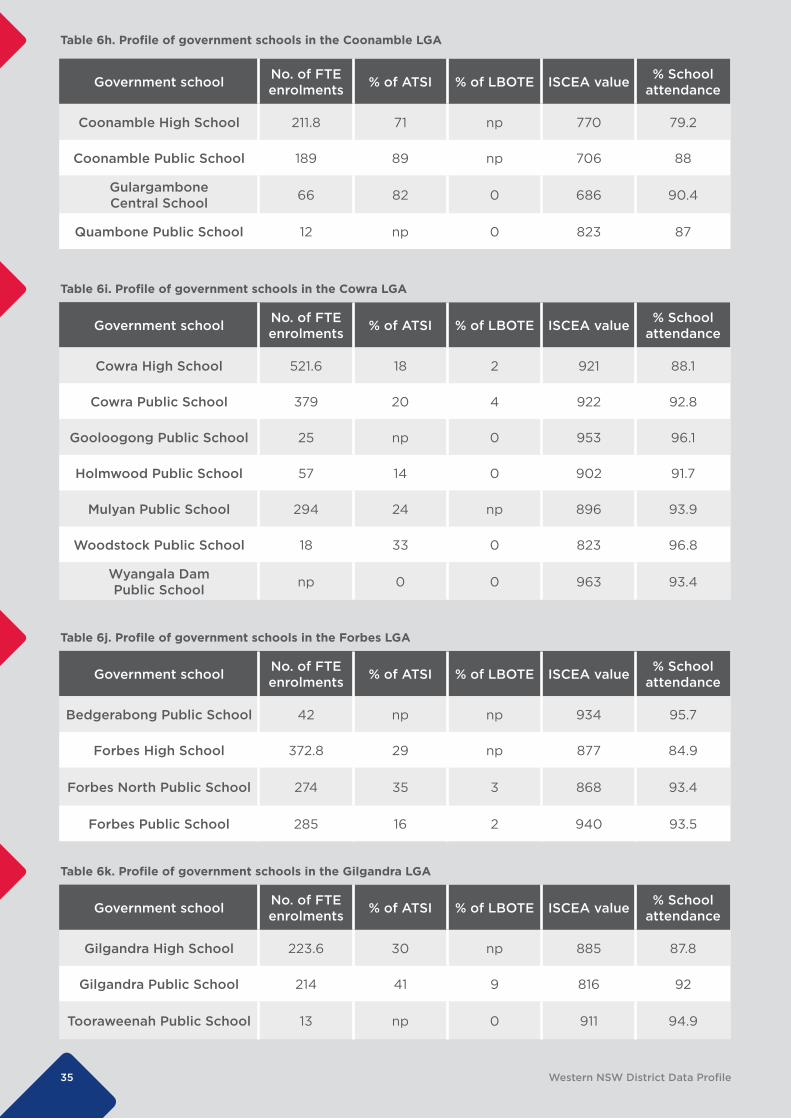
Table 6h. Profile of government schools in the Coonamble LGA
Government school No. of FTE enrolments % of ATSI % of LBOTE ISCEA value % School
attendance
Coonamble High School 211.8 71 np 770 79.2
Coonamble Public School 189 89 np 706 88
Gulargambone Central School 66 82 0 686 90.4
Quambone Public School 12 np 0 823 87
Table 6i. Profile of government schools in the Cowra LGA
Government school No. of FTE enrolments % of ATSI % of LBOTE ISCEA value % School
attendance
Cowra High School 521.6 18 2 921 88.1
Cowra Public School 379 20 4 922 92.8
Gooloogong Public School 25 np 0 953 96.1
Holmwood Public School 57 14 0 902 91.7
Mulyan Public School 294 24 np 896 93.9
Woodstock Public School 18 33 0 823 96.8
Wyangala Dam Public School np 0 0 963 93.4
Table 6j. Profile of government schools in the Forbes LGA
Government school No. of FTE enrolments % of ATSI % of LBOTE ISCEA value % School
attendance
Bedgerabong Public School 42 np np 934 95.7
Forbes High School 372.8 29 np 877 84.9
Forbes North Public School 274 35 3 868 93.4
Forbes Public School 285 16 2 940 93.5
Table 6k. Profile of government schools in the Gilgandra LGA
Government school No. of FTE enrolments % of ATSI % of LBOTE ISCEA value % School
attendance
Gilgandra High School 223.6 30 np 885 87.8
Gilgandra Public School 214 41 9 816 92
Tooraweenah Public School 13 np 0 911 94.9
36 Western NSW District Data Profile
Table 6l. Profile of government schools in the Lachlan LGA
Government school No. of FTE enrolments % of ATSI % of LBOTE ISCEA value % School
attendance
Condobolin High School 205 48 np 829 84.8
Condobolin Public School 296 43 3 864 92.5
Lake Cargelligo Central School 229 38 4 849 84.5
Tottenham Central School 89 19 np 939 92.6
Tullibigeal Central School 58 np 0 962 93.3
Table 6m. Profile of government schools in the Narromine LGA
Government school No. of FTE enrolments % of ATSI % of LBOTE ISCEA value % School
attendance
Cudgegong Valley Public School 557 11 3 963 93.6
Goolma Public School 12 75 0 739 98.1
Gulgong High School 252 13 4 925 90.5
Gulgong Public School 331 11 2 914 95
Hargraves Public School 29 34 0 857 95.7
Ilford Public School 29 np np 948 93.7
Kandos High School 225.6 14 4 916 87.7
Kandos Public School 134 16 np 896 89.7
Lue Public School 17 np np 947 90.8
Mudgee High School 811.8 13 4 938 88.5
Mudgee Public School 693 17 5 937 94
Rylstone Public School 76 np np 973 93.8
Ulan Public School 15 np 0 824 90
Table 6n. Profile of government schools in the Oberon LGA
Government school No. of FTE enrolments % of ATSI % of LBOTE ISCEA value % School
attendance
Oberon High School 199 8 5 934 91.8
Oberon Public School 240 14 8 912 91.7
Goolma Public School 12 75 0 739 98.1
37 Western NSW District Data Profile
Table 6o. Profile of government schools in the Orange LGA
Government school No. of FTE enrolments % of ATSI % of LBOTE ISCEA value % School
attendance
Bletchington Public School 671 14 8 961 93.6
Bowen Public School 243 51 np 787 92.7
Calare Public School 657 13 8 968 94
Canobolas Public School 116 6 7 1070 96.4
Canobolas Rural Technology High School 626.6 35 4 857 79.1
Glenroi Heights Public School 225 46 np 767 88
Orange East Public School 262 18 4 919 94
Orange High School 1072.2 10 7 988 90.4
Orange Public School 679 8 8 1026 94.7
Spring Hill Public School 39 18 0 957 93.9
Table 6p. Profile of government schools in the Bogan Gate LGA
Government school No. of FTE enrolments % of ATSI % of LBOTE ISCEA value % School
attendance
Bogan Gate Public School 9 0 0 864 90.2
Middleton Public School 218 26 4 891 93
Parkes East Public School 338 20 3 942 92.3
Parkes High School 574.5 15 3 932 86.4
Parkes Public School 435 22 3 927 92.6
Peak Hill Central School 137 67 np 756 87.9
Trundle Central School 113.4 16 11 892 92
Tullamore Central School 66.8 15 0 931 92.3
38 Western NSW District Data Profile
Table 6q. Profile of government schools in the Walgett LGA
Government school No. of FTE enrolments % of ATSI % of LBOTE ISCEA value % School
attendance
Burren Junction Public School 44 np np 989 93.5
Carinda Public School 14 0 np 960 92.6
Collarenebri Central School 106 79 np 662 80.4
Lightning Ridge Central School 351 47 12 827 87.8
Rowena Public School 27 np 0 1042 92.6
Walgett Community College - High School 107 91 31 709 68.3
Walgett Community College - Primary School 158 92 np 679 87
Table 6r. Profile of government schools in the Warrumbungle LGA
Government school No. of FTE enrolments % of ATSI % of LBOTE ISCEA value % School
attendance
Baradine Central School 107 57 0 780 90.3
Binnaway Central School 53 30 np 846 89.5
Coolah Central School 223 21 np 905 91.1
Coonabarabran High School 366.7 22 6 931 88.8
Coonabarabran Public School 290 29 6 892 90.9
Dunedoo Central School 171 23 np 876 92.6
Mendooran Central School 134.8 27 np 873 90.1
Table 6s. Profile of government schools in the Griffith LGA
Government school No. of FTE enrolments % of ATSI % of LBOTE ISCEA value % School
attendance
Beelbangera Public School 188 6 15 986 94.1
Griffith East Public School 559 11 21 969 94.2
Griffith North Public School 392 11 23 977 93.4
Griffith Public School 386 26 53 839 91.2
Hanwood Public School 261 6 18 980 94.6
39 Western NSW District Data Profile
Table 6s. Profile of government schools in the Griffith LGA (continued)
Table 6t. Profile of government schools in the Warren LGA
Government school No. of FTE enrolments % of ATSI % of LBOTE ISCEA value % School
attendance
Warren Central School 203 41 np 834 88
Marra Creek Public School 6 np 0 985 sp
Government school No. of FTE enrolments % of ATSI % of LBOTE ISCEA value % School
attendance
Lake Wyangan Public School 118 9 50 970 93.9
Tharbogang Public School 43 np 62 968 94.9
Yenda Public School 119 9 6 972 93.4
Yoogali Public School 37 19 np 857 94.1
Table 6u. Profile of government schools in the Dubbo LGA
Government school No. of FTE enrolments % of ATSI % of LBOTE ISCEA value % School
attendance
Ballimore Public School 15 np 0 957 95.8
Buninyong Public School 344 64 5 776 89
Dubbo College Delroy Campus 519 53 2 814 82.8
Dubbo College Senior Campus 502 30 6 933 na
Dubbo College South Campus 694 36 5 898 86.5
Dubbo North Public School 250 52 2 813 92.8
Dubbo Public School 541 17 5 983 94.9
Dubbo South Public School 667 32 6 914 93.7
Dubbo West Public School 372 53 6 825 89.6
Euchareena Public School np np np 920 sp
Eumungerie Public School 9 0 np 890 91
Geurie Public School 36 28 0 930 95
Mumbil Public School 12 np 0 833 94.1
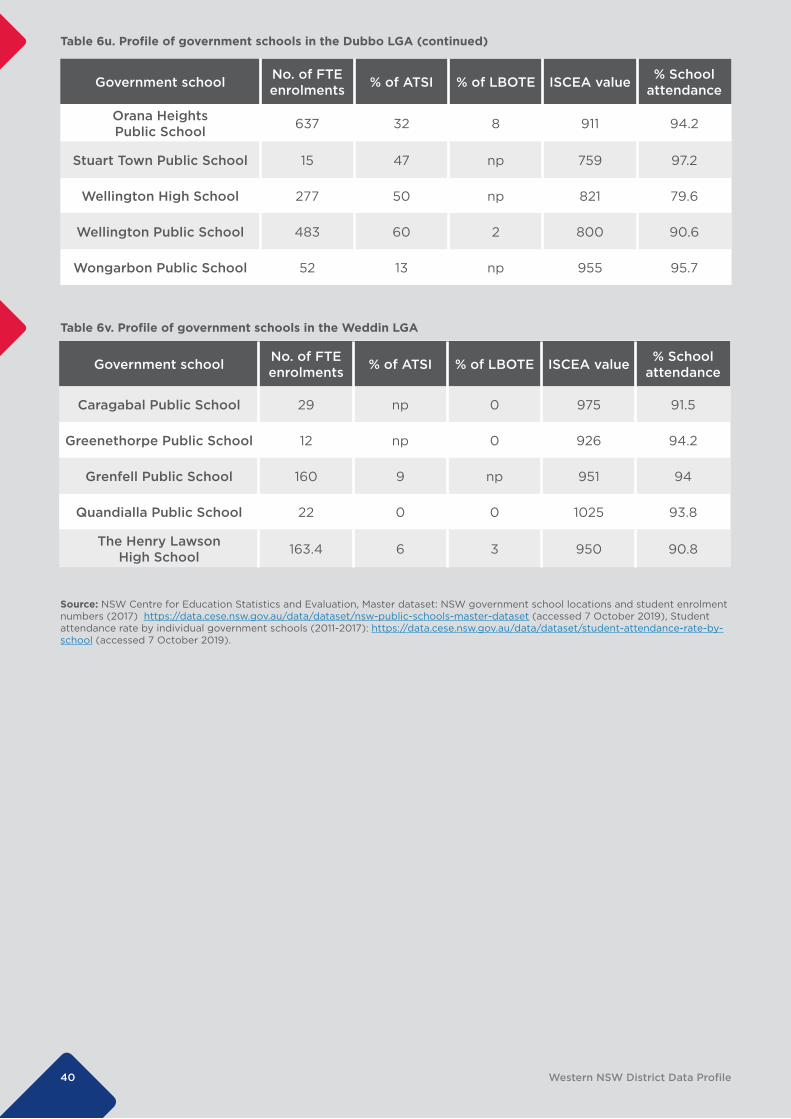
40 Western NSW District Data Profile
Table 6u. Profile of government schools in the Dubbo LGA (continued)
Table 6v. Profile of government schools in the Weddin LGA
Government school No. of FTE enrolments % of ATSI % of LBOTE ISCEA value % School
attendance
Caragabal Public School 29 np 0 975 91.5
Greenethorpe Public School 12 np 0 926 94.2
Grenfell Public School 160 9 np 951 94
Quandialla Public School 22 0 0 1025 93.8
The Henry Lawson High School 163.4 6 3 950 90.8
Source: NSW Centre for Education Statistics and Evaluation, Master dataset: NSW government school locations and student enrolment numbers (2017) https://data.cese.nsw.gov.au/data/dataset/nsw-public-schools-master-dataset (accessed 7 October 2019), Student attendance rate by individual government schools (2011-2017): https://data.cese.nsw.gov.au/data/dataset/student-attendance-rate-by-school (accessed 7 October 2019).
Government school No. of FTE enrolments % of ATSI % of LBOTE ISCEA value % School
attendance
Orana Heights Public School 637 32 8 911 94.2
Stuart Town Public School 15 47 np 759 97.2
Wellington High School 277 50 np 821 79.6
Wellington Public School 483 60 2 800 90.6
Wongarbon Public School 52 13 np 955 95.7
41 Western NSW District Data Profile
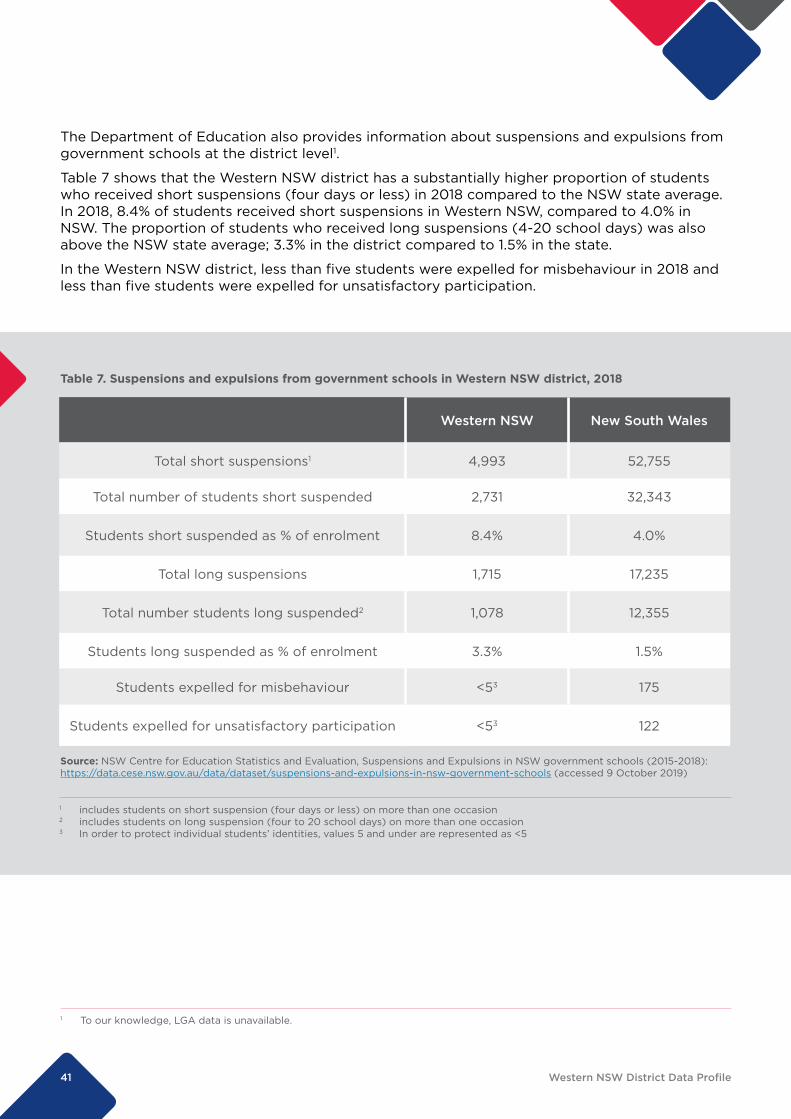
Table 7. Suspensions and expulsions from government schools in Western NSW district, 2018
Western NSW New South Wales
Total short suspensions1 4,993 52,755
Total number of students short suspended 2,731 32,343
Students short suspended as % of enrolment 8.4% 4.0%
Total long suspensions 1,715 17,235
Total number students long suspended2 1,078 12,355
Students long suspended as % of enrolment 3.3% 1.5%
Students expelled for misbehaviour <53 175
Students expelled for unsatisfactory participation <53 122
1 includes students on short suspension (four days or less) on more than one occasion 2 includes students on long suspension (four to 20 school days) on more than one occasion 3 In order to protect individual students’ identities, values 5 and under are represented as <5
Source: NSW Centre for Education Statistics and Evaluation, Suspensions and Expulsions in NSW government schools (2015-2018): https://data.cese.nsw.gov.au/data/dataset/suspensions-and-expulsions-in-nsw-government-schools (accessed 9 October 2019)
The Department of Education also provides information about suspensions and expulsions from government schools at the district level1.
Table 7 shows that the Western NSW district has a substantially higher proportion of students who received short suspensions (four days or less) in 2018 compared to the NSW state average. In 2018, 8.4% of students received short suspensions in Western NSW, compared to 4.0% in NSW. The proportion of students who received long suspensions (4-20 school days) was also above the NSW state average; 3.3% in the district compared to 1.5% in the state.
In the Western NSW district, less than five students were expelled for misbehaviour in 2018 and less than five students were expelled for unsatisfactory participation.
1 To our knowledge, LGA data is unavailable.
MORE INFORMATION
More information about the AEDC domains can be found in the About the AEDC Domains fact sheet.
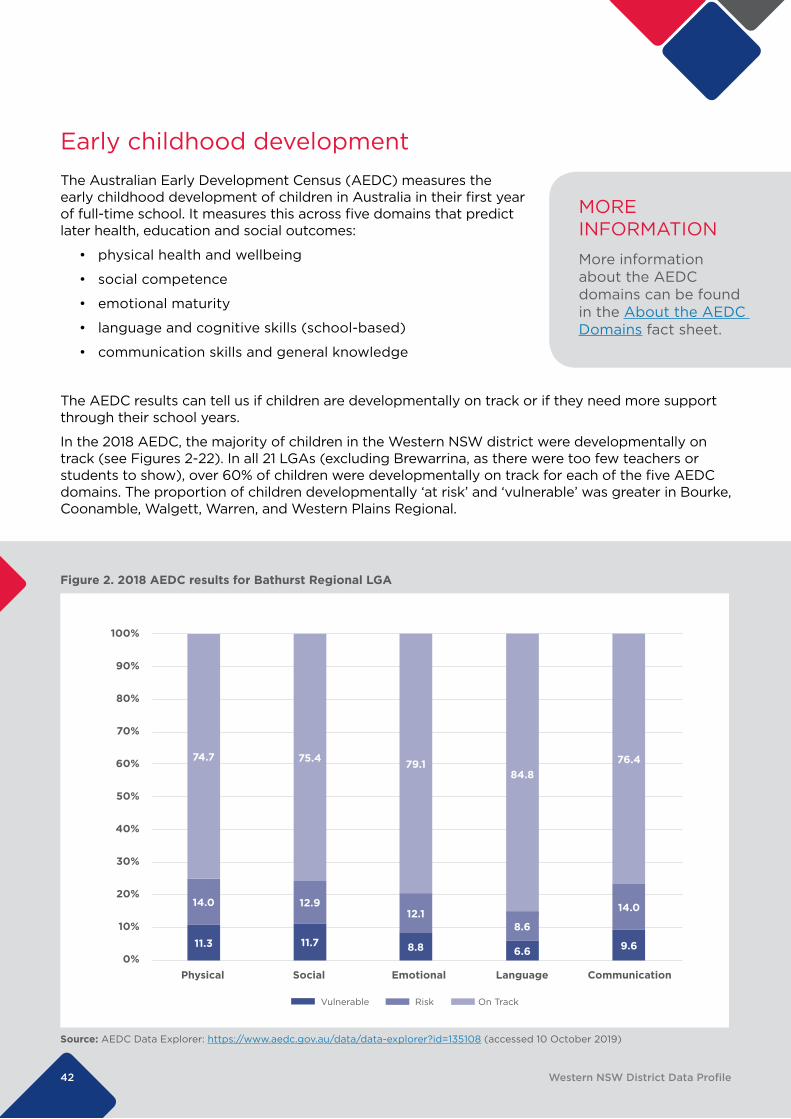
Figure 2. 2018 AEDC results for Bathurst Regional LGA
100%
90%
80%
70%
60%
50%
40%
30%
20%
10%
0%Physical Social Emotional Language Communication
11.3
74.7
Vulnerable Risk On Track
14.0
11.7
12.9
75.4
8.8
12.1
79.1
6.6
8.6
84.8
9.6
14.0
76.4
Source: AEDC Data Explorer: https://www.aedc.gov.au/data/data-explorer?id=135108 (accessed 10 October 2019)
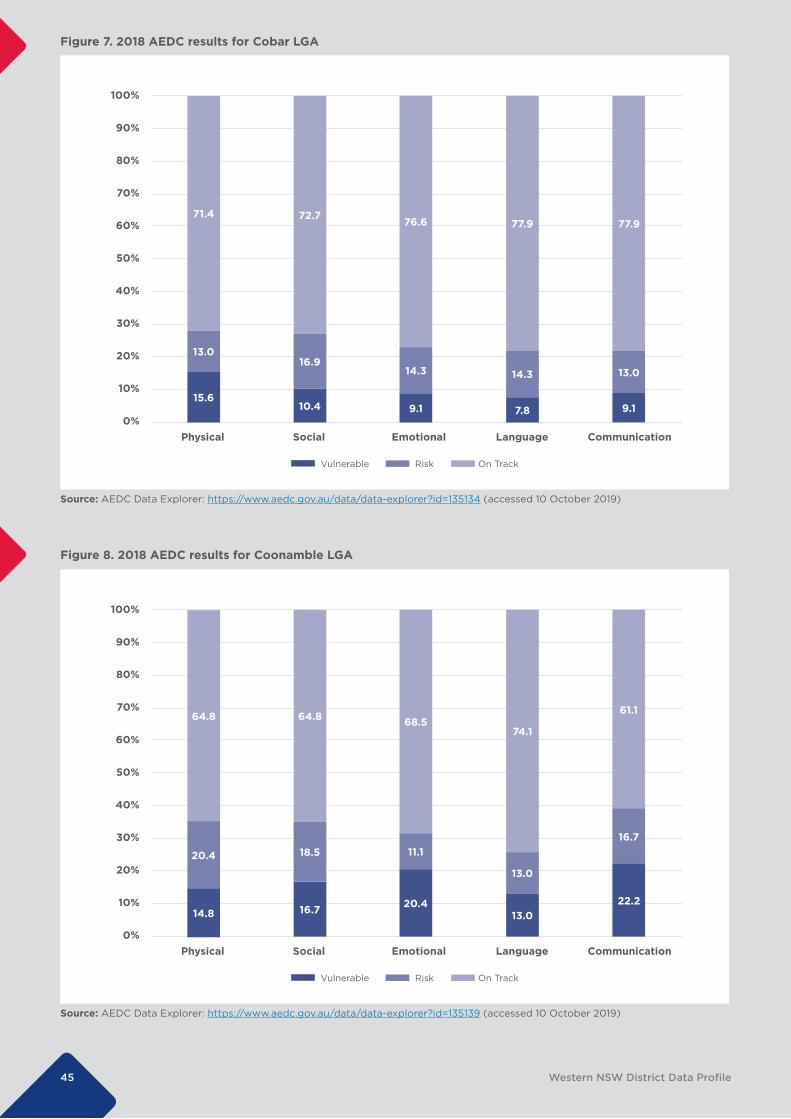
Early childhood developmentThe Australian Early Development Census (AEDC) measures the early childhood development of children in Australia in their first year of full-time school. It measures this across five domains that predict later health, education and social outcomes:
• physical health and wellbeing
• social competence
• emotional maturity
• language and cognitive skills (school-based)
• communication skills and general knowledge
The AEDC results can tell us if children are developmentally on track or if they need more support through their school years.
In the 2018 AEDC, the majority of children in the Western NSW district were developmentally on track (see Figures 2-22). In all 21 LGAs (excluding Brewarrina, as there were too few teachers or students to show), over 60% of children were developmentally on track for each of the five AEDC domains. The proportion of children developmentally ‘at risk’ and ‘vulnerable’ was greater in Bourke, Coonamble, Walgett, Warren, and Western Plains Regional.
42 Western NSW District Data Profile
43 Western NSW District Data Profile
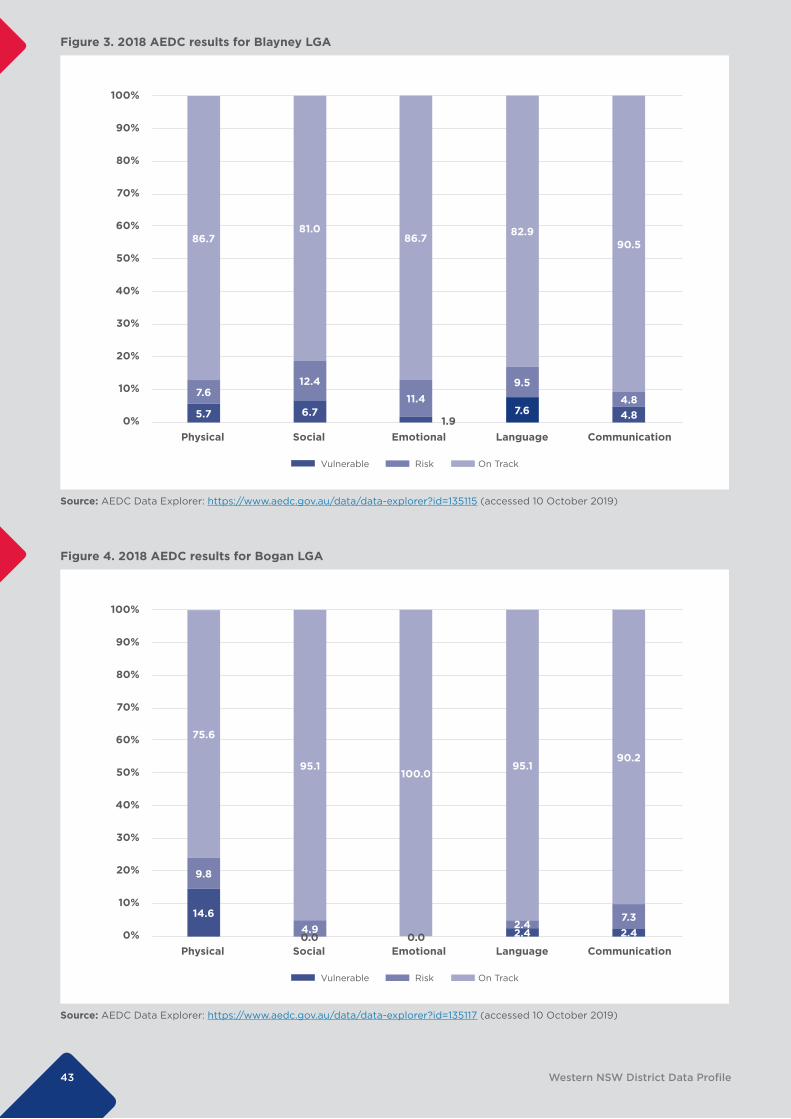
Figure 3. 2018 AEDC results for Blayney LGA
90.582.986.7
100%
90%
80%
70%
60%
50%
40%
30%
20%
10%
0%Physical Social Emotional Language Communication
86.7
Vulnerable Risk On Track
7.6
6.7
12.4
81.0
11.49.5
4.85.7
1.9 4.87.6
Source: AEDC Data Explorer: https://www.aedc.gov.au/data/data-explorer?id=135115 (accessed 10 October 2019)
Figure 4. 2018 AEDC results for Bogan LGA
90.295.1
100.0
100%
90%
80%
70%
60%
50%
40%
30%
20%
10%
0%Physical Social Emotional Language Communication
75.6
Vulnerable Risk On Track
4.9
95.1
7.314.6
2.42.4
2.4
9.8
0.0 0.0
Source: AEDC Data Explorer: https://www.aedc.gov.au/data/data-explorer?id=135117 (accessed 10 October 2019)

44 Western NSW District Data Profile
Figure 5. 2018 AEDC results for Bourke LGA
83.3
66.766.7
100%
90%
80%
70%
60%
50%
40%
30%
20%
10%
0%Physical Social Emotional Language Communication
75.0
Vulnerable Risk On Track
12.5
4.2
33.3
62.5
12.516.7
8.3
12.520.8
16.78.3
Source: AEDC Data Explorer: https://www.aedc.gov.au/data/data-explorer?id=135121 (accessed 10 October 2019)
Figure 6. 2018 AEDC results for Cabonne LGA
87.191.4
86.0
100%
90%
80%
70%
60%
50%
40%
30%
20%
10%
0%Physical Social Emotional Language Communication
84.4
Vulnerable Risk On Track
4.8
10.2
84.9
9.7 9.18.1 4.3 4.3
4.33.8
7.5
Source: AEDC Data Explorer: https://www.aedc.gov.au/data/data-explorer?id=135125 (accessed 10 October 2019)
45 Western NSW District Data Profile
77.977.976.6
100%
90%
80%
70%
60%
50%
40%
30%
20%
10%
0%Physical Social Emotional Language Communication
71.4
Vulnerable Risk On Track
13.0
10.4
16.9
72.7
14.3 14.3 13.0
15.69.1 7.8 9.1
61.1
74.168.5
100%
90%
80%
70%
60%
50%
40%
30%
20%
10%
0%Physical Social Emotional Language Communication
Vulnerable Risk On Track
64.8
16.7
18.5
64.8
11.116.7
14.820.4
13.0
13.0
22.2
20.4
Source: AEDC Data Explorer: https://www.aedc.gov.au/data/data-explorer?id=135139 (accessed 10 October 2019)
Figure 7. 2018 AEDC results for Cobar LGA
Source: AEDC Data Explorer: https://www.aedc.gov.au/data/data-explorer?id=135134 (accessed 10 October 2019)
Figure 8. 2018 AEDC results for Coonamble LGA
46 Western NSW District Data Profile
76.078.477.6
100%
90%
80%
70%
60%
50%
40%
30%
20%
10%
0%Physical Social Emotional Language Communication
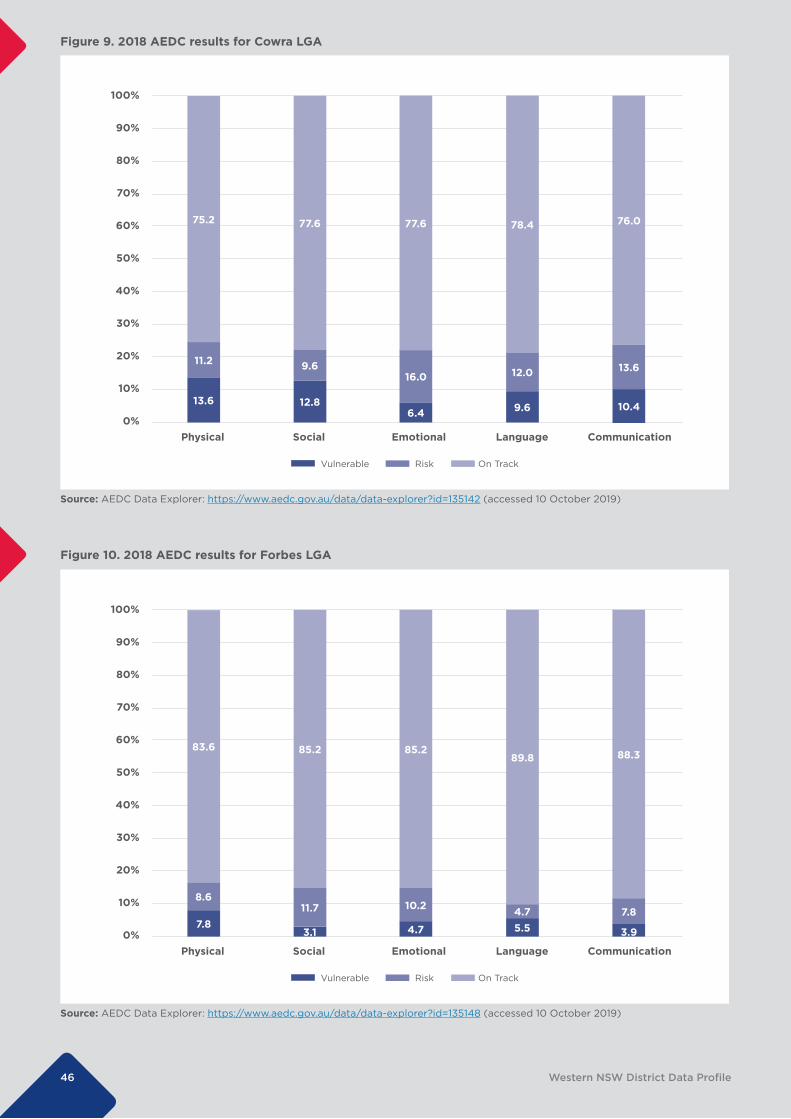
75.2
Vulnerable Risk On Track
11.2
12.8
9.6
77.6
16.0 12.0 13.6
13.66.4 9.6 10.4
88.389.885.2
100%
90%
80%
70%
60%
50%
40%
30%
20%
10%
0%Physical Social Emotional Language Communication
Vulnerable Risk On Track
83.6
3.1
11.7
85.2
10.2 7.87.8 4.7 5.5
4.7
3.9
8.6
Source: AEDC Data Explorer: https://www.aedc.gov.au/data/data-explorer?id=135148 (accessed 10 October 2019)
Figure 9. 2018 AEDC results for Cowra LGA
Source: AEDC Data Explorer: https://www.aedc.gov.au/data/data-explorer?id=135142 (accessed 10 October 2019)
Figure 10. 2018 AEDC results for Forbes LGA
47 Western NSW District Data Profile
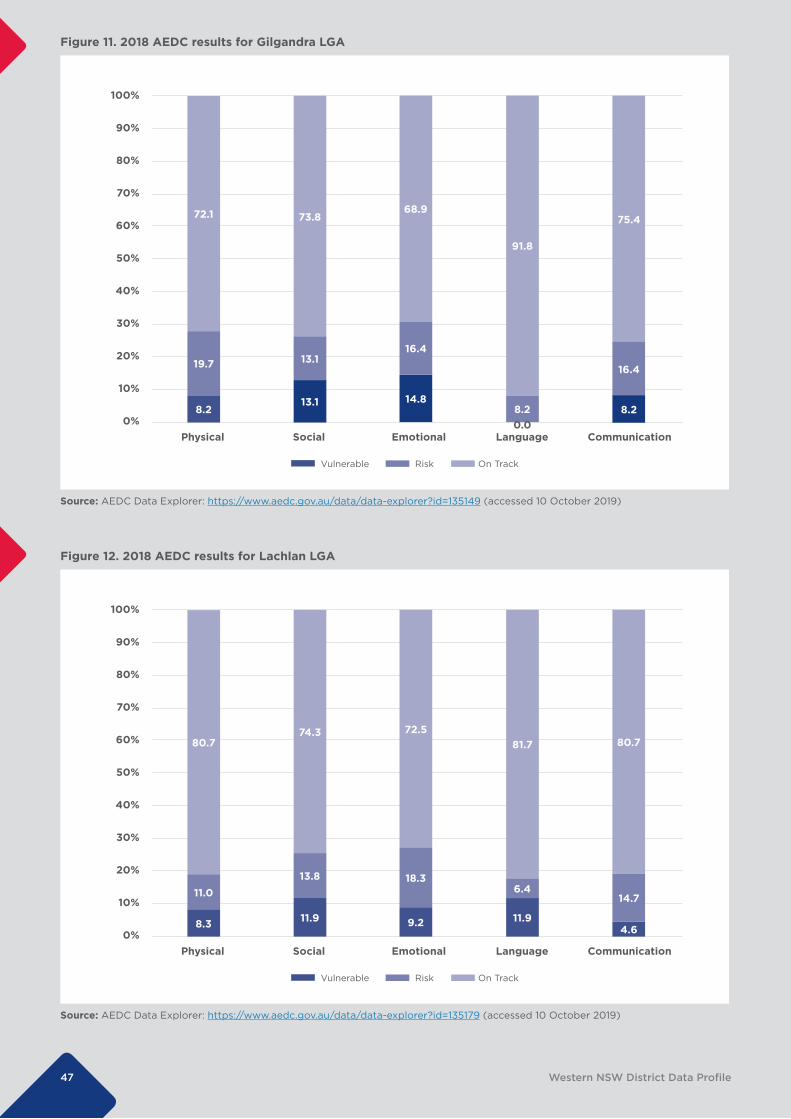
Figure 11. 2018 AEDC results for Gilgandra LGA
75.468.9
91.8
100%
90%
80%
70%
60%
50%
40%
30%
20%
10%
0%Physical Social Emotional Language Communication
72.1
Vulnerable Risk On Track
19.7
7.2
13.1
73.8
8.214.8
0.08.2
13.1
16.4
8.2
16.4
Source: AEDC Data Explorer: https://www.aedc.gov.au/data/data-explorer?id=135149 (accessed 10 October 2019)
Figure 12. 2018 AEDC results for Lachlan LGA
80.781.772.5
100%
90%
80%
70%
60%
50%
40%
30%
20%
10%
0%Physical Social Emotional Language Communication
80.7
Vulnerable Risk On Track
11.9
13.8
74.3
18.3
8.3 9.2 11.9
6.4
4.6
11.0 14.7
Source: AEDC Data Explorer: https://www.aedc.gov.au/data/data-explorer?id=135179 (accessed 10 October 2019)
48 Western NSW District Data Profile
86.390.283.9
100%
90%
80%
70%
60%
50%
40%
30%
20%
10%
0%Physical Social Emotional Language Communication
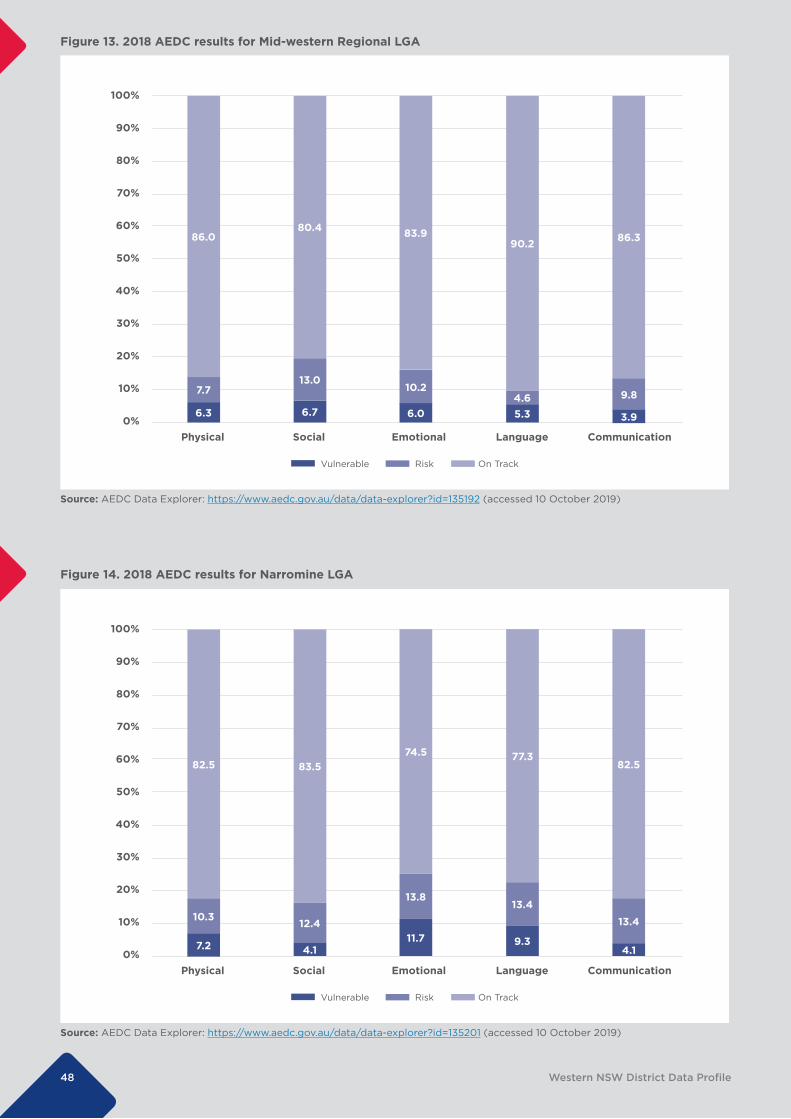
86.0
Vulnerable Risk On Track
7.7
6.7
13.0
80.4
10.24.6 9.8
6.3 6.0 5.3 3.9
82.577.374.5
100%
90%
80%
70%
60%
50%
40%
30%
20%
10%
0%Physical Social Emotional Language Communication
82.5
Vulnerable Risk On Track
4.1
12.4
83.5
13.8
13.4
7.211.7 9.3
13.4
4.1
10.3
Source: AEDC Data Explorer: https://www.aedc.gov.au/data/data-explorer?id=135201 (accessed 10 October 2019)
Figure 13. 2018 AEDC results for Mid-western Regional LGA
Source: AEDC Data Explorer: https://www.aedc.gov.au/data/data-explorer?id=135192 (accessed 10 October 2019)
Figure 14. 2018 AEDC results for Narromine LGA

49 Western NSW District Data Profile
93.290.988.6
100%
90%
80%
70%
60%
50%
40%
30%
20%
10%
0%Physical Social Emotional Language Communication
81.8
Vulnerable Risk On Track
13.6
6.8
15.9
77.3
6.8 4.56.84.5 4.5 4.50.0
79.388.4
80.0
100%
90%
80%
70%
60%
50%
40%
30%
20%
10%
0%Physical Social Emotional Language Communication
76.8
Vulnerable Risk On Track
7.9
13.4
78.7
12.8 13.7
9.7 7.27.0
7.0
13.5
4.6
Source: AEDC Data Explorer: https://www.aedc.gov.au/data/data-explorer?id=135206 (accessed 10 October 2019)
Figure 15. 2018 AEDC results for Oberon LGA
Source: AEDC Data Explorer: https://www.aedc.gov.au/data/data-explorer?id=135205 (accessed 10 October 2019)
Figure 16. 2018 AEDC results for Orange LGA
50 Western NSW District Data Profile
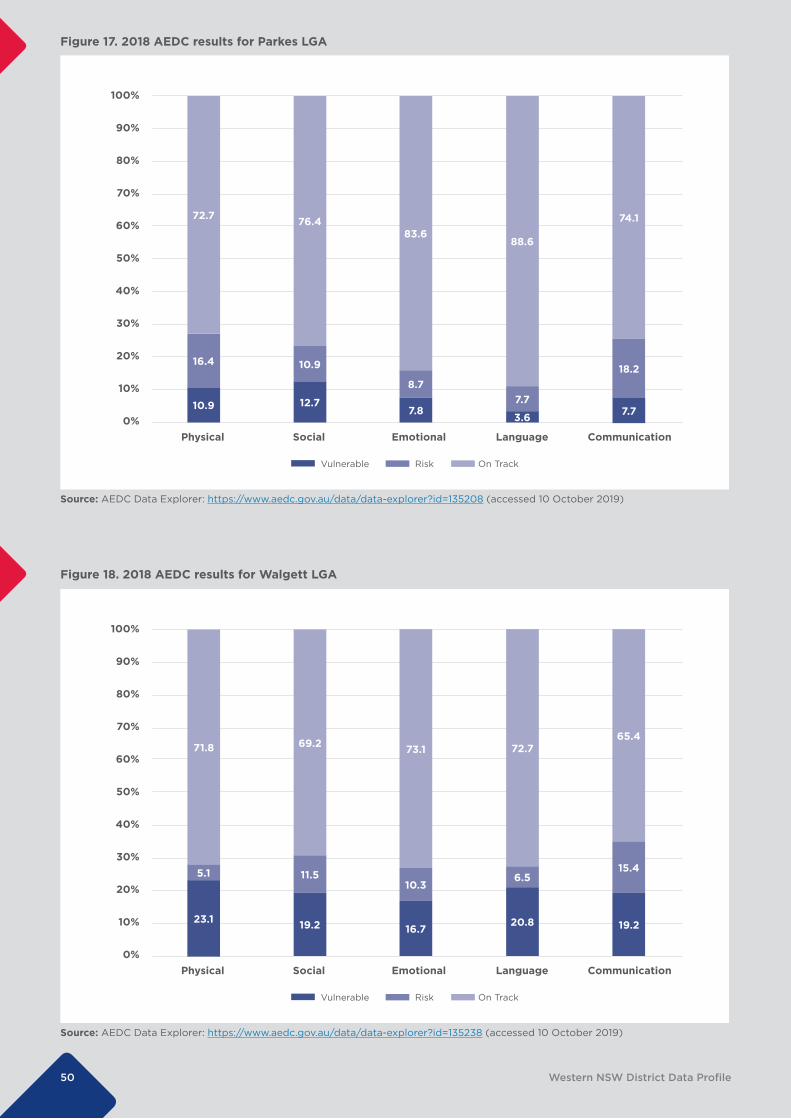
74.1
88.683.6
100%
90%
80%
70%
60%
50%
40%
30%
20%
10%
0%Physical Social Emotional Language Communication
72.7
Vulnerable Risk On Track
16.4
12.7
10.9
76.4
8.77.7
18.2
10.9 7.8 3.6 7.7
65.472.773.1
100%
90%
80%
70%
60%
50%
40%
30%
20%
10%
0%Physical Social Emotional Language Communication
71.8
Vulnerable Risk On Track
19.2
11.5
69.2
10.315.4
23.116.7 20.8
6.5
19.2
5.1
Source: AEDC Data Explorer: https://www.aedc.gov.au/data/data-explorer?id=135238 (accessed 10 October 2019)
Figure 17. 2018 AEDC results for Parkes LGA
Source: AEDC Data Explorer: https://www.aedc.gov.au/data/data-explorer?id=135208 (accessed 10 October 2019)
Figure 18. 2018 AEDC results for Walgett LGA
51 Western NSW District Data Profile
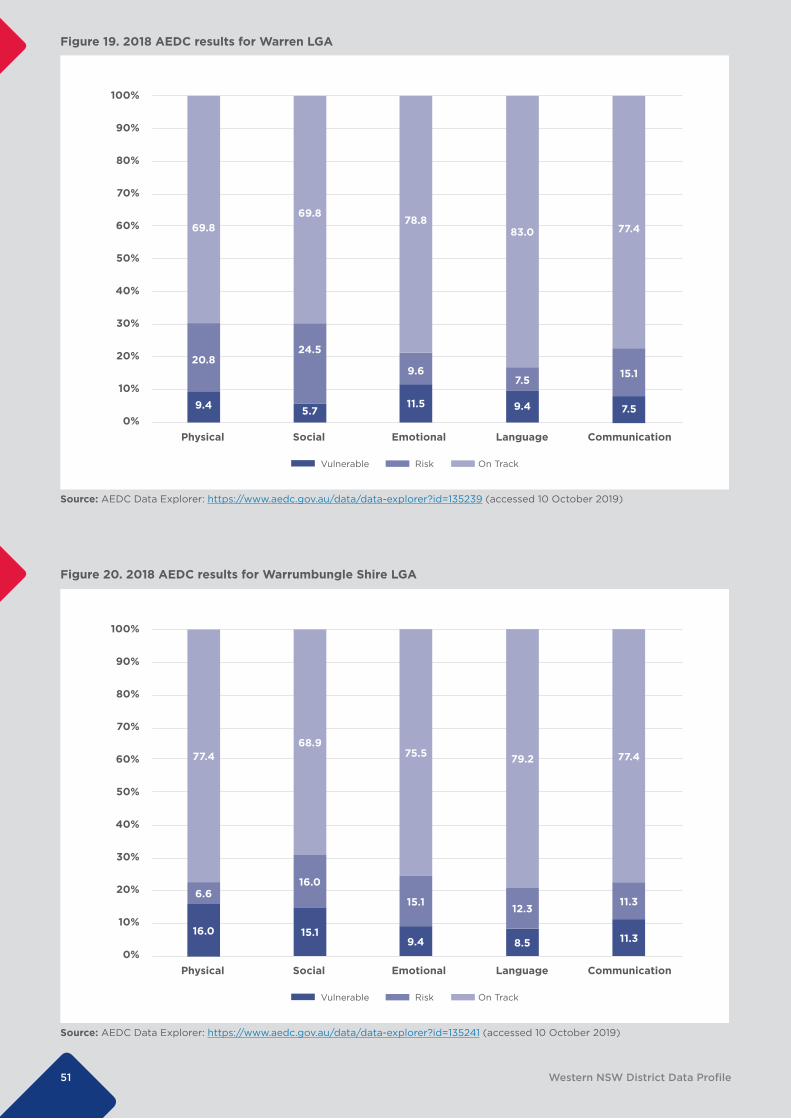
77.483.078.8
100%
90%
80%
70%
60%
50%
40%
30%
20%
10%
0%Physical Social Emotional Language Communication
69.8
Vulnerable Risk On Track
20.8
5.7
24.5
69.8
9.67.5 15.1
9.4 11.5 9.4 7.5
77.479.275.5
100%
90%
80%
70%
60%
50%
40%
30%
20%
10%
0%Physical Social Emotional Language Communication
77.4
Vulnerable Risk On Track
15.1
16.0
68.9
15.1 11.3
16.09.4 8.5
12.3
11.3
6.6
Source: AEDC Data Explorer: https://www.aedc.gov.au/data/data-explorer?id=135241 (accessed 10 October 2019)
Figure 19. 2018 AEDC results for Warren LGA
Source: AEDC Data Explorer: https://www.aedc.gov.au/data/data-explorer?id=135239 (accessed 10 October 2019)
Figure 20. 2018 AEDC results for Warrumbungle Shire LGA
52 Western NSW District Data Profile
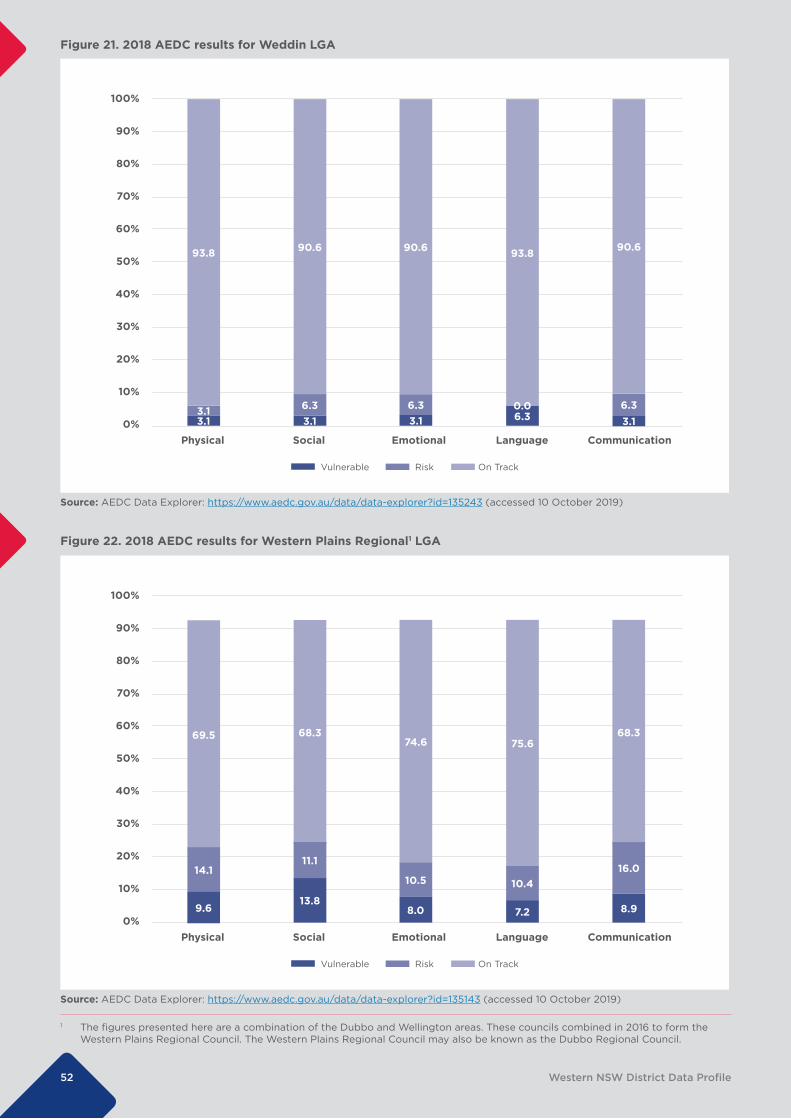
90.693.890.6
100%
90%
80%
70%
60%
50%
40%
30%
20%
10%
0%Physical Social Emotional Language Communication
93.8
Vulnerable Risk On Track
3.13.16.3
90.6
6.3 0.0 6.33.1 3.1 6.3 3.1
Figure 21. 2018 AEDC results for Weddin LGA
Source: AEDC Data Explorer: https://www.aedc.gov.au/data/data-explorer?id=135243 (accessed 10 October 2019)
68.375.674.6
100%
90%
80%
70%
60%
50%
40%
30%
20%
10%
0%Physical Social Emotional Language Communication
69.5
Vulnerable Risk On Track
13.8
11.1
68.3
10.516.0
9.6 8.0 7.2
10.4
8.9
14.1
Source: AEDC Data Explorer: https://www.aedc.gov.au/data/data-explorer?id=135143 (accessed 10 October 2019)
Figure 22. 2018 AEDC results for Western Plains Regional1 LGA
1 The figures presented here are a combination of the Dubbo and Wellington areas. These councils combined in 2016 to form the Western Plains Regional Council. The Western Plains Regional Council may also be known as the Dubbo Regional Council.
53 Western NSW District Data Profile
The AEDC also has two summary indicators that measure developmental vulnerability across all five domains.
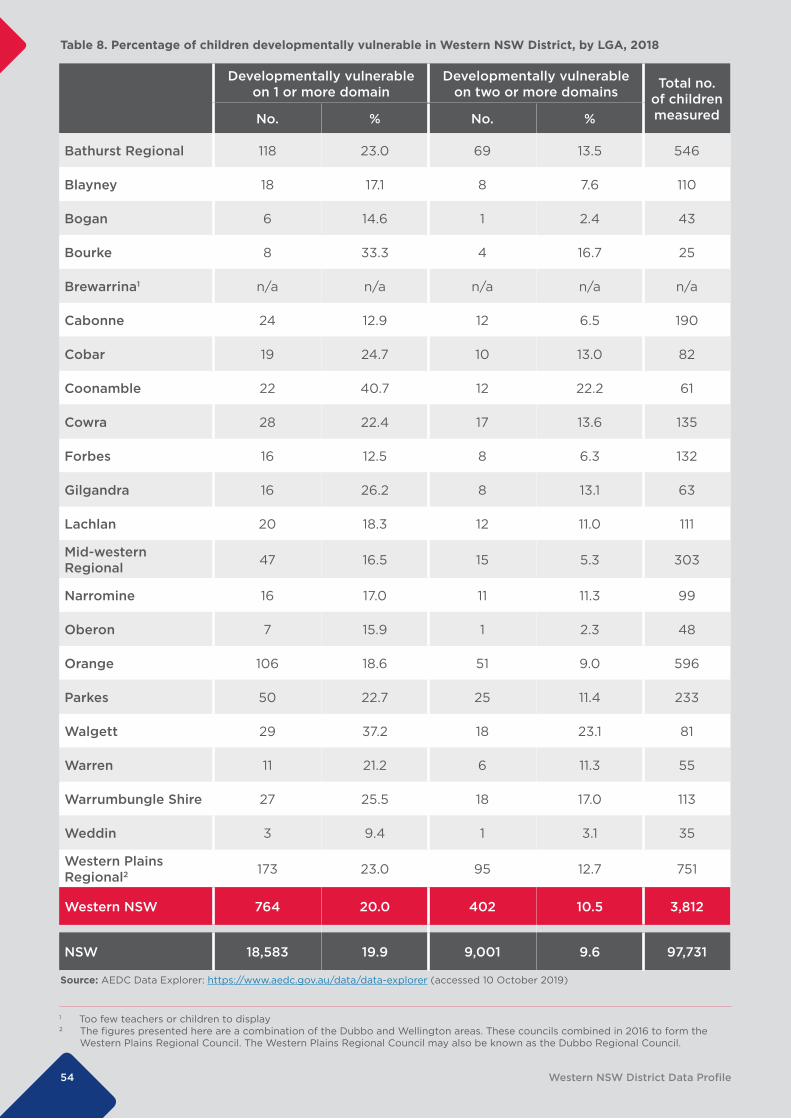
In 2018, 10.5% of children were developmentally vulnerable on two or more domains in the Western NSW district (see Table 8). Walgett had the highest proportion of children who were developmentally vulnerable on two or more domains, at 23.1%. Oberon had the smallest proportion at 2.3%.
54 Western NSW District Data Profile
Table 8. Percentage of children developmentally vulnerable in Western NSW District, by LGA, 2018
Source: AEDC Data Explorer: https://www.aedc.gov.au/data/data-explorer (accessed 10 October 2019)
Developmentally vulnerable on 1 or more domain
Developmentally vulnerable on two or more domains
Total no. of children measuredNo. % No. %
Bathurst Regional 118 23.0 69 13.5 546
Blayney 18 17.1 8 7.6 110
Bogan 6 14.6 1 2.4 43
Bourke 8 33.3 4 16.7 25
Brewarrina1 n/a n/a n/a n/a n/a
Cabonne 24 12.9 12 6.5 190
Cobar 19 24.7 10 13.0 82
Coonamble 22 40.7 12 22.2 61
Cowra 28 22.4 17 13.6 135
Forbes 16 12.5 8 6.3 132
Gilgandra 16 26.2 8 13.1 63
Lachlan 20 18.3 12 11.0 111
Mid-western Regional 47 16.5 15 5.3 303
Narromine 16 17.0 11 11.3 99
Oberon 7 15.9 1 2.3 48
Orange 106 18.6 51 9.0 596
Parkes 50 22.7 25 11.4 233
Walgett 29 37.2 18 23.1 81
Warren 11 21.2 6 11.3 55
Warrumbungle Shire 27 25.5 18 17.0 113
Weddin 3 9.4 1 3.1 35
Western Plains Regional2 173 23.0 95 12.7 751
Western NSW 764 20.0 402 10.5 3,812
NSW 18,583 19.9 9,001 9.6 97,731
1 Too few teachers or children to display 2 The figures presented here are a combination of the Dubbo and Wellington areas. These councils combined in 2016 to form the
Western Plains Regional Council. The Western Plains Regional Council may also be known as the Dubbo Regional Council.
Source: AEDC Data Explorer: https://www.aedc.gov.au/data/data-explorer (accessed 10 October 2019)
55 Western NSW District Data Profile
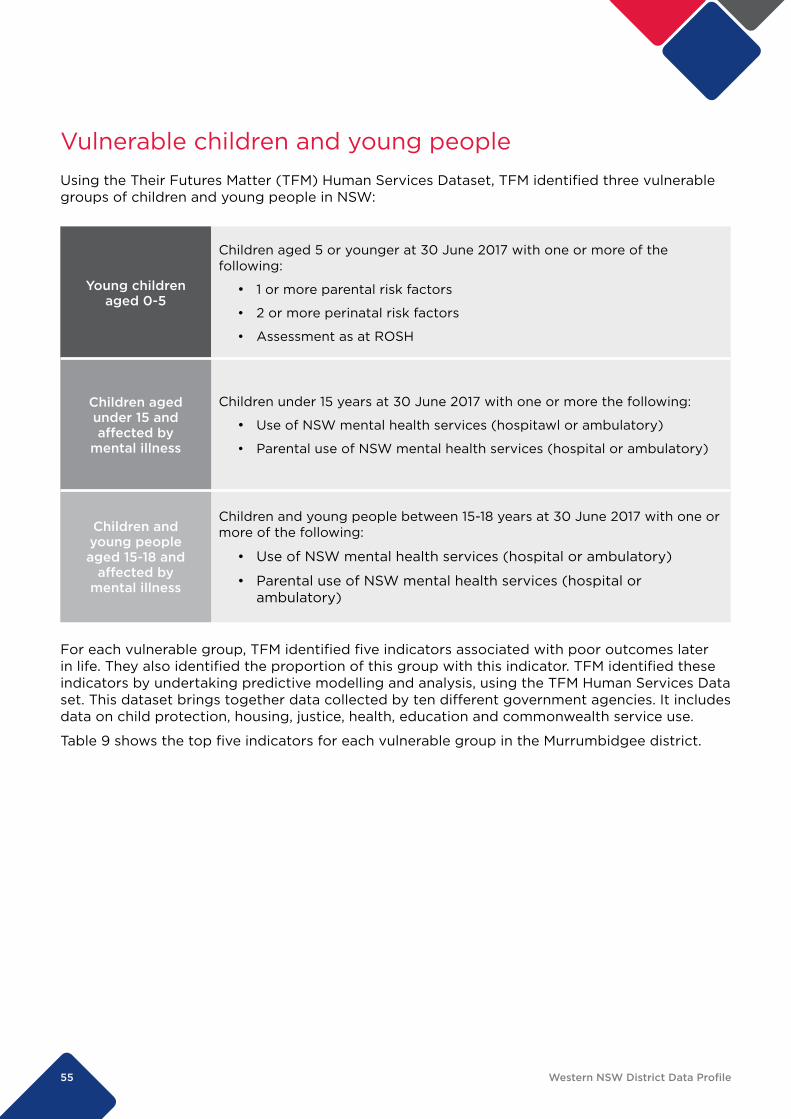
Young children aged 0-5
Children aged 5 or younger at 30 June 2017 with one or more of the following:
• 1 or more parental risk factors
• 2 or more perinatal risk factors
• Assessment as at ROSH
Children aged under 15 and affected by
mental illness
Children under 15 years at 30 June 2017 with one or more the following:
• Use of NSW mental health services (hospitawl or ambulatory)
• Parental use of NSW mental health services (hospital or ambulatory)
Children and young people aged 15-18 and
affected by mental illness
Children and young people between 15-18 years at 30 June 2017 with one or more of the following:
• Use of NSW mental health services (hospital or ambulatory)
• Parental use of NSW mental health services (hospital or ambulatory)
Vulnerable children and young peopleUsing the Their Futures Matter (TFM) Human Services Dataset, TFM identified three vulnerable groups of children and young people in NSW:
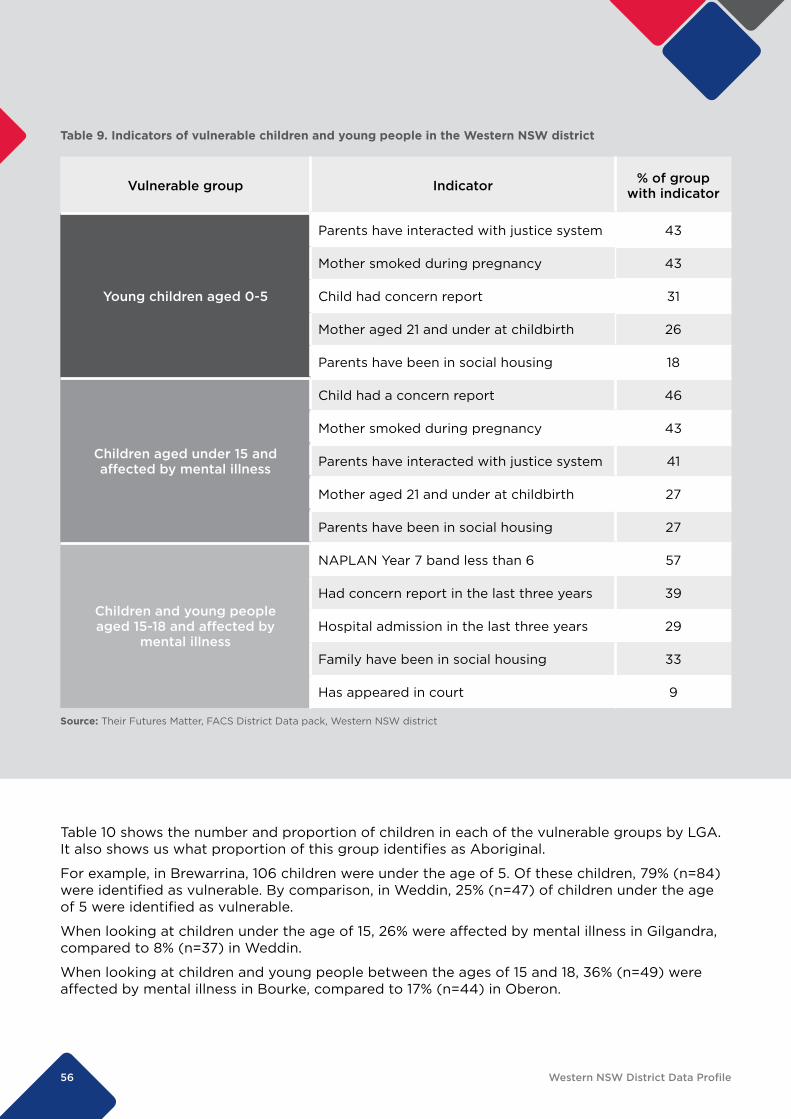
For each vulnerable group, TFM identified five indicators associated with poor outcomes later in life. They also identified the proportion of this group with this indicator. TFM identified these indicators by undertaking predictive modelling and analysis, using the TFM Human Services Data set. This dataset brings together data collected by ten different government agencies. It includes data on child protection, housing, justice, health, education and commonwealth service use.
Table 9 shows the top five indicators for each vulnerable group in the Murrumbidgee district.
56 Western NSW District Data Profile
Table 9. Indicators of vulnerable children and young people in the Western NSW district
Source: Their Futures Matter, FACS District Data pack, Western NSW district
Vulnerable group Indicator % of group with indicator
Young children aged 0-5
Parents have interacted with justice system 43
Mother smoked during pregnancy 43
Child had concern report 31
Mother aged 21 and under at childbirth 26
Parents have been in social housing 18
Children aged under 15 and affected by mental illness
Child had a concern report 46
Mother smoked during pregnancy 43
Parents have interacted with justice system 41
Mother aged 21 and under at childbirth 27
Parents have been in social housing 27
Children and young people aged 15-18 and affected by
mental illness
NAPLAN Year 7 band less than 6 57
Had concern report in the last three years 39
Hospital admission in the last three years 29
Family have been in social housing 33
Has appeared in court 9
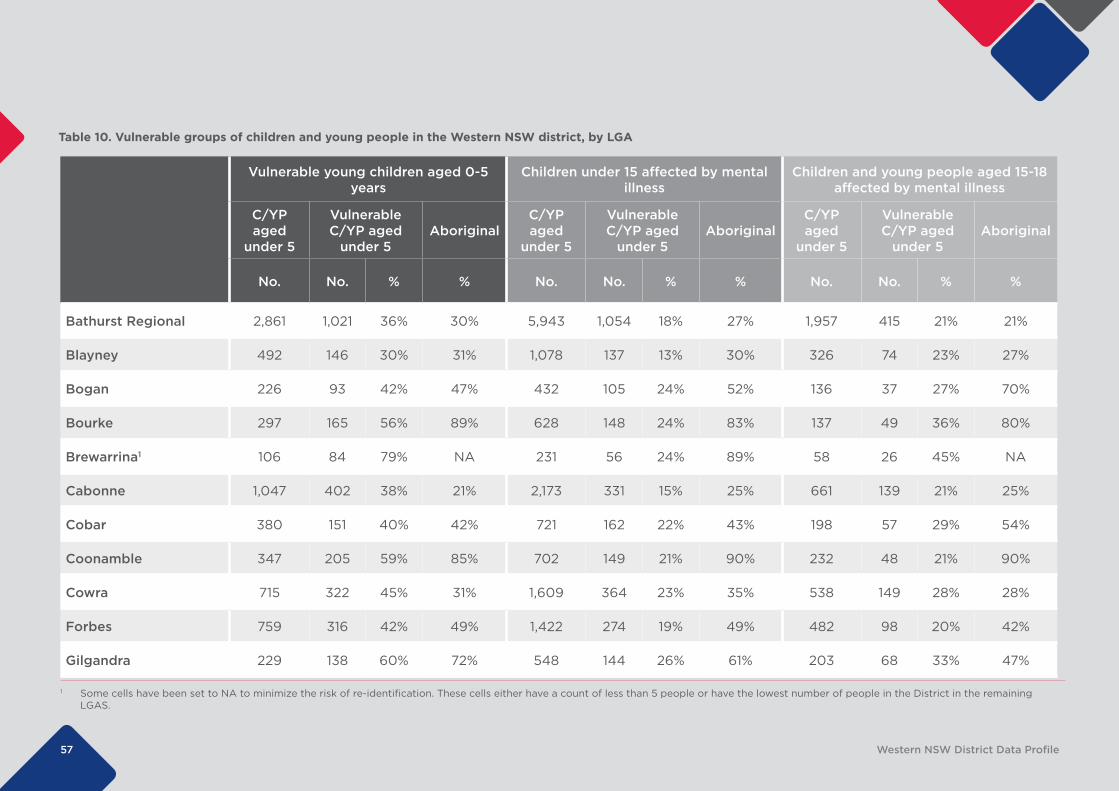
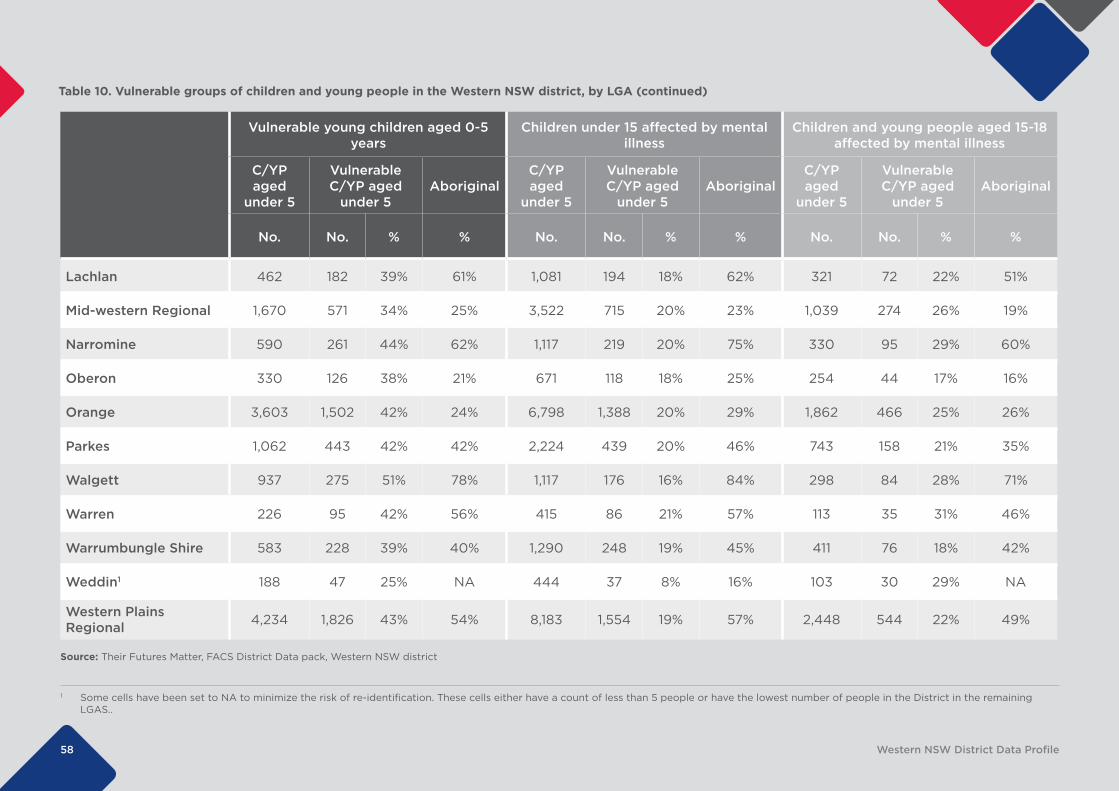
Table 10 shows the number and proportion of children in each of the vulnerable groups by LGA. It also shows us what proportion of this group identifies as Aboriginal.
For example, in Brewarrina, 106 children were under the age of 5. Of these children, 79% (n=84) were identified as vulnerable. By comparison, in Weddin, 25% (n=47) of children under the age of 5 were identified as vulnerable.
When looking at children under the age of 15, 26% were affected by mental illness in Gilgandra, compared to 8% (n=37) in Weddin.
When looking at children and young people between the ages of 15 and 18, 36% (n=49) were affected by mental illness in Bourke, compared to 17% (n=44) in Oberon.
57 Western NSW District Data Profile
Table 10. Vulnerable groups of children and young people in the Western NSW district, by LGA
Vulnerable young children aged 0-5 years
Children under 15 affected by mental illness
Children and young people aged 15-18 affected by mental illness
C/YP aged
under 5
Vulnerable C/YP aged
under 5Aboriginal
C/YP aged
under 5
Vulnerable C/YP aged
under 5Aboriginal
C/YP aged
under 5
Vulnerable C/YP aged
under 5Aboriginal
No. No. % % No. No. % % No. No. % %
Bathurst Regional 2,861 1,021 36% 30% 5,943 1,054 18% 27% 1,957 415 21% 21%
Blayney 492 146 30% 31% 1,078 137 13% 30% 326 74 23% 27%
Bogan 226 93 42% 47% 432 105 24% 52% 136 37 27% 70%
Bourke 297 165 56% 89% 628 148 24% 83% 137 49 36% 80%
Brewarrina1 106 84 79% NA 231 56 24% 89% 58 26 45% NA
Cabonne 1,047 402 38% 21% 2,173 331 15% 25% 661 139 21% 25%
Cobar 380 151 40% 42% 721 162 22% 43% 198 57 29% 54%
Coonamble 347 205 59% 85% 702 149 21% 90% 232 48 21% 90%
Cowra 715 322 45% 31% 1,609 364 23% 35% 538 149 28% 28%
Forbes 759 316 42% 49% 1,422 274 19% 49% 482 98 20% 42%
Gilgandra 229 138 60% 72% 548 144 26% 61% 203 68 33% 47%
1 Some cells have been set to NA to minimize the risk of re-identification. These cells either have a count of less than 5 people or have the lowest number of people in the District in the remaining LGAS.
58 Western NSW District Data Profile
Table 10. Vulnerable groups of children and young people in the Western NSW district, by LGA (continued)
Source: Their Futures Matter, FACS District Data pack, Western NSW district
Vulnerable young children aged 0-5 years
Children under 15 affected by mental illness
Children and young people aged 15-18 affected by mental illness
C/YP aged
under 5
Vulnerable C/YP aged
under 5Aboriginal
C/YP aged
under 5
Vulnerable C/YP aged
under 5Aboriginal
C/YP aged
under 5
Vulnerable C/YP aged
under 5Aboriginal
No. No. % % No. No. % % No. No. % %
Lachlan 462 182 39% 61% 1,081 194 18% 62% 321 72 22% 51%
Mid-western Regional 1,670 571 34% 25% 3,522 715 20% 23% 1,039 274 26% 19%
Narromine 590 261 44% 62% 1,117 219 20% 75% 330 95 29% 60%
Oberon 330 126 38% 21% 671 118 18% 25% 254 44 17% 16%
Orange 3,603 1,502 42% 24% 6,798 1,388 20% 29% 1,862 466 25% 26%
Parkes 1,062 443 42% 42% 2,224 439 20% 46% 743 158 21% 35%
Walgett 937 275 51% 78% 1,117 176 16% 84% 298 84 28% 71%
Warren 226 95 42% 56% 415 86 21% 57% 113 35 31% 46%
Warrumbungle Shire 583 228 39% 40% 1,290 248 19% 45% 411 76 18% 42%
Weddin1 188 47 25% NA 444 37 8% 16% 103 30 29% NA
Western Plains Regional 4,234 1,826 43% 54% 8,183 1,554 19% 57% 2,448 544 22% 49%
1 Some cells have been set to NA to minimize the risk of re-identification. These cells either have a count of less than 5 people or have the lowest number of people in the District in the remaining LGAS..
59 Western NSW District Data Profile
Table 11. Child Protection Overview in the Western NSW district, by LGA, 2016-17
Total number of children and young
people reported
Total number of children and young
people at risk of significant harm
Total number of children and young people in out-of-home care, as of
30 June 2017
Total number
of CYP 18 and under
No. % No. % No. % No.
Bathurst Regional 1,039 10.0 815 7.8 165 1.6 10,425
Blayney 160 8.4 120 6.3 37 1.9 1,908
Bogan 64 9.3 50 7.3 16 2.3 686
Bourke 194 27.2 145 20.3 47 6.6 714
Brewarrina 113 24.8 84 18.5 20 4.4 455
Cabonne 343 9.5 258 7.1 72 2.0 3,624
Cobar 177 14.4 135 11.0 13 1.1 1,229
Coonamble 256 27.0 189 20.0 44 4.6 947
Cowra 352 12.8 276 10.0 100 3.6 2,753
Forbes 242 9.8 181 7.3 26 1.1 2,465
Gilgandra 134 13.4 100 10.0 23 2.3 1,001
Lachlan 250 15.6 196 12.2 39 2.4 1,603
Mid-western Regional 650 10.8 474 7.9 116 1.9 6,030
Narromine 313 18.7 250 14.9 67 4.0 1,677
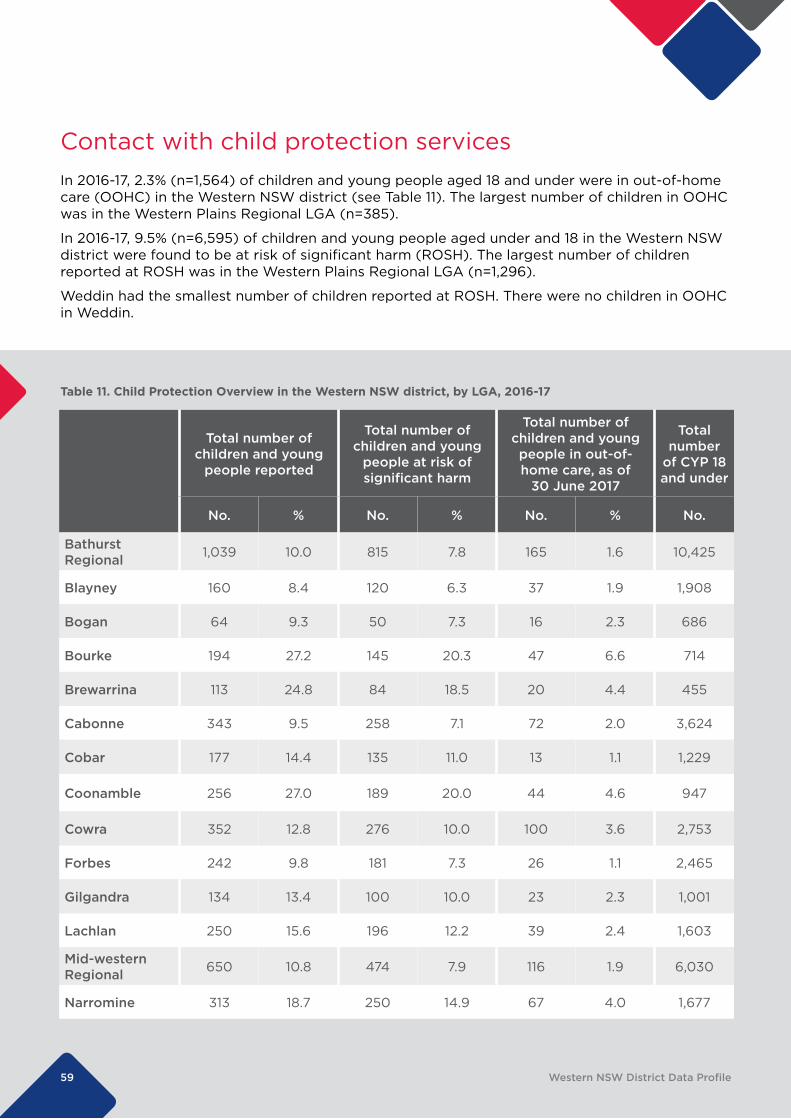
Contact with child protection servicesIn 2016-17, 2.3% (n=1,564) of children and young people aged 18 and under were in out-of-home care (OOHC) in the Western NSW district (see Table 11). The largest number of children in OOHC was in the Western Plains Regional LGA (n=385).
In 2016-17, 9.5% (n=6,595) of children and young people aged under and 18 in the Western NSW district were found to be at risk of significant harm (ROSH). The largest number of children reported at ROSH was in the Western Plains Regional LGA (n=1,296).
Weddin had the smallest number of children reported at ROSH. There were no children in OOHC in Weddin.

60 Western NSW District Data Profile
Table 11. Child Protection Overview in the Western NSW district, by LGA, 2016-17 (continued)
Total number of children and young
people reported
Total number of children and young
people at risk of significant harm
Total number of children and young people in out-of-home care, as of
30 June 2017
Total number
of CYP 18 and under
No. % No. % No. % No.
Oberon 107 8.8 78 6.4 21 1.7 1,215
Orange 1,200 11.2 930 8.7 212 2.0 10,693
Parkes 473 12.6 383 10.2 81 2.2 3,767
Walgett 326 22.4 271 18.6 42 2.9 1,456
Warren 85 12.4 67 9.7 10 1.5 688
Warrumbungle Shire 326 15.5 268 12.7 55 2.6 2,104
Weddin 36 4.6 29 3.7 0 0.0 775
Western Plains Regional 1,713 13.3 1,296 10.1 358 2.8 12,844
Western NSW 8,553 12.4 6,595 9.5 1,564 2.3 69,059
NSW 230,343 13.2 168,819 9.7 36,304 2.1 1,742,488
Source: FACS Datacube, accessed 14 October 2019
61 Western NSW District Data Profile
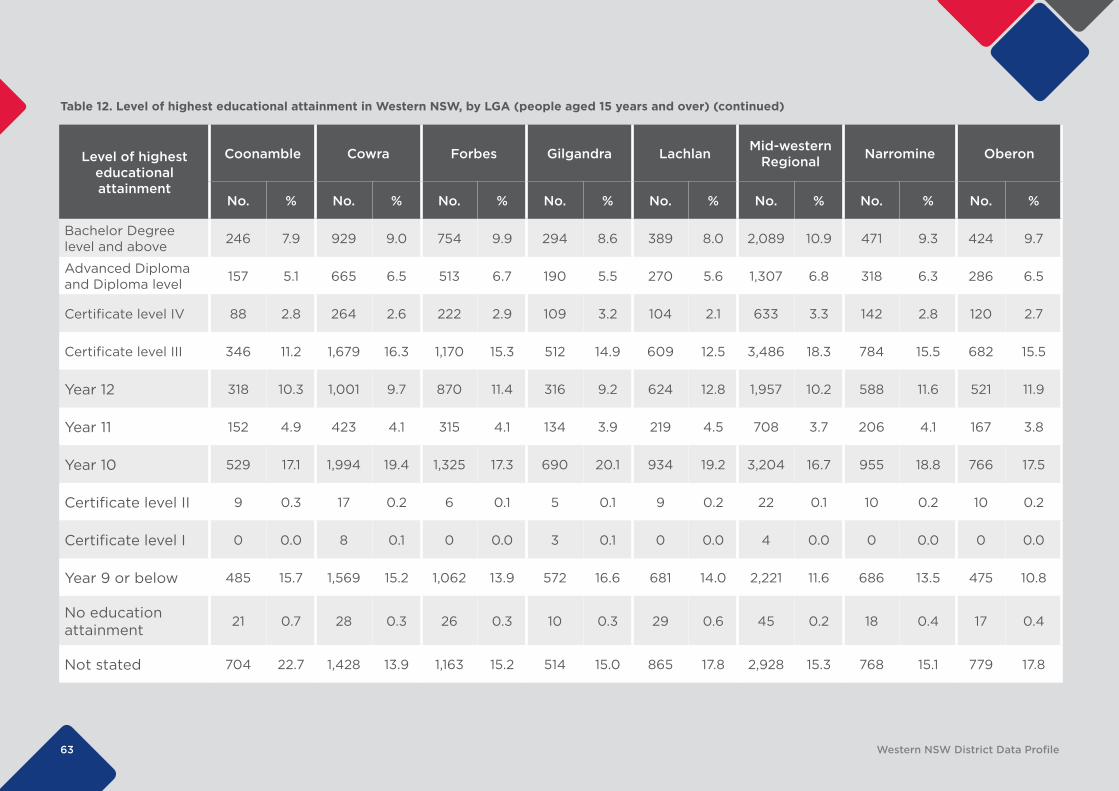
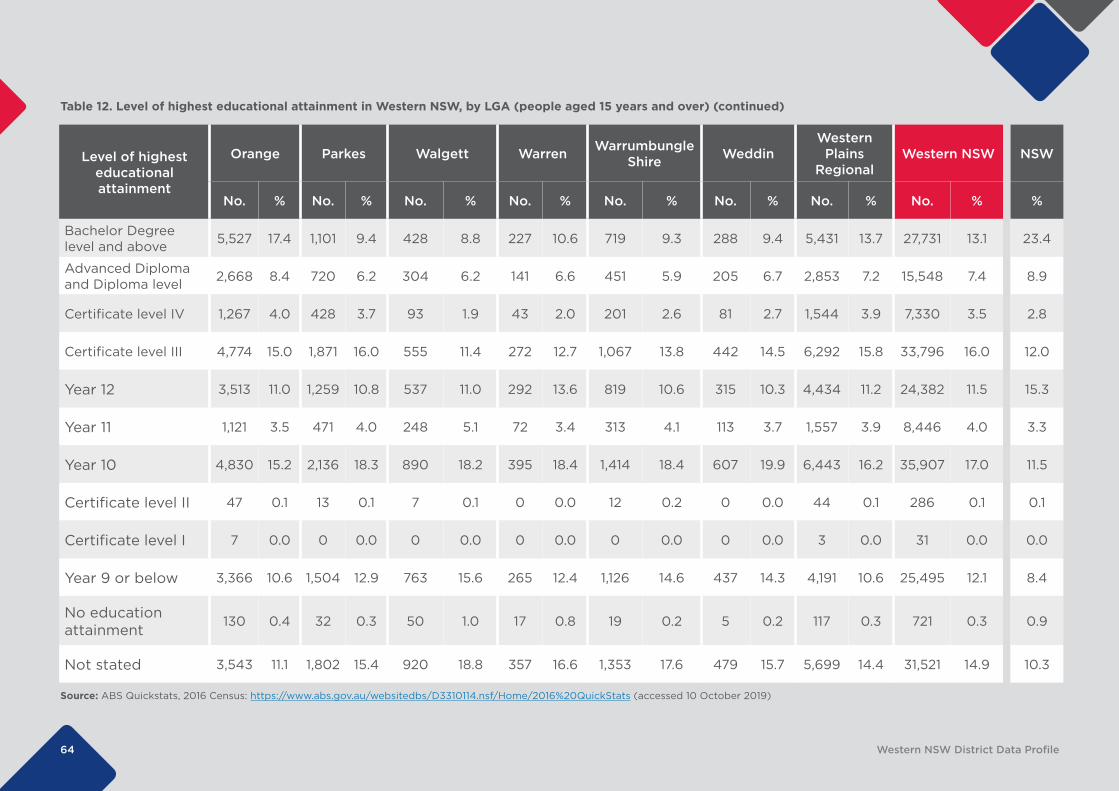
Economic EnvironmentEducationIn the Western NSW district, 19.5% of people aged 15 and over reported having a Certificate III or IV as their highest level of educational attainment. Year 10 was the next most common highest level of educational attainment, at 17%, followed by a Bachelor Degree level or above, at 13.1% (see Table 12).

62 Western NSW District Data Profile
Table 12. Level of highest educational attainment in Western NSW, by LGA (people aged 15 years and over)
Level of highest educational attainment
Bathurst Regional Blayney Bogan Bourke Brewarrina Cabonne Cobar
No. % No. % No. % No. % No. % No. % No. %
Bachelor Degree level and above 5,356 16.1 748 13.0 194 9.1 198 9.9 95 7.4 1,498 14.3 325 9.0
Advanced Diploma and Diploma level 2,672 8.1 428 7.4 116 5.4 144 7.2 65 5.1 900 8.6 175 4.8
Certificate level IV 1,223 3.7 219 3.8 42 2.0 53 2.6 18 1.4 336 3.2 100 2.8
Certificate level III 5,284 15.9 974 16.9 321 15.0 194 9.7 122 9.5 1,710 16.3 650 18.0
Year 12 4,360 13.1 591 10.3 270 12.6 184 9.2 130 10.1 1,106 10.5 377 10.4
Year 11 1,199 3.6 211 3.7 92 4.3 95 4.7 65 5.1 394 3.8 171 4.7
Year 10 4,495 13.5 984 17.1 409 19.1 308 15.3 248 19.3 1,712 16.3 639 17.7
Certificate level II 37 0.1 4 0.1 0 0.0 3 0.1 11 0.9 15 0.1 5 0.1
Certificate level I 6 0.0 0 0.0 0 0.0 0 0.0 0 0.0 0 0.0 0 0.0
Year 9 or below 2,934 8.8 661 11.5 301 14.1 268 13.3 237 18.5 1,239 11.8 452 12.5
No education attainment
84 0.3 8 0.1 3 0.1 10 0.5 11 0.9 28 0.3 13 0.4
Not stated 4,491 13.5 735 12.8 357 16.7 515 25.6 259 20.2 1,223 11.6 639 17.7
63 Western NSW District Data Profile
Table 12. Level of highest educational attainment in Western NSW, by LGA (people aged 15 years and over) (continued)
Level of highest educational attainment
Coonamble Cowra Forbes Gilgandra Lachlan Mid-western Regional Narromine Oberon
No. % No. % No. % No. % No. % No. % No. % No. %
Bachelor Degree level and above 246 7.9 929 9.0 754 9.9 294 8.6 389 8.0 2,089 10.9 471 9.3 424 9.7
Advanced Diploma and Diploma level 157 5.1 665 6.5 513 6.7 190 5.5 270 5.6 1,307 6.8 318 6.3 286 6.5
Certificate level IV 88 2.8 264 2.6 222 2.9 109 3.2 104 2.1 633 3.3 142 2.8 120 2.7
Certificate level III 346 11.2 1,679 16.3 1,170 15.3 512 14.9 609 12.5 3,486 18.3 784 15.5 682 15.5
Year 12 318 10.3 1,001 9.7 870 11.4 316 9.2 624 12.8 1,957 10.2 588 11.6 521 11.9
Year 11 152 4.9 423 4.1 315 4.1 134 3.9 219 4.5 708 3.7 206 4.1 167 3.8
Year 10 529 17.1 1,994 19.4 1,325 17.3 690 20.1 934 19.2 3,204 16.7 955 18.8 766 17.5
Certificate level II 9 0.3 17 0.2 6 0.1 5 0.1 9 0.2 22 0.1 10 0.2 10 0.2
Certificate level I 0 0.0 8 0.1 0 0.0 3 0.1 0 0.0 4 0.0 0 0.0 0 0.0
Year 9 or below 485 15.7 1,569 15.2 1,062 13.9 572 16.6 681 14.0 2,221 11.6 686 13.5 475 10.8
No education attainment
21 0.7 28 0.3 26 0.3 10 0.3 29 0.6 45 0.2 18 0.4 17 0.4
Not stated 704 22.7 1,428 13.9 1,163 15.2 514 15.0 865 17.8 2,928 15.3 768 15.1 779 17.8
64 Western NSW District Data Profile
Table 12. Level of highest educational attainment in Western NSW, by LGA (people aged 15 years and over) (continued)
Source: ABS Quickstats, 2016 Census: https://www.abs.gov.au/websitedbs/D3310114.nsf/Home/2016%20QuickStats (accessed 10 October 2019)
Level of highest educational attainment
Orange Parkes Walgett Warren Warrumbungle Shire Weddin
Western Plains
RegionalWestern NSW NSW
No. % No. % No. % No. % No. % No. % No. % No. % %
Bachelor Degree level and above 5,527 17.4 1,101 9.4 428 8.8 227 10.6 719 9.3 288 9.4 5,431 13.7 27,731 13.1 23.4
Advanced Diploma and Diploma level 2,668 8.4 720 6.2 304 6.2 141 6.6 451 5.9 205 6.7 2,853 7.2 15,548 7.4 8.9
Certificate level IV 1,267 4.0 428 3.7 93 1.9 43 2.0 201 2.6 81 2.7 1,544 3.9 7,330 3.5 2.8
Certificate level III 4,774 15.0 1,871 16.0 555 11.4 272 12.7 1,067 13.8 442 14.5 6,292 15.8 33,796 16.0 12.0
Year 12 3,513 11.0 1,259 10.8 537 11.0 292 13.6 819 10.6 315 10.3 4,434 11.2 24,382 11.5 15.3
Year 11 1,121 3.5 471 4.0 248 5.1 72 3.4 313 4.1 113 3.7 1,557 3.9 8,446 4.0 3.3
Year 10 4,830 15.2 2,136 18.3 890 18.2 395 18.4 1,414 18.4 607 19.9 6,443 16.2 35,907 17.0 11.5
Certificate level II 47 0.1 13 0.1 7 0.1 0 0.0 12 0.2 0 0.0 44 0.1 286 0.1 0.1
Certificate level I 7 0.0 0 0.0 0 0.0 0 0.0 0 0.0 0 0.0 3 0.0 31 0.0 0.0
Year 9 or below 3,366 10.6 1,504 12.9 763 15.6 265 12.4 1,126 14.6 437 14.3 4,191 10.6 25,495 12.1 8.4
No education attainment
130 0.4 32 0.3 50 1.0 17 0.8 19 0.2 5 0.2 117 0.3 721 0.3 0.9
Not stated 3,543 11.1 1,802 15.4 920 18.8 357 16.6 1,353 17.6 479 15.7 5,699 14.4 31,521 14.9 10.3
65 Western NSW District Data Profile
Table 13. Employment in Western NSW district, by LGA
Worked full-time
Worked part-time
Away from work Unemployed Total
No. % No. % No. % No. % No. %
Bathurst Regional 11,165 57.8 5,923 30.6 1,079 5.6 1,162 6.0 19,329 100
Blayney 1,987 58.1 1,043 30.5 192 5.6 200 5.8 3,422 100
Bogan 799 64.4 324 26.1 55 4.4 62 5.1 1,240 100
Bourke 724 67.7 233 21.8 44 4.1 69 6.4 1,070 100
Brewarrina 346 58.9 106 18.1 40 6.8 95 16.2 587 100
Cabonne 3,778 60.0 1,874 29.8 373 5.9 268 4.3 6,293 100
Cobar 1,411 66.0 448 20.9 157 7.3 123 5.8 2,139 100
Coonamble 901 57.7 389 25.0 129 8.3 140 9.0 1,559 100
Cowra 2,880 56.0 1,644 31.9 288 5.6 335 6.5 5,147 100
Forbes 2,493 59.8 1,177 28.2 272 6.5 225 5.4 4,167 99.9
Gilgandra 1,109 58.6 554 29.3 121 6.4 110 5.7 1,894 100
Lachlan 1,563 59.1 710 26.8 194 7.3 179 6.8 2,646 100
Mid-western Regional 5,847 56.4 3,281 31.6 566 5.5 678 6.5 10,372 100
Narromine 1,697 60.8 738 26.4 152 5.4 206 7.4 2,793 100
Oberon 1,419 59.5 694 29.2 134 5.6 137 5.7 2,384 100
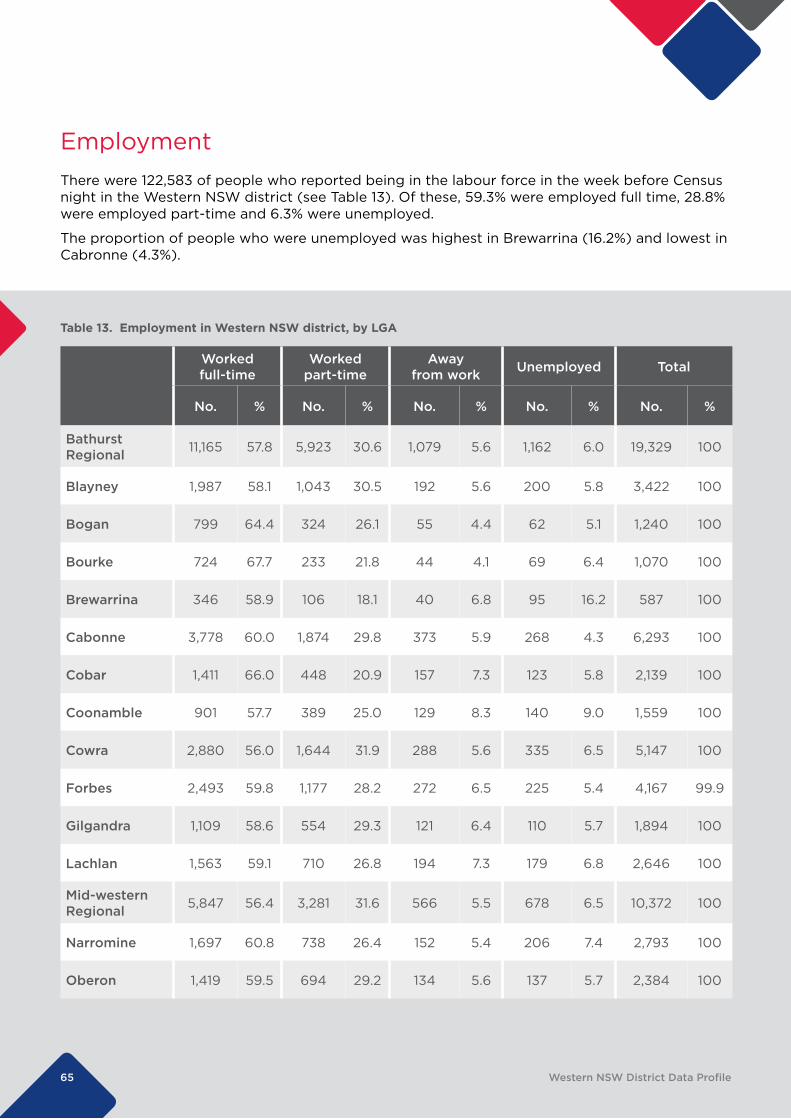
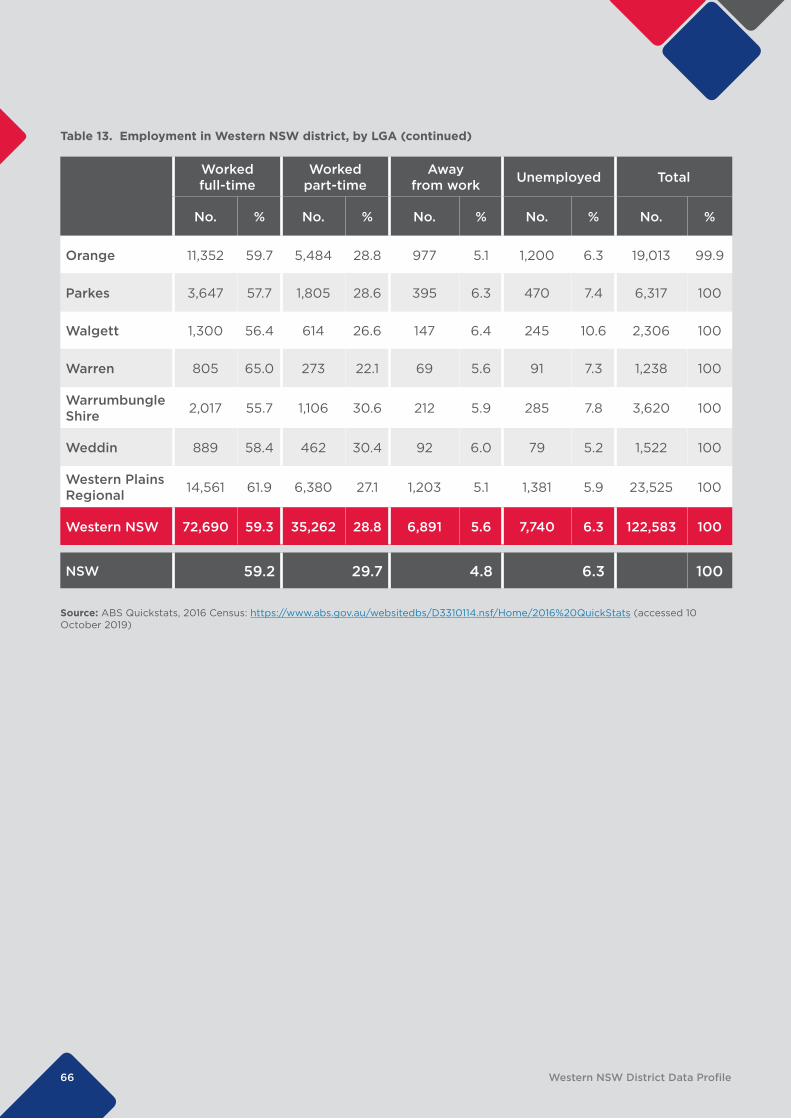
EmploymentThere were 122,583 of people who reported being in the labour force in the week before Census night in the Western NSW district (see Table 13). Of these, 59.3% were employed full time, 28.8% were employed part-time and 6.3% were unemployed.
The proportion of people who were unemployed was highest in Brewarrina (16.2%) and lowest in Cabronne (4.3%).
66 Western NSW District Data Profile
Source: ABS Quickstats, 2016 Census: https://www.abs.gov.au/websitedbs/D3310114.nsf/Home/2016%20QuickStats (accessed 10 October 2019)
Table 13. Employment in Western NSW district, by LGA (continued)
Worked full-time
Worked part-time
Away from work Unemployed Total
No. % No. % No. % No. % No. %
Orange 11,352 59.7 5,484 28.8 977 5.1 1,200 6.3 19,013 99.9
Parkes 3,647 57.7 1,805 28.6 395 6.3 470 7.4 6,317 100
Walgett 1,300 56.4 614 26.6 147 6.4 245 10.6 2,306 100
Warren 805 65.0 273 22.1 69 5.6 91 7.3 1,238 100
Warrumbungle Shire 2,017 55.7 1,106 30.6 212 5.9 285 7.8 3,620 100
Weddin 889 58.4 462 30.4 92 6.0 79 5.2 1,522 100
Western Plains Regional 14,561 61.9 6,380 27.1 1,203 5.1 1,381 5.9 23,525 100
Western NSW 72,690 59.3 35,262 28.8 6,891 5.6 7,740 6.3 122,583 100
NSW 59.2 29.7 4.8 6.3 100
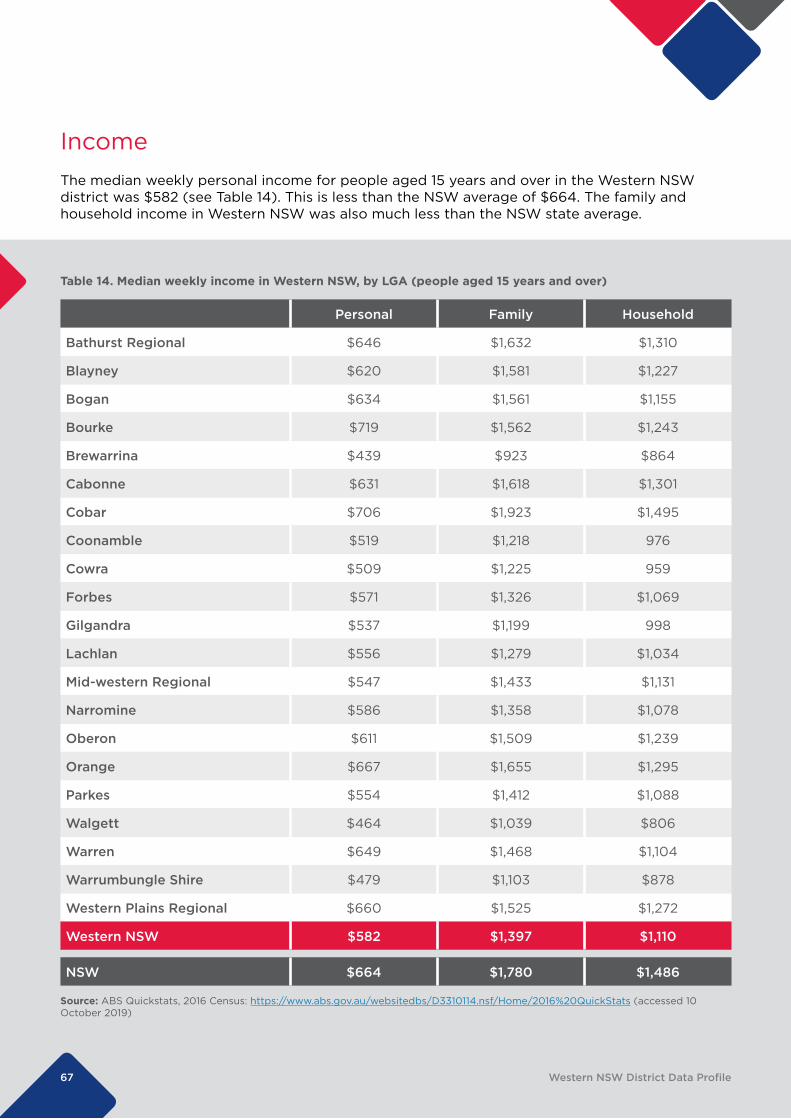
67 Western NSW District Data Profile
Table 14. Median weekly income in Western NSW, by LGA (people aged 15 years and over)
Source: ABS Quickstats, 2016 Census: https://www.abs.gov.au/websitedbs/D3310114.nsf/Home/2016%20QuickStats (accessed 10 October 2019)
Personal Family Household
Bathurst Regional $646 $1,632 $1,310
Blayney $620 $1,581 $1,227
Bogan $634 $1,561 $1,155
Bourke $719 $1,562 $1,243
Brewarrina $439 $923 $864
Cabonne $631 $1,618 $1,301
Cobar $706 $1,923 $1,495
Coonamble $519 $1,218 976
Cowra $509 $1,225 959
Forbes $571 $1,326 $1,069
Gilgandra $537 $1,199 998
Lachlan $556 $1,279 $1,034
Mid-western Regional $547 $1,433 $1,131
Narromine $586 $1,358 $1,078
Oberon $611 $1,509 $1,239
Orange $667 $1,655 $1,295
Parkes $554 $1,412 $1,088
Walgett $464 $1,039 $806
Warren $649 $1,468 $1,104
Warrumbungle Shire $479 $1,103 $878
Western Plains Regional $660 $1,525 $1,272
Western NSW $582 $1,397 $1,110
NSW $664 $1,780 $1,486
IncomeThe median weekly personal income for people aged 15 years and over in the Western NSW district was $582 (see Table 14). This is less than the NSW average of $664. The family and household income in Western NSW was also much less than the NSW state average.
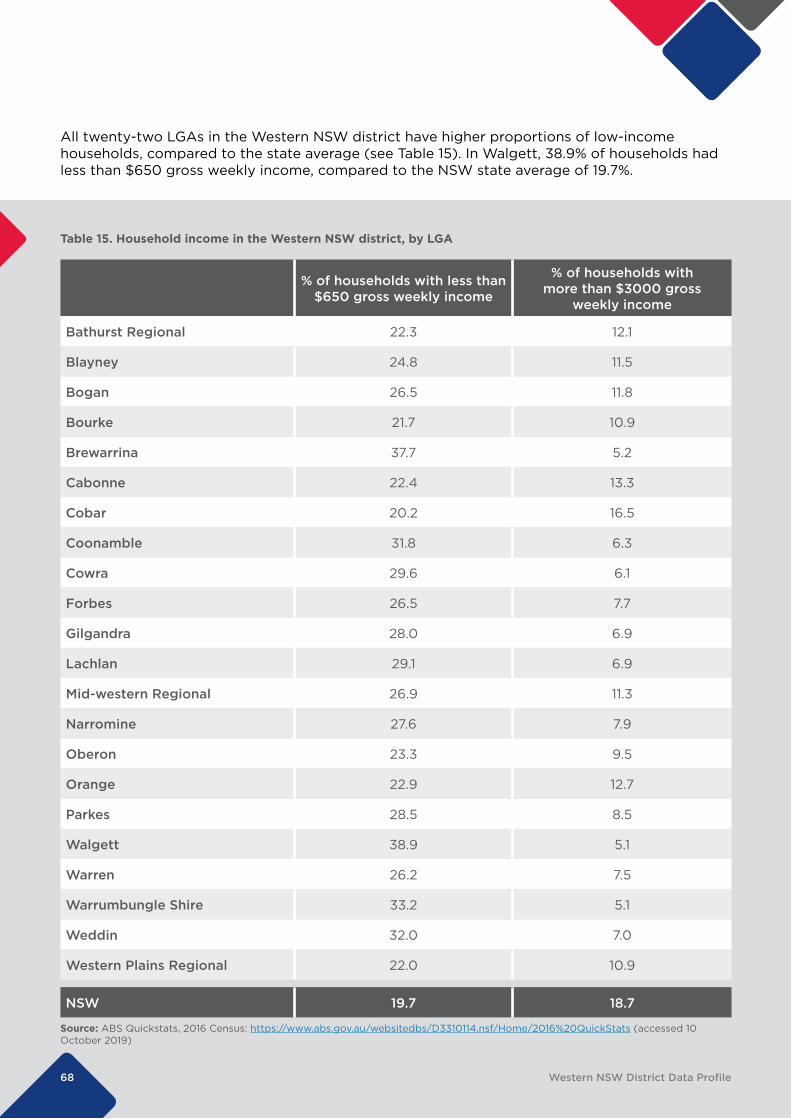
68 Western NSW District Data Profile
Table 15. Household income in the Western NSW district, by LGA
% of households with less than $650 gross weekly income
% of households with more than $3000 gross
weekly income
Bathurst Regional 22.3 12.1
Blayney 24.8 11.5
Bogan 26.5 11.8
Bourke 21.7 10.9
Brewarrina 37.7 5.2
Cabonne 22.4 13.3
Cobar 20.2 16.5
Coonamble 31.8 6.3
Cowra 29.6 6.1
Forbes 26.5 7.7
Gilgandra 28.0 6.9
Lachlan 29.1 6.9
Mid-western Regional 26.9 11.3
Narromine 27.6 7.9
Oberon 23.3 9.5
Orange 22.9 12.7
Parkes 28.5 8.5
Walgett 38.9 5.1
Warren 26.2 7.5
Warrumbungle Shire 33.2 5.1
Weddin 32.0 7.0
Western Plains Regional 22.0 10.9
NSW 19.7 18.7
Source: ABS Quickstats, 2016 Census: https://www.abs.gov.au/websitedbs/D3310114.nsf/Home/2016%20QuickStats (accessed 10 October 2019)
All twenty-two LGAs in the Western NSW district have higher proportions of low-income households, compared to the state average (see Table 15). In Walgett, 38.9% of households had less than $650 gross weekly income, compared to the NSW state average of 19.7%.
69 Western NSW District Data Profile
Socio-economic advantage and disadvantageThe Socio-Economic Indexes for Areas (SEIFA) is a measure used to rank areas in Australia according to socio-economic advantage and disadvantage. It is based on information from the five-yearly Census of Population and Housing.
The information presented below is based on the Index of Relative Socio-economic Advantage and Disadvantage (IRSAD). The IRSAD summarises information about the economic and social conditions of people and households within an area.
In the Western NSW district, Cabonne has the highest SEIFA score (997) and is ranked the highest (see Table 16). This means Cabonne is relatively advantaged compared to the other LGAs in the Western NSW district. Conversely, Brewarrina has the lowest SEIFA score (818) and is ranked the lowest, both in the Western NSW district and in the state. This means Brewarrina is relatively disadvantaged compared to the other LGAs in the Western NSW district.
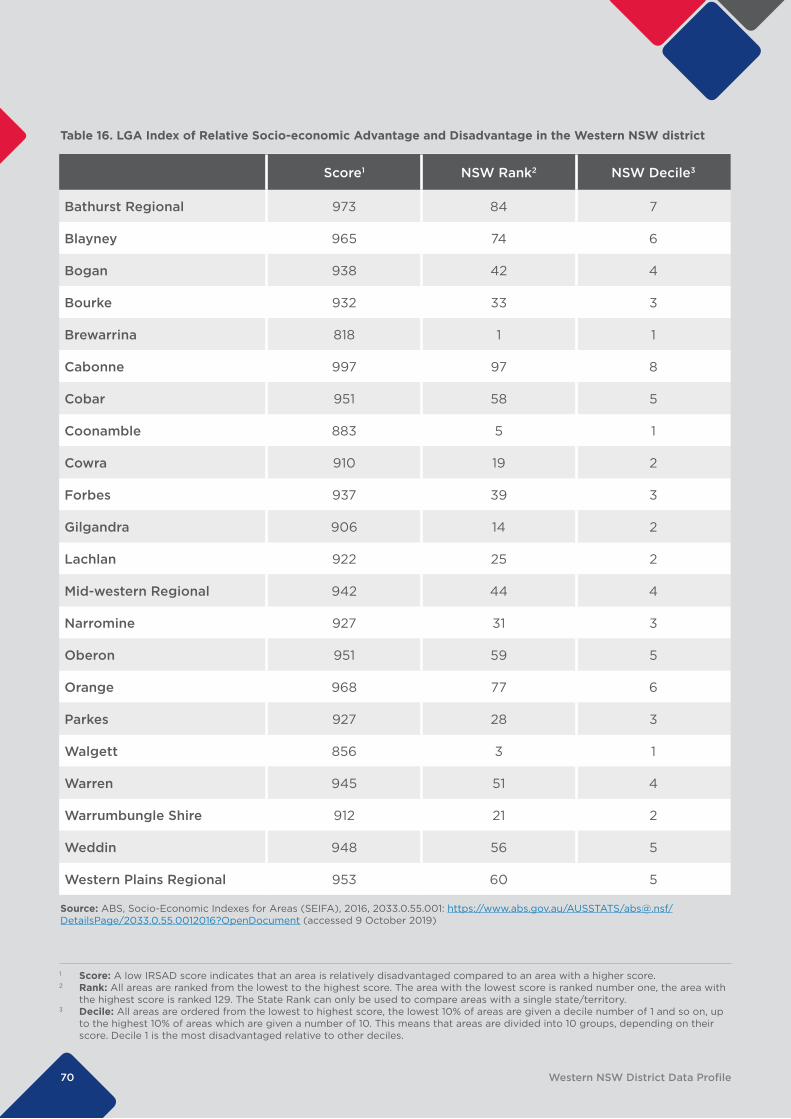
70 Western NSW District Data Profile
Table 16. LGA Index of Relative Socio-economic Advantage and Disadvantage in the Western NSW district
Score1 NSW Rank2 NSW Decile3
Bathurst Regional 973 84 7
Blayney 965 74 6
Bogan 938 42 4
Bourke 932 33 3
Brewarrina 818 1 1
Cabonne 997 97 8
Cobar 951 58 5
Coonamble 883 5 1
Cowra 910 19 2
Forbes 937 39 3
Gilgandra 906 14 2
Lachlan 922 25 2
Mid-western Regional 942 44 4
Narromine 927 31 3
Oberon 951 59 5
Orange 968 77 6
Parkes 927 28 3
Walgett 856 3 1
Warren 945 51 4
Warrumbungle Shire 912 21 2
Weddin 948 56 5
Western Plains Regional 953 60 5
1 Score: A low IRSAD score indicates that an area is relatively disadvantaged compared to an area with a higher score. 2 Rank: All areas are ranked from the lowest to the highest score. The area with the lowest score is ranked number one, the area with
the highest score is ranked 129. The State Rank can only be used to compare areas with a single state/territory. 3 Decile: All areas are ordered from the lowest to highest score, the lowest 10% of areas are given a decile number of 1 and so on, up
to the highest 10% of areas which are given a number of 10. This means that areas are divided into 10 groups, depending on their score. Decile 1 is the most disadvantaged relative to other deciles.
Source: ABS, Socio-Economic Indexes for Areas (SEIFA), 2016, 2033.0.55.001: https://www.abs.gov.au/AUSSTATS/[email protected]/DetailsPage/2033.0.55.0012016?OpenDocument (accessed 9 October 2019)
71 Western NSW District Data Profile
Social EnvironmentCommunity safety and crimeIn the Western NSW district, 2,179 domestic violence-related assaults and 1,786 non-domestic violence-related assaults occurred between January and December 2018 (see Table 17).
Domestic violence-related assault was most likely to occur in the Walgett LGA, with a rate of 2,374.8 per 100,000 people. This is the highest rate of domestic violence of the LGAs in New South Wales. The Walgett LGA also has the highest rate of non-domestic violence-related assaults, at 1, 276.3 per 100,000.
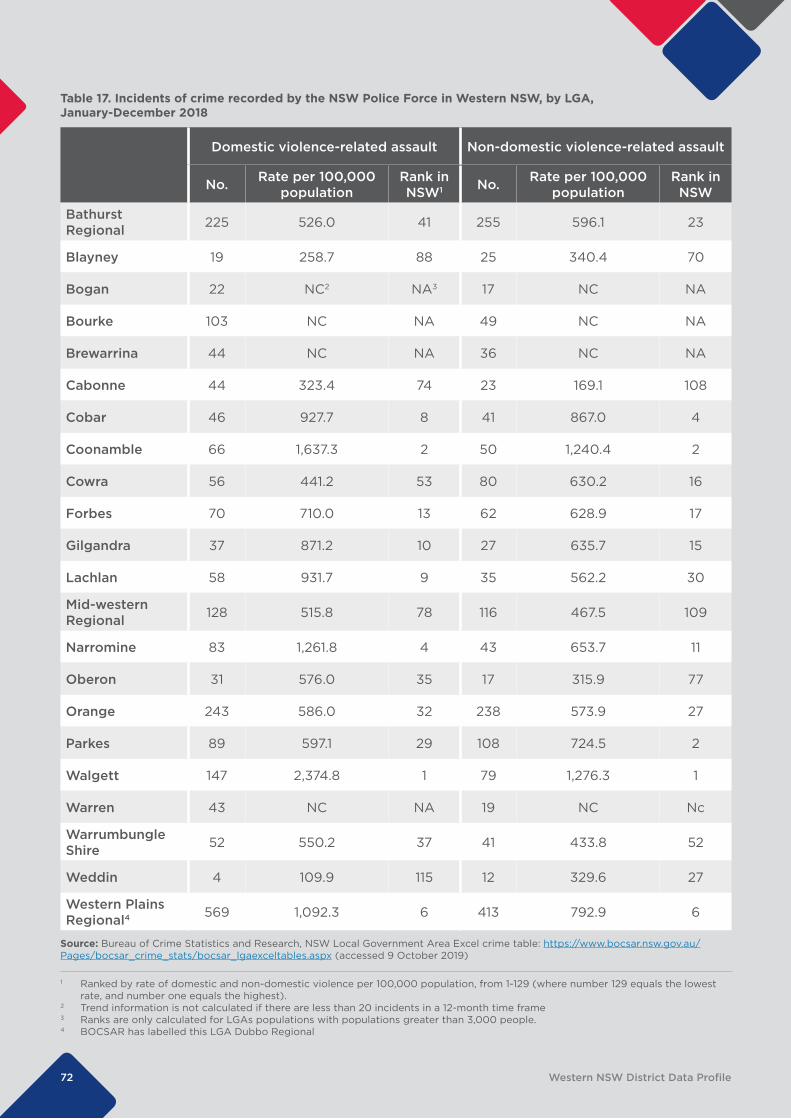
Table 17. Incidents of crime recorded by the NSW Police Force in Western NSW, by LGA, January-December 2018
Domestic violence-related assault Non-domestic violence-related assault
No. Rate per 100,000 population
Rank in NSW1 No. Rate per 100,000
populationRank in NSW
Bathurst Regional 225 526.0 41 255 596.1 23
Blayney 19 258.7 88 25 340.4 70
Bogan 22 NC2 NA3 17 NC NA
Bourke 103 NC NA 49 NC NA
Brewarrina 44 NC NA 36 NC NA
Cabonne 44 323.4 74 23 169.1 108
Cobar 46 927.7 8 41 867.0 4
Coonamble 66 1,637.3 2 50 1,240.4 2
Cowra 56 441.2 53 80 630.2 16
Forbes 70 710.0 13 62 628.9 17
Gilgandra 37 871.2 10 27 635.7 15
Lachlan 58 931.7 9 35 562.2 30
Mid-western Regional 128 515.8 78 116 467.5 109
Narromine 83 1,261.8 4 43 653.7 11
Oberon 31 576.0 35 17 315.9 77
Orange 243 586.0 32 238 573.9 27
Parkes 89 597.1 29 108 724.5 2
Walgett 147 2,374.8 1 79 1,276.3 1
Warren 43 NC NA 19 NC Nc
Warrumbungle Shire 52 550.2 37 41 433.8 52
Weddin 4 109.9 115 12 329.6 27
Western Plains Regional4 569 1,092.3 6 413 792.9 6
1 Ranked by rate of domestic and non-domestic violence per 100,000 population, from 1-129 (where number 129 equals the lowest rate, and number one equals the highest).
2 Trend information is not calculated if there are less than 20 incidents in a 12-month time frame 3 Ranks are only calculated for LGAs populations with populations greater than 3,000 people. 4 BOCSAR has labelled this LGA Dubbo Regional
72 Western NSW District Data Profile
Source: Bureau of Crime Statistics and Research, NSW Local Government Area Excel crime table: https://www.bocsar.nsw.gov.au/Pages/bocsar_crime_stats/bocsar_lgaexceltables.aspx (accessed 9 October 2019)
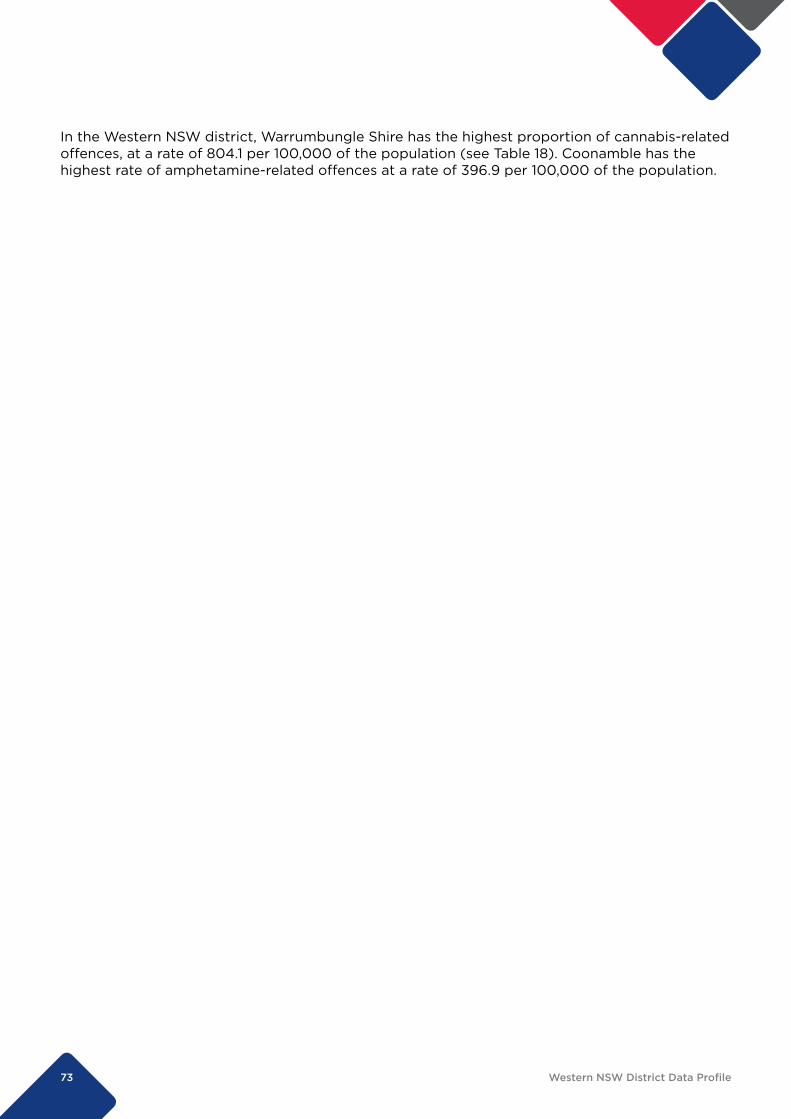
73 Western NSW District Data Profile
In the Western NSW district, Warrumbungle Shire has the highest proportion of cannabis-related offences, at a rate of 804.1 per 100,000 of the population (see Table 18). Coonamble has the highest rate of amphetamine-related offences at a rate of 396.9 per 100,000 of the population.
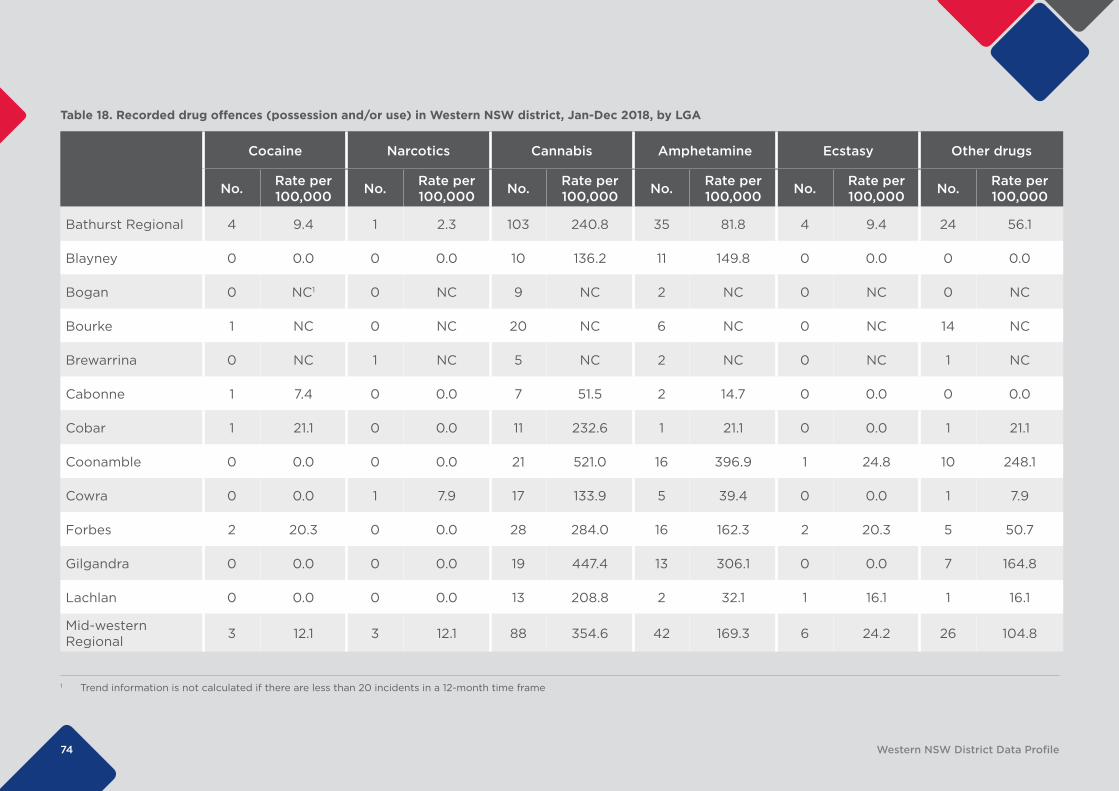
74 Western NSW District Data Profile
Table 18. Recorded drug offences (possession and/or use) in Western NSW district, Jan-Dec 2018, by LGA
Cocaine Narcotics Cannabis Amphetamine Ecstasy Other drugs
No. Rate per 100,000 No. Rate per
100,000 No. Rate per 100,000 No. Rate per
100,000 No. Rate per 100,000 No. Rate per
100,000
Bathurst Regional 4 9.4 1 2.3 103 240.8 35 81.8 4 9.4 24 56.1
Blayney 0 0.0 0 0.0 10 136.2 11 149.8 0 0.0 0 0.0
Bogan 0 NC1 0 NC 9 NC 2 NC 0 NC 0 NC
Bourke 1 NC 0 NC 20 NC 6 NC 0 NC 14 NC
Brewarrina 0 NC 1 NC 5 NC 2 NC 0 NC 1 NC
Cabonne 1 7.4 0 0.0 7 51.5 2 14.7 0 0.0 0 0.0
Cobar 1 21.1 0 0.0 11 232.6 1 21.1 0 0.0 1 21.1
Coonamble 0 0.0 0 0.0 21 521.0 16 396.9 1 24.8 10 248.1
Cowra 0 0.0 1 7.9 17 133.9 5 39.4 0 0.0 1 7.9
Forbes 2 20.3 0 0.0 28 284.0 16 162.3 2 20.3 5 50.7
Gilgandra 0 0.0 0 0.0 19 447.4 13 306.1 0 0.0 7 164.8
Lachlan 0 0.0 0 0.0 13 208.8 2 32.1 1 16.1 1 16.1
Mid-western Regional 3 12.1 3 12.1 88 354.6 42 169.3 6 24.2 26 104.8
1 Trend information is not calculated if there are less than 20 incidents in a 12-month time frame
75 Western NSW District Data Profile
Cocaine Narcotics Cannabis Amphetamine Ecstasy Other drugs
No. Rate per 100,000 No. Rate per
100,000 No. Rate per 100,000 No. Rate per
100,000 No. Rate per 100,000 No. Rate per
100,000
Narromine 0 0.0 0 0.0 13 197.6 3 45.6 0 0.0 4 60.8
Oberon 1 18.6 0 0.0 2 37.2 0 0.0 0 0.0 0 0.0
Orange 3 7.2 3 7.2 80 192.9 52 125.4 2 4.8 32 77.2
Parkes 0 0.0 1 6.7 28 187.8 16 107.3 0 0.0 7 47.0
Walgett 2 32.3 0 0.0 48 775.4 5 80.8 2 32.3 6 96.9
Warren 0 NC 0 NC 2 NC 2 NC 0 NC 2 NC
Warrumbungle Shire 0 0.0 2 21.2 76 804.1 22 232.8 2 21.2 4 42.3
Weddin 0 0.0 0 0.0 3 82.4 0 0.0 0 0.0 0 0.0
Western Plains Regional2 9 17.3 5 936 173 332.1 103 197.7 6 11.5 47 90.2
2 BOCSAR has labelled this LGA Dubbo Regional
Table 18. Recorded drug offences (possession and/or use) in Western NSW district, Jan-Dec 2018, by LGA (continued)
Source: Bureau of Crime Statistics and Research, NSW Local Government Area Excel crime table: https://www.bocsar.nsw.gov.au/Pages/bocsar_crime_stats/bocsar_lgaexceltables.aspx (accessed 7 October 2019)

76 Western NSW District Data Profile
When looking at the age of alleged offenders in Western NSW, 20-29-year-olds committed the largest number of offences. This was followed by 30-39-year-olds and 40-year-olds and above (see Figure 23). This was common across most LGAs.
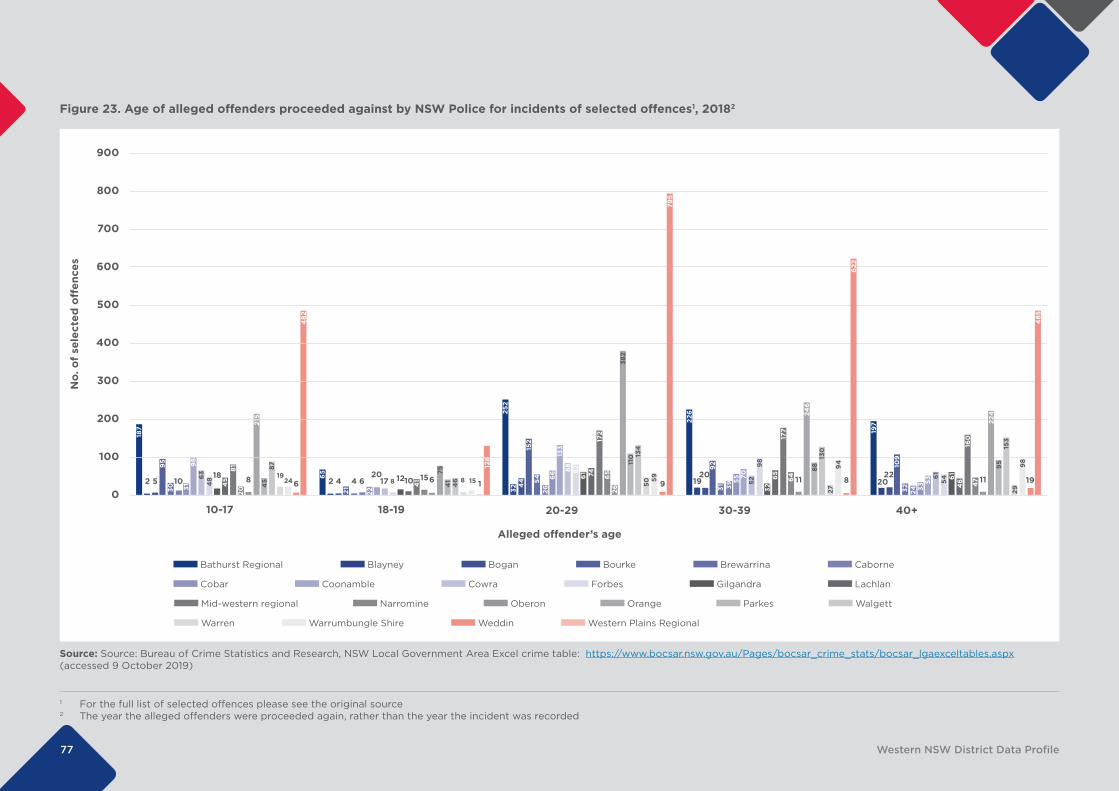
77 Western NSW District Data Profile
Figure 23. Age of alleged offenders proceeded against by NSW Police for incidents of selected offences1, 20182
1 For the full list of selected offences please see the original source2 The year the alleged offenders were proceeded again, rather than the year the incident was recorded
Source: Source: Bureau of Crime Statistics and Research, NSW Local Government Area Excel crime table: https://www.bocsar.nsw.gov.au/Pages/bocsar_crime_stats/bocsar_lgaexceltables.aspx (accessed 9 October 2019)
Alleged off ender’s age
187
Bathurst Regional Blayney Bogan Bourke Brewarrina Caborne
Cobar Coonamble Cowra Forbes Gilgandra Lachlan
Mid-western regional Narromine Oberon Orange Parkes Walgett
319
863
48 18
45
20
8
87
1924
Warren Warrumbungle Shire Weddin Western Plains Regional
2 5
9530
10
81
215
45 6
482
65
22
8 12
45
6
46 8 152 4
21
6 41
215
41 1
128
420
17 10 15
75
900
800
700
600
500
400
300
200
100
0
No.
of
sele
cted
off
ence
s
10-17 18-19 20-29 30-39 40+25
2
66 74
13415
2 172
110
9
795
382
324
4 5426
133
88 8261 6
526
5950
226
55 7052
98
65
64 11
130
1920
9231
177
246
88
8
622
39 32 279
4
197
3353
6154
46 47 11
153
2022
109
32
160
224
95
19
485
24
61
299
8
78 Western NSW District Data Profile
Maternal HealthTeenage pregnancyTeenage parenthood is associated with a number of adversities, including low socioeconomic status, educational under-achievement and drugs abuse. In turn, young parenthood can act to further entrench some of these problems and perpetuate a cycle of disadvantage.
In 2018, 170 mothers aged 19 and under gave birth in the Western NSW district (see Table 19). This accounts for 4.9% of all births in this district. This proportion is higher than the NSW state average of 1.9%. The LGA of Bourke had the highest proportion of young mothers aged 19 and under in 2018, 11.1%.
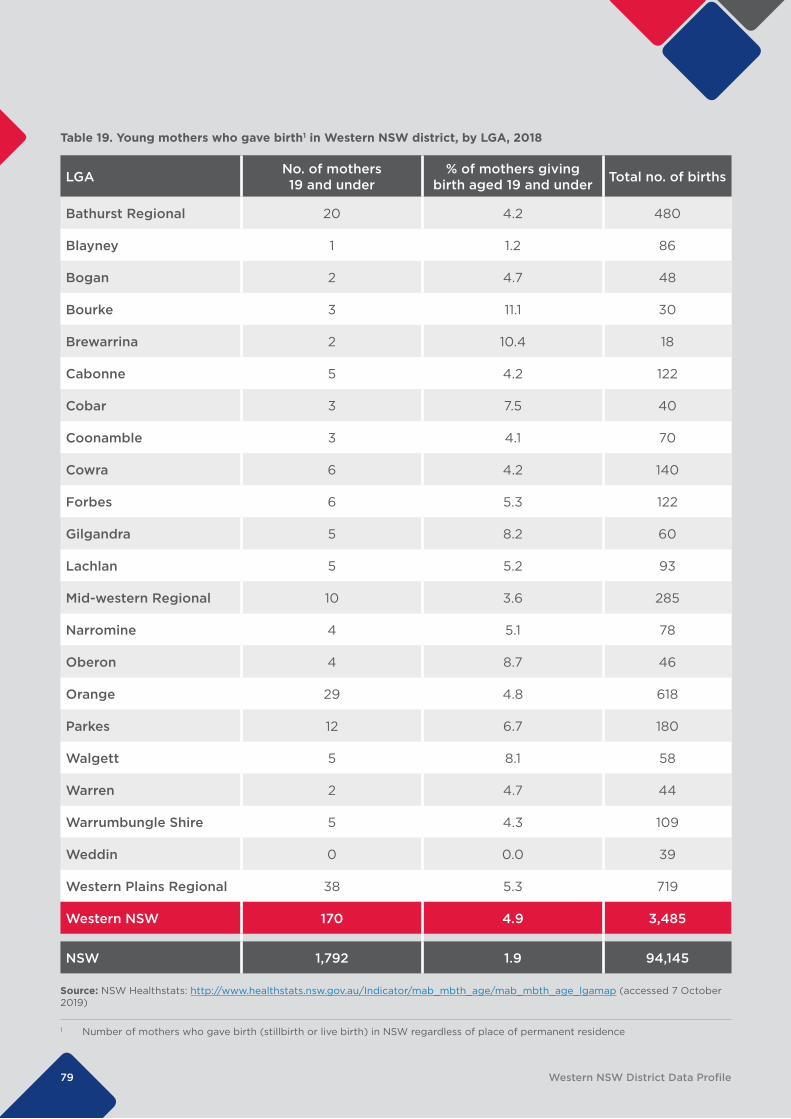
79 Western NSW District Data Profile
Table 19. Young mothers who gave birth1 in Western NSW district, by LGA, 2018
1 Number of mothers who gave birth (stillbirth or live birth) in NSW regardless of place of permanent residence
LGA No. of mothers 19 and under
% of mothers giving birth aged 19 and under Total no. of births
Bathurst Regional 20 4.2 480
Blayney 1 1.2 86
Bogan 2 4.7 48
Bourke 3 11.1 30
Brewarrina 2 10.4 18
Cabonne 5 4.2 122
Cobar 3 7.5 40
Coonamble 3 4.1 70
Cowra 6 4.2 140
Forbes 6 5.3 122
Gilgandra 5 8.2 60
Lachlan 5 5.2 93
Mid-western Regional 10 3.6 285
Narromine 4 5.1 78
Oberon 4 8.7 46
Orange 29 4.8 618
Parkes 12 6.7 180
Walgett 5 8.1 58
Warren 2 4.7 44
Warrumbungle Shire 5 4.3 109
Weddin 0 0.0 39
Western Plains Regional 38 5.3 719
Western NSW 170 4.9 3,485
NSW 1,792 1.9 94,145
Source: NSW Healthstats: http://www.healthstats.nsw.gov.au/Indicator/mab_mbth_age/mab_mbth_age_lgamap (accessed 7 October 2019)
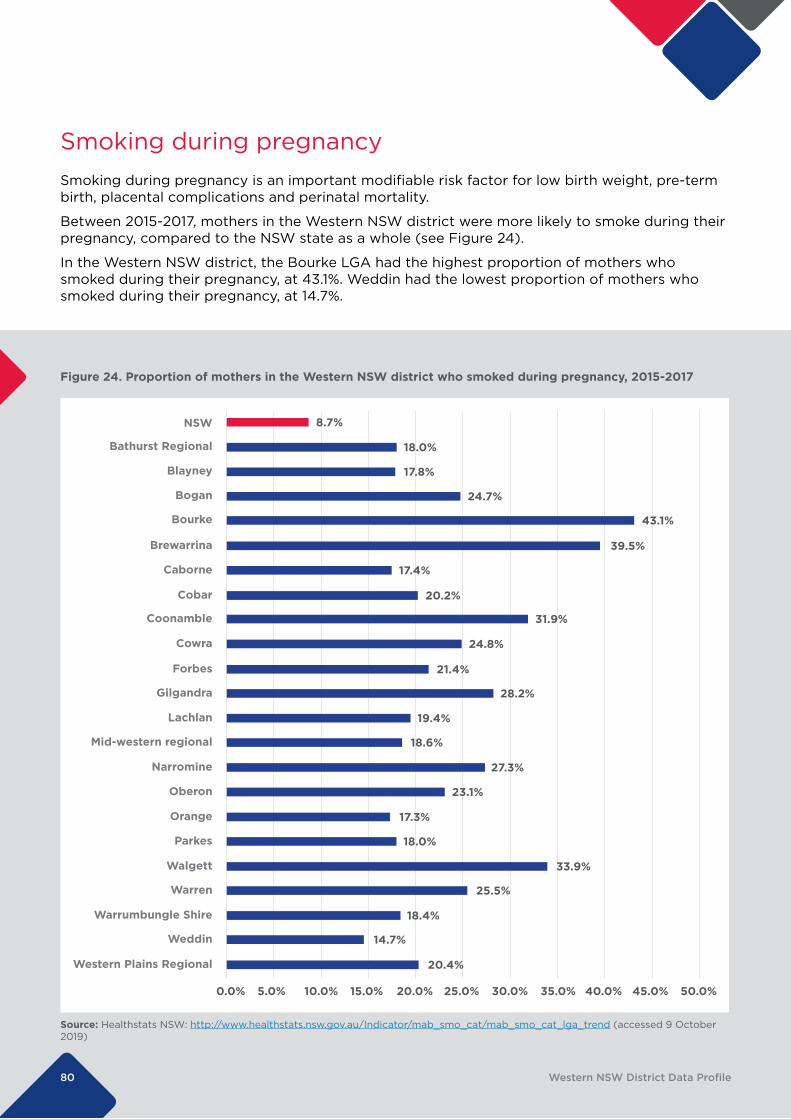
80 Western NSW District Data Profile
Figure 24. Proportion of mothers in the Western NSW district who smoked during pregnancy, 2015-2017
Source: Healthstats NSW: http://www.healthstats.nsw.gov.au/Indicator/mab_smo_cat/mab_smo_cat_lga_trend (accessed 9 October 2019)
0.0% 5.0% 10.0% 15.0% 20.0% 25.0% 30.0% 35.0% 40.0% 45.0% 50.0%
8.7%NSW
18.0%Bathurst Regional
17.8%Blayney
24.7%Bogan
43.1%Bourke
39.5%Brewarrina
17.4%Caborne
20.2%Cobar
31.9%Coonamble
24.8%Cowra
21.4%Forbes
28.2%Gilgandra
19.4%Lachlan
18.6%Mid-western regional
27.3%Narromine
23.1%Oberon
17.3%Orange
18.0%Parkes
33.9%Walgett
25.5%Warren
18.4%Warrumbungle Shire
14.7%Weddin
20.4%Western Plains Regional
Smoking during pregnancySmoking during pregnancy is an important modifiable risk factor for low birth weight, pre-term birth, placental complications and perinatal mortality.
Between 2015-2017, mothers in the Western NSW district were more likely to smoke during their pregnancy, compared to the NSW state as a whole (see Figure 24).
In the Western NSW district, the Bourke LGA had the highest proportion of mothers who smoked during their pregnancy, at 43.1%. Weddin had the lowest proportion of mothers who smoked during their pregnancy, at 14.7%.
81 Western NSW District Data Profile
Australian Mothers IndexSince 2000, Save the Children has produced a Mother’s Index showing where mothers do best and where they face the greatest hardships. This index compares countries worldwide, as well as Australian states and territories and LGAs.
The information in Table 20 is derived from the Local-level Mothers Index. Five indicators make up this index:
• maternal health - the proportion of pregnant women with at least one antenatal visit in the first trimester
• children’s wellbeing - the proportion of children under 5 developmentally on track (measured by the AEDC)
• educational status - the proportion of women completing Year 12 or above
• economic status - average household income
• relative socioeconomic disadvantage - a measure of a mother’s access to material and social resources and her ability to participate in society.
These indicators were used to rank every LGA in NSW, where 1 is the best rank and 152 is the worst.
Bathurst Regional performed the best out of the 22 LGAs in the Western NSW district, receiving a rank of 44 out of 152 (see Table 20). Brewarrina received the lowest rank of the twenty-two LGAs, at 151 out of 152. This means that mothers in Brewarrina are facing much greater hardships than mothers in Bathurst Regional.
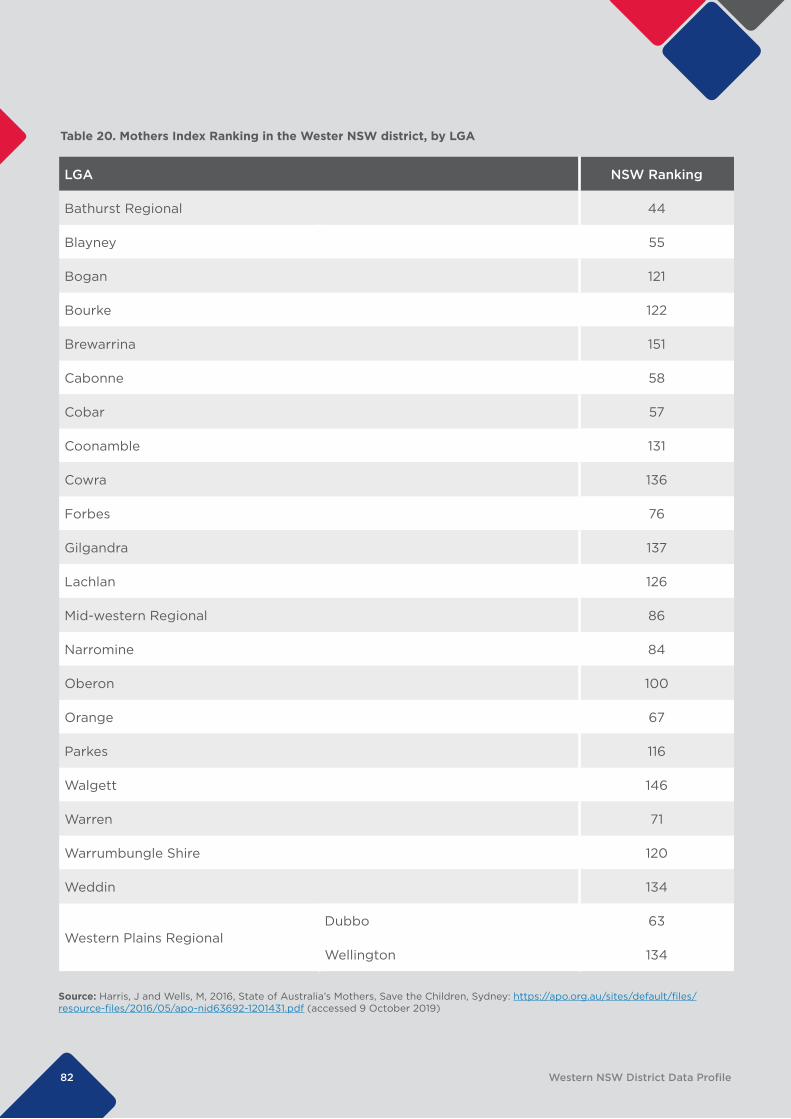
82 Western NSW District Data Profile
Table 20. Mothers Index Ranking in the Wester NSW district, by LGA
LGA NSW Ranking
Bathurst Regional 44
Blayney 55
Bogan 121
Bourke 122
Brewarrina 151
Cabonne 58
Cobar 57
Coonamble 131
Cowra 136
Forbes 76
Gilgandra 137
Lachlan 126
Mid-western Regional 86
Narromine 84
Oberon 100
Orange 67
Parkes 116
Walgett 146
Warren 71
Warrumbungle Shire 120
Weddin 134
Western Plains RegionalDubbo 63
Wellington 134
Source: Harris, J and Wells, M, 2016, State of Australia’s Mothers, Save the Children, Sydney: https://apo.org.au/sites/default/files/resource-files/2016/05/apo-nid63692-1201431.pdf (accessed 9 October 2019)
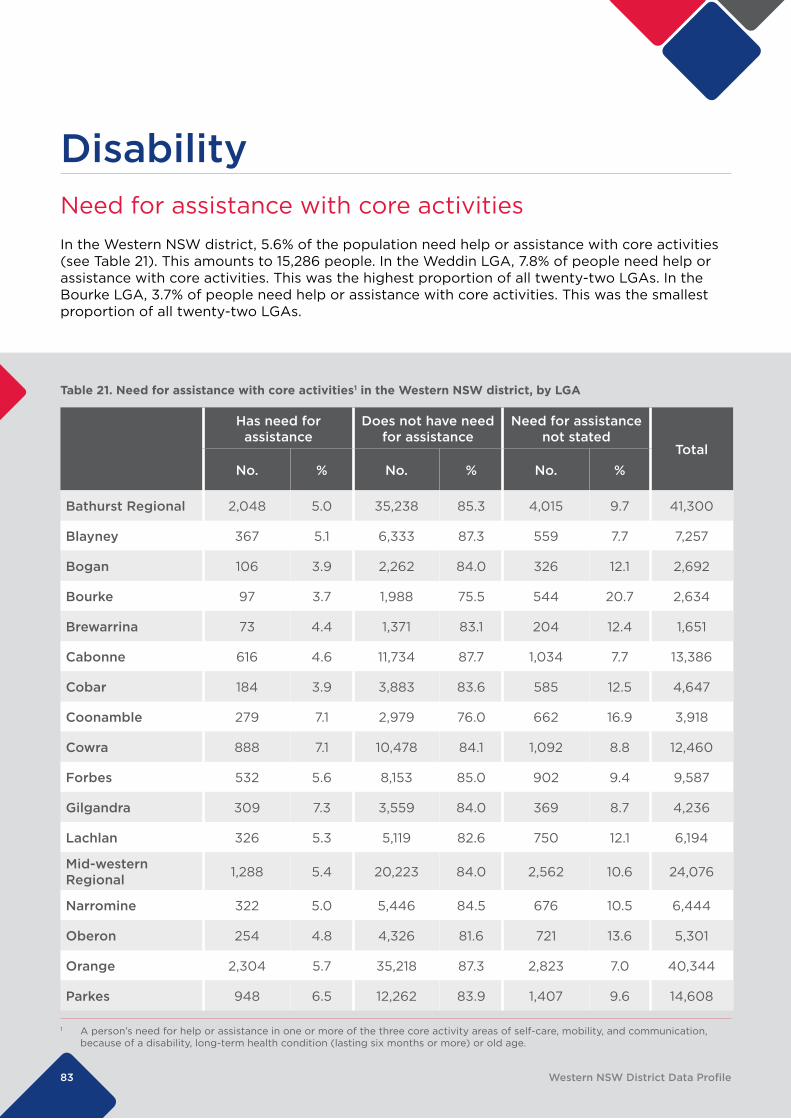
83 Western NSW District Data Profile
Table 21. Need for assistance with core activities1 in the Western NSW district, by LGA
1 A person’s need for help or assistance in one or more of the three core activity areas of self-care, mobility, and communication, because of a disability, long-term health condition (lasting six months or more) or old age.
Has need for assistance
Does not have need for assistance
Need for assistance not stated
TotalNo. % No. % No. %
Bathurst Regional 2,048 5.0 35,238 85.3 4,015 9.7 41,300
Blayney 367 5.1 6,333 87.3 559 7.7 7,257
Bogan 106 3.9 2,262 84.0 326 12.1 2,692
Bourke 97 3.7 1,988 75.5 544 20.7 2,634
Brewarrina 73 4.4 1,371 83.1 204 12.4 1,651
Cabonne 616 4.6 11,734 87.7 1,034 7.7 13,386
Cobar 184 3.9 3,883 83.6 585 12.5 4,647
Coonamble 279 7.1 2,979 76.0 662 16.9 3,918
Cowra 888 7.1 10,478 84.1 1,092 8.8 12,460
Forbes 532 5.6 8,153 85.0 902 9.4 9,587
Gilgandra 309 7.3 3,559 84.0 369 8.7 4,236
Lachlan 326 5.3 5,119 82.6 750 12.1 6,194
Mid-western Regional 1,288 5.4 20,223 84.0 2,562 10.6 24,076
Narromine 322 5.0 5,446 84.5 676 10.5 6,444
Oberon 254 4.8 4,326 81.6 721 13.6 5,301
Orange 2,304 5.7 35,218 87.3 2,823 7.0 40,344
Parkes 948 6.5 12,262 83.9 1,407 9.6 14,608
DisabilityNeed for assistance with core activities In the Western NSW district, 5.6% of the population need help or assistance with core activities (see Table 21). This amounts to 15,286 people. In the Weddin LGA, 7.8% of people need help or assistance with core activities. This was the highest proportion of all twenty-two LGAs. In the Bourke LGA, 3.7% of people need help or assistance with core activities. This was the smallest proportion of all twenty-two LGAs.
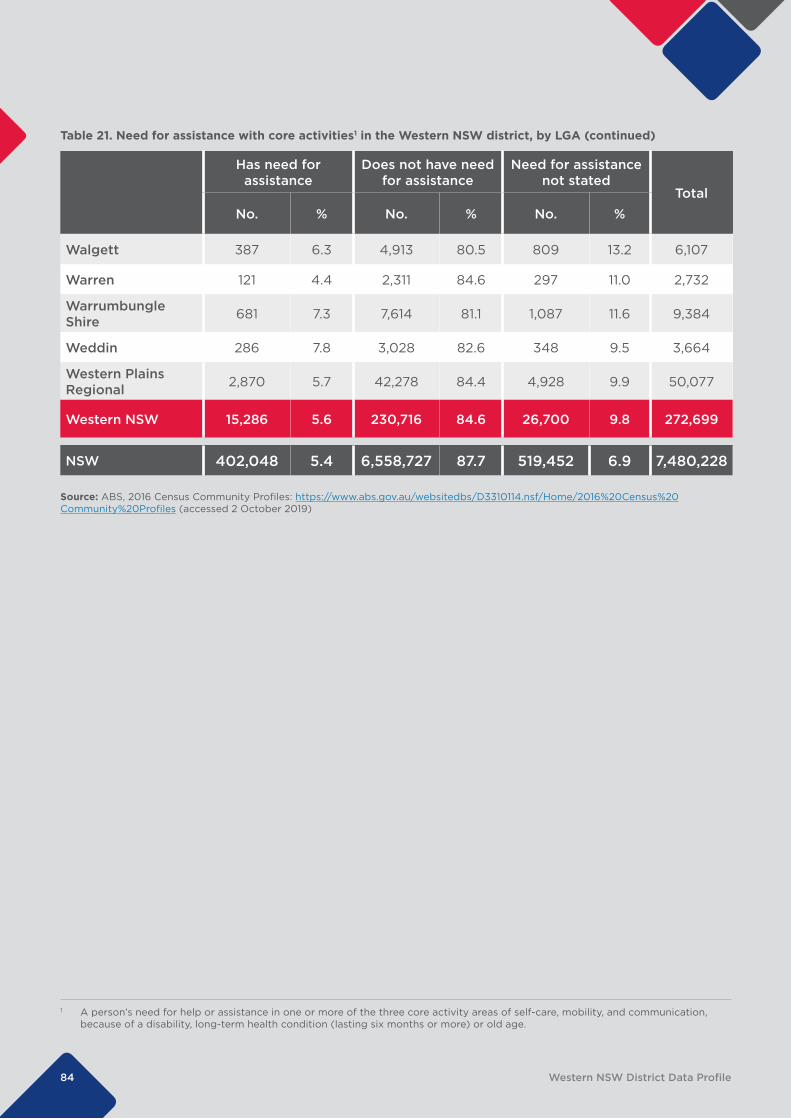
84 Western NSW District Data Profile
Table 21. Need for assistance with core activities1 in the Western NSW district, by LGA (continued)
1 A person’s need for help or assistance in one or more of the three core activity areas of self-care, mobility, and communication, because of a disability, long-term health condition (lasting six months or more) or old age.
Has need for assistance
Does not have need for assistance
Need for assistance not stated
TotalNo. % No. % No. %
Walgett 387 6.3 4,913 80.5 809 13.2 6,107
Warren 121 4.4 2,311 84.6 297 11.0 2,732
Warrumbungle Shire 681 7.3 7,614 81.1 1,087 11.6 9,384
Weddin 286 7.8 3,028 82.6 348 9.5 3,664
Western Plains Regional 2,870 5.7 42,278 84.4 4,928 9.9 50,077
Western NSW 15,286 5.6 230,716 84.6 26,700 9.8 272,699
NSW 402,048 5.4 6,558,727 87.7 519,452 6.9 7,480,228
Source: ABS, 2016 Census Community Profiles: https://www.abs.gov.au/websitedbs/D3310114.nsf/Home/2016%20Census%20Community%20Profiles (accessed 2 October 2019)
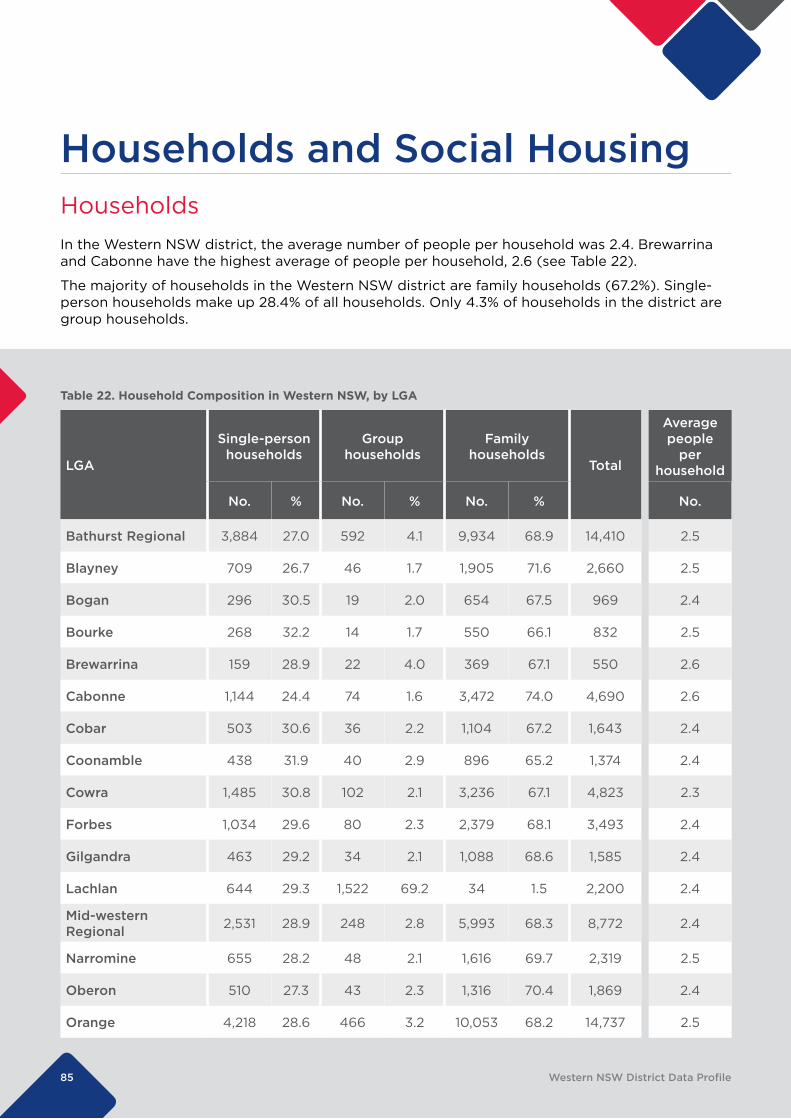
85 Western NSW District Data Profile
Table 22. Household Composition in Western NSW, by LGA
LGA
Single-person households
Group households
Family households
Total
Average people
per household
No. % No. % No. % No.
Bathurst Regional 3,884 27.0 592 4.1 9,934 68.9 14,410 2.5
Blayney 709 26.7 46 1.7 1,905 71.6 2,660 2.5
Bogan 296 30.5 19 2.0 654 67.5 969 2.4
Bourke 268 32.2 14 1.7 550 66.1 832 2.5
Brewarrina 159 28.9 22 4.0 369 67.1 550 2.6
Cabonne 1,144 24.4 74 1.6 3,472 74.0 4,690 2.6
Cobar 503 30.6 36 2.2 1,104 67.2 1,643 2.4
Coonamble 438 31.9 40 2.9 896 65.2 1,374 2.4
Cowra 1,485 30.8 102 2.1 3,236 67.1 4,823 2.3
Forbes 1,034 29.6 80 2.3 2,379 68.1 3,493 2.4
Gilgandra 463 29.2 34 2.1 1,088 68.6 1,585 2.4
Lachlan 644 29.3 1,522 69.2 34 1.5 2,200 2.4
Mid-western Regional 2,531 28.9 248 2.8 5,993 68.3 8,772 2.4
Narromine 655 28.2 48 2.1 1,616 69.7 2,319 2.5
Oberon 510 27.3 43 2.3 1,316 70.4 1,869 2.4
Orange 4,218 28.6 466 3.2 10,053 68.2 14,737 2.5
Households and Social Housing Households In the Western NSW district, the average number of people per household was 2.4. Brewarrina and Cabonne have the highest average of people per household, 2.6 (see Table 22).
The majority of households in the Western NSW district are family households (67.2%). Single-person households make up 28.4% of all households. Only 4.3% of households in the district are group households.
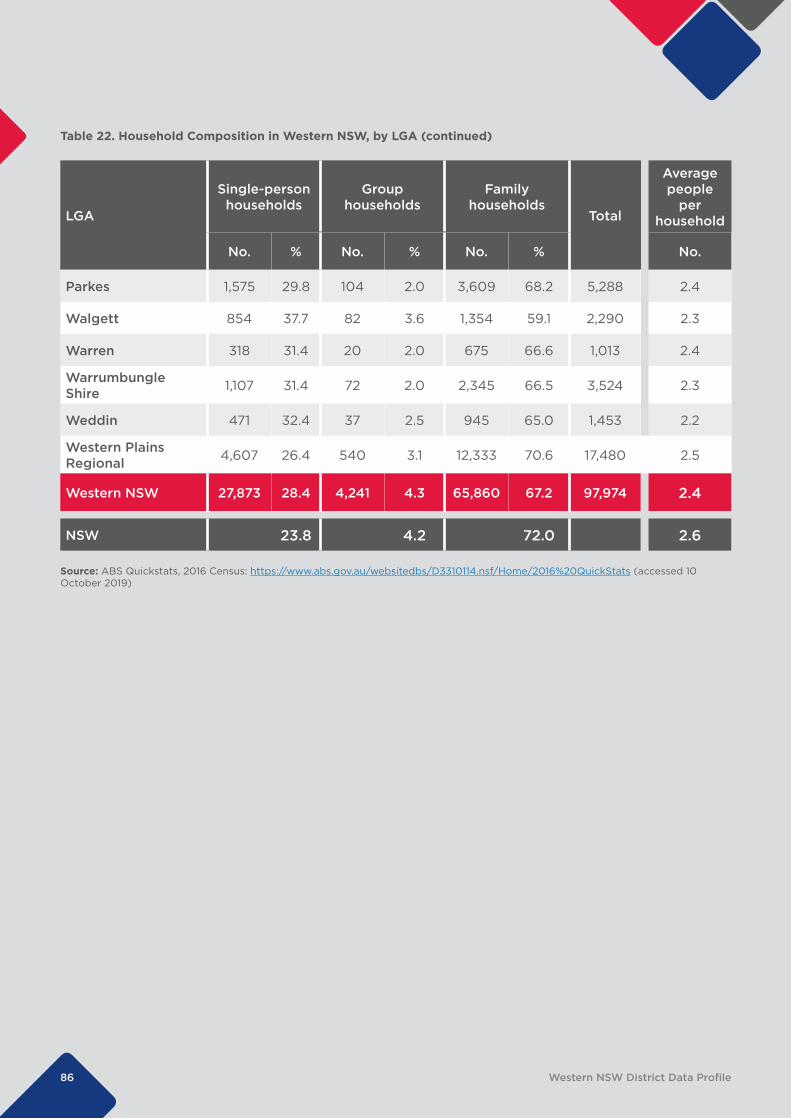
86 Western NSW District Data Profile
LGA
Single-person households
Group households
Family households
Total
Average people
per household
No. % No. % No. % No.
Parkes 1,575 29.8 104 2.0 3,609 68.2 5,288 2.4
Walgett 854 37.7 82 3.6 1,354 59.1 2,290 2.3
Warren 318 31.4 20 2.0 675 66.6 1,013 2.4
Warrumbungle Shire 1,107 31.4 72 2.0 2,345 66.5 3,524 2.3
Weddin 471 32.4 37 2.5 945 65.0 1,453 2.2
Western Plains Regional 4,607 26.4 540 3.1 12,333 70.6 17,480 2.5
Western NSW 27,873 28.4 4,241 4.3 65,860 67.2 97,974 2.4
NSW 23.8 4.2 72.0 2.6
Table 22. Household Composition in Western NSW, by LGA (continued)
Source: ABS Quickstats, 2016 Census: https://www.abs.gov.au/websitedbs/D3310114.nsf/Home/2016%20QuickStats (accessed 10 October 2019)
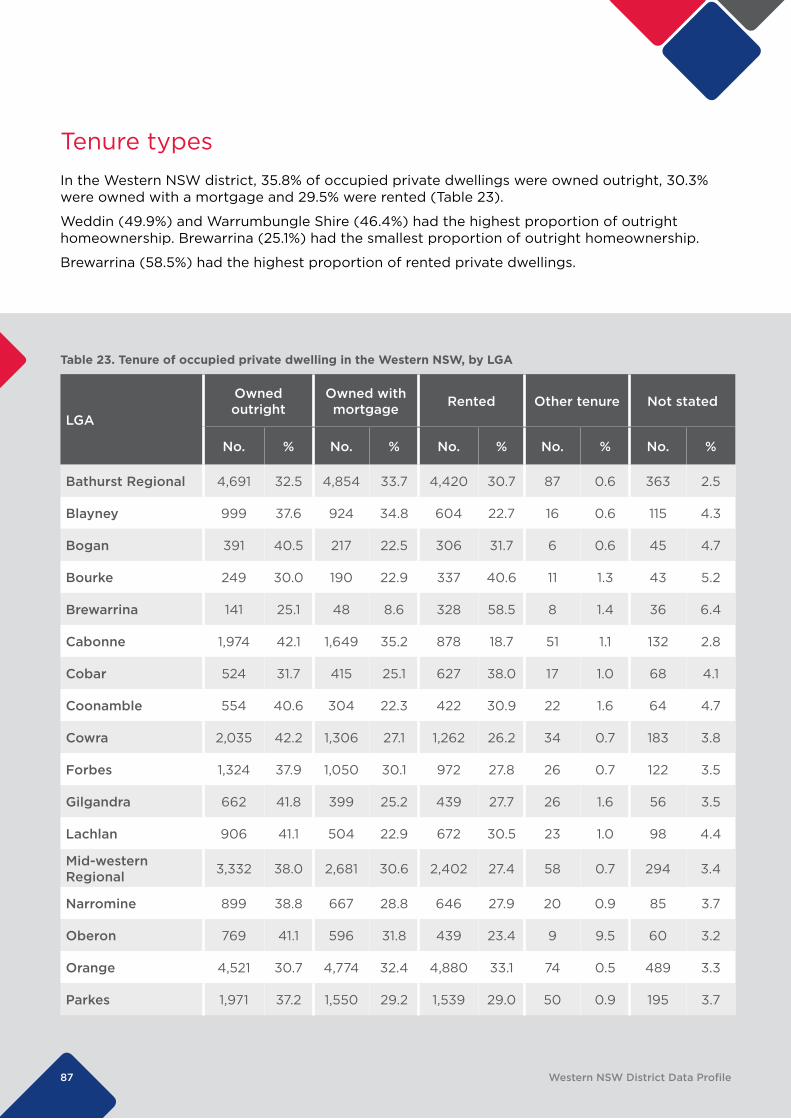
87 Western NSW District Data Profile
Table 23. Tenure of occupied private dwelling in the Western NSW, by LGA
LGA
Owned outright
Owned with mortgage Rented Other tenure Not stated
No. % No. % No. % No. % No. %
Bathurst Regional 4,691 32.5 4,854 33.7 4,420 30.7 87 0.6 363 2.5
Blayney 999 37.6 924 34.8 604 22.7 16 0.6 115 4.3
Bogan 391 40.5 217 22.5 306 31.7 6 0.6 45 4.7
Bourke 249 30.0 190 22.9 337 40.6 11 1.3 43 5.2
Brewarrina 141 25.1 48 8.6 328 58.5 8 1.4 36 6.4
Cabonne 1,974 42.1 1,649 35.2 878 18.7 51 1.1 132 2.8
Cobar 524 31.7 415 25.1 627 38.0 17 1.0 68 4.1
Coonamble 554 40.6 304 22.3 422 30.9 22 1.6 64 4.7
Cowra 2,035 42.2 1,306 27.1 1,262 26.2 34 0.7 183 3.8
Forbes 1,324 37.9 1,050 30.1 972 27.8 26 0.7 122 3.5
Gilgandra 662 41.8 399 25.2 439 27.7 26 1.6 56 3.5
Lachlan 906 41.1 504 22.9 672 30.5 23 1.0 98 4.4
Mid-western Regional 3,332 38.0 2,681 30.6 2,402 27.4 58 0.7 294 3.4
Narromine 899 38.8 667 28.8 646 27.9 20 0.9 85 3.7
Oberon 769 41.1 596 31.8 439 23.4 9 9.5 60 3.2
Orange 4,521 30.7 4,774 32.4 4,880 33.1 74 0.5 489 3.3
Parkes 1,971 37.2 1,550 29.2 1,539 29.0 50 0.9 195 3.7
Tenure typesIn the Western NSW district, 35.8% of occupied private dwellings were owned outright, 30.3% were owned with a mortgage and 29.5% were rented (Table 23).
Weddin (49.9%) and Warrumbungle Shire (46.4%) had the highest proportion of outright homeownership. Brewarrina (25.1%) had the smallest proportion of outright homeownership.
Brewarrina (58.5%) had the highest proportion of rented private dwellings.
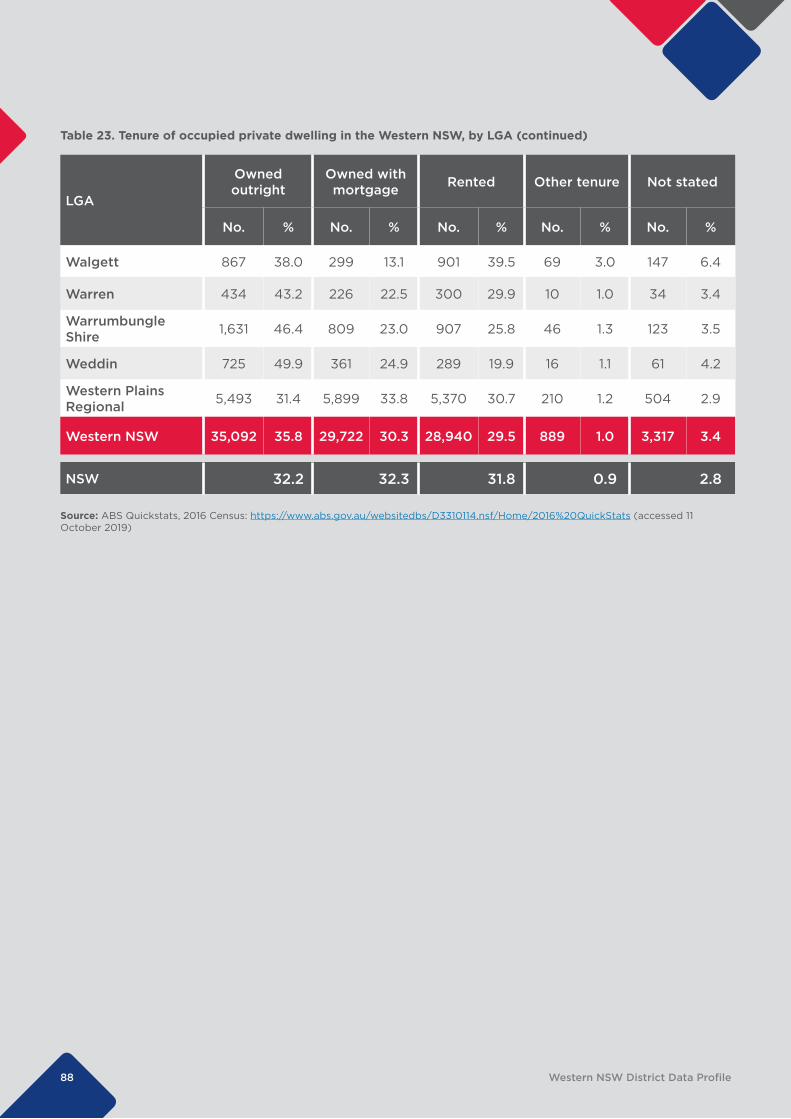
88 Western NSW District Data Profile
Table 23. Tenure of occupied private dwelling in the Western NSW, by LGA (continued)
LGA
Owned outright
Owned with mortgage Rented Other tenure Not stated
No. % No. % No. % No. % No. %
Walgett 867 38.0 299 13.1 901 39.5 69 3.0 147 6.4
Warren 434 43.2 226 22.5 300 29.9 10 1.0 34 3.4
Warrumbungle Shire 1,631 46.4 809 23.0 907 25.8 46 1.3 123 3.5
Weddin 725 49.9 361 24.9 289 19.9 16 1.1 61 4.2
Western Plains Regional 5,493 31.4 5,899 33.8 5,370 30.7 210 1.2 504 2.9
Western NSW 35,092 35.8 29,722 30.3 28,940 29.5 889 1.0 3,317 3.4
NSW 32.2 32.3 31.8 0.9 2.8
Source: ABS Quickstats, 2016 Census: https://www.abs.gov.au/websitedbs/D3310114.nsf/Home/2016%20QuickStats (accessed 11 October 2019)
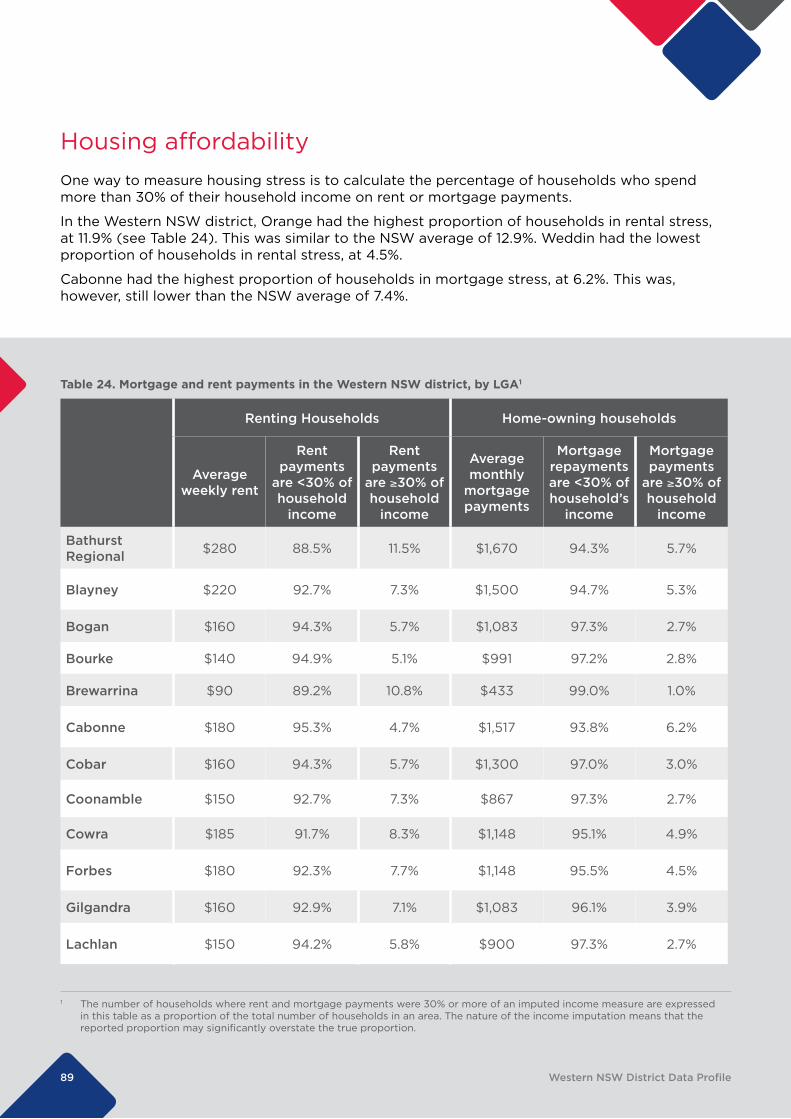
89 Western NSW District Data Profile
Table 24. Mortgage and rent payments in the Western NSW district, by LGA1
1 The number of households where rent and mortgage payments were 30% or more of an imputed income measure are expressed in this table as a proportion of the total number of households in an area. The nature of the income imputation means that the reported proportion may significantly overstate the true proportion.
Renting Households Home-owning households
Average weekly rent
Rent payments
are <30% of household
income
Rent payments
are ≥30% of household
income
Average monthly
mortgage payments
Mortgage repayments are <30% of household’s
income
Mortgage payments
are ≥30% of household
income
Bathurst Regional $280 88.5% 11.5% $1,670 94.3% 5.7%
Blayney $220 92.7% 7.3% $1,500 94.7% 5.3%
Bogan $160 94.3% 5.7% $1,083 97.3% 2.7%
Bourke $140 94.9% 5.1% $991 97.2% 2.8%
Brewarrina $90 89.2% 10.8% $433 99.0% 1.0%
Cabonne $180 95.3% 4.7% $1,517 93.8% 6.2%
Cobar $160 94.3% 5.7% $1,300 97.0% 3.0%
Coonamble $150 92.7% 7.3% $867 97.3% 2.7%
Cowra $185 91.7% 8.3% $1,148 95.1% 4.9%
Forbes $180 92.3% 7.7% $1,148 95.5% 4.5%
Gilgandra $160 92.9% 7.1% $1,083 96.1% 3.9%
Lachlan $150 94.2% 5.8% $900 97.3% 2.7%
Housing affordabilityOne way to measure housing stress is to calculate the percentage of households who spend more than 30% of their household income on rent or mortgage payments.
In the Western NSW district, Orange had the highest proportion of households in rental stress, at 11.9% (see Table 24). This was similar to the NSW average of 12.9%. Weddin had the lowest proportion of households in rental stress, at 4.5%.
Cabonne had the highest proportion of households in mortgage stress, at 6.2%. This was, however, still lower than the NSW average of 7.4%.
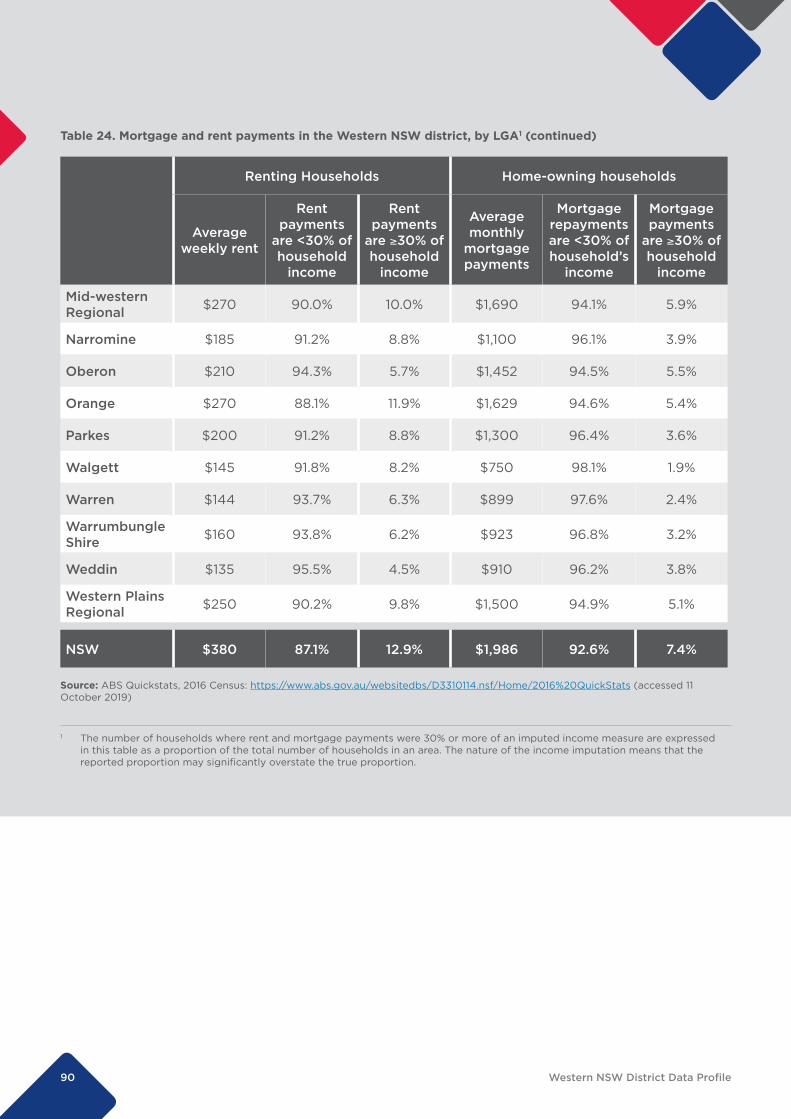
90 Western NSW District Data Profile
Table 24. Mortgage and rent payments in the Western NSW district, by LGA1 (continued)
1 The number of households where rent and mortgage payments were 30% or more of an imputed income measure are expressed in this table as a proportion of the total number of households in an area. The nature of the income imputation means that the reported proportion may significantly overstate the true proportion.
Renting Households Home-owning households
Average weekly rent
Rent payments
are <30% of household
income
Rent payments
are ≥30% of household
income
Average monthly
mortgage payments
Mortgage repayments are <30% of household’s
income
Mortgage payments
are ≥30% of household
income
Mid-western Regional $270 90.0% 10.0% $1,690 94.1% 5.9%
Narromine $185 91.2% 8.8% $1,100 96.1% 3.9%
Oberon $210 94.3% 5.7% $1,452 94.5% 5.5%
Orange $270 88.1% 11.9% $1,629 94.6% 5.4%
Parkes $200 91.2% 8.8% $1,300 96.4% 3.6%
Walgett $145 91.8% 8.2% $750 98.1% 1.9%
Warren $144 93.7% 6.3% $899 97.6% 2.4%
Warrumbungle Shire $160 93.8% 6.2% $923 96.8% 3.2%
Weddin $135 95.5% 4.5% $910 96.2% 3.8%
Western Plains Regional $250 90.2% 9.8% $1,500 94.9% 5.1%
NSW $380 87.1% 12.9% $1,986 92.6% 7.4%
Source: ABS Quickstats, 2016 Census: https://www.abs.gov.au/websitedbs/D3310114.nsf/Home/2016%20QuickStats (accessed 11 October 2019)
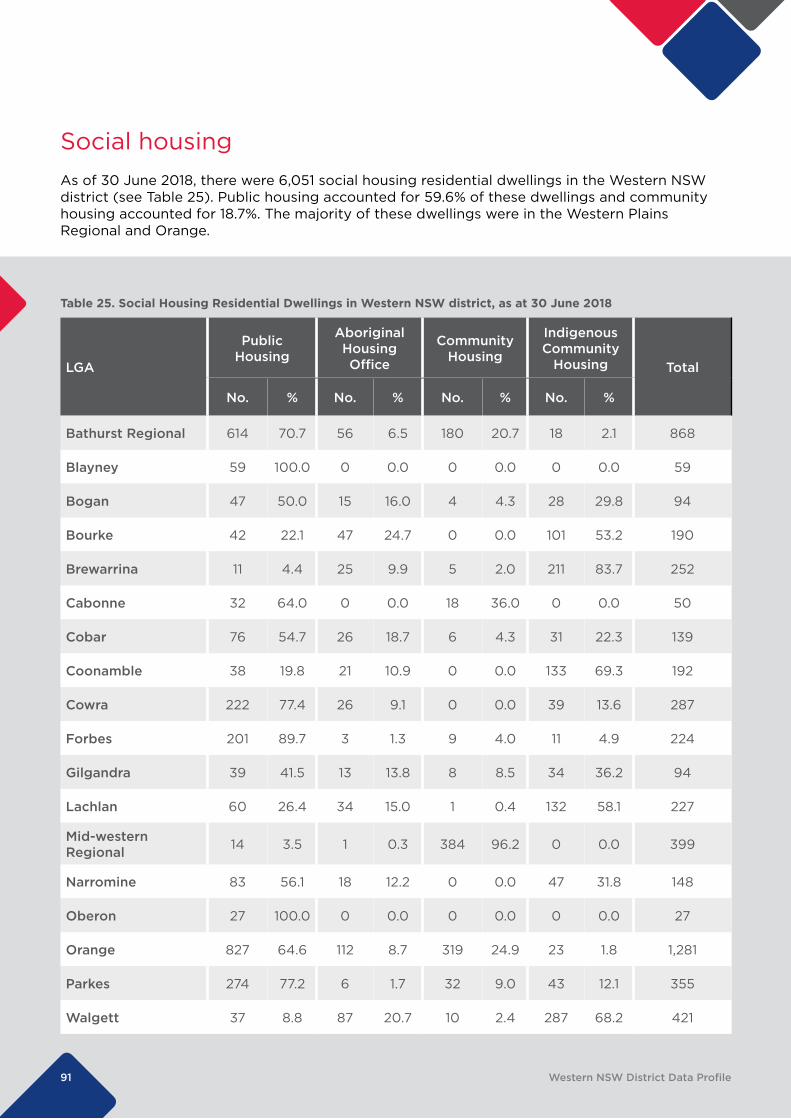
91 Western NSW District Data Profile
Social housingAs of 30 June 2018, there were 6,051 social housing residential dwellings in the Western NSW district (see Table 25). Public housing accounted for 59.6% of these dwellings and community housing accounted for 18.7%. The majority of these dwellings were in the Western Plains Regional and Orange.
Table 25. Social Housing Residential Dwellings in Western NSW district, as at 30 June 2018
LGA
Public Housing
Aboriginal Housing Office
Community Housing
Indigenous Community
Housing Total
No. % No. % No. % No. %
Bathurst Regional 614 70.7 56 6.5 180 20.7 18 2.1 868
Blayney 59 100.0 0 0.0 0 0.0 0 0.0 59
Bogan 47 50.0 15 16.0 4 4.3 28 29.8 94
Bourke 42 22.1 47 24.7 0 0.0 101 53.2 190
Brewarrina 11 4.4 25 9.9 5 2.0 211 83.7 252
Cabonne 32 64.0 0 0.0 18 36.0 0 0.0 50
Cobar 76 54.7 26 18.7 6 4.3 31 22.3 139
Coonamble 38 19.8 21 10.9 0 0.0 133 69.3 192
Cowra 222 77.4 26 9.1 0 0.0 39 13.6 287
Forbes 201 89.7 3 1.3 9 4.0 11 4.9 224
Gilgandra 39 41.5 13 13.8 8 8.5 34 36.2 94
Lachlan 60 26.4 34 15.0 1 0.4 132 58.1 227
Mid-western Regional 14 3.5 1 0.3 384 96.2 0 0.0 399
Narromine 83 56.1 18 12.2 0 0.0 47 31.8 148
Oberon 27 100.0 0 0.0 0 0.0 0 0.0 27
Orange 827 64.6 112 8.7 319 24.9 23 1.8 1,281
Parkes 274 77.2 6 1.7 32 9.0 43 12.1 355
Walgett 37 8.8 87 20.7 10 2.4 287 68.2 421
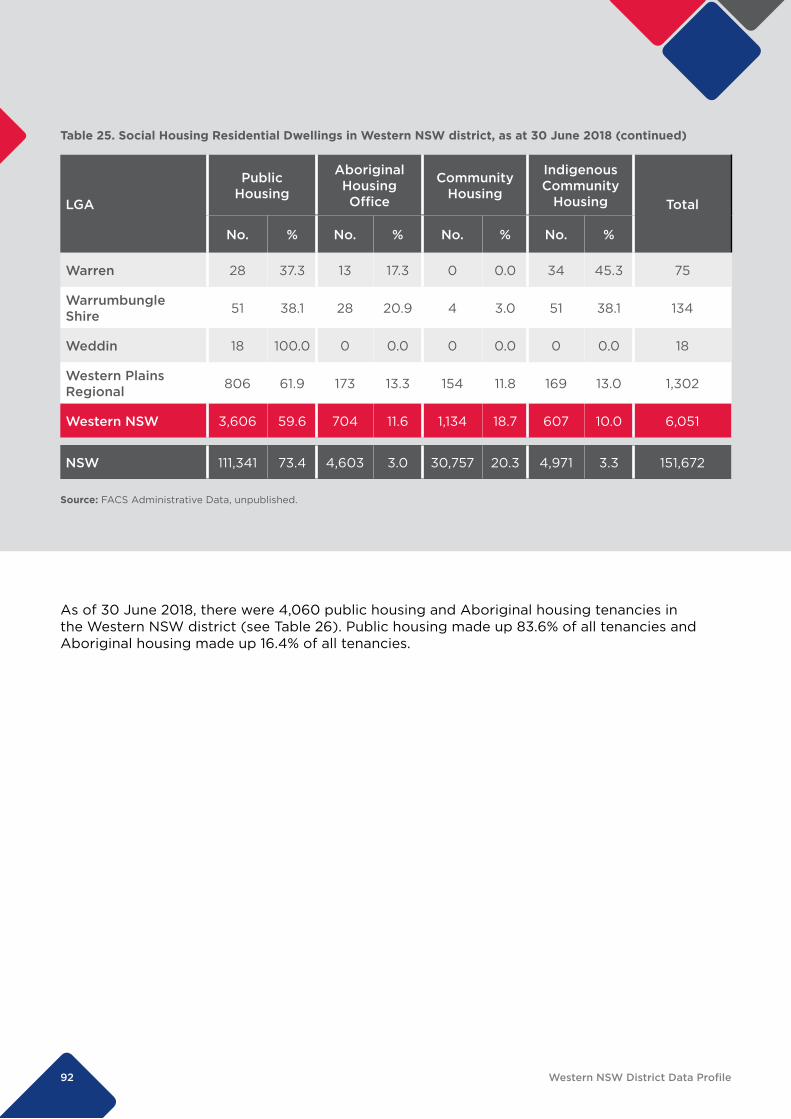
92 Western NSW District Data Profile
Table 25. Social Housing Residential Dwellings in Western NSW district, as at 30 June 2018 (continued)
LGA
Public Housing
Aboriginal Housing Office
Community Housing
Indigenous Community
Housing Total
No. % No. % No. % No. %
Warren 28 37.3 13 17.3 0 0.0 34 45.3 75
Warrumbungle Shire 51 38.1 28 20.9 4 3.0 51 38.1 134
Weddin 18 100.0 0 0.0 0 0.0 0 0.0 18
Western Plains Regional 806 61.9 173 13.3 154 11.8 169 13.0 1,302
Western NSW 3,606 59.6 704 11.6 1,134 18.7 607 10.0 6,051
NSW 111,341 73.4 4,603 3.0 30,757 20.3 4,971 3.3 151,672
Source: FACS Administrative Data, unpublished.
As of 30 June 2018, there were 4,060 public housing and Aboriginal housing tenancies in the Western NSW district (see Table 26). Public housing made up 83.6% of all tenancies and Aboriginal housing made up 16.4% of all tenancies.
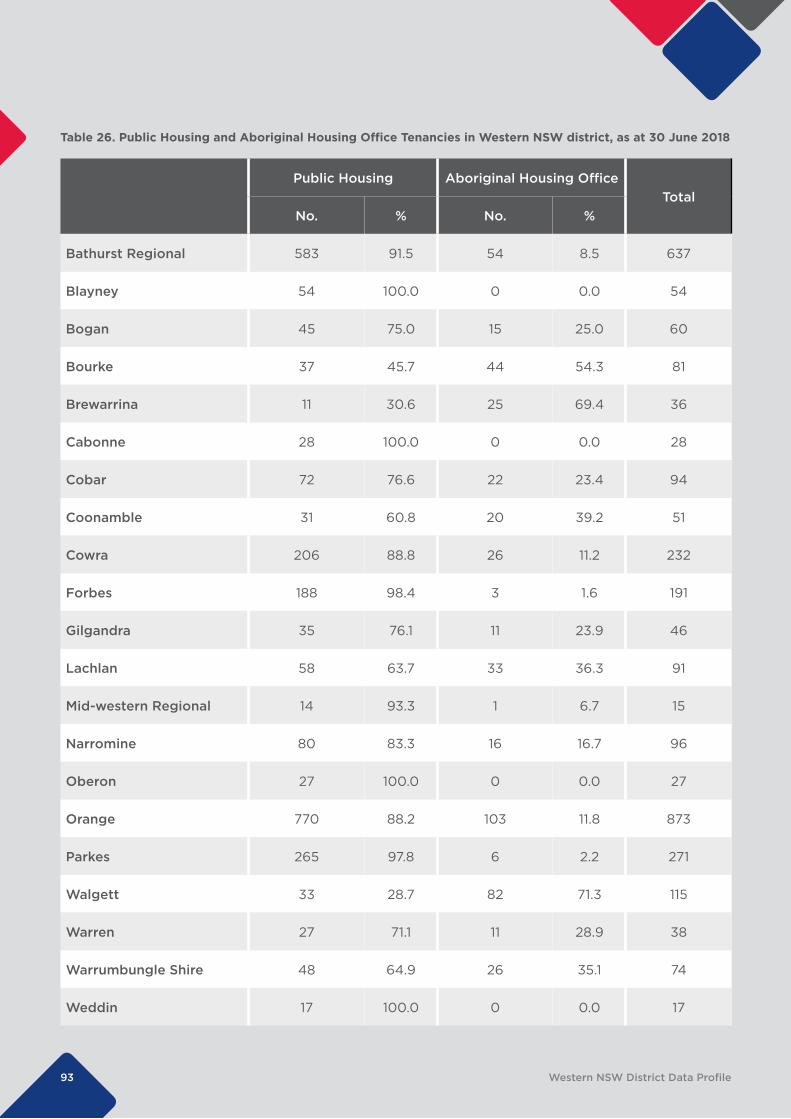
93 Western NSW District Data Profile
Table 26. Public Housing and Aboriginal Housing Office Tenancies in Western NSW district, as at 30 June 2018
Public Housing Aboriginal Housing OfficeTotal
No. % No. %
Bathurst Regional 583 91.5 54 8.5 637
Blayney 54 100.0 0 0.0 54
Bogan 45 75.0 15 25.0 60
Bourke 37 45.7 44 54.3 81
Brewarrina 11 30.6 25 69.4 36
Cabonne 28 100.0 0 0.0 28
Cobar 72 76.6 22 23.4 94
Coonamble 31 60.8 20 39.2 51
Cowra 206 88.8 26 11.2 232
Forbes 188 98.4 3 1.6 191
Gilgandra 35 76.1 11 23.9 46
Lachlan 58 63.7 33 36.3 91
Mid-western Regional 14 93.3 1 6.7 15
Narromine 80 83.3 16 16.7 96
Oberon 27 100.0 0 0.0 27
Orange 770 88.2 103 11.8 873
Parkes 265 97.8 6 2.2 271
Walgett 33 28.7 82 71.3 115
Warren 27 71.1 11 28.9 38
Warrumbungle Shire 48 64.9 26 35.1 74
Weddin 17 100.0 0 0.0 17
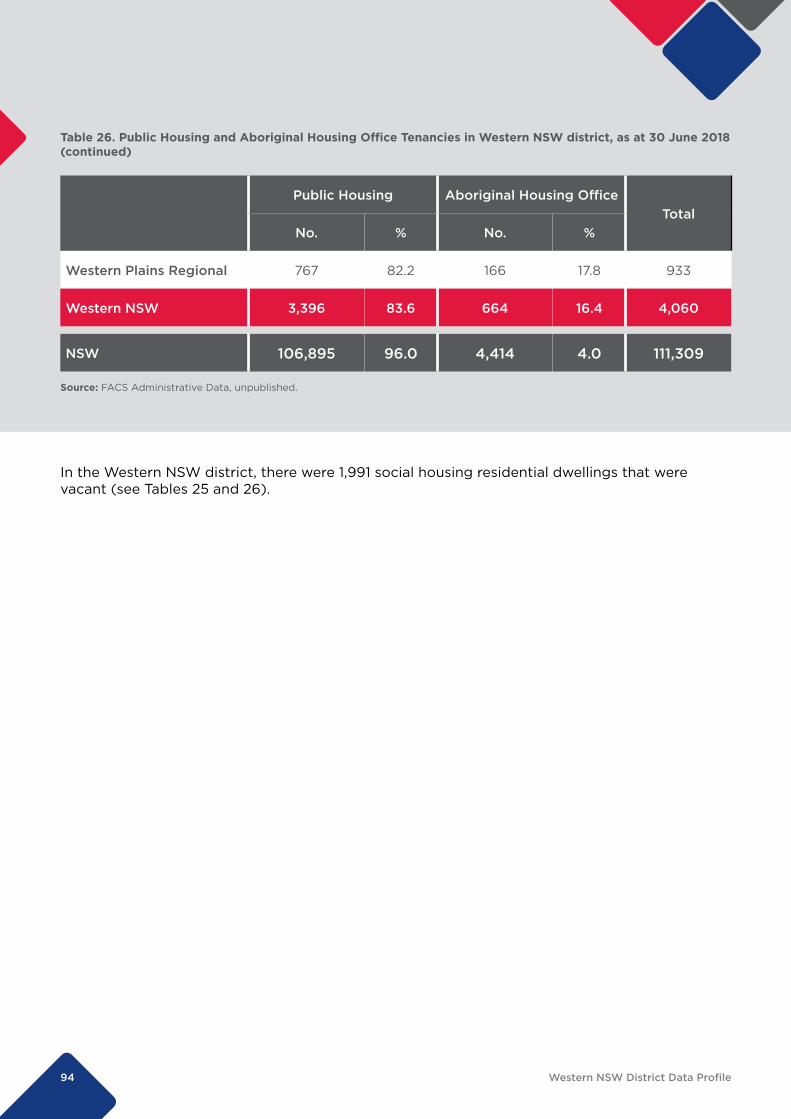
94 Western NSW District Data Profile
Table 26. Public Housing and Aboriginal Housing Office Tenancies in Western NSW district, as at 30 June 2018 (continued)
Public Housing Aboriginal Housing OfficeTotal
No. % No. %
Western Plains Regional 767 82.2 166 17.8 933
Western NSW 3,396 83.6 664 16.4 4,060
NSW 106,895 96.0 4,414 4.0 111,309
Source: FACS Administrative Data, unpublished.
In the Western NSW district, there were 1,991 social housing residential dwellings that were vacant (see Tables 25 and 26).