Embed Size (px)
Citation preview
Western North Pacific Tropical Cyclone Characteristics Stratified by Genesis Environment
HIRONORI FUDEYASU
Yokohama National University, Yokohama, Japan
RYUJI YOSHIDA
RIKEN Advanced Institute for Computational Science, and Research Center for
Urban Safety and Security, Kobe University, Kobe, Japan
(Manuscript received 25 April 2017, in final form 27 November 2017)
ABSTRACT
The characteristics of tropical cyclones (TCs) in the summer and autumn seasons over the western North
Pacific that are associated with different environmental factors that influence TC genesis (TCG)were studied.
The authors objectively categorized factors into the five TCG factors classified by Ritchie and Holland:
monsoon shear line (SL), monsoon confluence region (CR),monsoon gyre (GY), easterly wave (EW), and the
Rossby wave energy dispersion from a preexisting TC (PTC). The GY-TCs tended to develop slowly, and the
highest rates of occurrence of rapid intensification (RI) were found for the CR-TCs, whereas the GY-TCs
rarely experienced RI. The average storm size of the GY-TCs at the time of formation was the largest of the
averages among the TC types, while the EW- and PTC-TCs were smaller, although these differences dis-
appeared at the mature time. There were no significant differences in the sea surface temperature (SST)
beneath the TCs, but the tropical cyclone heat potential (TCHP) of the PTC-TCs was higher. The PTC-TCs
tended to develop as intense TCs and exhibited favorable environmental characteristics, such as high TCHP,
high convective available potential energy, and weak vertical shear. The occurrence rate of the PTC-TCs that
made landfall in the Philippines was higher than the averages of the other TC types, whereas those of the
EW-TCs (PTC-TCs) that made landfall in Japan (China) were lower. These results provide important in-
formation for use in disaster prevention.
1. Introduction
A tropical cyclone (TC) forms under large-scale en-
vironmental conditions favorable for cyclogenesis
(TCG), which are generally found where sea surface
temperatures (SSTs) exceed 268C and supportive large-
scale flow patterns coexist (Gray 1968, 1998). A large
body of research on the large-scale environmental con-
ditions favorable for TCG has been conducted (e.g.,
Emanuel and Nolan 2004; Camargo et al. 2007;
McGauley and Nolan 2011; Korty et al. 2012).
Ritchie and Holland (1999, hereafter RH99) statisti-
cally investigated the environments of 199 TCG cases
that occurred from 1984 to 1992 (excluding 1989) over
the western North Pacific (WNP). They classified large-
scale flow patterns in TCG into five factors: monsoon
shear line (SL), monsoon confluence region (CR),
monsoon gyre (GY), easterly wave (EW), and the
Rossby wave energy dispersion from a preexisting TC
(PTC). The SL is enhanced by the horizontal cyclonic
shear associated with the monsoon trough over the
WNP. The CR is mainly the zonal confluence zone be-
tween easterly trade winds and westerly monsoon winds
at the eastern extremity of themonsoon trough. TheGY
has been recognized as a synoptic-scale gyre embedded
within a developedmonsoon trough (Lander 1994; Chen
et al. 1996). These three factors (SL, CR, and GY) are
closely related to Asian monsoons over the WNP. Gray
(1968, 1998) reported that a monsoon trough is the most
favorable environment for TCG.
The EW is related to the synoptic-scale trade easterly
wind system. The trough of easterly trade winds pro-
vides an environment favorable for TCG (Heta 1990,
1991). The PTC is associated with a preexisting TC. A
mature TC disperses its energy as a Rossby wave in a
southeastward direction, and one of the low pressure
areas of the wave train sometimes develops into a TC
(McDonald 1998; Li and Fu 2006; Li et al. 2006). RH99
reported that the rate of occurrence of TCs controlled by
the five TCG factors were as follows: SL accounts forCorresponding author: H. Fudeyasu, [email protected]
FEBRUARY 2018 FUDEYASU AND YOSH IDA 435
DOI: 10.1175/MWR-D-17-0110.1
� 2018 American Meteorological Society. For information regarding reuse of this content and general copyright information, consult the AMS CopyrightPolicy (www.ametsoc.org/PUBSReuseLicenses).
42%, CR for 29%, GY for 3%, EW for 18%, and PTC
for 8%.
Yoshida and Ishikawa (2013; hereafter YI13), build-
ing on the results of RH99, developed a method of de-
tecting the environmental factors that contribute to TCG.
The TCG detection method could objectively categorize
TCG environments for each TC as one of the five factors
defined by RH99. YI13 further extended the analysis pe-
riod of TCG cases to 30 years, from 1979 to 2008. The
results of their detection were similar to those of RH99.
Differences in the environmental factors that con-
tribute to TCG could be considered as key determinants
of the characteristics of TCs. For example, the tracks of
TCs are greatly influenced by large-scale atmospheric
circulations in the lower–midtroposphere over the TC
life cycle, consisting of the Asian monsoon, midlatitude
westerly winds, and easterly trade winds. It is, thus,
possible that environmental factors influence not only
TCG, but also the direction of movement of TCs, af-
fecting the destination of the TC track. However, YI13
did not investigate the characteristics of TCs or the
differences in environmental conditions stratified by the
TCG environment.
This study revisited the dataset presented in YI13,
extended through 2013, and statistically investigated the
characteristics of TCs associated then with the environ-
mental factors that influence TCG using information from
best track data. The differences in the environmental
physical parameters of the factors that influence TCG and
affect the characteristics of TCs were also examined. The
purpose of this study was to investigate how the different
environmental factors contributing to TCG are related to
the characteristics of the resulting TC.
The remainder of this paper is organized as follows.
Section 2 introduces the methods of analysis. The sta-
tistical results are described in section 3. The influence of
environmental factors that contribute to TCG on the
characteristics of the resulting TCs are further discussed
in section 4. The major results are summarized in the
final section.
2. Methodology
a. TCG detection method
To separate TCG cases into categories influenced by
the different environmental factors defined by RH99,
the TCG detection method developed in YI13 was used
in this study. Using reanalysis data, YI13 defined the SL,
CR, GY, EW, and PTC with ‘‘contribution scores’’ for
the flow patterns as an objective algorithm. This paper
briefly reviews contribution scores SCRSL, SCRCR,
SCRGY, SCREW, and SCRPTC.
In YI13, the SL is identified as the location where the
sign of the 850-hPa zonal wind component changes from
negative on the northern side of the grid to positive on
the southern side. The score for SL is calculated as
follows:
SCRSL
5A
�›u
›y
�ave
exp(B3 dist) , (1)
where u is the zonal wind at the 850-hPa level, ‘‘dist’’
means the distance between the center grid of SL and
the location of TCG, and A and B are arbitrary con-
stants, with A 5 21.0 and B 5 21.0 3 1025 for SCRSL.
The location of each TCG was taken from the first re-
cord of the Joint TyphoonWarning Center (JTWC) best
track data (Chu et al. 2002). An upper limit of 1500km is
set for the distance, and the SL score is not calculated
when ‘‘dist’’ exceeds the upper limit.
The contribution scores for the CR and EW patterns
are defined as the border between westerly and easterly
zonal winds and as the intensity of the west–east shear of
the meridional winds near the trough, respectively.
These scores are calculated using the equations below:
SCRCR
5A
�›u
›x
�ave
exp(B3 dist) , (2)
SCREW
5A
�›y
›x
�ave
exp(B3dist) , (3)
where y is the meridional wind at the 850-hPa level,
and A and B are arbitrary constants, with A521.0 and
B 5 21.0 3 1025 for SCRCR and A 5 2.0 3 1021 and
B521.03 1022 for SCREW. An upper limit of 1500km
is set for the distance for SCRCR.
TheGYpattern is evaluated using the similarity of the
850-hPa wind field to a composite of typical GY cases
reported by Lander (1994), with the score for GY and
the degree of patternmatchingM determined as follows:
SCRGY
5 exp(2M)3 (z2 zstd) , (4)
M5 �ni
i50�nj
j50
ffiffiffiffiffiffiffiffiffiffiffiffiffiffiffiffiffiffiffiffiffiffiffiffiffiffiffiffiffiffiffiffiffiffiffiffi(C0
(i,j) 2 data0(i,j))2
q, (5)
where z is the relative vorticity, which is expressed as the
excess above the standard value zstd 521.03 1025. For
M [Eq. (5)], C0 is the model GY pattern sea level pres-
sure (SLP) field, data0 is the corresponding SLP field of a
given TCG case, i and j represent the horizontal grid,
and ni and nj are the width and length, respectively.
Based on the previous discussion (Li and Fu 2006; Li
et al. 2006), the contribution of PTC is estimated ac-
cording to the amplitude of the wave closest to the PTC
after searching for a preexisting TC northwest of the
436 MONTHLY WEATHER REV IEW VOLUME 146
TCG location. Once a preexisting TC is found, we
compute the amplitude of the first Fourier component
C2wv1 of SLP along the line connecting the preexisting TC
and TCG locations with the score for PTC, as follows:
SCRPTC
5C2wv1 . (6)
A lower limit of 1.01, derived by the empirical method, is
set for C2wv1.
Each score (SCRx) is finally normalized by its
maximum value [Max(SCRx)] and minimum value
[Min(SCRx)] derived in the latest 30 years, as follows:
SCRx5
SCRx2Min(SCR
x)
Max(SCRx)2Min(SCR
x). (7)
Along with the final scores after normalization, the
maximum contribution score is determined as the major
flow pattern contributing to the TCG, namely, the SL, CR,
GY, EW, and PTC.When themajor TCG factor could not
be determined by the TCG detection method, it was con-
sidered to be unclassified flow (UCF). See YI13 for the
specific details of the TCG detection method.
For the TCG detection method, this study used 850-
hPa wind and SLP derived from the Japanese 25-year
Reanalysis Project (JRA-25; Onogi et al. 2007) (http://
jra.kishou.go.jp/JRA-25/index_en.html). The JRA-25
was collected every 6h between 1979 and 2013, with a
horizontal resolution of 1.258 for both longitude and
latitude. The analysis period of this study was 35 years,
from 1979 to 2013, which is the same as the available
period of JRA-25. We extended the analysis period of
the TCG cases used in YI13, which investigated the
period of 1979 to 2008.
b. Data and environmental physical parameters
Although YI13 analyzed the TCG factors from all
TCs, including tropical depressions (TDs), this study
focused only on TCs of tropical storm (TS) or greater
intensity, that is, maximum 1-min sustained wind speed
in excess of 17.2m s21 or 34 kt. This study analyzed the
characteristics of TCs associated with each factor that
influences TCG using TC data derived from the In-
ternational Best Track Archive for Climate Stewardship
(IBTrACS; Knapp et al. 2010) at the time of TS for-
mation (TSF) and mature time. The time of TSF was
defined as the time when minimum TS intensity was
reached, and the mature time was defined as the time
when the maximum wind speed occurred. It should be
noted that the time of TSFwas usually different from the
time of TCG, which is the first record in the JTWC best
track data in YI13. This study focused on the time of
TSF and the mature time for two reasons: the charac-
teristics and conditions of TCs at both of these times are
important for disaster prevention and mitigation, and
both times were suitable for comparing the character-
istics of a TC among the different TCG factors.
For each factor that influences TCG, the relationship
between the average influence due to each factor and
the other factors was assessed at the 5% significance
level using a t test that indicates significant differences
versus all systems. For example, the average of the SL
was compared to the average influence of the other
factors, that is, the CR, GY, EW, PTC, and UCF.
This study also investigated the differences in the
environmental physical parameters among factors that
influence TCG: the magnitude of the vertical shear,
lower- and midtropospheric humidity, maximum po-
tential intensity (MPI; Emanuel 1986), convective
available potential energy (CAPE) derived from the
MPI equation, SST, tropical cyclone heat potential
(TCHP), depth of the 268C isotherm in the ocean, and
sea surface 100-m depth-averaged ocean temperature.
The magnitude of the vertical shear was defined as the
difference in horizontal winds between the 850- and
200-hPa levels, which were the averages of a 58 3 58 boxrelative to the center of the TC, using the JRA-25. The
lower- and midtropospheric humidities were defined as
the mixing ratio at the 850- and 500-hPa levels, re-
spectively, which were averages of a 58 3 58 box relativeto the TC center, using the JRA-25.
The information on the ocean was derived from the
three-dimensional variational-based parent domain
output from the Four-dimensional Variational Ocean
Reanalysis for the Western North Pacific (FORA-
WNP30; Usui et al. 2017; http://synthesis.jamstec.go.jp/
FORA/). The data have a horizontal resolution of 0.58for both longitude and latitude, with 54 vertical levels
from 0.5- to 6000-m depth and a 6-h time interval from
1982 to present. Using FORA-WNP30, the TCHP was
calculated by summing the ocean heat content from the
surface down to the depth of the 268C isotherm (Leipper
and Volgenau 1972; Wada 2015) as follows:
Q5Cp �Z26
z50
ri(T
i2 26)Dz
i, (8)
where Q is the TCHP value (J cm22), Cp is specific heat
at constant pressure, Ti is water temperature (8C), Dz is
water layer thickness, and r is the density of water. The
parameter Z26 is the depth (m) of the 268C isotherm.
Using the JRA-25 and FORA-WNP30, this study
examined the differences in the MPI and CAPE. The
MPI was proposed originally by Emanuel (1986), and
the MPI and CAPE revised by Bister and Emanuel
(1998) were used to account for dissipative heating. The
MPI and CAPE were calculated as averages of a 58 3 58
FEBRUARY 2018 FUDEYASU AND YOSH IDA 437
box relative to the TC center. Note that the SST was
used at the TC center to create distinct features stratified
by TCG environment.
The equivalent blackbody temperatures TBB, derived
from the merged IR channels from five geostationary
satellites of the Climate Prediction Center (http://www.
cpc.ncep.noaa.gov/products/global_precip/html/wpage.
merged_IR.shtml), were used to describe the cloud
features of TCs for each TCG factor. These data were
defined on a 4-km horizontal grid for every 1-h period.
3. Results
a. Genesis number and seasonal changes
The total number and percentage of TCs that reached
TS or greater intensity influenced by each environ-
mental factor over the analysis period from 1979 to 2013
were as follows: among the 874 TCs, the most frequent
influencing factor was SL (396 TCs, 46% of the total),
followed by CR (157 TCs, 18%) and EW (119 TCs,
14%). PTC (83 TCs) andGY (78 TCs) accounted for 9%
each, and UCF (41 TCs) accounted for 4%.
The seasonal changes in the formation of TCs influ-
enced by the five environmental factors and UCF were
also examined. The SL- andEW-TCs (hereafter, SL-TC,
EW-TC, and similar terms indicate a TC that formed
in a large-scale flow mainly associated with an SL, EW,
or similar factor) occurred throughout the year, whereas
the CR-, GY-, and PTC-TCs rarely occurred in winter
and spring. The number of the CR- and GY-TCs, which
are related to Asian monsoon activity, tended to in-
crease in the summer, while the PTC-TCs tended only to
occur in the summer and autumn, when many TCs were
formed. Seasonal changes in the number of the SL- and
EW-TCs, therefore, were less significant than changes in
the numbers of the CR-, GY-, and PTC-TCs. The sea-
sonality of the TCs of TS or greater intensity was similar
to that reported byYI13, who considered environmental
factors for all TCs, including TDs.
b. Tropical storm formation location
As shown in the previous section, seasonality in TCG
is different for TCs influenced by different environ-
mental factors. To compare the characteristics of a TC
among the different TCG factors correctly, this study
considered 677 TCG cases in the summer and autumn
seasons from June to November (Table 1), when any of
the influencing factors could occur frequently. Even
when the analysis period was limited in this way, the
proportional occurrence of the factors that influenced
TCGwas almost the same as the result obtained over the
whole period.
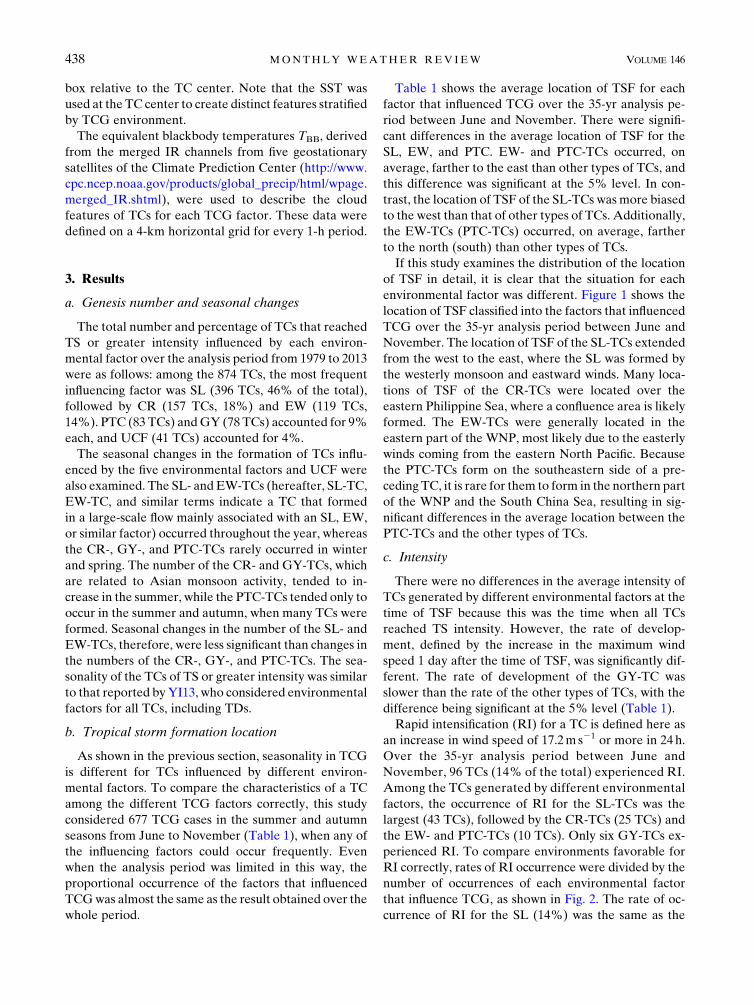
Table 1 shows the average location of TSF for each
factor that influenced TCG over the 35-yr analysis pe-
riod between June and November. There were signifi-
cant differences in the average location of TSF for the
SL, EW, and PTC. EW- and PTC-TCs occurred, on
average, farther to the east than other types of TCs, and
this difference was significant at the 5% level. In con-
trast, the location of TSF of the SL-TCs wasmore biased
to the west than that of other types of TCs. Additionally,
the EW-TCs (PTC-TCs) occurred, on average, farther
to the north (south) than other types of TCs.
If this study examines the distribution of the location
of TSF in detail, it is clear that the situation for each
environmental factor was different. Figure 1 shows the
location of TSF classified into the factors that influenced
TCG over the 35-yr analysis period between June and
November. The location of TSF of the SL-TCs extended
from the west to the east, where the SL was formed by
the westerly monsoon and eastward winds. Many loca-
tions of TSF of the CR-TCs were located over the
eastern Philippine Sea, where a confluence area is likely
formed. The EW-TCs were generally located in the
eastern part of the WNP, most likely due to the easterly
winds coming from the eastern North Pacific. Because
the PTC-TCs form on the southeastern side of a pre-
ceding TC, it is rare for them to form in the northern part
of the WNP and the South China Sea, resulting in sig-
nificant differences in the average location between the
PTC-TCs and the other types of TCs.
c. Intensity
There were no differences in the average intensity of
TCs generated by different environmental factors at the
time of TSF because this was the time when all TCs
reached TS intensity. However, the rate of develop-
ment, defined by the increase in the maximum wind
speed 1 day after the time of TSF, was significantly dif-
ferent. The rate of development of the GY-TC was
slower than the rate of the other types of TCs, with the
difference being significant at the 5% level (Table 1).
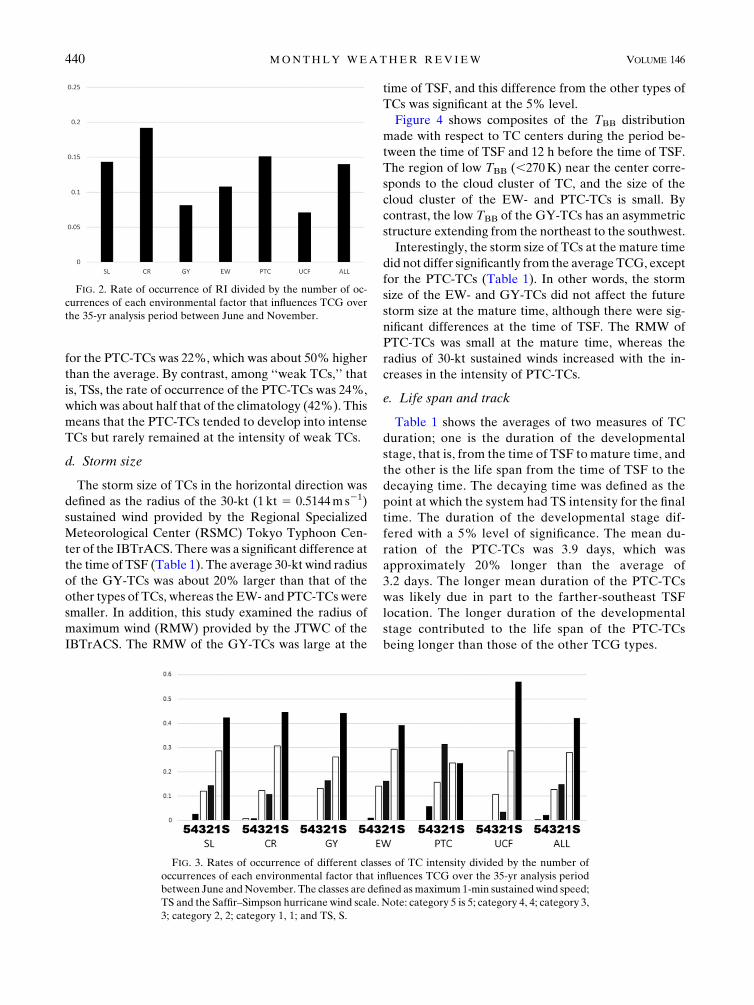
Rapid intensification (RI) for a TC is defined here as
an increase in wind speed of 17.2m s21 or more in 24 h.
Over the 35-yr analysis period between June and
November, 96 TCs (14% of the total) experienced RI.
Among the TCs generated by different environmental
factors, the occurrence of RI for the SL-TCs was the
largest (43 TCs), followed by the CR-TCs (25 TCs) and
the EW- and PTC-TCs (10 TCs). Only six GY-TCs ex-
perienced RI. To compare environments favorable for
RI correctly, rates of RI occurrence were divided by the
number of occurrences of each environmental factor
that influence TCG, as shown in Fig. 2. The rate of oc-
currence of RI for the SL (14%) was the same as the
438 MONTHLY WEATHER REV IEW VOLUME 146
average (the climatology of all TCs; 14%). The rate of
occurrence of RI for the GY-TCs (9%) was smaller than
the rate of occurrence of RI among all TCs, meaning
that the GY-TCs experienced RI more rarely than the
other types of TCs. The low rate of RI for the GY-TCs is
related to their slower development versus the other
types of TCs at the time of TSF. It is interesting to note
that the rate of occurrence of RI was the highest for the
CR-TCs (19%), that is, more than 2 times that of the
GY-TCs.
At the mature time, there was a significant difference
in the average intensity (Table 1): the PTC-TCs tended
to have lower central pressure and higher maximum
winds. To determine the tendency of an intense TC to
develop, this study also examined the occurrence of
specific classes of TC intensity categorized using the
Saffir–Simpson hurricane wind scale (Simpson 1974).
Over the 35-yr analysis period between June and
November, one category 5 (more than 70ms21 or 135kt)
TC, 14 category 4 (59–69ms21 or 114–134kt) TCs, and 86
category 3 (50–58ms21 or 96–113kt) TCswere classified as
major TCs, that is, having a maximum wind speed of
50m s21 (96 kt) or more. Among the major TCs, the
SL-TCs were the most frequent (44), followed by the
CR-TCs (18), the EW-TCs (14), and the PTC-TCs (11).
The rate of occurrence divided by the number of oc-
currences for each environmental factor that influ-
enced TCG is shown in Fig. 3. The rate of occurrence
of major TCs for the SL-TCs (15%) was the same as
the average (15%). Interestingly, the rate of occurrence
TABLE 1. Statistical summary of the parameters associated with the environmental factors that influenced TCG over the 35-yr analysis
period between June and November. Areas where a t test indicates significant differences with a 5% level of significance are presented in
boldface font.
SL CR GY EW PTC UCF ALL
Time of TSF No. 300 (44%) 130 (19%) 61 (9%) 92 (14%) 66 (10%) 28 (4%) 677
Avg lat (8N) 16.8 17.4 16.4 17.9 13.9 19.8 16.9
Avg lon (8E) 134.2 133.5 133.4 138.3 140.8 132.2 135.1
Radius of 30-kt wind
(n mi, 1 n mi 5 1.852 km)
115.2 111.6 129.5 104.7 102.3 125.5 113.6
RMW (km) 38.4 37.9 43.1 36.7 39.2 39.1 38.1
One day after
time of TSF
Dlon (8) 22.2 21.9 22.0 22.7 23.4 21.6 22.3
Dlat (8) 1.8 2.0 1.7 1.7 1.3 1.8 1.8
Dwind (kt) 13.4 13.0 11.4 15.0 13.7 9.8 13.3
Mature time Duration from TSF (day) 3.2 3.0 3.0 2.9 3.9 3.0 3.2
Max wind (kt) 69.7 67.5 68.9 69.9 77.0 63.0 69.7
Min pressure (hPa) 959.6 963.3 961.5 960.5 953.1 968.1 960.3
Radius of 30-kt wind (n mi) 226.5 220.5 246.4 241.0 255.0 220.4 231.7
RMW (km) 24.0 26.9 22.3 24.9 18.5 26.7 24.5
Decaying time Duration from TSF (day) 5.3 5.2 5.3 5.3 6.5 4.7 5.4
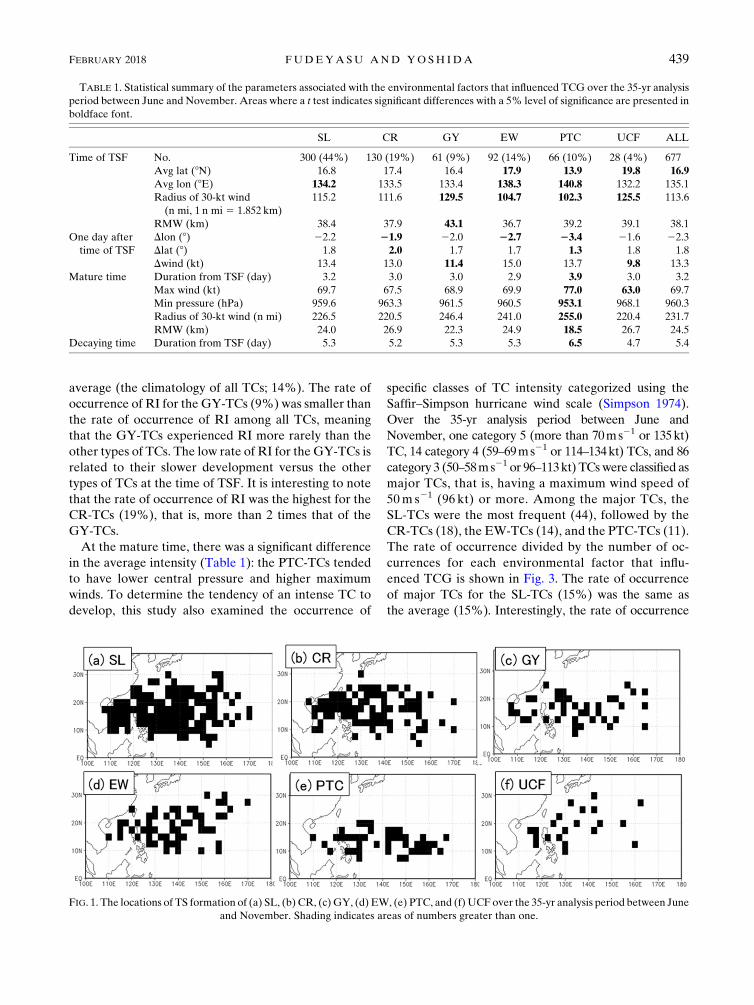
FIG. 1. The locations of TS formation of (a) SL, (b) CR, (c)GY, (d) EW, (e) PTC, and (f) UCF over the 35-yr analysis period between June
and November. Shading indicates areas of numbers greater than one.
FEBRUARY 2018 FUDEYASU AND YOSH IDA 439
for the PTC-TCs was 22%, which was about 50% higher
than the average. By contrast, among ‘‘weak TCs,’’ that
is, TSs, the rate of occurrence of the PTC-TCs was 24%,
which was about half that of the climatology (42%). This
means that the PTC-TCs tended to develop into intense
TCs but rarely remained at the intensity of weak TCs.
d. Storm size
The storm size of TCs in the horizontal direction was
defined as the radius of the 30-kt (1 kt 5 0.5144ms21)
sustained wind provided by the Regional Specialized
Meteorological Center (RSMC) Tokyo Typhoon Cen-
ter of the IBTrACS. There was a significant difference at
the time of TSF (Table 1). The average 30-kt wind radius
of the GY-TCs was about 20% larger than that of the
other types of TCs, whereas the EW- and PTC-TCs were
smaller. In addition, this study examined the radius of
maximum wind (RMW) provided by the JTWC of the
IBTrACS. The RMW of the GY-TCs was large at the
time of TSF, and this difference from the other types of
TCs was significant at the 5% level.
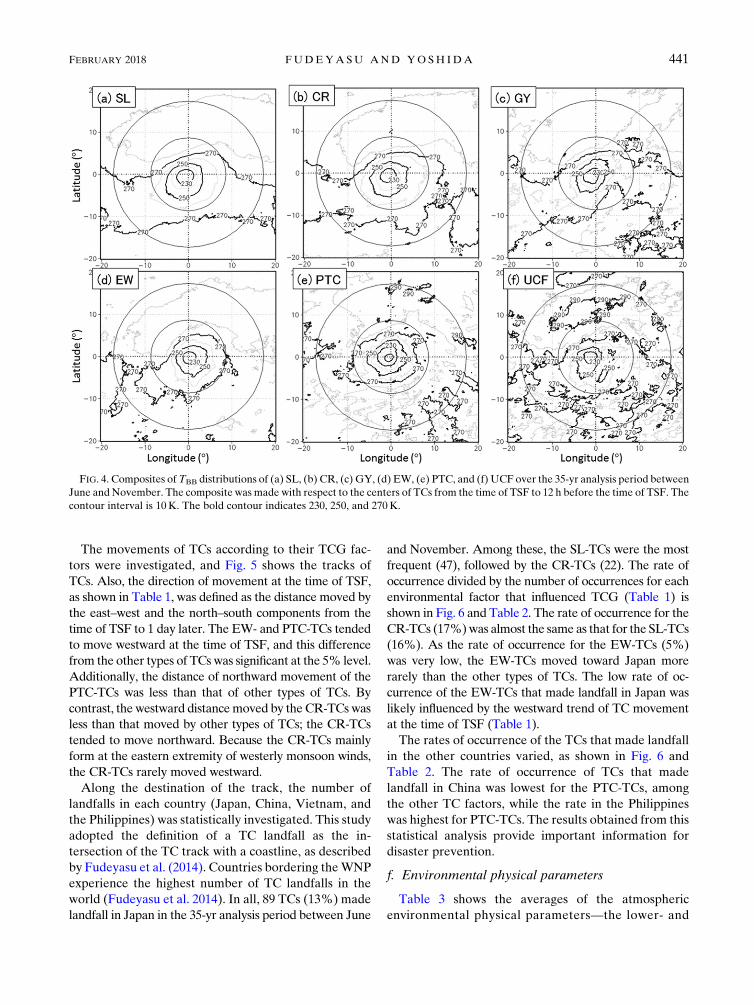
Figure 4 shows composites of the TBB distribution
made with respect to TC centers during the period be-
tween the time of TSF and 12 h before the time of TSF.
The region of low TBB (,270K) near the center corre-
sponds to the cloud cluster of TC, and the size of the
cloud cluster of the EW- and PTC-TCs is small. By
contrast, the low TBB of the GY-TCs has an asymmetric
structure extending from the northeast to the southwest.
Interestingly, the storm size of TCs at the mature time
did not differ significantly from the average TCG, except
for the PTC-TCs (Table 1). In other words, the storm
size of the EW- and GY-TCs did not affect the future
storm size at the mature time, although there were sig-
nificant differences at the time of TSF. The RMW of
PTC-TCs was small at the mature time, whereas the
radius of 30-kt sustained winds increased with the in-
creases in the intensity of PTC-TCs.
e. Life span and track
Table 1 shows the averages of two measures of TC
duration; one is the duration of the developmental
stage, that is, from the time of TSF to mature time, and
the other is the life span from the time of TSF to the
decaying time. The decaying time was defined as the
point at which the system had TS intensity for the final
time. The duration of the developmental stage dif-
fered with a 5% level of significance. The mean du-
ration of the PTC-TCs was 3.9 days, which was
approximately 20% longer than the average of
3.2 days. The longer mean duration of the PTC-TCs
was likely due in part to the farther-southeast TSF
location. The longer duration of the developmental
stage contributed to the life span of the PTC-TCs
being longer than those of the other TCG types.
FIG. 2. Rate of occurrence of RI divided by the number of oc-
currences of each environmental factor that influences TCG over
the 35-yr analysis period between June and November.
FIG. 3. Rates of occurrence of different classes of TC intensity divided by the number of
occurrences of each environmental factor that influences TCG over the 35-yr analysis period
between June andNovember. The classes are defined asmaximum 1-min sustainedwind speed;
TS and the Saffir–Simpson hurricane wind scale. Note: category 5 is 5; category 4, 4; category 3,
3; category 2, 2; category 1, 1; and TS, S.
440 MONTHLY WEATHER REV IEW VOLUME 146
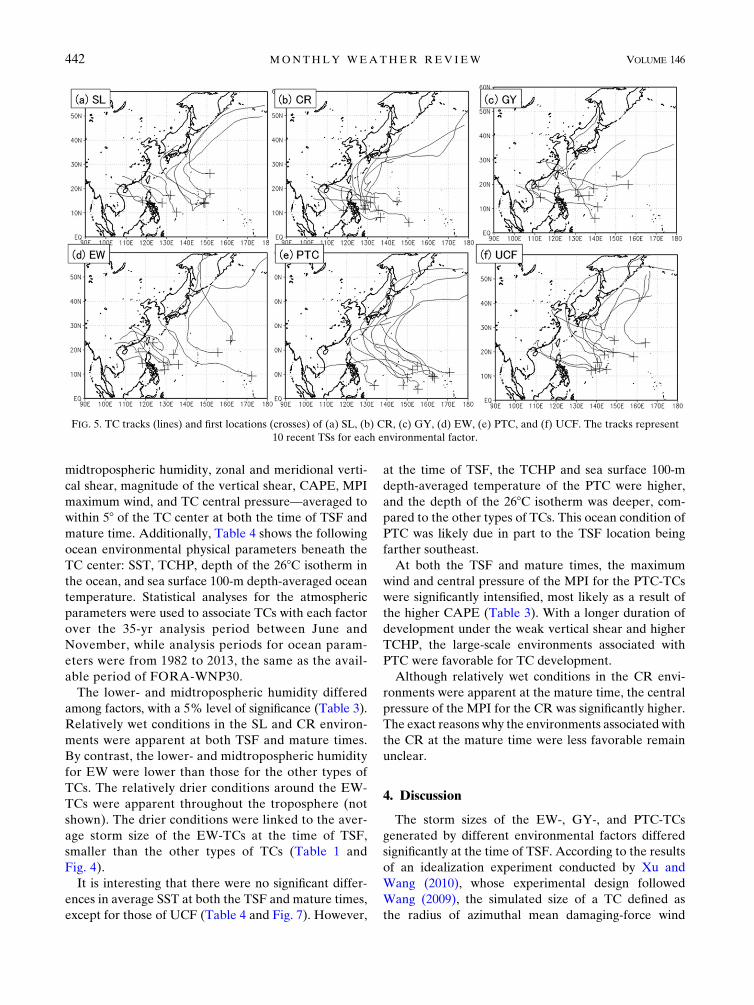
The movements of TCs according to their TCG fac-
tors were investigated, and Fig. 5 shows the tracks of
TCs. Also, the direction of movement at the time of TSF,
as shown in Table 1, was defined as the distance moved by
the east–west and the north–south components from the
time of TSF to 1 day later. The EW- and PTC-TCs tended
to move westward at the time of TSF, and this difference
from the other types of TCs was significant at the 5% level.
Additionally, the distance of northward movement of the
PTC-TCs was less than that of other types of TCs. By
contrast, the westward distancemoved by the CR-TCswas
less than that moved by other types of TCs; the CR-TCs
tended to move northward. Because the CR-TCs mainly
form at the eastern extremity of westerly monsoon winds,
the CR-TCs rarely moved westward.
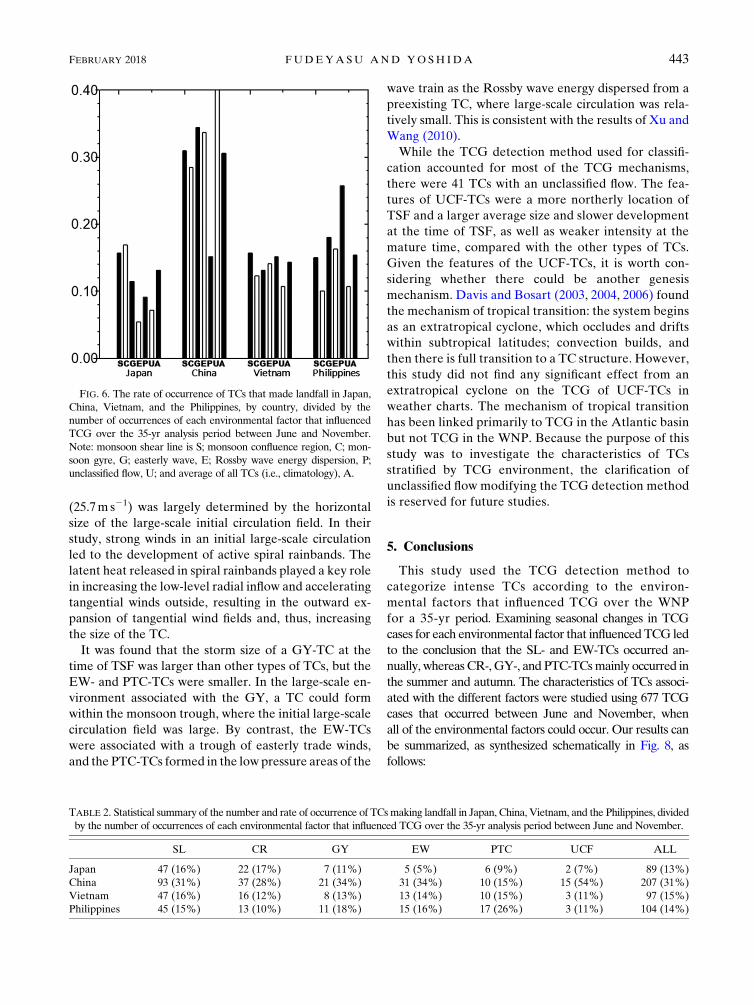
Along the destination of the track, the number of
landfalls in each country (Japan, China, Vietnam, and
the Philippines) was statistically investigated. This study
adopted the definition of a TC landfall as the in-
tersection of the TC track with a coastline, as described
by Fudeyasu et al. (2014). Countries bordering theWNP
experience the highest number of TC landfalls in the
world (Fudeyasu et al. 2014). In all, 89 TCs (13%) made
landfall in Japan in the 35-yr analysis period between June
and November. Among these, the SL-TCs were the most
frequent (47), followed by the CR-TCs (22). The rate of
occurrence divided by the number of occurrences for each
environmental factor that influenced TCG (Table 1) is
shown in Fig. 6 and Table 2. The rate of occurrence for the
CR-TCs (17%)was almost the same as that for the SL-TCs
(16%). As the rate of occurrence for the EW-TCs (5%)
was very low, the EW-TCs moved toward Japan more
rarely than the other types of TCs. The low rate of oc-
currence of the EW-TCs that made landfall in Japan was
likely influenced by the westward trend of TC movement
at the time of TSF (Table 1).
The rates of occurrence of the TCs that made landfall
in the other countries varied, as shown in Fig. 6 and
Table 2. The rate of occurrence of TCs that made
landfall in China was lowest for the PTC-TCs, among
the other TC factors, while the rate in the Philippines
was highest for PTC-TCs. The results obtained from this
statistical analysis provide important information for
disaster prevention.
f. Environmental physical parameters
Table 3 shows the averages of the atmospheric
environmental physical parameters—the lower- and
FIG. 4. Composites ofTBB distributions of (a) SL, (b) CR, (c) GY, (d) EW, (e) PTC, and (f) UCF over the 35-yr analysis period between
June and November. The composite was made with respect to the centers of TCs from the time of TSF to 12 h before the time of TSF. The
contour interval is 10K. The bold contour indicates 230, 250, and 270K.
FEBRUARY 2018 FUDEYASU AND YOSH IDA 441
midtropospheric humidity, zonal and meridional verti-
cal shear, magnitude of the vertical shear, CAPE, MPI
maximum wind, and TC central pressure—averaged to
within 58 of the TC center at both the time of TSF and
mature time. Additionally, Table 4 shows the following
ocean environmental physical parameters beneath the
TC center: SST, TCHP, depth of the 268C isotherm in
the ocean, and sea surface 100-m depth-averaged ocean
temperature. Statistical analyses for the atmospheric
parameters were used to associate TCs with each factor
over the 35-yr analysis period between June and
November, while analysis periods for ocean param-
eters were from 1982 to 2013, the same as the avail-
able period of FORA-WNP30.
The lower- and midtropospheric humidity differed
among factors, with a 5% level of significance (Table 3).
Relatively wet conditions in the SL and CR environ-
ments were apparent at both TSF and mature times.
By contrast, the lower- and midtropospheric humidity
for EW were lower than those for the other types of
TCs. The relatively drier conditions around the EW-
TCs were apparent throughout the troposphere (not
shown). The drier conditions were linked to the aver-
age storm size of the EW-TCs at the time of TSF,
smaller than the other types of TCs (Table 1 and
Fig. 4).
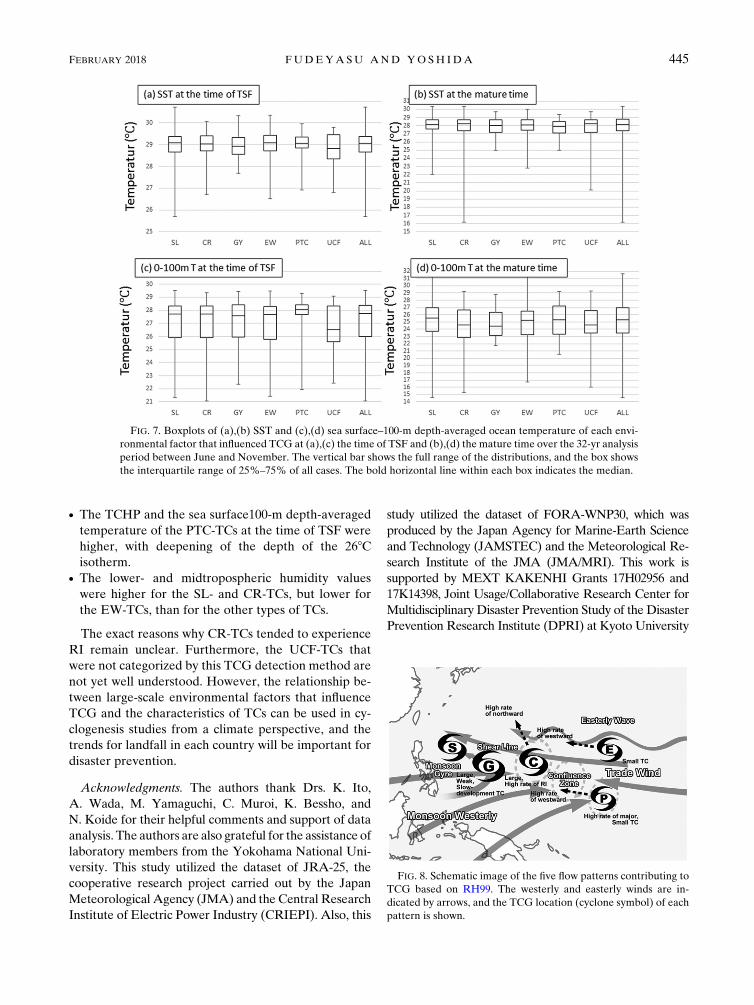
It is interesting that there were no significant differ-
ences in average SST at both the TSF and mature times,
except for those of UCF (Table 4 and Fig. 7). However,
at the time of TSF, the TCHP and sea surface 100-m
depth-averaged temperature of the PTC were higher,
and the depth of the 268C isotherm was deeper, com-
pared to the other types of TCs. This ocean condition of
PTC was likely due in part to the TSF location being
farther southeast.
At both the TSF and mature times, the maximum
wind and central pressure of the MPI for the PTC-TCs
were significantly intensified, most likely as a result of
the higher CAPE (Table 3). With a longer duration of
development under the weak vertical shear and higher
TCHP, the large-scale environments associated with
PTC were favorable for TC development.
Although relatively wet conditions in the CR envi-
ronments were apparent at the mature time, the central
pressure of the MPI for the CR was significantly higher.
The exact reasons why the environments associated with
the CR at the mature time were less favorable remain
unclear.
4. Discussion
The storm sizes of the EW-, GY-, and PTC-TCs
generated by different environmental factors differed
significantly at the time of TSF. According to the results
of an idealization experiment conducted by Xu and
Wang (2010), whose experimental design followed
Wang (2009), the simulated size of a TC defined as
the radius of azimuthal mean damaging-force wind
FIG. 5. TC tracks (lines) and first locations (crosses) of (a) SL, (b) CR, (c) GY, (d) EW, (e) PTC, and (f) UCF. The tracks represent
10 recent TSs for each environmental factor.
442 MONTHLY WEATHER REV IEW VOLUME 146
(25.7m s21) was largely determined by the horizontal
size of the large-scale initial circulation field. In their
study, strong winds in an initial large-scale circulation
led to the development of active spiral rainbands. The
latent heat released in spiral rainbands played a key role
in increasing the low-level radial inflow and accelerating
tangential winds outside, resulting in the outward ex-
pansion of tangential wind fields and, thus, increasing
the size of the TC.
It was found that the storm size of a GY-TC at the
time of TSF was larger than other types of TCs, but the
EW- and PTC-TCs were smaller. In the large-scale en-
vironment associated with the GY, a TC could form
within the monsoon trough, where the initial large-scale
circulation field was large. By contrast, the EW-TCs
were associated with a trough of easterly trade winds,
and the PTC-TCs formed in the low pressure areas of the
wave train as the Rossby wave energy dispersed from a
preexisting TC, where large-scale circulation was rela-
tively small. This is consistent with the results of Xu and
Wang (2010).
While the TCG detection method used for classifi-
cation accounted for most of the TCG mechanisms,
there were 41 TCs with an unclassified flow. The fea-
tures of UCF-TCs were a more northerly location of
TSF and a larger average size and slower development
at the time of TSF, as well as weaker intensity at the
mature time, compared with the other types of TCs.
Given the features of the UCF-TCs, it is worth con-
sidering whether there could be another genesis
mechanism. Davis and Bosart (2003, 2004, 2006) found
the mechanism of tropical transition: the system begins
as an extratropical cyclone, which occludes and drifts
within subtropical latitudes; convection builds, and
then there is full transition to a TC structure. However,
this study did not find any significant effect from an
extratropical cyclone on the TCG of UCF-TCs in
weather charts. The mechanism of tropical transition
has been linked primarily to TCG in the Atlantic basin
but not TCG in the WNP. Because the purpose of this
study was to investigate the characteristics of TCs
stratified by TCG environment, the clarification of
unclassified flow modifying the TCG detection method
is reserved for future studies.
5. Conclusions
This study used the TCG detection method to
categorize intense TCs according to the environ-
mental factors that influenced TCG over the WNP
for a 35-yr period. Examining seasonal changes in TCG
cases for each environmental factor that influenced TCG led
to the conclusion that the SL- and EW-TCs occurred an-
nually, whereasCR-,GY-, and PTC-TCsmainly occurred in
the summer and autumn. The characteristics of TCs associ-
ated with the different factors were studied using 677 TCG
cases that occurred between June and November, when
all of the environmental factors could occur. Our results can
be summarized, as synthesized schematically in Fig. 8, as
follows:
TABLE 2. Statistical summary of the number and rate of occurrence of TCsmaking landfall in Japan, China, Vietnam, and the Philippines, divided
by the number of occurrences of each environmental factor that influenced TCG over the 35-yr analysis period between June and November.
SL CR GY EW PTC UCF ALL
Japan 47 (16%) 22 (17%) 7 (11%) 5 (5%) 6 (9%) 2 (7%) 89 (13%)
China 93 (31%) 37 (28%) 21 (34%) 31 (34%) 10 (15%) 15 (54%) 207 (31%)
Vietnam 47 (16%) 16 (12%) 8 (13%) 13 (14%) 10 (15%) 3 (11%) 97 (15%)
Philippines 45 (15%) 13 (10%) 11 (18%) 15 (16%) 17 (26%) 3 (11%) 104 (14%)
FIG. 6. The rate of occurrence of TCs that made landfall in Japan,
China, Vietnam, and the Philippines, by country, divided by the
number of occurrences of each environmental factor that influenced
TCG over the 35-yr analysis period between June and November.
Note: monsoon shear line is S; monsoon confluence region, C; mon-
soon gyre, G; easterly wave, E; Rossby wave energy dispersion, P;
unclassified flow, U; and average of all TCs (i.e., climatology), A.
FEBRUARY 2018 FUDEYASU AND YOSH IDA 443
d The average location of TSF of the EW-TCs (PTC-
TCs) was farther east and north (south), while that
of the SL-TCs was farther west than those of the
other types of TCs.d The average size of the GY-TCs at the time of TSF
was larger than that of the other types of TCs, while
the EW- and PTC-TCs were smaller.d The average size of the RMW of the GY-TCs at the
time of TSF was larger than the average of the other
types of TCs, while the RMW of the PTC-TCs at the
mature time was smaller.d TheGY-TCs tended to develop slowly at the time ofTSF.d Rates of RI occurrence for the CR-TCs were higher
than for the other types of TCs, whereas the GY-TCs
rarely experienced RI.d The EW- and PTC-TCs tended tomove westward at the
time of TSF. Conversely, the CR-TCs tended to move
northward.
d The occurrence rate of the PTC-TCs that made landfall
in the Philippines was higher, and those of the EW-TCs
(PTC-TCs) that made landfall in Japan (China) were
lower, than the average for all TCs.d The duration of the developmental stage and the TC
life span of the PTC-TCs were longer than for the
other types of TCs.d There were no significant differences in the average
storm size ofTCs at themature time, except for the PTC-
TCs, which were larger than the other types of TCs.d The PTC-TCs tended to develop as intense TCs in the
environments favorable for TC development.d According to MPI theory, the large-scale environ-
ments associated with the PTCs were more favorable
for TC development.d There were no significant differences in SST around
the TCs at the both of TSF and mature times, except
for UCF-TCs.
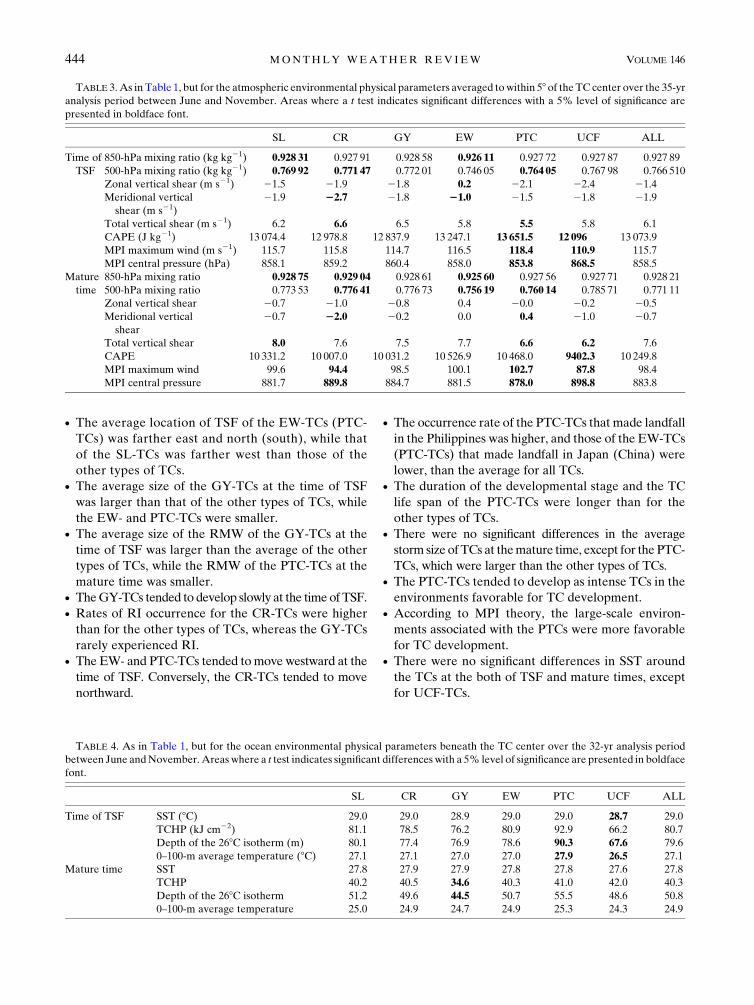
TABLE 4. As in Table 1, but for the ocean environmental physical parameters beneath the TC center over the 32-yr analysis period
between June andNovember.Areas where a t test indicates significant differences with a 5% level of significance are presented in boldface
font.
SL CR GY EW PTC UCF ALL
SST (8C) 29.0 29.0 28.9 29.0 29.0 28.7 29.0Time of TSF
TCHP (kJ cm22) 81.1 78.5 76.2 80.9 92.9 66.2 80.7
Depth of the 268C isotherm (m) 80.1 77.4 76.9 78.6 90.3 67.6 79.6
0–100-m average temperature (8C) 27.1 27.1 27.0 27.0 27.9 26.5 27.1
Mature time SST 27.8 27.9 27.9 27.8 27.8 27.6 27.8
TCHP 40.2 40.5 34.6 40.3 41.0 42.0 40.3
Depth of the 268C isotherm 51.2 49.6 44.5 50.7 55.5 48.6 50.8
0–100-m average temperature 25.0 24.9 24.7 24.9 25.3 24.3 24.9
TABLE 3.As in Table 1, but for the atmospheric environmental physical parameters averaged towithin 58 of the TC center over the 35-yr
analysis period between June and November. Areas where a t test indicates significant differences with a 5% level of significance are
presented in boldface font.
SL CR GY EW PTC UCF ALL
Time of
TSF
850-hPa mixing ratio (kg kg21) 0.928 31 0.927 91 0.928 58 0.926 11 0.927 72 0.927 87 0.927 89
500-hPa mixing ratio (kg kg21) 0.769 92 0.771 47 0.772 01 0.746 05 0.764 05 0.767 98 0.766 510
Zonal vertical shear (m s21) 21.5 21.9 21.8 0.2 22.1 22.4 21.4
Meridional vertical
shear (m s21)
21.9 22.7 21.8 21.0 21.5 21.8 21.9
Total vertical shear (m s21) 6.2 6.6 6.5 5.8 5.5 5.8 6.1
CAPE (J kg21) 13 074.4 12 978.8 12 837.9 13 247.1 13 651.5 12 096 13 073.9
MPI maximum wind (m s21) 115.7 115.8 114.7 116.5 118.4 110.9 115.7
MPI central pressure (hPa) 858.1 859.2 860.4 858.0 853.8 868.5 858.5
Mature
time
850-hPa mixing ratio 0.928 75 0.929 04 0.928 61 0.925 60 0.927 56 0.927 71 0.928 21
500-hPa mixing ratio 0.773 53 0.776 41 0.776 73 0.756 19 0.760 14 0.785 71 0.771 11
Zonal vertical shear 20.7 21.0 20.8 0.4 20.0 20.2 20.5
Meridional vertical
shear
20.7 22.0 20.2 0.0 0.4 21.0 20.7
Total vertical shear 8.0 7.6 7.5 7.7 6.6 6.2 7.6
CAPE 10 331.2 10 007.0 10 031.2 10 526.9 10 468.0 9402.3 10 249.8
MPI maximum wind 99.6 94.4 98.5 100.1 102.7 87.8 98.4
MPI central pressure 881.7 889.8 884.7 881.5 878.0 898.8 883.8
444 MONTHLY WEATHER REV IEW VOLUME 146
d The TCHP and the sea surface100-m depth-averaged
temperature of the PTC-TCs at the time of TSF were
higher, with deepening of the depth of the 268Cisotherm.
d The lower- and midtropospheric humidity values
were higher for the SL- and CR-TCs, but lower for
the EW-TCs, than for the other types of TCs.
The exact reasons why CR-TCs tended to experience
RI remain unclear. Furthermore, the UCF-TCs that
were not categorized by this TCG detection method are
not yet well understood. However, the relationship be-
tween large-scale environmental factors that influence
TCG and the characteristics of TCs can be used in cy-
clogenesis studies from a climate perspective, and the
trends for landfall in each country will be important for
disaster prevention.
Acknowledgments. The authors thank Drs. K. Ito,
A. Wada, M. Yamaguchi, C. Muroi, K. Bessho, and
N. Koide for their helpful comments and support of data
analysis. The authors are also grateful for the assistance of
laboratory members from the Yokohama National Uni-
versity. This study utilized the dataset of JRA-25, the
cooperative research project carried out by the Japan
Meteorological Agency (JMA) and the Central Research
Institute of Electric Power Industry (CRIEPI). Also, this
study utilized the dataset of FORA-WNP30, which was
produced by the Japan Agency for Marine-Earth Science
and Technology (JAMSTEC) and the Meteorological Re-
search Institute of the JMA (JMA/MRI). This work is
supported by MEXT KAKENHI Grants 17H02956 and
17K14398, Joint Usage/Collaborative Research Center for
Multidisciplinary Disaster Prevention Study of the Disaster
Prevention Research Institute (DPRI) at Kyoto University
FIG. 8. Schematic image of the five flow patterns contributing to
TCG based on RH99. The westerly and easterly winds are in-
dicated by arrows, and the TCG location (cyclone symbol) of each
pattern is shown.
FIG. 7. Boxplots of (a),(b) SST and (c),(d) sea surface–100-m depth-averaged ocean temperature of each envi-
ronmental factor that influenced TCG at (a),(c) the time of TSF and (b),(d) the mature time over the 32-yr analysis
period between June and November. The vertical bar shows the full range of the distributions, and the box shows
the interquartile range of 25%–75% of all cases. The bold horizontal line within each box indicates the median.
FEBRUARY 2018 FUDEYASU AND YOSH IDA 445
(29G-05), Collaborative Research Project on Computer
Science with High-Performance Computing at Nagoya
University (2017), and the Fujitsu PRIMEHPC FX10
System(Oakleaf-FX) in the InformationTechnologyCenter
of the University of Tokyo (2015, 2016).
REFERENCES
Bister, M., and K. A. Emanuel, 1998: Dissipative heating and
hurricane intensity.Meteor. Atmos. Phys., 65, 233–240, https://
doi.org/10.1007/BF01030791.
Camargo, S. J., K. A. Emanuel, and A. H. Sobel, 2007: Use of a
genesis potential index to diagnose ENSO effects on tropical
cyclone genesis. J. Climate, 20, 4819–4834, https://doi.org/
10.1175/JCLI4282.1.
Chen, S. S., R. A. Houze Jr., and B. E. Mapes, 1996: Multiscale
variability of deep convection in relation to large-scale circu-
lation in TOGACOARE. J. Atmos. Sci., 53, 1380–1409, https://
doi.org/10.1175/1520-0469(1996)053,1380:MVODCI.2.0.CO;2.
Chu, J. H., C. R. Sampson, A. S. Levine, and E. Fukada, 2002: The
Joint Typhoon Warning Center tropical cyclone best-tracks,
1945–2000. Joint Typhoon Warning Center Rep. NRL/MR/
7540-02-16, 22 pp., http://www.usno.navy.mil/NOOC/nmfc-ph/
RSS/jtwc/best_tracks/TC_bt_report.html.
Davis, C. A., and L. F. Bosart, 2003: Baroclinically induced tropical
cyclogenesis. Mon. Wea. Rev., 131, 2730–2747, https://doi.org/
10.1175/1520-0493(2003)131,2730:BITC.2.0.CO;2.
——, and ——, 2004: The TT problem: Forecasting the tropical
transition of cyclones.Bull. Amer.Meteor. Soc., 85, 1657–1662,
https://doi.org/10.1175/BAMS-85-11-1657.
——, and ——, 2006: The formation of Hurricane Humberto
(2001): The importance of extra-tropical precursors.Quart. J. Roy.
Meteor. Soc., 132, 2055–2085, https://doi.org/10.1256/qj.05.42.
Emanuel, K., 1986: An air–sea interaction theory for tropical cy-
clones. Part I: Steady-state maintenance. J. Atmos. Sci., 43,585–605, https://doi.org/10.1175/1520-0469(1986)043,0585:
AASITF.2.0.CO;2.
——, and D. S. Nolan, 2004: Tropical cyclone activity and global
climate. 26th Conf. on Hurricanes and Tropical Meteorology,
Miami, FL,Amer.Meteor. Soc., 10A.2, https://ams.confex.com/
ams/26HURR/techprogram/paper_75463.htm.
Fudeyasu, H., S. Hirose, H. Yoshioka, R. Kumazawa, and
S. Yamasaki, 2014: A global view of the landfall characteristics
of tropical cyclones. Trop. Cyclone Res. Rev., 3, 178–192,
https://doi.org/10.6057/2014TCRR03.04.
Gray, W. M., 1968: Global view of the origin of tropical distur-
bances and storms. Mon. Wea. Rev., 96, 669–700, https://doi.org/
10.1175/1520-0493(1968)096,0669:GVOTOO.2.0.CO;2.
——, 1998: The formation of tropical cyclones. Meteor. Atmos.
Phys., 67, 37–69, https://doi.org/10.1007/BF01277501.Heta, Y., 1990: An analysis of tropical wind fields in relation to
typhoon formation over the western Pacific. J. Meteor. Soc.
Japan, 68, 65–77, https://doi.org/10.2151/jmsj1965.68.1_65.
——, 1991: The origin of tropical disturbances in the equatorial
Pacific. J. Meteor. Soc. Japan, 69, 337–351, https://doi.org/
10.2151/jmsj1965.69.3_337.
Knapp, K.R.,M. C. Kruk,D.H. Levinson, H. J. Diamond, andC. J.
Neumann, 2010: The International Best Track Archive for
Climate Stewardship (IBTrACS): Unifying tropical cyclone
data. Bull. Amer. Meteor. Soc., 91, 363–376, https://doi.org/
10.1175/2009BAMS2755.1.
Korty,R., S. J.Camargo, andJ.Galewsky, 2012:Tropical cyclonegenesis
factors in simulations of the Last Glacial Maximum. J. Climate, 25,
4348–4365, https://doi.org/10.1175/JCLI-D-11-00517.1.
Lander, M. A., 1994: Description of a monsoon gyre and its effects
on the tropical cyclones in the western North Pacific during
August 1991. Wea. Forecasting, 9, 640–654, https://doi.org/
10.1175/1520-0434(1994)009,0640:DOAMGA.2.0.CO;2.
Leipper, D., and D. Volgenau, 1972: Hurricane heat potential of the
Gulf of Mexico. J. Phys. Oceanogr., 2, 218–224, https://doi.org/
10.1175/1520-0485(1972)002,0218:HHPOTG.2.0.CO;2.
Li, T., and B. Fu, 2006: Tropical cyclogenesis associated with
Rossby wave energy dispersion of a preexisting typhoon. Part
I: Satellite data analyses. J. Atmos. Sci., 63, 1377–1389, https://
doi.org/10.1175/JAS3692.1.
——, X. Ge, B. Wang, and Y. Zhu, 2006: Tropical cyclogenesis
associated with Rossby wave energy dispersion of a preexist-
ing typhoon. Part II: Numerical simulations. J. Atmos. Sci., 63,
1390–1409, https://doi.org/10.1175/JAS3693.1.
McDonald, N. R., 1998: The decay of cyclonic eddies by Rossby
wave radiation. J. Fluid Mech., 361, 237–252, https://doi.org/
10.1017/S0022112098008696.
McGauley,M.G., andD. S. Nolan, 2011:Measuring environmental
favorability for tropical cyclogenesis by statistical analysis of
threshold parameters. J. Climate, 24, 5968–5997, https://
doi.org/10.1175/2011JCLI4176.1.
Onogi, K., andCoauthors, 2007: The JRA-25Reanalysis. J.Meteor.
Soc. Japan, 85, 369–432, https://doi.org/10.2151/jmsj.85.369.
Ritchie, E. A., and G. J. Holland, 1999: Large-scale patterns as-
sociated with tropical cyclogenesis in the western Pacific.
Mon. Wea. Rev., 127, 2027–2043, https://doi.org/10.1175/
1520-0493(1999)127,2027:LSPAWT.2.0.CO;2.
Simpson, R. H., 1974: The hurricane disaster–potential scale. Weath-
erwise, 27, 169–186, https://doi.org/10.1080/00431672.1974.9931702.
Usui, T. Y., and Coauthors, 2017: Four-dimensional variational
ocean reanalysis: A 30-year high-resolution dataset in the
western North Pacific (FORA-WNP30). J. Oceanogr., 73,
205–233, https://doi.org/10.1007/s10872-016-0398-5.
Wada, A., 2015: Verification of tropical cyclone heat potential for
tropical cyclone intensity forecasting in the western North
Pacific. J. Oceanogr., 71, 373–387, https://doi.org/10.1007/
s10872-015-0298-0.
Wang, Y., 2009: How do outer spiral rainbands affect tropical cy-
clone structure and intensity? J. Atmos. Sci., 66, 1250–1273,
https://doi.org/10.1175/2008JAS2737.1.
Xu, J., and Y. Wang, 2010: Sensitivity of the simulated
tropical cyclone inner-core size to the initial vortex size.
Mon. Wea. Rev., 138, 4135–4157, https://doi.org/10.1175/
2010MWR3335.1.
Yoshida, R., and H. Ishikawa, 2013: Environmental factors con-
tributing to tropical cyclone genesis over the western North
Pacific.Mon. Wea. Rev., 141, 451–467, https://doi.org/10.1175/
MWR-D-11-00309.1.
446 MONTHLY WEATHER REV IEW VOLUME 146