Embed Size (px)
Citation preview

Page 54 • CHIPS • Maart/April 2016
Western Free State cultivar trial under dryland conditions at
Kroonstad in 2014 and 2015
The Western Free State currently produces approximately 17% of the total national potato production which, after Limpopo, is the second highest potato production in South Africa. The region produces seed potatoes, fresh market and processing. The region’s contribution to the South African processing industry amount to 4%. The standard cultivars planted for the fresh and processing markets are Mondial (69%), Up-to-date (17%) and Sifra (13%). Although potatoes are produced under irrigation in most parts of the Western Free State, dryland production is possible, for example in die Kroonstad area. Kroonstad (Figure 1 ) falls in a summer rainfall area with a temperate climate and receives an average annual rainfall of between
468 to 6000 mm / annum. Summers are moderate to very hot summers, whereas winters are cold with severe frost (June and July). Potatoes are primarily planted from end of November to end of January, and harvested and marketed from April to September. The trial at Kroonstad was conducted on a site with sandy loam soil and was planted in a random complete block design with three replications. Additional technical information regarding the trial site and layout is summarised in Table 1.
Growing period is an important factor to take note of since it can influence the yields of cultivars. Growing period is defined as the number of day from emergence up until
Chantel du Raan and Attie van den Berg (Potatoes South Africa)

Bedryfsdienste • Industry Services
CHIPS • March/April 2016 • Page 55
Figure 1: Location of Kroonstad in the Western Free State production region.
the foliage die-off naturally, depending on the season. The exact timing of these four growth phases depend, amongst various other factors, on the environment and the management practices which vary between localities and cultivars as a result of different growing periods. The cultivars included in the workgroup trial during 2014 en 2015 are indicated in Table 2.
Yield and tuber size distribution are also influenced by the number of haulms per area and consequently by the amount of seed tubers planted and the number of haulms per seed tuber. The number of haulms, on the other hand, depends on the number of eyes per tuber, the number of sprouts per eye and the number of haulms per sprout. The number of eyes per tuber is cultivar dependent, whereas the number of haulms per tuber are influenced by the size and plant readiness of the seed tuber. It is important to note that these characteristics vary between cultivars. The plant readiness, population (%) and haulm count of cultivars
1. Summer rainfall, temperate
2. Summer rainfall, tropical
3. Dry continental
4. Winter rainfall
Kroonstad
Figuur 1: Location of Kroonstad in the Western Free State production region.
Table 1: Summary of technical information pertaining to the trial site and layout.
Farm Grootkuil
Farmer Mr Kobus Crous
Planting date 8 January 2014 and 8 January 2015
Harvesting date 11 July 2014 and 3 July 2015
Irrigation / Dryland Dryland
Double or single rows Single rows
Foliage die-off Natural
Between row spacing 1.75 m
Within-row spacing 0.35 m
Trial plot area per cultivar: 18 m2
Plant population 18 519 plants / hectare
Fertilizer program:
Application timing: Nutritional value
N (kg/ha) P (kg/ha) K (kg/ha) Ca (kg/ha) Mg (kg/ha) S (kg/ha)
At planting 52 28 40 0 0 32
Emergence 16 24 32 0 0 9
Tuber initiation 14 0 0 0 0 0
2 weeks after tuber initiation 11 0 0 19 10 0
4 weeks after tuber initiation 23 0 0 29 0 0
Total 116 52 72 48 10 41
Page 56 • CHIPS • Maart/April 2016
1 General guidelines and categories (days from emergence to natural foliage die-off, depending on the season):Short = 70-90 days; Short to Medium = 80-100 days; Medium = 90-110 days; Medium to Long = 90-120 days; Long = 90-140 days2 Plant readiness of seed tubers1 – Fresh; 2 – Slightly fresh; 3 – Plant ready; 4 – Slightly old; 5 – Old.
Table 2: Characteristics regarding growing periods, plant readiness, population (%) and haulms counts for each culti-var included in the trial in 2014 and 2015.
Cultivar Growing period(Days)1
Plant readiness2
Stand (%) Haulms per plant
Haulms per hectare
2014 2015 2014 2015 2014 2015 2014 2015
Almera Short (85) 3 3 65 98 3.2 1.8 38 520 33 334
Destiny Medium (110) 3 3 85 80 4.6 2 72 409 37 038
Electra Short to medium (100) 3 3 95 95 6.8 2 119 633 37 038
Elmundo Short to medium (90-100) 3 - 80 - 4.4 - 65 187 -
Eos Medium (90-110) - 3 - 60 - 2.5 - 46 298
Everest Short to medium (90-100) 3 - 100 - 4.6 - 85 187 -
Fianna Medium to long (112) - 3 - 95 - 2.1 - 38 890
Golf Medium (90-110) - 3 - 90 - 2.1 - 38 890
Kikko Medium (90-110) 3 - 95 - 6.4 - 112 596 -
Konsul Medium (110) 3 - 85 - 5.0 - 78 706 -
Labadia Short to medium (100) 3 - 90 - 3.2 - 53 335 -
Lanorma Short (80-90) 3 3 95 85 5.0 2.3 92 595 42 594
Marimba Short (85) 3 3 85 99 3.6 1.9 56 668 35 186
Markies Medium (110) 3 2 100 95 4.8 1.9 90 743 35 186
Melanto Medium (90-110) - 3 - 95 - 2 - 37 038
Monati - - - 2 - 100 - 2.2 - 40 742
Mondial Short to medium (95-100) 4 3 100 60 4.0 2 74 076 37 038
Navigator Short to medium (100) - 2 - 70 - 1.3 - 24 075
Nectar Medium (90-110) 3 - 50 - 2.4 - 22 223 -
Panamera Medium (90-110) 3 3 90 95 3.4 1.4 56 668 25 927
Savanna Medium (90-110) 3 3 95 95 4.6 2.2 80 928 40 742
Sifra Short to medium (90-100) 4 5 100 99 4.2 2.1 77 780 38 890
Synergy Short to medium (100) 1 - 90 - 3.6 - 60 002 -
Tiasiya Short to medium (100) - 2 - 60 - 1.4 - 25 927
UTD Medium to long (90-120) - 3 - 98 - 2.8 - 52 853
Valor Medium (100-110) 2 2 65 70 4.4 2.3 52 964 42 594

Bedryfsdienste • Industry Services
CHIPS • March/April 2016 • Page 57
0
50
100
150
200
250
300
350
January February March April May June July
Rain
fall
(mm
)
Month
Total rainfall per month 2014 Total rainfall per month 2015 Long term average rainfall
Cumulative rainfall 2014 Cumulative rainfall 2015 Long term cumulative rainfall
-10
0
10
20
30
40
50
01-Ja
n 08
-Jan
15-Ja
n 22
-Jan
29-Ja
n 05
-Feb
12
-Feb
19
-Feb
26
-Feb
05
-Mar
12
-Mar
19
-Mar
26
-Mar
02
-Apr
09
-Apr
16
-Apr
23
-Apr
30
-Apr
07
-May
14
-May
21
-May
28
-May
04
-Jun
11-Ju
n 18
-Jun
25-Ju
n 02
-Jul
09-Ju
l 16
-Jul
23-Ju
l 30
-Jul
Tem
pera
ture
(°C)
Date
Maximum temperature 2014 Minimum temperature 2014 Maximum temperature 2015 Minimum temperature 2015 Long term average maximum temperature Long term average minimum temperature
2014 2015 Plant Harvest
Figure 2: Rainfall during the growing season (2014 en 2015) as well as the long term average rainfall.
Figure 3: Minimum and maximum temperatures (0ºC) during the growing seasons (2014 and 2015) as well as long term.

Page 58 • CHIPS • Maart/April 2016
planted in the 2014 and 2015 trial are indicated in Table 2.
Temperature, photoperiod (day length) and soil moisture are the most important abiotic factors that influence the growth pattern, yield and quality of potatoes. To determine the ability of new cultivars to adapt to the Bultfontein area, it is important to take note of these factors into account when the performance of the different cultivars are evaluated. It is also important that cultivars are evaluated for a number of seasons because climate differs from season to season.
WEATHER DATA FOR THE 2014 AND 2015 GROWING SEASON
The measured rainfall during the 2014 growing season followed the same pattern as in previous years with the exception of February, March and April which was higher compared to the long term average rainfall (Figure 2). On the other hand, the measured rainfall in respect of the 2015 trials was significantly lower than the norm throughout the growing season (Figure 2). The maximum temperatures (Figure 3) for the 2014 growing season was higher than the norm during January, April and May whereas in
2015 extreme maximum temperatures were experienced from January until May. During 2015 higher than normal minimum temperatures were also conspicuously evident from May to July. During the 2014 growing season temperatures below freezing-point (0ºC) were observed from early June and continued until the end of the season. On the other hand the minimum temperatures for the 2015 trial were in general higher compared to the long term average data and temperatures below freezing-point were only experienced by middle June. There was also huge differences in the maximum and minimum temperatures throughout the 2014 and 2015 seasons (Figure 3). These extreme weather conditions could have negatively affected the yield and quality of the cultivars.
Heat units are also an important factor to take into account because the development of the plant is primarily based on the accumulating heat units. It is therefore accepted that a plant must accumulate a specific number of heat units to complete the development phase. The heat units of both the 2014 and 2015 growing seasons were continually slightly higher than the norm the heat units of the 2015 growing season were higher than the norm (long term accumulative heat units) as indicated in Figure 4.
-200
0
200
400
600
800
1000
1200
1400
1600
January February March April May June July
Heat
uni
ts
Month
Total heat units per month 2014 Total heat units per month 2015 Long term average heat units
Cumulative heat units 2014 Cumulative heat units 2015 Long term cumulative heat units
Figure 4: Heat units during the growing season (2014 and 2015) as well as long term average.

Bedryfsdienste • Industry Services
CHIPS • March/April 2016 • Page 59
58.90 63.44
83.60 84.75 85.51
87.50 92.77
97.05 99.39
105.93 110.43 111.96 113.57 113.94
118.76 120.67 121.02
130.83
0 20 40 60 80 100 120 140 160
Nectar Almera
Elmundo Valor
Destiny Marimba
Electra Savanna Labadia Konsul
Synergy Panamera
Everest Lanorma Markies
Sifra Kikko
Mondial
Yield and marketing index as percentage of the trial average (%) for 2014
Culti
var
Yield index (%) Marketing index (%)
p < 0.01 LSD = 22.1 CV% = 11.7
2014
44.0 57.4
68.5 84.2
88.9 89.3
91.6 93.3
96.3 97.9 99.4
107.0 111.7 112.7
123.2 124.5
132.3 135.2
142.8
0 20 40 60 80 100 120 140 160 180
Eos Marimba
Sifra Navigator
Almera Destiny Electra
UTD Savanna
Fianna Golf
Taisiya Monati
Valor Lanorma Melanto
Panamera Mondial Markies
Yield and marketing index as percentage of the trial average (%) for 2015
Culti
var
Yield index (%) Marketing index (%)
p < 0.01 LSD = 32.4 CV% = 14.6
2015
Figure 5: Total yield and marketing index per cultivar for 2014 as percentage of the trial average.
Figure 6: Total yield and marketing index per cultivar for 2015 as percentage of the trial average.
*Values followed by the same letter are not significantly different from one another.
*Values followed by the same letter are not significantly different from one another.

Page 60 • CHIPS • Maart/April 2016
0
5
10
15
20
25
30
35
40
45
50
Size
dist
ribut
ion
(t/h
a) fo
r 201
4
Cultivar
Baby Small Medium Large medium Large Trial average 2014
34.4 t/ha
0
5
10
15
20
25
30
35
40
45
Size
dist
ribut
ion
(t/h
a) fo
r 201
5
Cultivar
Baby Small Medium Large medium Large Trial average 2015
27.05 t/ha
Figure 7: Size distribution of each cultivar during the 2014 final harvest.
Figure 8: Size distribution of each cultivar during the 2015 final harvest.

Bedryfsdienste • Industry Services
CHIPS • March/April 2016 • Page 61
0
5
10
15
20
25
30
35
40
45
50
Gra
ding
(t/h
a) fo
r 201
4
Cultivar
Rejected Class 3 Class 2 Class 1 Trial average 2014
34.4 t/ha
Figure 9: Grading of each cultivar during the 2014 final harvest.
0
5
10
15
20
25
30
35
40
45
Grad
ing
(t/h
a) fo
r 201
5
Cultivar
Rejected Class 3 Class 2 Class 1 Trial average 2015
27.05 t/ha
Figure 10: Grading of each cultivar during the 2015 final harvest.

Page 62 • CHIPS • Maart/April 2016
YIELD DATA
The yield data collected from the trals was statistically analysed using the statistical program GenStat® and the means were separated using the Tukey LSD test at the 5% level. The cultivar effect for the 2014 trials (Figure 5) and the 2015 trials (Figure 6) was both statistically highly significant (p<0. 01) in respect of yield while the coefficient of variation was low (2014 = 11.7%, 2015 = 14.6%). This indicates that the trials were well executed and the results are trustworthy. The trial average of all the cultivars is taken as 100%. The yield of the individual cultivars is then divided by the trial average and the yield performance of each cultivar are expressed as a percentage of the trial average (yield index).
In 2014, high yields were recorded (average 34.4 t/ha) that can probably be ascribed to the good rains received compared to the long term weather data for the area. This resulted in the plants reaching their potential and the tubers bulking quicker before the frost shortened the growing season. The cultivar Mondial attained the highest yield, and which was significantly higher than the cultivars Konsul, Labadia, Savanna, Electra, Marimba, Destiny, Valor, Elmundo, Almera and Nectar. On the other hand Nectar and Almera (Figure 5) attained the lowest yields that can be ascribed to the poor plant population (50% and 65% respectively). Higher yields than the trial average (34.4 t/ha) were attained by the cultivars Mondial, Kikko, Sifra, Markies, Lanorma, Everest, Panamera, Synergy and Konsul.
The average yield (27.05 t/ha) for the 2015 season was significantly lower and can primarily be ascribed to the fact that compared to the long term weather data lot less rain had fallen at the trial site during the growing season. The drought continued throughout the season which could have affected yields negatively. The plants, therefore, could not reach their full potential to initiated tuber and bulk before the frost damaged the foliage. During the 2015 trials (Figure 6) the cultivar Markies attained the highest yield which was significantly higher compared to the other cultivars, excluding Mondial, Panamera, Melanto, Lanorma, Valor and Monati. On the other hand Eos that statistically did not differ from Marimba, Sifra and Navigator, had the poorest yield which can be ascribed to the poor plant population (50% and 65% respectively). Higher yields than the trial average (27.05 t/ha) were attained by the cultivars Markies, Mondial, Panamera, Melanto, Lanorma, Valor, Monati and Taisiya.
In order to determine the performance of the cultivars in terms of yield and quality, the yield, size distribution and class were used to determine a marketing index based on
the average market prices for the relevant day. The yield multiplied by the current price, which is determined by the size group distribution and grading, gives the marketing index (Figure 5). The cultivar Lanorma attained the highest marketing index during the 2014 growing season and Sifra during the 2015 growing season that can be ascribed to both the high percentage large and class 1 potatoes produced by the cultivars. Size distribution and grading are also factors that are used to class potatoes, and is therefore important to take into account to ensure an optimum economically marketable yield. In Figures 7 and 8 the size distribution are indicated and in Figures 9 and 10 the grading of the yields of the various cultivars.
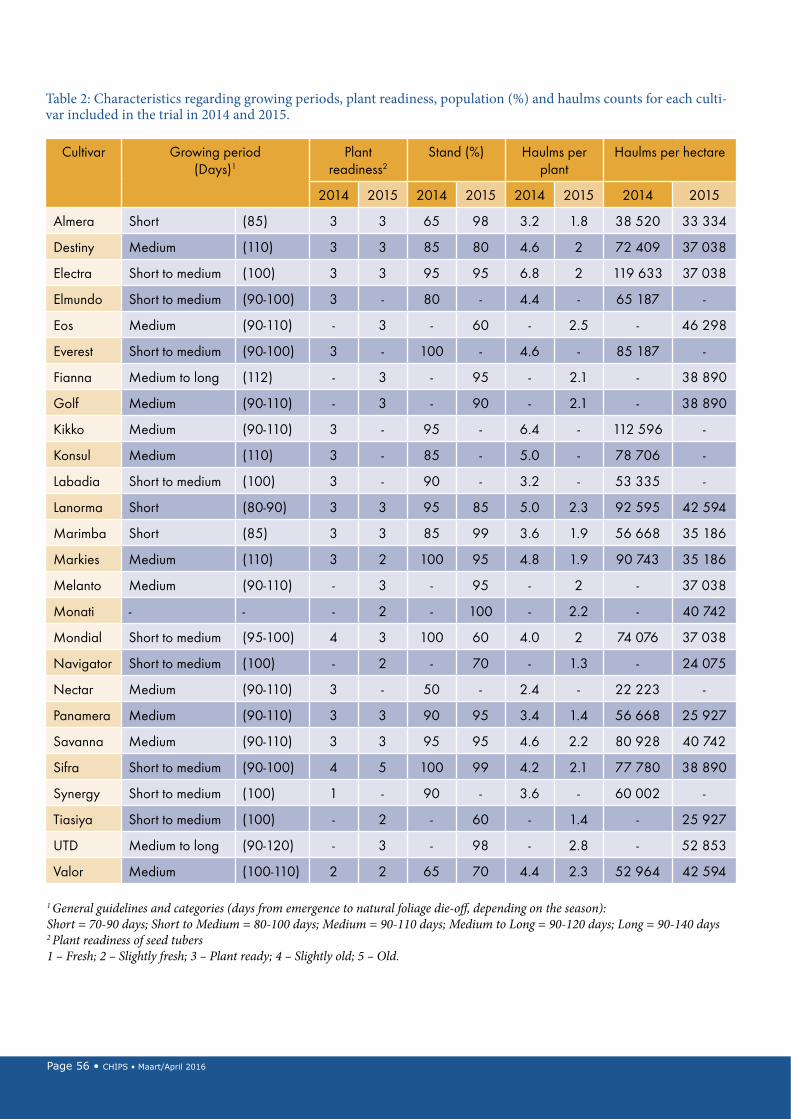
It is also important to take cognisance of the ability of the cultivars to perform consistently, in spite of climatic fluctuations over time. In Figure 8 the five year data is indicated in respect of the cultivar trials in the Kroonstad production area. It appears that the cultivar Lanorma has shown the least variation for the Kroonstad area.
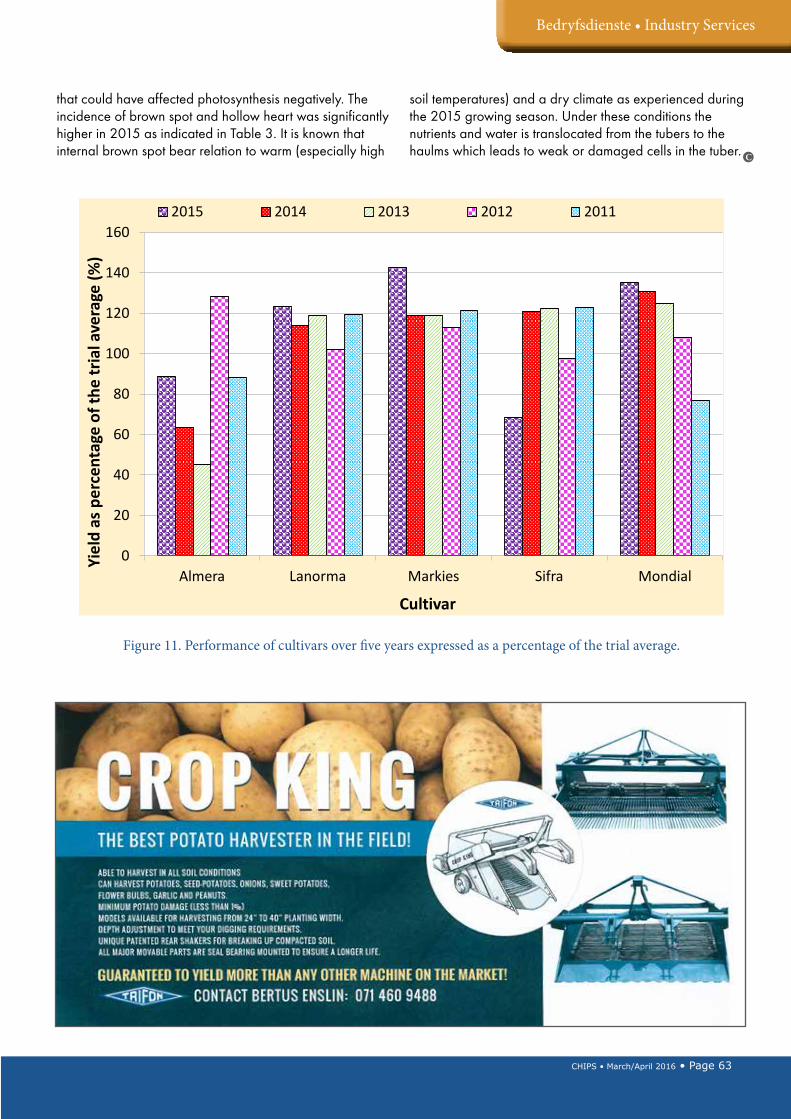
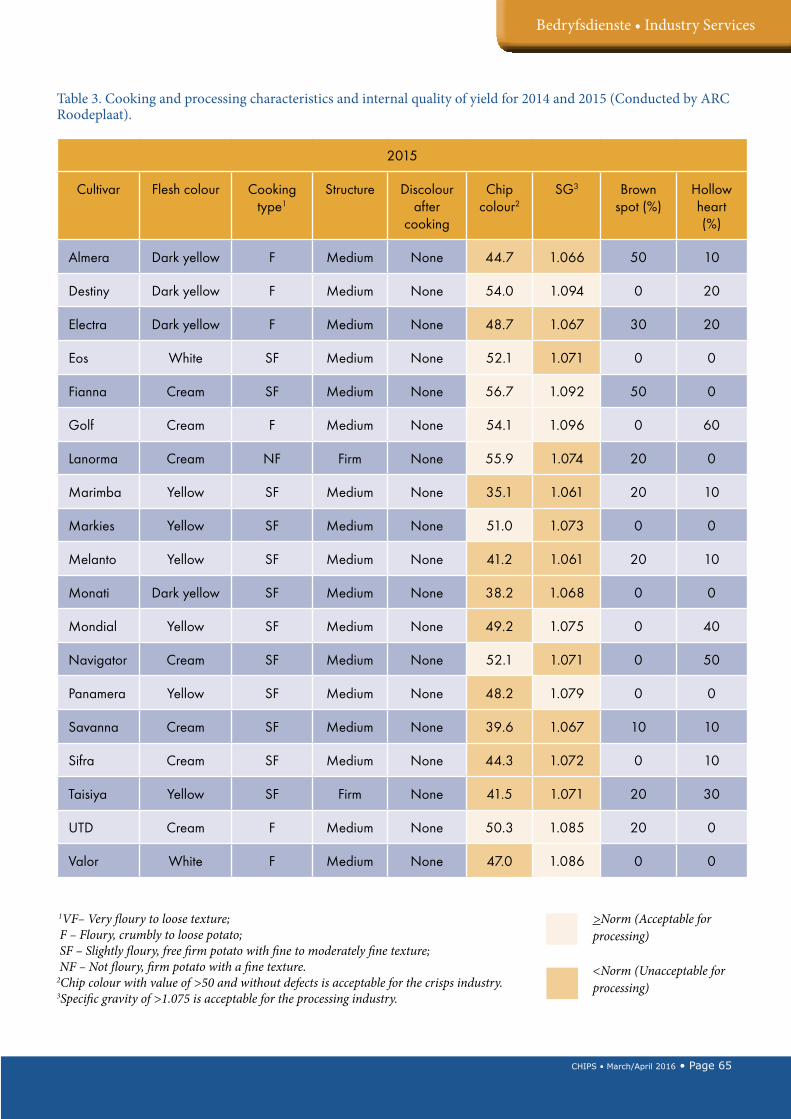
Furthermore it is important to focus on the internal quality of the product in order to ensure an optimum economically marketable yield, and therefore profitability. It includes important factors such as cooking and processing characteristics, specific gravity (SG) as well as internal defects (hollow heart, brown spot and vascular discolouration) that is summarized in Table 3.
During the 2014 growing season only the cultivars Lanorma and Markies complied with the chip colour norm of >50 for processing. However, a slight discolouration was found with the cultivar Valor after cooking. In respect of specific gravity (SG) the cultivars Destiny, Labadia, Lanorma, Markies, Nectar, Panamera, Savanna and Valor complied with the norm of ≥1.075. The low SG values can possibly be ascribed to the environmental conditions, such as the temperatures below freezing point that caused foliage damage and therefore affected photosynthesis negatively, and extremely high temperatures that cause excessive respiration and inhibited starch accumulation. As far as internal defects are concerned the cultivars Destiny, Labadia, Lanorma, Markies, Nectar, Panamera, Savanna and en Valor showed evidence of brown spot. In addition, the cultivars Everest (10%), Lanorma (10%), Marimba (30%), Markies (30%), Nectar (10%) and Savanna (20%) showed evidence of hollow heart.
As far as the 2015 growing season’s specific gravity (SG) is concerned, the cultivars Destiny, Fianna, Golf, Mondial, Panamera, Up-to-Date and Valor complied with the norm of ≥1.075. The low SG values can possibly be ascribed to the environmental conditions, for example high temperatures
Bedryfsdienste • Industry Services
CHIPS • March/April 2016 • Page 63
soil temperatures) and a dry climate as experienced during the 2015 growing season. Under these conditions the nutrients and water is translocated from the tubers to the haulms which leads to weak or damaged cells in the tuber.
0
20
40
60
80
100
120
140
160
Almera Lanorma Markies Sifra Mondial
Yiel
d as
per
cent
age
of th
e tr
ial a
vera
ge (%
)
Cultivar
2015 2014 2013 2012 2011
Figure 11. Performance of cultivars over five years expressed as a percentage of the trial average.
that could have affected photosynthesis negatively. The incidence of brown spot and hollow heart was significantly higher in 2015 as indicated in Table 3. It is known that internal brown spot bear relation to warm (especially high C
Page 64 • CHIPS • Maart/April 2016
1VF– Very floury to loose texture; F – Floury, crumbly to loose potato; SF – Slightly floury, free firm potato with fine to moderately fine texture; NF – Not floury, firm potato with a fine texture. 2Chip colour with value of >50 and without defects is acceptable for the crisps industry. 3Specific gravity of >1.075 is acceptable for the processing industry.
Table 3. Cooking and processing characteristics and internal quality of yield for 2014 and 2015 (Conducted by ARC Roodeplaat).
2014
Cultivar Flesh colour
Cooking type1
Structure Discolour after
cooking
Chip colour2
SG3 Brown spot (%)
Hollow heart (%)
Almera Yellow SF Medium None 36.9 1.071 0 0
Destiny Yellow F Medium None 49.1 1.093 20 0
Electra Cream SF Medium None 42.1 1.069 0 0
Elmundo Yellow SF Medium None 39.6 1.068 0 0
Everest Yellow SF Medium None 40.7 1.072 50 10
Kikko Cream SF Medium None 41.0 1.074 0 0
Konsul Yellow F Medium None 31.1 1.069 10 0
Labadia Yellow SF Medium None 43.0 1.076 40 0
Lanorma Cream SF Medium None 51.5 1.079 0 10
Marimba Yellow SF Medium None 35.4 1.066 0 30
Markies Yellow SF Medium None 56.2 1.085 20 30
Mondial Yellow SF Medium None 40.5 1.074 0 0
Nectar Yellow F Medium None 40.3 1.082 0 10
Panamera Cream SF Medium None 44.2 1.080 0 0
Savanna Yellow F Medium None 34.7 1.075 0 20
Sifra Cream NF Firm None 39.0 1.073 0 0
Synergy Yellow NF Firm None 33.1 1.062 0 0
Valor Cream NF Firm Slight 35.9 1.079 10 0
>Norm (Acceptable for processing)
<Norm (Unacceptable for processing)
Bedryfsdienste • Industry Services
CHIPS • March/April 2016 • Page 65
2015
Cultivar Flesh colour Cooking type1
Structure Discolour after
cooking
Chip colour2
SG3 Brown spot (%)
Hollow heart (%)
Almera Dark yellow F Medium None 44.7 1.066 50 10
Destiny Dark yellow F Medium None 54.0 1.094 0 20
Electra Dark yellow F Medium None 48.7 1.067 30 20
Eos White SF Medium None 52.1 1.071 0 0
Fianna Cream SF Medium None 56.7 1.092 50 0
Golf Cream F Medium None 54.1 1.096 0 60
Lanorma Cream NF Firm None 55.9 1.074 20 0
Marimba Yellow SF Medium None 35.1 1.061 20 10
Markies Yellow SF Medium None 51.0 1.073 0 0
Melanto Yellow SF Medium None 41.2 1.061 20 10
Monati Dark yellow SF Medium None 38.2 1.068 0 0
Mondial Yellow SF Medium None 49.2 1.075 0 40
Navigator Cream SF Medium None 52.1 1.071 0 50
Panamera Yellow SF Medium None 48.2 1.079 0 0
Savanna Cream SF Medium None 39.6 1.067 10 10
Sifra Cream SF Medium None 44.3 1.072 0 10
Taisiya Yellow SF Firm None 41.5 1.071 20 30
UTD Cream F Medium None 50.3 1.085 20 0
Valor White F Medium None 47.0 1.086 0 0
Table 3. Cooking and processing characteristics and internal quality of yield for 2014 and 2015 (Conducted by ARC Roodeplaat).
1VF– Very floury to loose texture; F – Floury, crumbly to loose potato; SF – Slightly floury, free firm potato with fine to moderately fine texture; NF – Not floury, firm potato with a fine texture. 2Chip colour with value of >50 and without defects is acceptable for the crisps industry. 3Specific gravity of >1.075 is acceptable for the processing industry.
>Norm (Acceptable for processing)
<Norm (Unacceptable for processing)