Embed Size (px)
Citation preview
PROJECT REPORT
WESTERN COOLING CHALLENGE LABORATORY RESULTS: TRANE VOYAGER DC HYBRID ROOFTOP UNIT
Western Cooling Efficiency Center-UC Davis
October 31, 2012
WESTERN COOLING EFFICIENCY CENTER

TRANE VOYAGER DC LAB RESULTS 2 PROJECT REPORT
PREPARED FOR:Design & Engineering Services
Customer Service Business Unit
Southern California Edison
PREPARED BY:Jonathan Woolley
Associate Engineer
530.204.7619
Paul Fortunato
Outreach Coordinator
Western Cooling Efficiency Center
University of California, Davis
215 Sage Street #100
Davis, CA 95616
wcec.ucdavis.edu
ABOUT THE WESTERN COOLING EFFICIENCY CENTERThe Western Cooling Efficiency Center was established along side the UC Davis Energy Efficiency Center in 2007 through a grant from the California Clean
Energy Fund and in partnership with California Energy Commission Public Interest Energy Research Program. The Center partners with industry stakeholders
to advance cooling-technology innovation by applying technologies and programs that reduce energy, water consumption and peak electricity demand
associated with cooling in the Western United States.
TRANE VOYAGER DC LAB RESULTS 3 PROJECT REPORT
Section Title Page
1.0 Executive Summary 4
2.0 Introduction 5
3.0 Overview of Trane Voyager DC Operation 5
4.0 Performance Requirements 8
5.0 Facility and Laboratory Setup 9
6.0 Design of Experiments 14
7.0 Results 22
8.0 Conclusions 28
9.0 Recommendations 29
10.0 References 30
Appendix A Summary Table of Measurements and Results 31
Appendix B Psychrometric Charts 32
Appendix C Pressure Enthalpy Diagrams 40
TABLE OF CONTENTSSECTIONS
TRANE VOYAGER DC LAB RESULTS 4 PROJECT REPORT
1. EXECUTIVE SUMMARY
The Western Cooling Challenge is a program focused on advanc-
ing commercial development and market introduction of rooftop
packaged air conditioners optimized for the hot-dry climates of
the Western United States. The Challenge requires 40% energy
savings while operating at peak design conditions, compared to
equipment that meets current federal minimum equipment effi-
ciency requirements. Trane’s Voyager DC shows a savings of 43%.
The explicit goal of the effort reported here was to laboratory test
the Trane Voyager DC according to Western Cooling Challenge
test protocol. The protocol evaluates equipment performance in
hot-dry climate conditions, operating under realistic airflow resis-
tances and with an outside air ventilation rate that would be en-
countered in typical commercial retail applications. A secondary
goal was to laboratory test the equipment across a broad range
of operating conditions in order to characterize performance in
various scenarios, and to evaluate function of each major system
sub-component and operating mode.
The Trane Voyager DC is a hybrid rooftop air conditioner that inte-
grates the DualCoolTM with an otherwise conventional vapor com-
pression system. The DualCoolTM is a unique indirect evaporative
cooling strategy that uses an evaporative condenser–air pre-cool-
er to reduce the refrigerant condensing temperature of a vapor
compression system, then cycles the water chilled by evaporation
through a heat exchanger to cool the hot outside air required for
building ventilation.
While the Western Cooling Challenge performance requirement
is well beyond the reach of conventional vapor compression sys-
tems, the laboratory results documented herein demonstrate that
40% peak energy savings is achievable with savvy incorporation
of various efficiency enhancing technologies. The Trane Voyager
DC equipment met the Western Cooling Challenge criteria on the
mark.
The Western Cooling Efficiency Center (WCEC) directed the lab-
oratory tests, and contracted with Intertek to utilize the largest
independent environmental test chamber in the United States,
located at their HVAC & Electrical test facility in Plano, TX. Trane,
and Integrated Comfort provided in kind support for planning, co-
ordination, setup and commissioning of the laboratory test.
The Trane Voyager DC was tested in each operating mode across
a range of psychrometric conditions. Unfortunately, the environ-
mental chamber was not able to reach all of the humidity condi-
tions that were prescribed by the original design of experiments.
Intertek’s facility is not equipped to handle the moisture load gen-
erated by Trane’s equipment.
Dehumidification capacity for the laboratory facility allowed
for testing at the Western Cooling Challenge “Peak” condition
(Tdb=105°F, Twb=73°F), but did not allow for evaluation at the dri-
er “Annual” condition (Tdb=90°F, Twb=64°F). Thus determination
of Western Cooling Challenge certification in this case is based
on the performance measured at the “Peak” operating conditions.
Despite the humidity limitations of the facility utilized, the range
of laboratory tests covered enough operating conditions to devel-
op general characterizations of system component performance,
and provided great insight into opportunities for additional im-
provements.
Final results from the range of tests indicate the technology pro-
vides substantial energy savings for cooling, especially during
peak demand periods when the electrical grid is most strained.
We recommend that public interest programs and efforts de-
signed to apply this technology consider its value compared to
the alternative cost of new peak electrical generation capacity.
Scrutiny of the laboratory observations also indicates there is still
room for moderate performance improvements for the equip-
ment. Some of the possible measures for added efficiency are
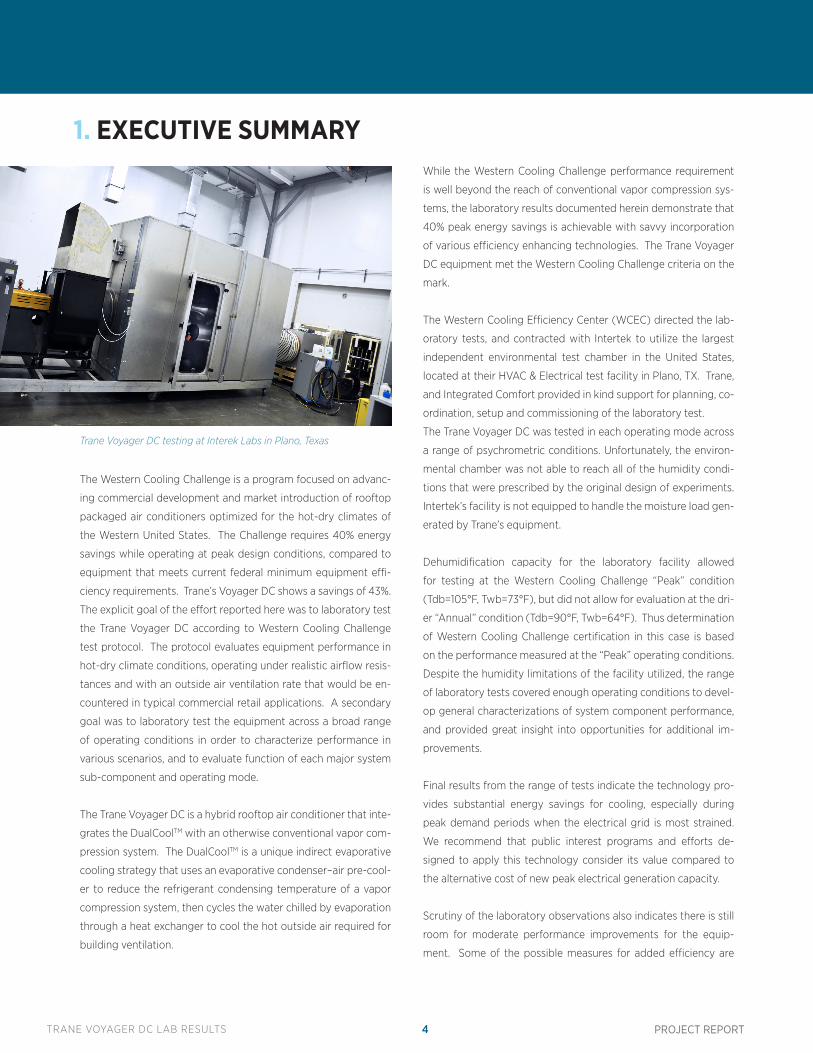
Trane Voyager DC testing at Interek Labs in Plano, Texas
TRANE VOYAGER DC LAB RESULTS 5 PROJECT REPORT
already manufacturer options for the equipment and will be
evaluated through various pilot field demonstrations currently
in progress. These measures include variable speed supply fan
operation for savings at part capacity operation and during con-
tinuous ventilation periods, and microchannel heat exchangers for
improved condenser heat transfer effectiveness.
Others potential enhancements, discussed herein will require fur-
ther research and innovation in system design and control. These
recommended measures include optimization for economizer
control, improved condenser air cooling, and the potential for in-
creased cooling capacity for the ventilation air cooling coil.
2. INTRODUCTIONThe Western Cooling Challenge is an ongoing program that en-
courages HVAC manufactures to develop and commercialize cli-
mate-appropriate rooftop packaged air conditioning equipment
that will reduce electrical demand and energy use for cooling in
Western climates by at least 40% compared to DOE 2010 stan-
dards. The Challenge was developed at the behest of commer-
cial building owners, investor-owned utilities, and HVAC industry
stakeholders who recognize the economic value of efficient cool-
ing technologies, and are motivated by state and corporate goals
for energy and sustainability. For example, the California Public
Utility Commission’s Energy Efficiency Strategic Plan gives specif-
ic priority to the application of climate-appropriate cooling tech-
nologies, such as those advanced by the Challenge. The Western
Cooling Efficiency Center (WCEC) developed the Western Cooling
Challenge test protocol and minimum performance criteria in or-
der to provide a standard basis for evaluating advanced rooftop
unit cooling technologies that are designed especially for applica-
tion in hot-dry climates such as California. The Challenge does not
require a particular type of system design; rather, it sets ambitious
yet achievable thresholds for energy and water-use efficiency.
Each of the technologies currently in consideration for the Chal-
lenge employ a hybrid cooling strategy that couples various in-
direct -evaporative cooling technologies with conventional vapor
compression equipment.
In partnership with Southern California Edison, and other spon-
sors, WCEC collaborates with manufacturers to advance the de-
velopment of these technologies, and conducts laboratory and
field evaluation of commercially available equipment. In 2012,
Trane Inc. submitted the Voyager DC hybrid rooftop unit as an
entry to the Challenge, and WCEC arranged to conduct rigorous
laboratory testing of the system at the Intertek psychrometric test
facility in Plano, TX. Intertek operates a large test facility that
is regularly used to evaluate performance of unitary heating and
cooling equipment. Laboratory tests were conducted in June –
July 2012.
This report reviews the design and operation of the Trane Voy-
ager DC, describes the laboratory test facility and experimental
approach then documents performance results across a range of
operating conditions. The laboratory facility could not maintain all
of the intended psychrometric test conditions, and was not able
to measure certain variables that would have been helpful for per-
formance evaluation. Notwithstanding, the performance results
recorded qualify the Trane Voyager DC for Western Cooling Chal-
lenge certification.
Beyond testing for Western Cooling Challenge certification, the
observations are evaluated with great scrutiny to characterize be-
havior of each major sub–component in the system. This analysis
highlights a number of enlightening facts about the equipment
function, and reveals some opportunities for further improvement.
For example, results indicate that energy savings at peak could
be improved further by increasing the wet–bulb effectiveness for
the condenser–air pre–cooler, and by increasing heat transfer ef-
fectiveness of the condenser coil to allow for a lower condensing
temperature.
3. OVERVIEW OF TRANE VOYAGER DC OPERATIONTrane’s Voyager DC couples a conventional rooftop packaged air
conditioner with the DualCoolTM, an innovative indirect evapora-
tive cooling strategy that increases cooling capacity and unloads
compressor power by reducing the air temperature at the inlet
of both the condenser and evaporator coils. The system utilizes
a direct evaporative cooler to pre-cool condenser–air, then cir-
culates the water that has been chilled by evaporation through a
heat exchanger that cools incoming ventilation air.
The commercially available system incorporates staged com-
pressor operation, variable speed control for the supply blower
and condenser fans, thermostatic expansion valves, micro-chan-
nel condenser heat exchangers, integrated comparative econo-
mizer controls, and demand control ventilation. For the purpos-
TRANE VOYAGER DC LAB RESULTS 6 PROJECT REPORT
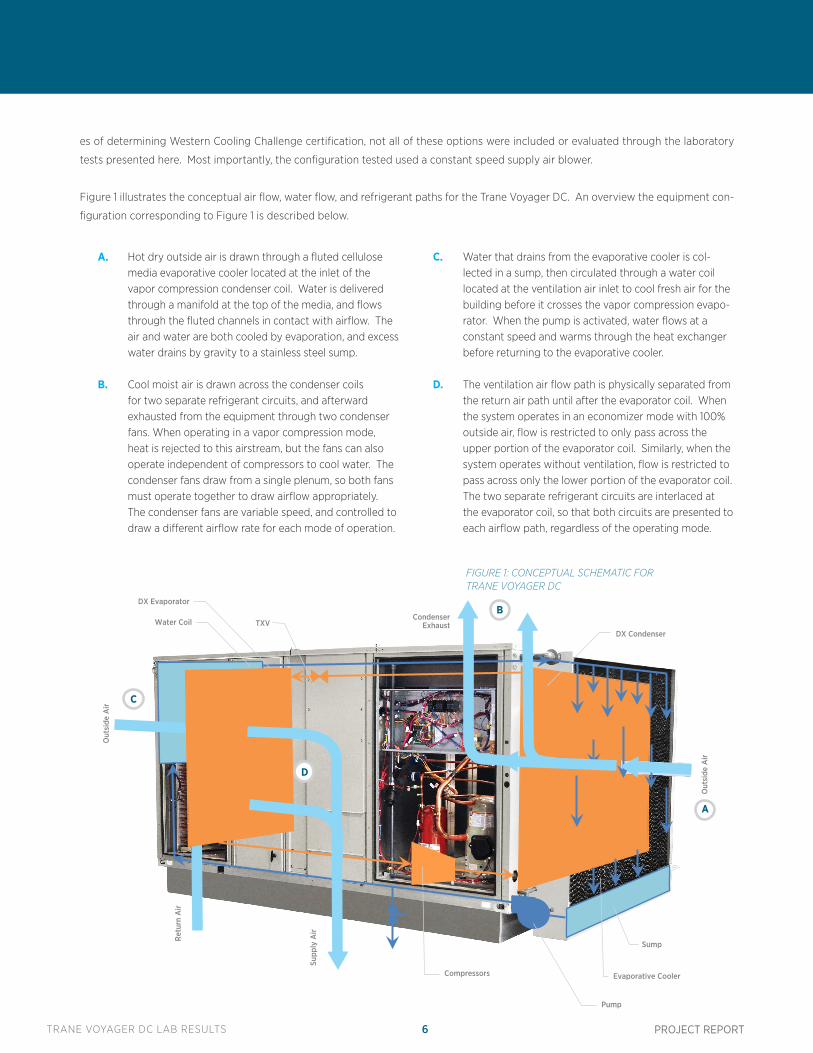
es of determining Western Cooling Challenge certification, not all of these options were included or evaluated through the laboratory
tests presented here. Most importantly, the configuration tested used a constant speed supply air blower.
Figure 1 illustrates the conceptual air flow, water flow, and refrigerant paths for the Trane Voyager DC. An overview the equipment con-
figuration corresponding to Figure 1 is described below.
Supp
ly A
ir R
etur
n A
ir
Out
side
Air
Condenser Exhaust
DX Evaporator
Water Coil DX Condenser
Sump
Pump
Evaporative Cooler Compressors
TXV
Out
side
Air
A
B
C
D
A. Hot dry outside air is drawn through a fluted cellulose media evaporative cooler located at the inlet of the vapor compression condenser coil. Water is delivered through a manifold at the top of the media, and flows through the fluted channels in contact with airflow. The air and water are both cooled by evaporation, and excess water drains by gravity to a stainless steel sump.
B. Cool moist air is drawn across the condenser coils for two separate refrigerant circuits, and afterward exhausted from the equipment through two condenser fans. When operating in a vapor compression mode, heat is rejected to this airstream, but the fans can also operate independent of compressors to cool water. The condenser fans draw from a single plenum, so both fans must operate together to draw airflow appropriately. The condenser fans are variable speed, and controlled to draw a different airflow rate for each mode of operation.
C. Water that drains from the evaporative cooler is col-lected in a sump, then circulated through a water coil located at the ventilation air inlet to cool fresh air for the building before it crosses the vapor compression evapo-rator. When the pump is activated, water flows at a constant speed and warms through the heat exchanger before returning to the evaporative cooler.
D. The ventilation air flow path is physically separated from the return air path until after the evaporator coil. When the system operates in an economizer mode with 100% outside air, flow is restricted to only pass across the upper portion of the evaporator coil. Similarly, when the system operates without ventilation, flow is restricted to pass across only the lower portion of the evaporator coil. The two separate refrigerant circuits are interlaced at the evaporator coil, so that both circuits are presented to each airflow path, regardless of the operating mode.
FIGURE 1: CONCEPTUAL SCHEMATIC FOR TRANE VOYAGER DC
TRANE VOYAGER DC LAB RESULTS 7 PROJECT REPORT
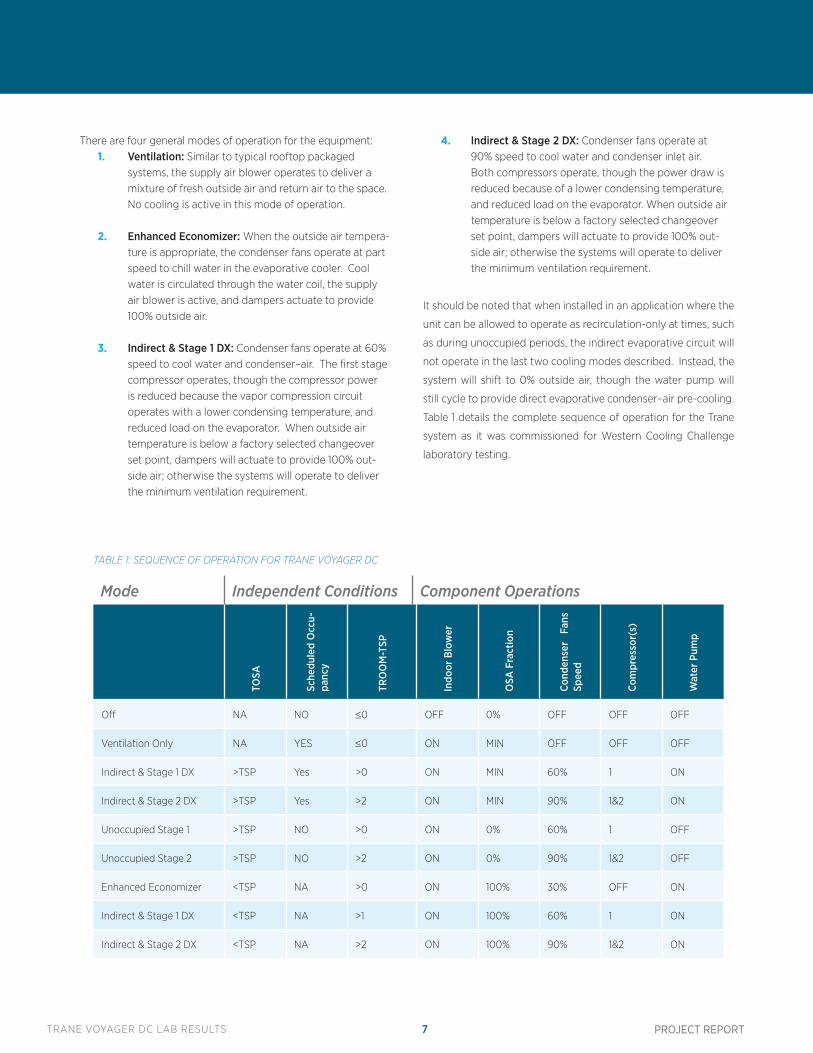
There are four general modes of operation for the equipment:1. Ventilation: Similar to typical rooftop packaged
systems, the supply air blower operates to deliver a mixture of fresh outside air and return air to the space. No cooling is active in this mode of operation.
2. Enhanced Economizer: When the outside air tempera-ture is appropriate, the condenser fans operate at part speed to chill water in the evaporative cooler. Cool water is circulated through the water coil, the supply air blower is active, and dampers actuate to provide 100% outside air.
3. Indirect & Stage 1 DX: Condenser fans operate at 60% speed to cool water and condenser–air. The first stage compressor operates, though the compressor power is reduced because the vapor compression circuit operates with a lower condensing temperature, and reduced load on the evaporator. When outside air temperature is below a factory selected changeover set point, dampers will actuate to provide 100% out-side air; otherwise the systems will operate to deliver the minimum ventilation requirement.
4. Indirect & Stage 2 DX: Condenser fans operate at 90% speed to cool water and condenser inlet air. Both compressors operate, though the power draw is reduced because of a lower condensing temperature, and reduced load on the evaporator. When outside air temperature is below a factory selected changeover set point, dampers will actuate to provide 100% out-side air; otherwise the systems will operate to deliver the minimum ventilation requirement.
It should be noted that when installed in an application where the
unit can be allowed to operate as recirculation-only at times, such
as during unoccupied periods, the indirect evaporative circuit will
not operate in the last two cooling modes described. Instead, the
system will shift to 0% outside air, though the water pump will
still cycle to provide direct evaporative condenser–air pre-cooling.
Table 1 details the complete sequence of operation for the Trane
system as it was commissioned for Western Cooling Challenge
laboratory testing.
Mode Independent Conditions Component Operations
TOSA
Sche
dule
d O
ccu-
panc
y
TRO
OM
-TSP
Indo
or B
low
er
OSA
Fra
ctio
n
Cond
ense
r Fa
ns
Spee
d
Com
pres
sor(
s)
Wat
er P
ump
Off NA NO ≤0 OFF 0% OFF OFF OFF
Ventilation Only NA YES ≤0 ON MIN OFF OFF OFF
Indirect & Stage 1 DX >TSP Yes >0 ON MIN 60% 1 ON
Indirect & Stage 2 DX >TSP Yes >2 ON MIN 90% 1&2 ON
Unoccupied Stage 1 >TSP NO >0 ON 0% 60% 1 OFF
Unoccupied Stage 2 >TSP NO >2 ON 0% 90% 1&2 OFF
Enhanced Economizer <TSP NA >0 ON 100% 30% OFF ON
Indirect & Stage 1 DX <TSP NA >1 ON 100% 60% 1 ON
Indirect & Stage 2 DX <TSP NA >2 ON 100% 90% 1&2 ON
TABLE 1: SEQUENCE OF OPERATION FOR TRANE VOYAGER DC
TRANE VOYAGER DC LAB RESULTS 8 PROJECT REPORT
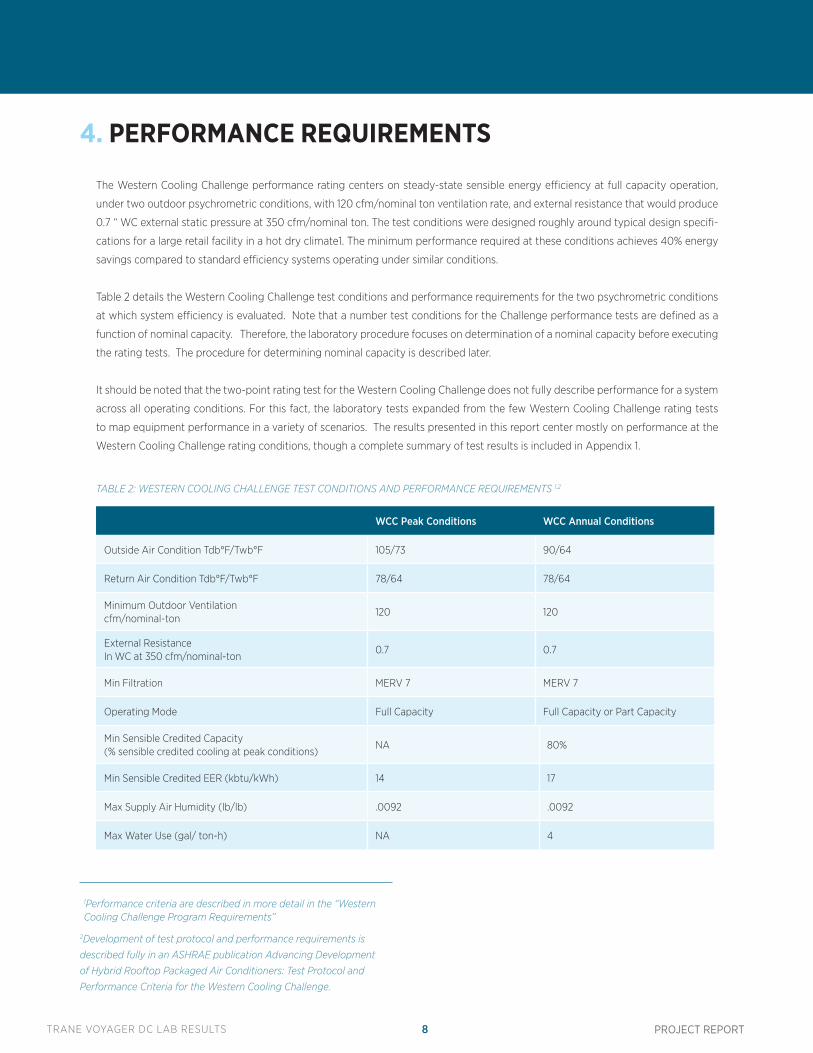
The Western Cooling Challenge performance rating centers on steady-state sensible energy efficiency at full capacity operation,
under two outdoor psychrometric conditions, with 120 cfm/nominal ton ventilation rate, and external resistance that would produce
0.7 “ WC external static pressure at 350 cfm/nominal ton. The test conditions were designed roughly around typical design specifi-
cations for a large retail facility in a hot dry climate1. The minimum performance required at these conditions achieves 40% energy
savings compared to standard efficiency systems operating under similar conditions.
Table 2 details the Western Cooling Challenge test conditions and performance requirements for the two psychrometric conditions
at which system efficiency is evaluated. Note that a number test conditions for the Challenge performance tests are defined as a
function of nominal capacity. Therefore, the laboratory procedure focuses on determination of a nominal capacity before executing
the rating tests. The procedure for determining nominal capacity is described later.
It should be noted that the two-point rating test for the Western Cooling Challenge does not fully describe performance for a system
across all operating conditions. For this fact, the laboratory tests expanded from the few Western Cooling Challenge rating tests
to map equipment performance in a variety of scenarios. The results presented in this report center mostly on performance at the
Western Cooling Challenge rating conditions, though a complete summary of test results is included in Appendix 1.
4. PERFORMANCE REQUIREMENTS
WCC Peak Conditions WCC Annual Conditions
Outside Air Condition Tdb°F/Twb°F 105/73 90/64
Return Air Condition Tdb°F/Twb°F 78/64 78/64
Minimum Outdoor Ventilationcfm/nominal-ton
120 120
External ResistanceIn WC at 350 cfm/nominal-ton
0.7 0.7
Min Filtration MERV 7 MERV 7
Operating Mode Full Capacity Full Capacity or Part Capacity
Min Sensible Credited Capacity(% sensible credited cooling at peak conditions)
NA 80%
Min Sensible Credited EER (kbtu/kWh) 14 17
Max Supply Air Humidity (lb/lb) .0092 .0092
Max Water Use (gal/ ton-h) NA 4
TABLE 2: WESTERN COOLING CHALLENGE TEST CONDITIONS AND PERFORMANCE REQUIREMENTS 1,2
1Performance criteria are described in more detail in the “Western Cooling Challenge Program Requirements”
2Development of test protocol and performance requirements is
described fully in an ASHRAE publication Advancing Development
of Hybrid Rooftop Packaged Air Conditioners: Test Protocol and
Performance Criteria for the Western Cooling Challenge.
TRANE VOYAGER DC LAB RESULTS 9 PROJECT REPORT
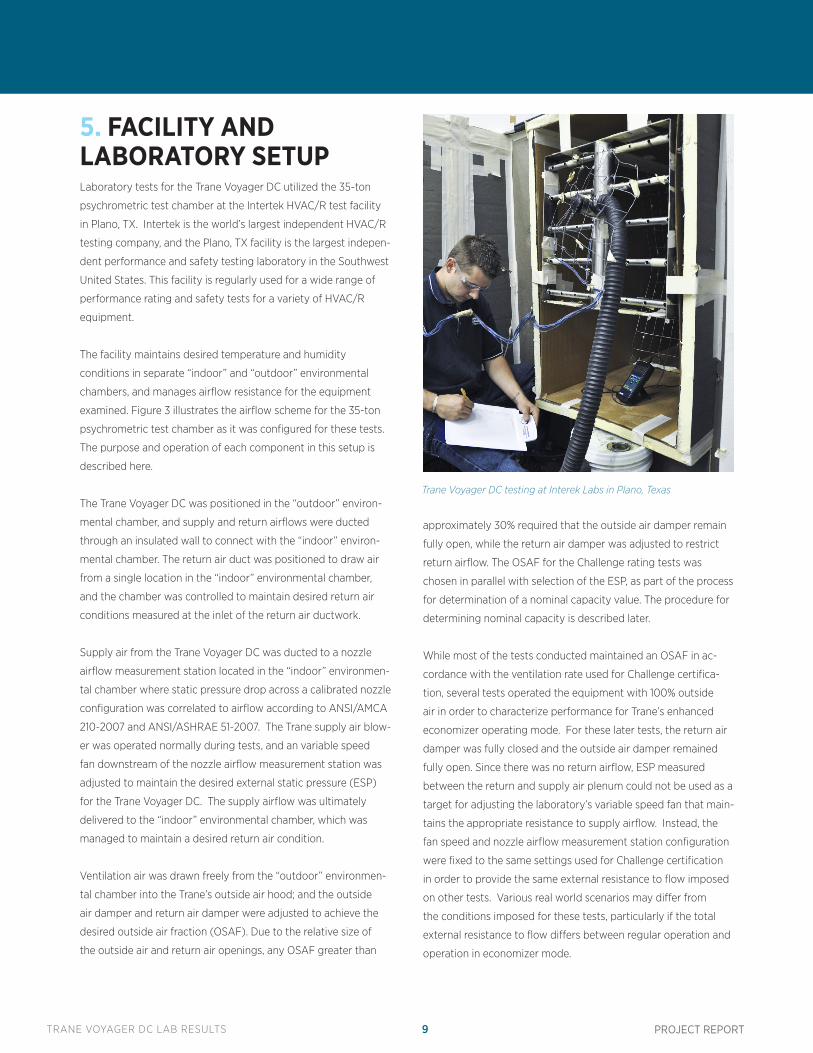
5. FACILITY AND LABORATORY SETUPLaboratory tests for the Trane Voyager DC utilized the 35-ton
psychrometric test chamber at the Intertek HVAC/R test facility
in Plano, TX. Intertek is the world’s largest independent HVAC/R
testing company, and the Plano, TX facility is the largest indepen-
dent performance and safety testing laboratory in the Southwest
United States. This facility is regularly used for a wide range of
performance rating and safety tests for a variety of HVAC/R
equipment.
The facility maintains desired temperature and humidity
conditions in separate “indoor” and “outdoor” environmental
chambers, and manages airflow resistance for the equipment
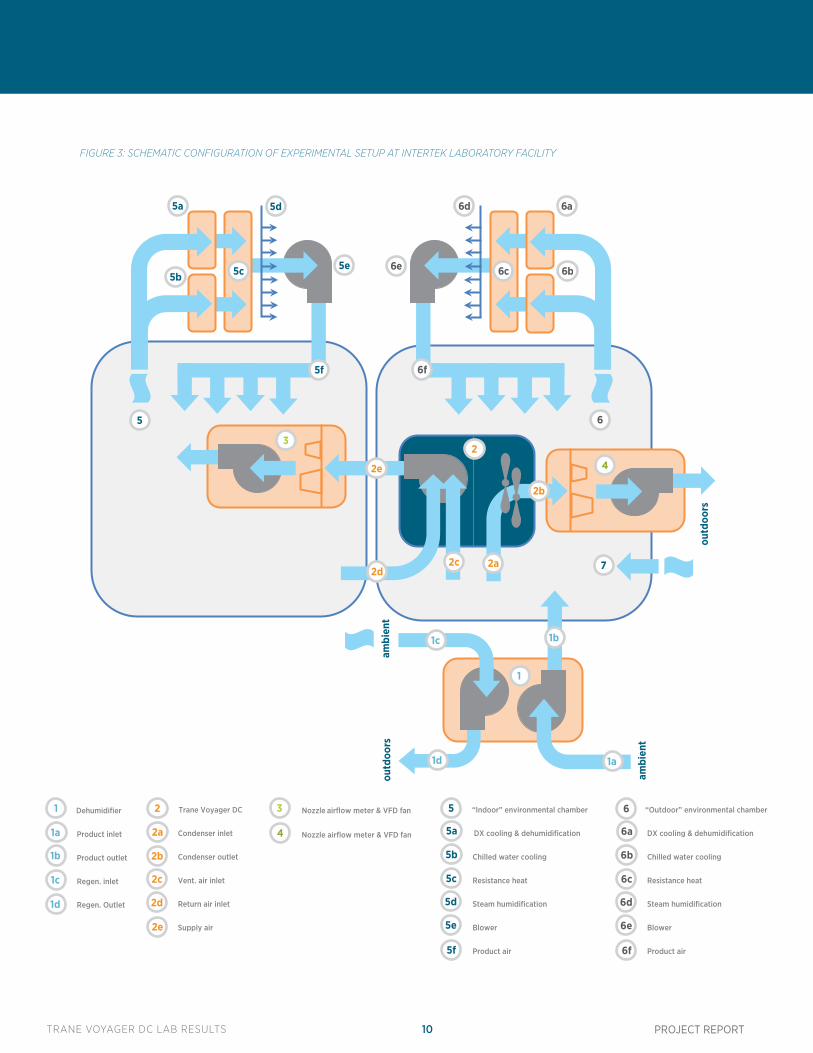
examined. Figure 3 illustrates the airflow scheme for the 35-ton
psychrometric test chamber as it was configured for these tests.
The purpose and operation of each component in this setup is
described here.
The Trane Voyager DC was positioned in the “outdoor” environ-
mental chamber, and supply and return airflows were ducted
through an insulated wall to connect with the “indoor” environ-
mental chamber. The return air duct was positioned to draw air
from a single location in the “indoor” environmental chamber,
and the chamber was controlled to maintain desired return air
conditions measured at the inlet of the return air ductwork.
Supply air from the Trane Voyager DC was ducted to a nozzle
airflow measurement station located in the “indoor” environmen-
tal chamber where static pressure drop across a calibrated nozzle
configuration was correlated to airflow according to ANSI/AMCA
210-2007 and ANSI/ASHRAE 51-2007. The Trane supply air blow-
er was operated normally during tests, and an variable speed
fan downstream of the nozzle airflow measurement station was
adjusted to maintain the desired external static pressure (ESP)
for the Trane Voyager DC. The supply airflow was ultimately
delivered to the “indoor” environmental chamber, which was
managed to maintain a desired return air condition.
Ventilation air was drawn freely from the “outdoor” environmen-
tal chamber into the Trane’s outside air hood; and the outside
air damper and return air damper were adjusted to achieve the
desired outside air fraction (OSAF). Due to the relative size of
the outside air and return air openings, any OSAF greater than
approximately 30% required that the outside air damper remain
fully open, while the return air damper was adjusted to restrict
return airflow. The OSAF for the Challenge rating tests was
chosen in parallel with selection of the ESP, as part of the process
for determination of a nominal capacity value. The procedure for
determining nominal capacity is described later.
While most of the tests conducted maintained an OSAF in ac-
cordance with the ventilation rate used for Challenge certifica-
tion, several tests operated the equipment with 100% outside
air in order to characterize performance for Trane’s enhanced
economizer operating mode. For these later tests, the return air
damper was fully closed and the outside air damper remained
fully open. Since there was no return airflow, ESP measured
between the return and supply air plenum could not be used as a
target for adjusting the laboratory’s variable speed fan that main-
tains the appropriate resistance to supply airflow. Instead, the
fan speed and nozzle airflow measurement station configuration
were fixed to the same settings used for Challenge certification
in order to provide the same external resistance to flow imposed
on other tests. Various real world scenarios may differ from
the conditions imposed for these tests, particularly if the total
external resistance to flow differs between regular operation and
operation in economizer mode.
Trane Voyager DC testing at Interek Labs in Plano, Texas
TRANE VOYAGER DC LAB RESULTS 10 PROJECT REPORT
1
1a
1b
1d
1c
2
2a 2c 2d
2e
2b
3
4
5
5a
5b 5c
5d
5e
6e
6d
6c
6a
6b
ambi
ent
outd
oors
ambi
ent
outd
oors
6
6f 5f
Dehumidifier
Product inlet
Product outlet
Regen. inlet
Regen. Outlet
1
1a
1b
1c
1d
Trane Voyager DC
Condenser inlet
Condenser outlet
Vent. air inlet
Return air inlet
Supply air
2
2a
2b
2c
2d
2e
“Indoor” environmental chamber
DX cooling & dehumidification
Chilled water cooling
Resistance heat
Steam humidification
Blower
Product air
5
5a
5b
5c
5d
5e
5f
Nozzle airflow meter & VFD fan3
Nozzle airflow meter & VFD fan4
“Outdoor” environmental chamber
DX cooling & dehumidification
Chilled water cooling
Resistance heat
Steam humidification
Blower
Product air
6
6a
6b
6c
6d
6e
6f
7
FIGURE 3: SCHEMATIC CONFIGURATION OF EXPERIMENTAL SETUP AT INTERTEK LABORATORY FACILITY
TRANE VOYAGER DC LAB RESULTS 11 PROJECT REPORT
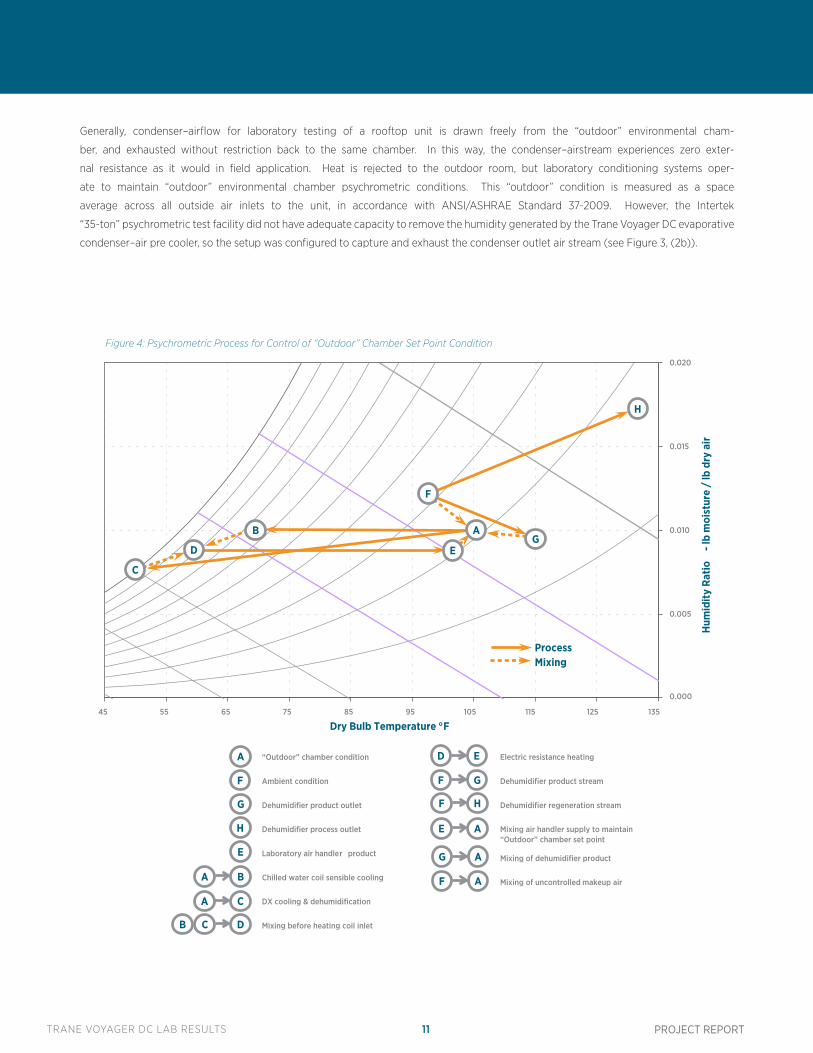
Generally, condenser–airflow for laboratory testing of a rooftop unit is drawn freely from the “outdoor” environmental cham-
ber, and exhausted without restriction back to the same chamber. In this way, the condenser–airstream experiences zero exter-
nal resistance as it would in field application. Heat is rejected to the outdoor room, but laboratory conditioning systems oper-
ate to maintain “outdoor” environmental chamber psychrometric conditions. This “outdoor” condition is measured as a space
average across all outside air inlets to the unit, in accordance with ANSI/ASHRAE Standard 37-2009. However, the Intertek
“35-ton” psychrometric test facility did not have adequate capacity to remove the humidity generated by the Trane Voyager DC evaporative
condenser–air pre cooler, so the setup was configured to capture and exhaust the condenser outlet air stream (see Figure 3, (2b)).
“Outdoor” chamber condition
Ambient condition
Dehumidifier product outlet
Dehumidifier process outlet
Laboratory air handler product
Chilled water coil sensible cooling
DX cooling & dehumidification
Mixing before heating coil inlet
Electric resistance heating
Dehumidifier product stream
Dehumidifier regeneration stream
Mixing air handler supply to maintain “Outdoor” chamber set point
Mixing of dehumidifier product
Mixing of uncontrolled makeup air
0.000
0.005
0.010
0.015
0.020
45 55 65 75 85 95 105 115 125 135H
umid
ity R
atio
- l
b m
oist
ure
/ lb
dry
air
Dry Bulb Temperature °F
Mixing
D
C
E
F
G
H
B A
Process
B C D
A C
D E
A B
F G
F H
E A
G A
F A
A
F
G
E
H
Figure 4: Psychrometric Process for Control of “Outdoor” Chamber Set Point Condition
TRANE VOYAGER DC LAB RESULTS 12 PROJECT REPORT
A plenum was constructed at the condenser outlet, from which
condenser outlet air was ducted to a second nozzle airflow mea-
surement station and variable speed fan (see Figure 3, (3)). The
variable speed fan and nozzle configuration were adjusted to
maintain zero static pressure between the “outdoor” chamber and
condenser outlet plenum. Ultimately, the hot moist condenser
outlet air was exhausted to outdoors. This unique condenser–air-
flow arrangement circumvented a massive addition of moisture
to the “outdoor” chamber that would have saturated the labora-
tory facility’s dehumidification capacity. The setup also provided
a calibrated measurement of condenser–airflow, which is typically
a very difficult measurement to capture and is often ignored in
laboratory evaluations.
The majority of makeup airflow for the “outdoor” environmental
chamber was provided through a 10,000 cfm (nominal), electric
resistance regenerated, silica-gel wheel dehumidifier (see Figure
3,(1)). Ambient air was drawn from an unconditioned warehouse
space for both the product and regeneration air streams. Dehu-
midified air was delivered to the “outdoor” chamber, and moist
regeneration exhaust was ducted to outdoors. For full capacity
tests, the condenser–airflow was measured at nearly 13,000 cfm,
in which circumstance the balance of makeup air for the “outdoor”
environmental chamber was drawn freely from the ambient un-
conditioned warehouse space through an open door (see Figure
3, (7)).
Temperature and humidity conditions in each environmental
chamber were controlled with laboratory integrated air handler
systems that recirculated air within each chamber (see Figure 3,
(5)&(6)). Both air handlers included DX cooling coils, chilled water
cooling coils, electric resistance heat, steam humidification, and
a variable speed blower. The operation of components in each
system was controlled with a PID control algorithm that targeted
a user-selected chamber set point condition. In the case that the
chamber required some cooling and dehumidification, the chilled
water coil would provide a significant amount of sensible cool-
ing while the DX evaporator was set to operate with a low airflow
and very low temperature in order to provide as much latent cool-
ing as possible. After cooling and dehumidification, airflow was
heated to produce an appropriate supply air condition to maintain
chamber set point conditions after mixing with the bulk air vol-
ume (Figure 4).
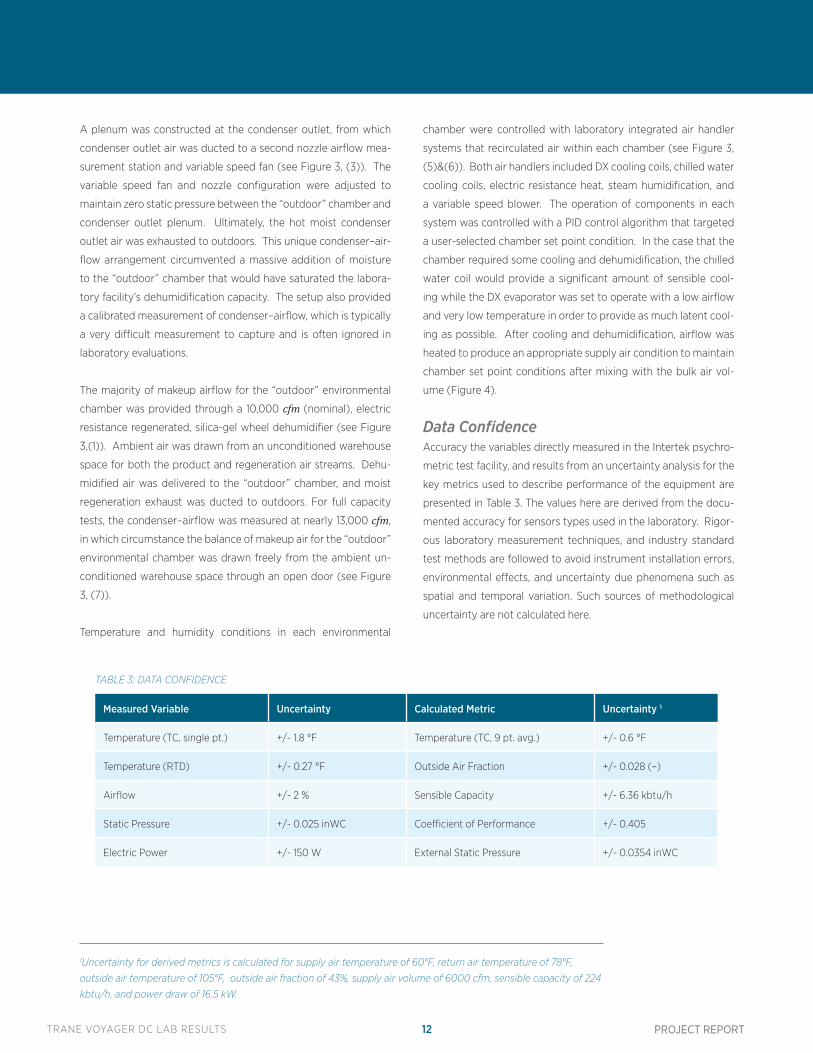
Data ConfidenceAccuracy the variables directly measured in the Intertek psychro-
metric test facility, and results from an uncertainty analysis for the
key metrics used to describe performance of the equipment are
presented in Table 3. The values here are derived from the docu-
mented accuracy for sensors types used in the laboratory. Rigor-
ous laboratory measurement techniques, and industry standard
test methods are followed to avoid instrument installation errors,
environmental effects, and uncertainty due phenomena such as
spatial and temporal variation. Such sources of methodological
uncertainty are not calculated here.
Measured Variable Uncertainty Calculated Metric Uncertainty 1
Temperature (TC, single pt.) +/- 1.8 °F Temperature (TC, 9 pt. avg.) +/- 0.6 °F
Temperature (RTD) +/- 0.27 °F Outside Air Fraction +/- 0.028 (–)
Airflow +/- 2 % Sensible Capacity +/- 6.36 kbtu/h
Static Pressure +/- 0.025 inWC Coefficient of Performance +/- 0.405
Electric Power +/- 150 W External Static Pressure +/- 0.0354 inWC
1Uncertainty for derived metrics is calculated for supply air temperature of 60°F, return air temperature of 78°F,
outside air temperature of 105°F, outside air fraction of 43%, supply air volume of 6000 cfm, sensible capacity of 224
kbtu/h, and power draw of 16.5 kW.
TABLE 3: DATA CONFIDENCE
TRANE VOYAGER DC LAB RESULTS 13 PROJECT REPORT
1. Pump
2. Water Coil
3. Evaporative Cooler
4. Compressors 1 & 2
5. DX Condenser Coils
6. DX Evaporator Coils
7. Supply Air Blower
8. Condenser Fan
Drain
SA
EA
OSA OSA
RA
M
M
SUMP
TDB, SA, TC Array
TDB, SA
TDB, EA, TC Array
OSA
Water Fill
ΔP
V,i,PF & kWC1
V,i,PF & kWC2
V,i,PF & kWCF1&2
TC1 DISCHARGE
TC2 DISCHARGE
TC1 SUCTION
TC2 SUCTION
PC1 DISCHARGE
PC2 DISCHARGE
PC1 SUCTION
PC2 SUCTION
TWB, SA
TDB, RA
ΔP ESP
ΔP
ΔP
ΔP TC1 LIQUID
TC2 LIQUID
PC1 LIQUID
PC2 LIQUID
TC1 LIQUID @ TXV
TC2 LIQUID @ TXV
TWC INLET
TWC OUTLET
TSUMP
V,i,PF & kWPUMP
TDB, OSA, TC Array
TDB, OSA, TC Array
TDB, OSA, TC Array
TDB TWB, OSA , OSA
kWTOTAL
8
5
4
6 7
1
2
3
TWB, RA
TDB, RA, TC Array
RPM
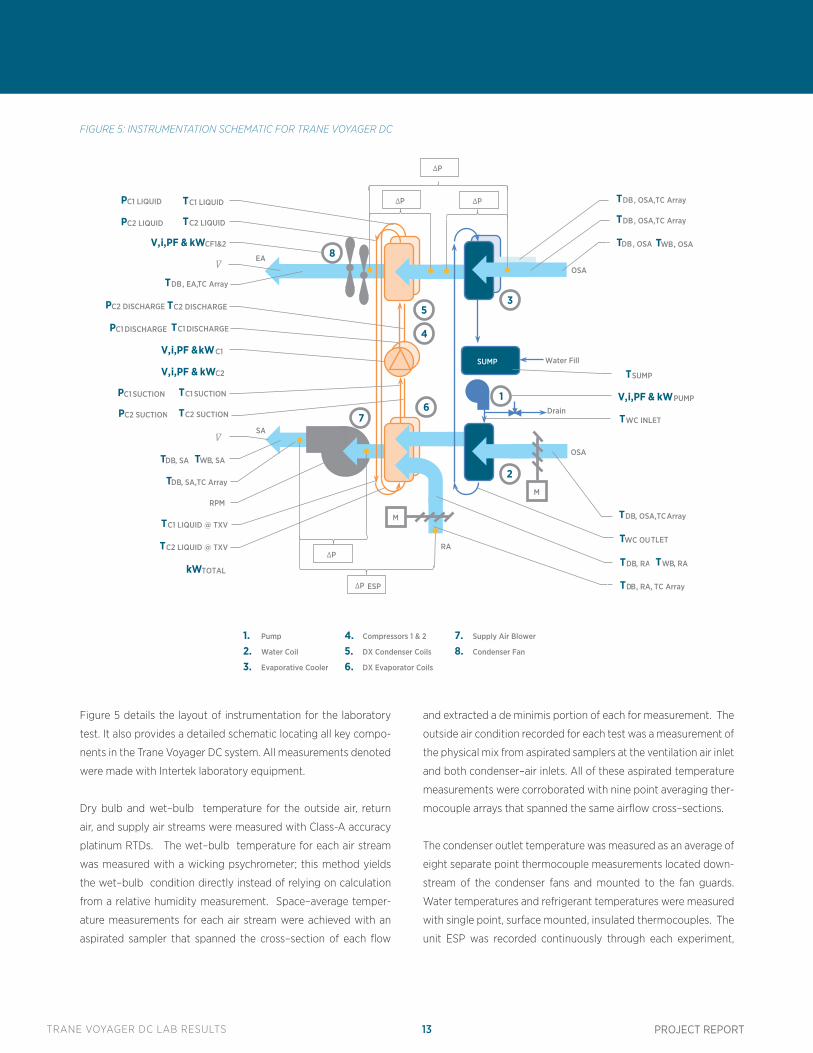
FIGURE 5: INSTRUMENTATION SCHEMATIC FOR TRANE VOYAGER DC
Figure 5 details the layout of instrumentation for the laboratory
test. It also provides a detailed schematic locating all key compo-
nents in the Trane Voyager DC system. All measurements denoted
were made with Intertek laboratory equipment.
Dry bulb and wet–bulb temperature for the outside air, return
air, and supply air streams were measured with Class-A accuracy
platinum RTDs. The wet–bulb temperature for each air stream
was measured with a wicking psychrometer; this method yields
the wet–bulb condition directly instead of relying on calculation
from a relative humidity measurement. Space–average temper-
ature measurements for each air stream were achieved with an
aspirated sampler that spanned the cross–section of each flow
and extracted a de minimis portion of each for measurement. The
outside air condition recorded for each test was a measurement of
the physical mix from aspirated samplers at the ventilation air inlet
and both condenser–air inlets. All of these aspirated temperature
measurements were corroborated with nine point averaging ther-
mocouple arrays that spanned the same airflow cross–sections.
The condenser outlet temperature was measured as an average of
eight separate point thermocouple measurements located down-
stream of the condenser fans and mounted to the fan guards.
Water temperatures and refrigerant temperatures were measured
with single point, surface mounted, insulated thermocouples. The
unit ESP was recorded continuously through each experiment,
TRANE VOYAGER DC LAB RESULTS 14 PROJECT REPORT
while all other differential pressures were recorded manually at a
single time for each test. Supply blower RPM was also recorded m
annually for each test.
In order to acquire component-by-component electric power con-
sumption, each major electrical device was powered separately,
instead of through the equipment disconnect. Power was sup-
plied by laboratory transformers that provided an appropriate
three-phase source, while recording voltage, amperage, and pow-
er factor. In order to reduce uncertainty in calculations for overall
equipment efficiency, the total equipment power draw was also
measured directly, instead of relying on the sum of power draw
by each component. Disaggregating the equipment power con-
sumption was also used to calculate the presumed temperature
rise across the supply blower, and to correct for inconsistencies
in the condenser fan power draw due to multiple motor malfunc-
tions during some tests.
As described previously, supply airflow and condenser–airflow
for the Trane Voyager DC were determined in nozzle airflow mea-
surement stations, according to ANSI/AMCA 210-2007 and ANSI/
ASHRAE 51-2007.
It should be noted that some measurements that would have been
very useful to this study were not possible. Temperature of the
condenser–air flow in between the evaporative cooler and the
condenser coils would be suspect to error due to the potential for
moisture deposition on the sensors. Also, the physical space be-
tween the evaporative media and condenser coil is not amenable
to sensor placement. Likewise, while the air temperature between
the water coil in the ventilation air stream and the evaporator coil
would provide useful information about the equipment’s indirect
evaporative cooling performance, there was no straightforward
way to place instrumentation due to space limitations and physi-
cal access. It is possible that theses discontinuities in data could
be addressed with direct measurements in future laboratory and
field studies, though for this study they are non-essential variables
that can be reverse-calculated using data from other system mea-
surements, as described later. Lastly, and unfortunately, the Inter-
tek facility was not able to measure supply water consumption,
drain flow, or volume flow rate through the circulation pump.
6. DESIGN OF EXPERIMENTSWestern Cooling Challenge test criteria and performance re-
quirements prescribe the return air condition and two outside air
psychrometric conditions at which performance is evaluated for
certification. These requirements focus primarily on system ef-
ficiency at full capacity operation during daily high temperature
periods in hot dry climates. In addition to evaluating performance
at these few conditions, the range of laboratory experiments was
designed to characterize equipment performance in various oper-
ating modes and across a broad range of temperature and humid-
ity scenarios.
Many of the tests conducted were outside the intended operating
envelope for the Trane Voyager DC, but measurement under such
circumstances allowed for analysis of equipment performance
sensitivity. The broad mapping of system operation in each mode
also allowed for evaluation of component performance charac-
teristics in response to a range of environmental conditions. For
example, even though the equipment sequence of operation con-
strains “enhanced economizer” mode to periods when outside air
temperature is below the indoor comfort set point, experiments
tested operation in this mode across a range of outside air tem-
peratures between 65 °F and 105 °F. Results from these tests
helped to isolate performance of the indirect evaporative ventila-
tion air cooling coil by measuring it’s impact while in an operating
mode where it is the only component to provide cooling.
For each of the three distinct modes of cooling operation, eight
different outside air conditions were tested. Four of these psy-
chrometric conditions replicate standard test conditions defined
by ANSI/AHRI 340/360-2010 for EER and IEER rating of commer-
cial unitary air conditioning equipment. Two are the Western Cool-
ing Challenge rating conditions, one is a warm-humid condition
used to test performance sensitivity to humidity, and one is a mild
temperature condition with absolute humidity that is representa-
tive of semi-arid climates such as California. These lower tem-
perature conditions constitutes a significant portion of the cooling
hours for commercial buildings, and strategies that extend the
envelope for very high efficiency economizer-type cooling modes
would have great energy savings potential.
TRANE VOYAGER DC LAB RESULTS 15 PROJECT REPORT
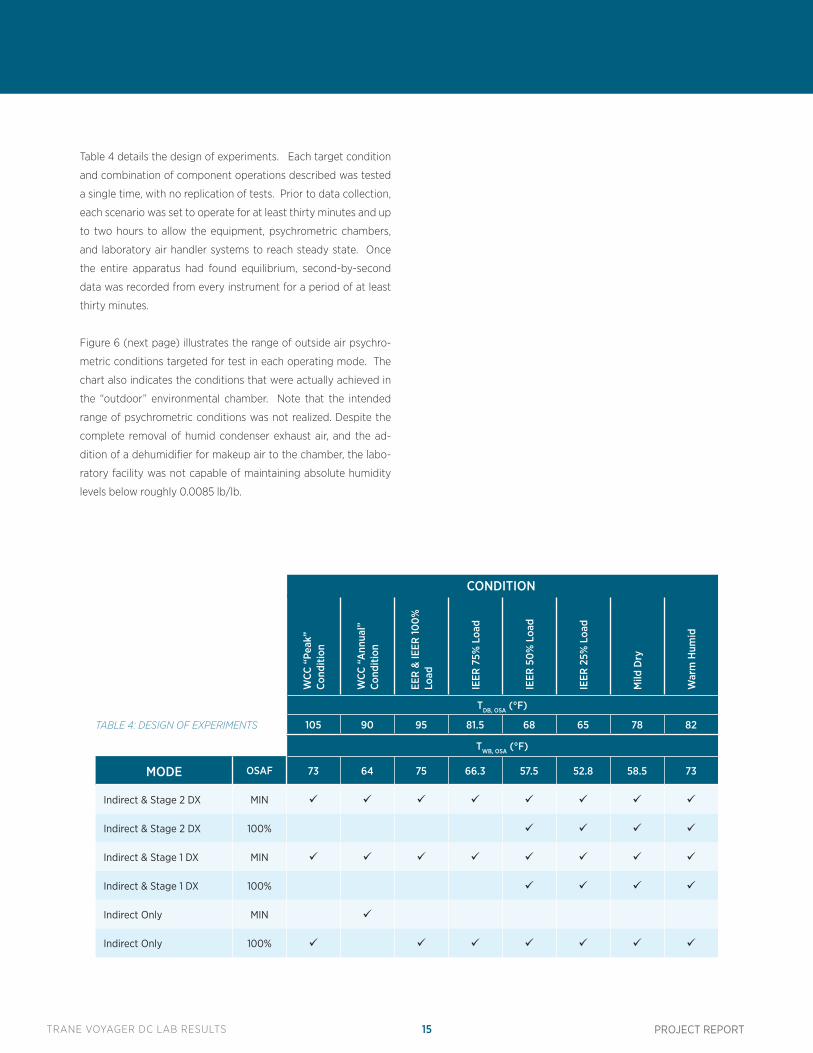
Table 4 details the design of experiments. Each target condition
and combination of component operations described was tested
a single time, with no replication of tests. Prior to data collection,
each scenario was set to operate for at least thirty minutes and up
to two hours to allow the equipment, psychrometric chambers,
and laboratory air handler systems to reach steady state. Once
the entire apparatus had found equilibrium, second-by-second
data was recorded from every instrument for a period of at least
thirty minutes.
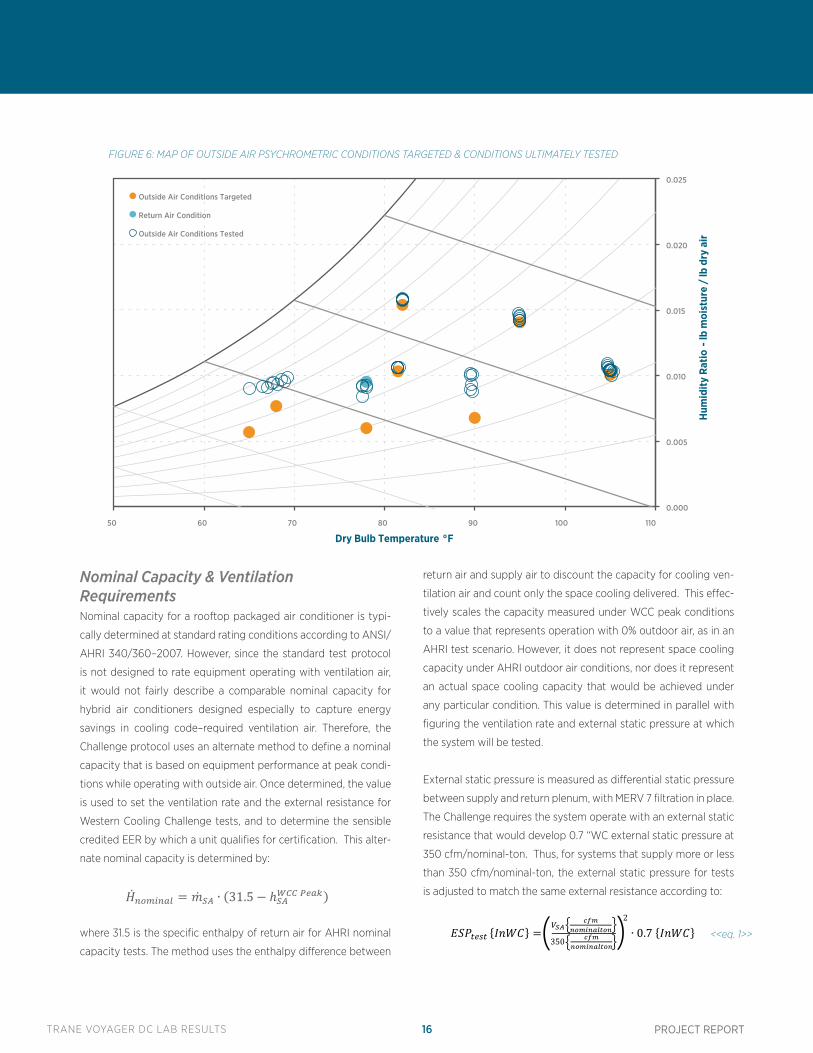
Figure 6 (next page) illustrates the range of outside air psychro-
metric conditions targeted for test in each operating mode. The
chart also indicates the conditions that were actually achieved in
the “outdoor” environmental chamber. Note that the intended
range of psychrometric conditions was not realized. Despite the
complete removal of humid condenser exhaust air, and the ad-
dition of a dehumidifier for makeup air to the chamber, the labo-
ratory facility was not capable of maintaining absolute humidity
levels below roughly 0.0085 lb/lb.
CON
DIT
ION
WCC
“Pe
ak”
Cond
ition
WCC
“A
nnua
l”
Cond
ition
EER
& IE
ER 10
0%
Lo
ad
IEER
75%
Loa
d
IEER
50
% L
oad
IEER
25%
Loa
d
Mild
Dry
War
m H
umid
TDB, OSA (°F)
105 90 95 81.5 68 65 78 82
TWB, OSA (°F)
MODE OSAF 73 64 75 66.3 57.5 52.8 58.5 73
Indirect & Stage 2 DX MIN
Indirect & Stage 2 DX 100%
Indirect & Stage 1 DX MIN
Indirect & Stage 1 DX 100%
Indirect Only MIN
Indirect Only 100%
CONDITION
TABLE 4: DESIGN OF EXPERIMENTS
TRANE VOYAGER DC LAB RESULTS 16 PROJECT REPORT
FIGURE 6: MAP OF OUTSIDE AIR PSYCHROMETRIC CONDITIONS TARGETED & CONDITIONS ULTIMATELY TESTED
Nominal Capacity & Ventilation RequirementsNominal capacity for a rooftop packaged air conditioner is typi-
cally determined at standard rating conditions according to ANSI/
AHRI 340/360–2007. However, since the standard test protocol
is not designed to rate equipment operating with ventilation air,
it would not fairly describe a comparable nominal capacity for
hybrid air conditioners designed especially to capture energy
savings in cooling code–required ventilation air. Therefore, the
Challenge protocol uses an alternate method to define a nominal
capacity that is based on equipment performance at peak condi-
tions while operating with outside air. Once determined, the value
is used to set the ventilation rate and the external resistance for
Western Cooling Challenge tests, and to determine the sensible
credited EER by which a unit qualifies for certification. This alter-
nate nominal capacity is determined by:
where 31.5 is the specific enthalpy of return air for AHRI nominal
capacity tests. The method uses the enthalpy difference between
return air and supply air to discount the capacity for cooling ven-
tilation air and count only the space cooling delivered. This effec-
tively scales the capacity measured under WCC peak conditions
to a value that represents operation with 0% outdoor air, as in an
AHRI test scenario. However, it does not represent space cooling
capacity under AHRI outdoor air conditions, nor does it represent
an actual space cooling capacity that would be achieved under
any particular condition. This value is determined in parallel with
figuring the ventilation rate and external static pressure at which
the system will be tested.
External static pressure is measured as differential static pressure
between supply and return plenum, with MERV 7 filtration in place.
The Challenge requires the system operate with an external static
resistance that would develop 0.7 “WC external static pressure at
350 cfm/nominal-ton. Thus, for systems that supply more or less
than 350 cfm/nominal-ton, the external static pressure for tests
is adjusted to match the same external resistance according to:
0.000
0.005
0.010
0.015
0.020
0.025
50 60 70 80 90 100 110
Hum
idity
Rat
io -
lb m
oist
ure
/ lb
dry
air
Dry Bulb Temperature °F
Outside Air Conditions Targeted
Return Air Condition
Outside Air Conditions Tested
<<eq. 1>>
TRANE VOYAGER DC LAB RESULTS 17 PROJECT REPORT
The Challenge tests equipment performance while supplying ven-
tilation air, as is generally the case for rooftop packaged equip-
ment in commercial spaces. The protocol requires 120 cfm ventila-
tion per nominal ton:
Since the nominal capacity is impacted by the required external
static pressure and ventilation rate, and since the ventilation rate
and external static pressure, these values must be determined
through iterative tests. The external resistance effects the supply
airflow, so the supply airflow is determined at the same time, and
the outside air fraction can be determined according to:
The iterative nominal-capacity test resulted in the set of system
operating conditions described in Table 5, which were held con-
stant for all subsequent Western Cooling Challenge certification
tests. The same external resistance and outside air fraction condi-
tions determined through this process were also used for most
other tests in the design of experiments, except those tests oper-
ating with 100% OSA. The 100% OSA tests used the external resis-
tance determined here, and allowed the supply airflow to change
in response to the change in damper arrangement.
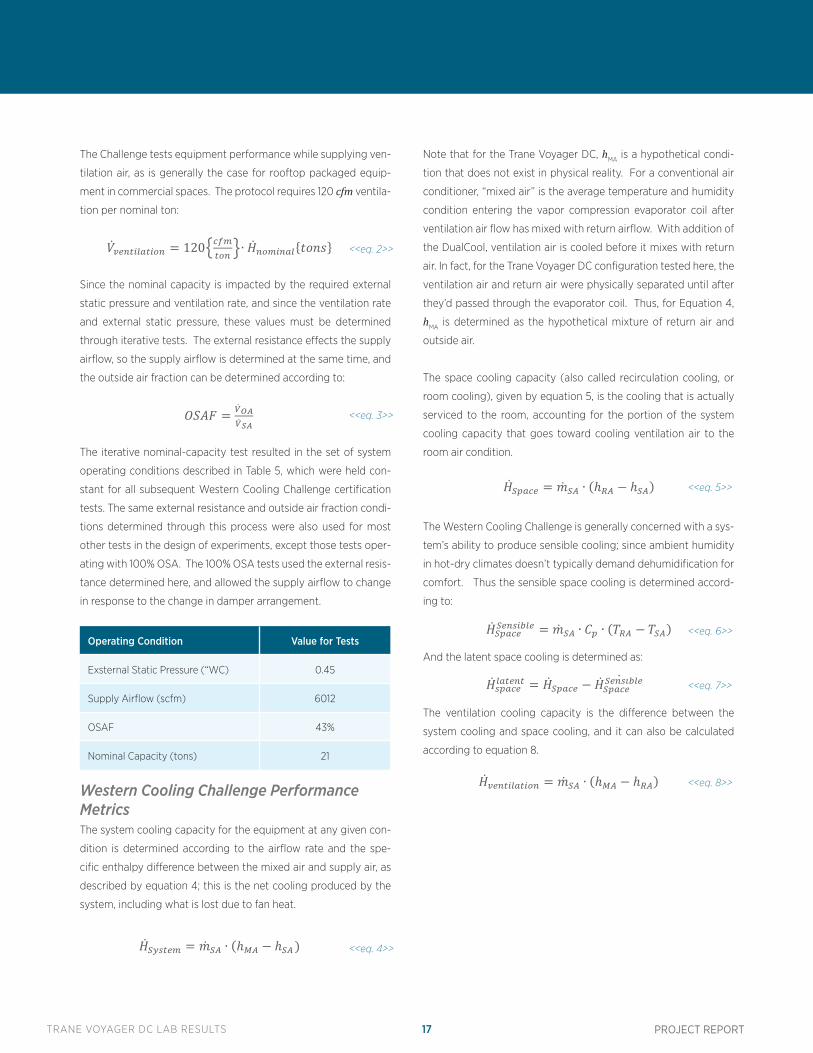
Western Cooling Challenge Performance MetricsThe system cooling capacity for the equipment at any given con-
dition is determined according to the airflow rate and the spe-
cific enthalpy difference between the mixed air and supply air, as
described by equation 4; this is the net cooling produced by the
system, including what is lost due to fan heat.
Note that for the Trane Voyager DC, hMA is a hypothetical condi-
tion that does not exist in physical reality. For a conventional air
conditioner, “mixed air” is the average temperature and humidity
condition entering the vapor compression evaporator coil after
ventilation air flow has mixed with return airflow. With addition of
the DualCool, ventilation air is cooled before it mixes with return
air. In fact, for the Trane Voyager DC configuration tested here, the
ventilation air and return air were physically separated until after
they’d passed through the evaporator coil. Thus, for Equation 4,
hMA is determined as the hypothetical mixture of return air and
outside air.
The space cooling capacity (also called recirculation cooling, or
room cooling), given by equation 5, is the cooling that is actually
serviced to the room, accounting for the portion of the system
cooling capacity that goes toward cooling ventilation air to the
room air condition.
The Western Cooling Challenge is generally concerned with a sys-
tem’s ability to produce sensible cooling; since ambient humidity
in hot-dry climates doesn’t typically demand dehumidification for
comfort. Thus the sensible space cooling is determined accord-
ing to:
And the latent space cooling is determined as:
The ventilation cooling capacity is the difference between the
system cooling and space cooling, and it can also be calculated
according to equation 8.
Operating Condition Value for Tests
Exsternal Static Pressure (“WC) 0.45
Supply Airflow (scfm) 6012
OSAF 43%
Nominal Capacity (tons) 21
<<eq. 2>>
<<eq. 3>>
<<eq. 4>>
<<eq. 5>>
<<eq. 6>>
<<eq. 7>>
<<eq. 8>>
TRANE VOYAGER DC LAB RESULTS 18 PROJECT REPORT
Since the Western Cooling Challenge rates performance for operation at a particular ventilation rate, if the ven-
tilation rate for operation in a particular mode is greater than the minimum requirement, the excess ventilation
air cooling is not counted toward system efficiency. In these circumstances, evaluation of performance for the
Challenge only credits a portion of the total ventilation rate, equal to the minimum requirement.
The credited ventilation rate translates to a credited ventilation cooling capacity as described in equation 10:
And the sensible credited ventilation cooling capacity is the portion associated with temperature change:
The sensible credited cooling is the capacity used to rate equipment performance for the Challenge, and is calcu-
lated as the sum of sensible space cooling and sensible credited ventilation cooling.
The minimum efficiency requirements for the Challenge are given as sensible credited EER, calculated by:
It is important to note that the “sensible credited EER” values presented in this report are not directly comparable
to common “EER” values determined according ANSI/AHRI 340/360–2007 standard protocol, which operates
equipment without outside air, and gives credit for latent cooling. A conventional system rated with an EER of
12 according to ANSI/AHRI 340/360 will have a “sensible credited EER” nearer 9 according to Western Cooling
Challenge test conditions.
<<eq. 9>>
<<eq. 10>>
<<eq. 11>>
<<eq. 12>>
<<eq. 13>>
TRANE VOYAGER DC LAB RESULTS 19 PROJECT REPORT
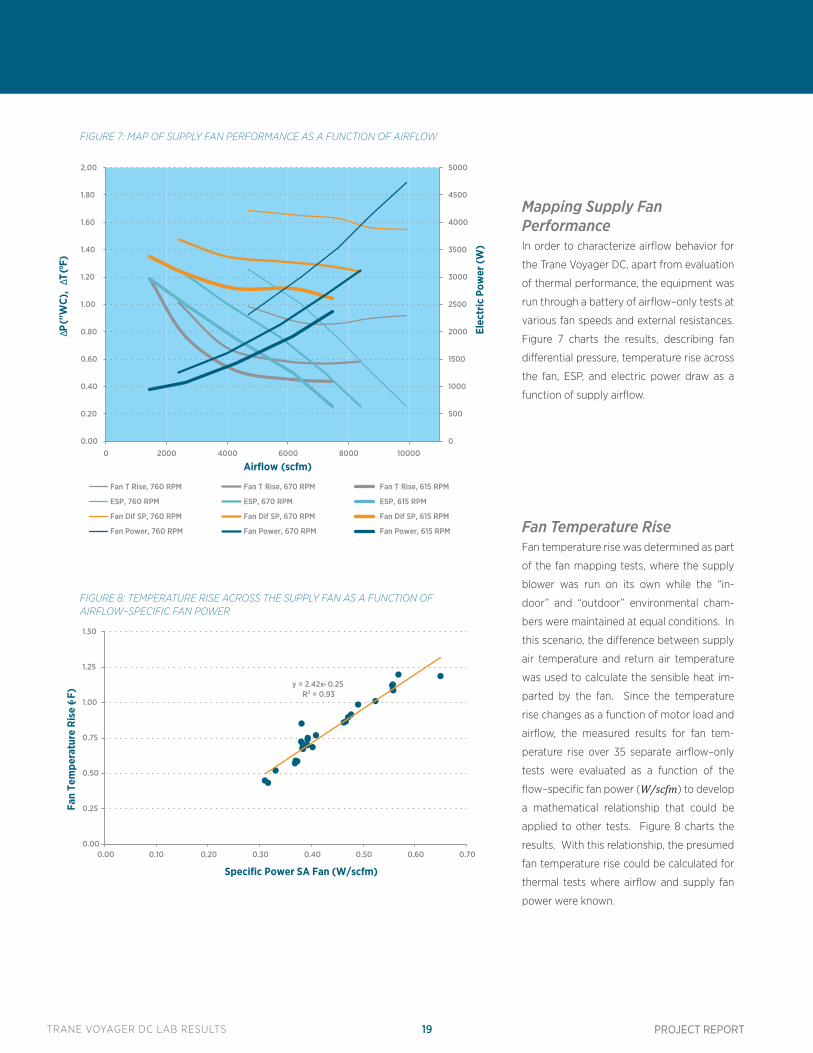
Mapping Supply Fan PerformanceIn order to characterize airflow behavior for
the Trane Voyager DC, apart from evaluation
of thermal performance, the equipment was
run through a battery of airflow–only tests at
various fan speeds and external resistances.
Figure 7 charts the results, describing fan
differential pressure, temperature rise across
the fan, ESP, and electric power draw as a
function of supply airflow.
Fan Temperature RiseFan temperature rise was determined as part
of the fan mapping tests, where the supply
blower was run on its own while the “in-
door” and “outdoor” environmental cham-
bers were maintained at equal conditions. In
this scenario, the difference between supply
air temperature and return air temperature
was used to calculate the sensible heat im-
parted by the fan. Since the temperature
rise changes as a function of motor load and
airflow, the measured results for fan tem-
perature rise over 35 separate airflow–only
tests were evaluated as a function of the
flow–specific fan power (W/scfm) to develop
a mathematical relationship that could be
applied to other tests. Figure 8 charts the
results. With this relationship, the presumed
fan temperature rise could be calculated for
thermal tests where airflow and supply fan
power were known.
0
500
1000
1500
2000
2500
3000
3500
4000
4500
5000
0.00
0.20
0.40
0.60
0.80
1.00
1.20
1.40
1.60
1.80
2.00
0 2000 4000 6000 8000 10000
Elec
tric
Pow
er (W
)
ΔP ("
WC)
, ΔT
(°F)
Airflow (scfm)
Fan T Rise, 760 RPM Fan T Rise, 670 RPM Fan T Rise, 615 RPM
ESP, 760 RPM ESP, 670 RPM ESP, 615 RPM
Fan Dif SP, 760 RPM Fan Dif SP, 670 RPM Fan Dif SP, 615 RPM
Fan Power, 760 RPM Fan Power, 670 RPM Fan Power, 615 RPM
FIGURE 7: MAP OF SUPPLY FAN PERFORMANCE AS A FUNCTION OF AIRFLOW
y = 2.42x - 0.25 R2 = 0.93
0.00
0.25
0.50
0.75
1.00
1.25
1.50
0.00 0.10 0.20 0.30 0.40 0.50 0.60 0.70
°Fa
n Te
mpe
ratu
re R
ise
(F)
Specific Power SA Fan (W/scfm)
FIGURE 8: TEMPERATURE RISE ACROSS THE SUPPLY FAN AS A FUNCTION OF AIRFLOW–SPECIFIC FAN POWER
TRANE VOYAGER DC LAB RESULTS 20 PROJECT REPORT
Calculating Outside Air Fraction The Intertek laboratory facility was not capable of measuring sup-
ply air flow rate and ventilation air flow rate simultaneously; de-
termining the outside air fraction for the experiments required an
innovative but laborious method. For any combination of return
air damper position, outside air damper position, external resis-
tance, and supply fan shiv setting, a separate test was run for the
sole purpose of determining outside air flow rate. This additional
test operated all fans and dampers as they would be run in the
experiment of interest, but all thermal components remained off.
The “outdoor” environmental chamber and “indoor” environmen-
tal chambers were maintained at conditions with a 40°F tempera-
ture difference such that when airflow from each chamber mixed
through the unit, the resulting supply air temperature would in-
dicate the fraction of flow originating as outside air. Using this
method the OSAF is calculated by:
where ΔTfan is the air temperature rise across the supply blower.
Tests to determine outside air fraction illuminated that for the
physical configuration of the Trane Voyager DC examined, any
outside air fraction above roughly 30% required partial closure
of the return air damper to restrict return airflow. As will be dis-
cussed in the results section, this flow restriction has some conse-
quences on total supply airflow when operating at high outside
air fractions.
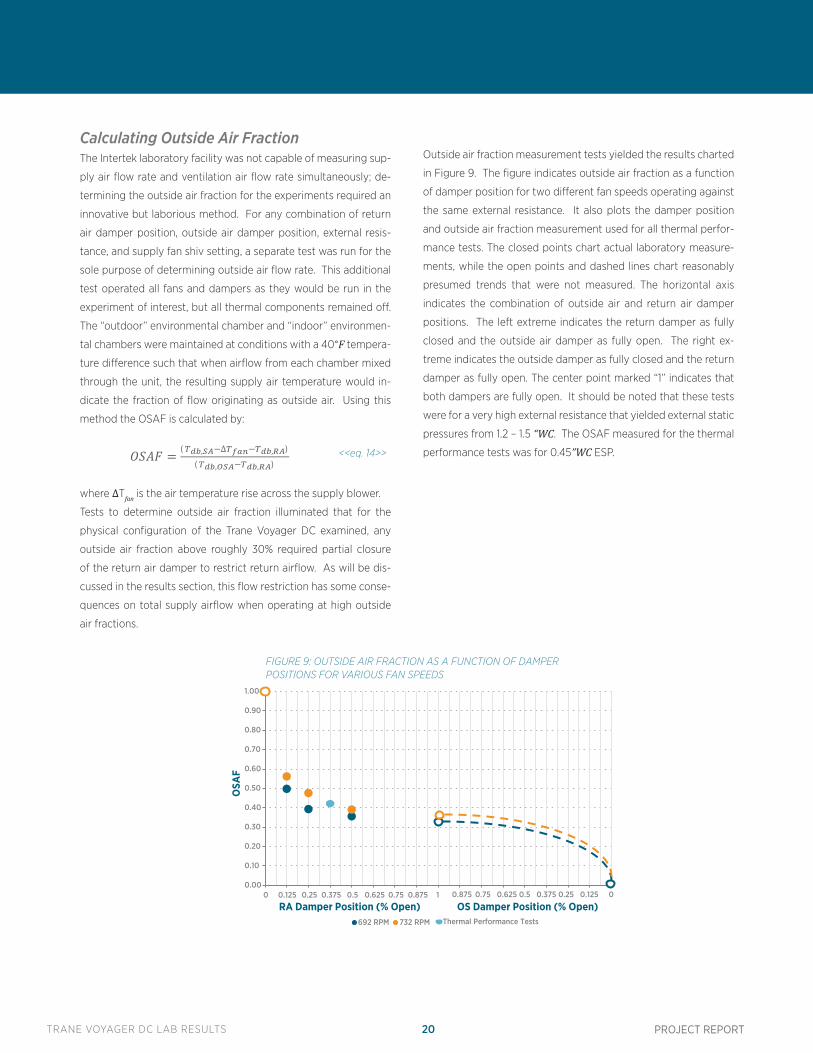
Outside air fraction measurement tests yielded the results charted
in Figure 9. The figure indicates outside air fraction as a function
of damper position for two different fan speeds operating against
the same external resistance. It also plots the damper position
and outside air fraction measurement used for all thermal perfor-
mance tests. The closed points chart actual laboratory measure-
ments, while the open points and dashed lines chart reasonably
presumed trends that were not measured. The horizontal axis
indicates the combination of outside air and return air damper
positions. The left extreme indicates the return damper as fully
closed and the outside air damper as fully open. The right ex-
treme indicates the outside damper as fully closed and the return
damper as fully open. The center point marked “1” indicates that
both dampers are fully open. It should be noted that these tests
were for a very high external resistance that yielded external static
pressures from 1.2 – 1.5 “WC. The OSAF measured for the thermal
performance tests was for 0.45”WC ESP.
0.00
0.10
0.20
0.30
0.40
0.50
0.60
0.70
0.80
0.90
1.00
0 0.125 0.25 0.375 0.5 0.625 0.75 0.875 1
OSA
F
692 RPM 732 RPM
0.875 0.75 0.625 0.5 0.375 0.25 0.125 0
Thermal Performance Tests RA Damper Position (% Open) OS Damper Position (% Open)
FIGURE 9: OUTSIDE AIR FRACTION AS A FUNCTION OF DAMPER POSITIONS FOR VARIOUS FAN SPEEDS
<<eq. 14>>
TRANE VOYAGER DC LAB RESULTS 21 PROJECT REPORT
Calculating Water Circuit Flow RateWater flow rate through the pump and water circuit was not di-
rectly measured. Calculation of the over-arching equipment effi-
ciency does not require this value, but it is a useful metric to tease
apart the performance of system sub–components. Therefore,
the value was reverse–calculated using an energy–balance for
the ventilation air cooling coil. This calculation was exercised for
tests where the system was operated in the enhanced economizer
mode. In this scenario, the equipment operated as 100% outside
air and the indirect evaporative ventilation air cooling coil was the
only component to provide cooling. The water circuit flow rate
was calculated by:
where Twater out and Twater in are the water temperature at the out-
let and inlet of the ventilation air cooling coil. Of the seven en-
hanced economizer tests with 100% outside air, this calculation
was limited to the tests with outside air temperature Tdb=105°F,
95°F and 81.5°F. Tests with cooler outside air conditions yielded
such small temperature shift across the water coil that uncertainty
in the resulting energy balance yielded very high uncertainty for
the resulting water flow rate. Since there were not physical altera-
tions to the water circuit from test to test, the water flow rate was
assumed to remain constant for every experiment.
CALCULATING CAPACITY FOR THE VENTILATION COOLING COILAs discussed previously, the ventilation air cooling coil and the DX
coil were installed so close to one another that measurement of
the average ventilation airflow temperature between the coils was
not a reasonable prospect. This value is not required to evaluate
the overall equipment efficiency, but it is useful to describe ef-
fectiveness of the indirect evaporative process and capacity of the
ventilation cooling coil. These metrics were calculated using the
previously calculated water flow rate, and an energy–balance for
the ventilation air cooling coil. Equation 17 describes calculation
of the wet–bulb effectiveness for the indirect evaporative cooling
of ventilation air:
Likewise, the sensible cooling capacity of the indirect evaporative
ventilation air cooling coil is given by:
where ΔTair is given by:
Results of these calculations are presented later, along with dis-
cussion about implications to equipment performance.
Calculating Condenser Inlet and Outlet ConditionsSimilar to the indirect evaporative cooling coil, the sensible cool-
ing provided by the evaporative condenser–air pre cooler was not
measured directly. This was mostly because of challenges with
physically locating temperature sensors to accurately capture
space average dry bulb temperature in between the evaporative
media and the condenser coil. For the tests where compressors
did not operate, performance of the evaporative cooler could be
described by the temperature measured at the condenser outlet
according to:
For other tests, where the compressors were running, the con-
denser inlet temperature was calculated by:
The enthalpy difference for air across the condenser coil is deter-
mined by an energy balance considering the condenser–air flow
rate, and the condenser heat transfer rate measured on the refrig-
erant side:
For this method, the calculated condenser inlet temperature can
be applied to equation 19 in place of the measured outlet tem-
perature to describe evaporative cooler performance.
<<eq. 15>>
<<eq. 16>>
<<eq. 17>>
<<eq. 18>>
<<eq. 19>>
<<eq. 20>>
<<eq. 21>>
<<eq. 22>>
TRANE VOYAGER DC LAB RESULTS 22 PROJECT REPORT
It is also possible to determine humidity for the condenser inlet and outlet conditions. The calculation relies on the fact that the condenser
coil only provides sensible heat exchange, and is based on an energy balance for the direct evaporative media. Note that since water flow
enters the media well above the wet–bulb temperature, a portion of the enthalpy for phase change is drawn from the water flow, and a
portion is drawn from the air flow. This results in sensible cooling for both the air and water, and a net enthalpy increase for the air flow
across the evaporative media.
<<eq. 23>>
7. RESULTSLaboratory tests observed operation in each cooling mode and
across a range of psychrometric operating conditions as de-
scribed by the design of experiments. Observation of the system
operating at full capacity for Western Cooling Challenge “peak”
test conditions indicates that the Trane Voyager DC uses 43% less
power than a minimum efficiency standard air conditioner oper-
ating at the same conditions. This satisfies the Western Cooling
Challenge performance requirements and qualifies the Trane Voy-
ager DC for certification.
Data collected across the range of other tests was collated and
scrutinized to describe performance of the system each major
system component in response to relevant environmental vari-
ables such as airflow, and wet–bulb depression. The major results
and observations are discussed here. A complete summary table
of observations for each test is included as Appendix A. Charts to
illustrate air–side and refrigerant–side system behavior for every
test may be referenced in Appendix B.
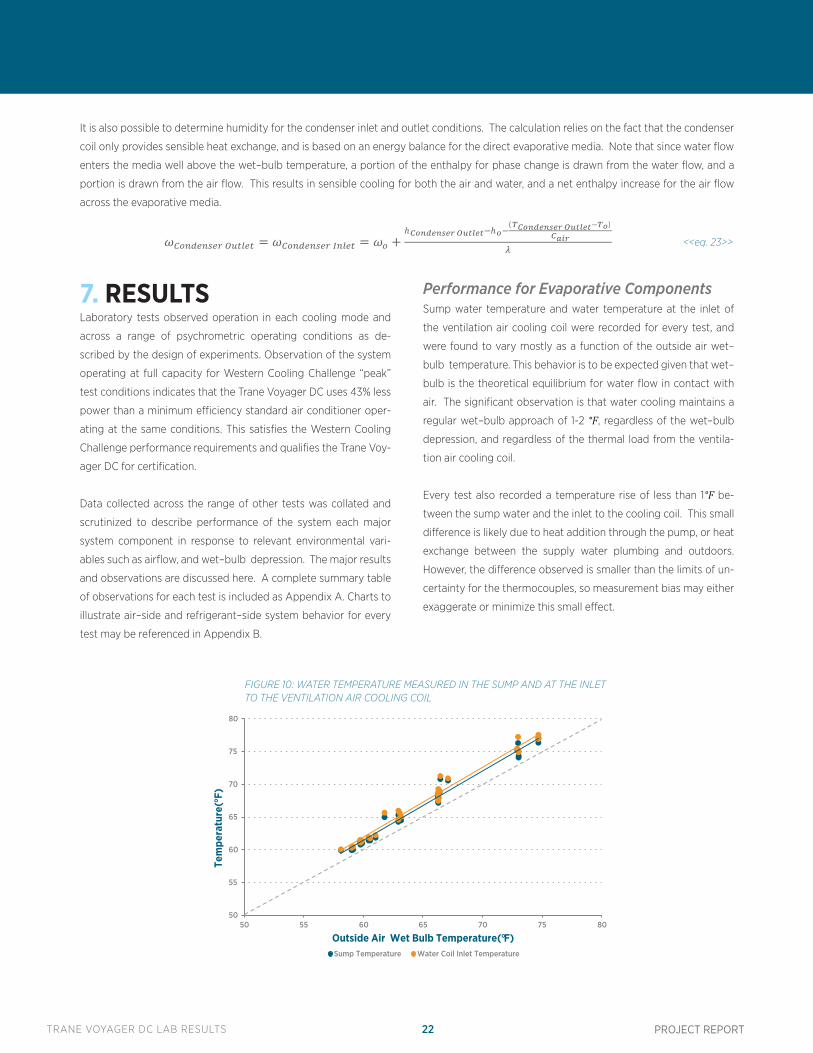
Performance for Evaporative ComponentsSump water temperature and water temperature at the inlet of
the ventilation air cooling coil were recorded for every test, and
were found to vary mostly as a function of the outside air wet–
bulb temperature. This behavior is to be expected given that wet–
bulb is the theoretical equilibrium for water flow in contact with
air. The significant observation is that water cooling maintains a
regular wet–bulb approach of 1-2 °F, regardless of the wet–bulb
depression, and regardless of the thermal load from the ventila-
tion air cooling coil.
Every test also recorded a temperature rise of less than 1°F be-
tween the sump water and the inlet to the cooling coil. This small
difference is likely due to heat addition through the pump, or heat
exchange between the supply water plumbing and outdoors.
However, the difference observed is smaller than the limits of un-
certainty for the thermocouples, so measurement bias may either
exaggerate or minimize this small effect.
50
55
60
65
70
75
80
50 55 60 65 70 75 80
Tem
pera
ture
(°F)
Outside Air Wet Bulb Temperature(°F) Sump Temperature Water Coil Inlet Temperature
FIGURE 10: WATER TEMPERATURE MEASURED IN THE SUMP AND AT THE INLET TO THE VENTILATION AIR COOLING COIL
TRANE VOYAGER DC LAB RESULTS 23 PROJECT REPORT
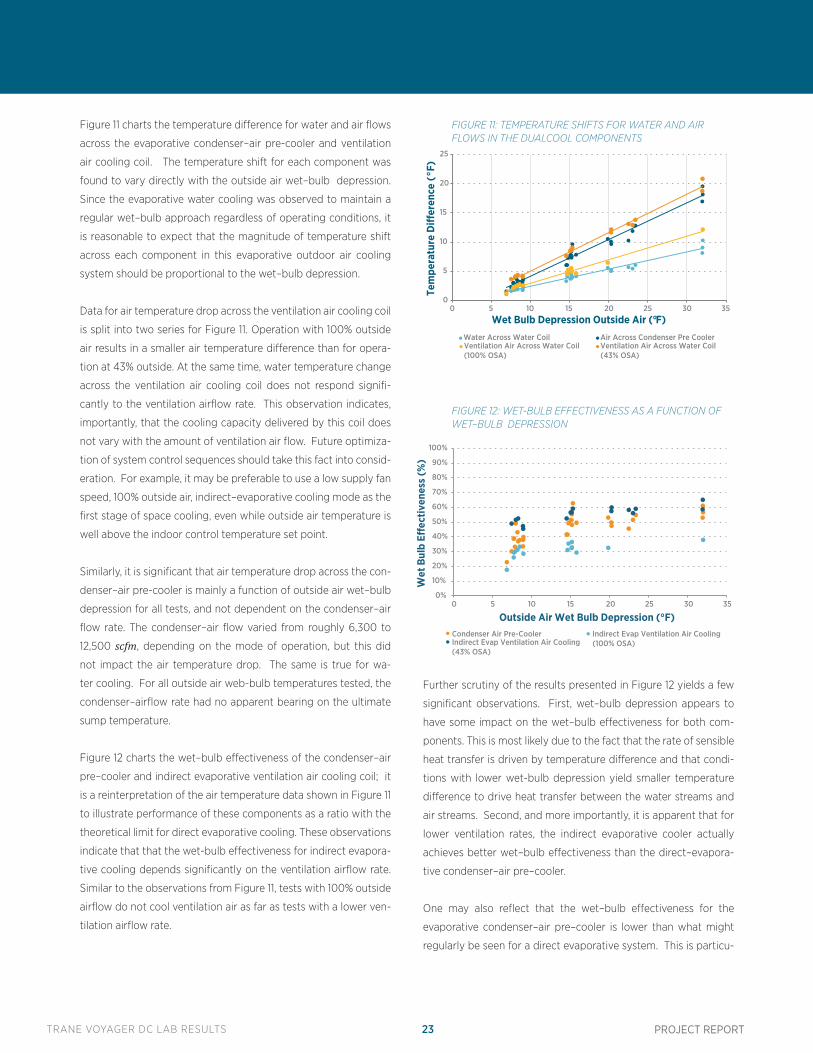
Figure 11 charts the temperature difference for water and air flows
across the evaporative condenser–air pre-cooler and ventilation
air cooling coil. The temperature shift for each component was
found to vary directly with the outside air wet–bulb depression.
Since the evaporative water cooling was observed to maintain a
regular wet–bulb approach regardless of operating conditions, it
is reasonable to expect that the magnitude of temperature shift
across each component in this evaporative outdoor air cooling
system should be proportional to the wet–bulb depression.
Data for air temperature drop across the ventilation air cooling coil
is split into two series for Figure 11. Operation with 100% outside
air results in a smaller air temperature difference than for opera-
tion at 43% outside. At the same time, water temperature change
across the ventilation air cooling coil does not respond signifi-
cantly to the ventilation airflow rate. This observation indicates,
importantly, that the cooling capacity delivered by this coil does
not vary with the amount of ventilation air flow. Future optimiza-
tion of system control sequences should take this fact into consid-
eration. For example, it may be preferable to use a low supply fan
speed, 100% outside air, indirect–evaporative cooling mode as the
first stage of space cooling, even while outside air temperature is
well above the indoor control temperature set point.
Similarly, it is significant that air temperature drop across the con-
denser–air pre-cooler is mainly a function of outside air wet–bulb
depression for all tests, and not dependent on the condenser–air
flow rate. The condenser–air flow varied from roughly 6,300 to
12,500 scfm, depending on the mode of operation, but this did
not impact the air temperature drop. The same is true for wa-
ter cooling. For all outside air web-bulb temperatures tested, the
condenser–airflow rate had no apparent bearing on the ultimate
sump temperature.
Figure 12 charts the wet–bulb effectiveness of the condenser–air
pre–cooler and indirect evaporative ventilation air cooling coil; it
is a reinterpretation of the air temperature data shown in Figure 11
to illustrate performance of these components as a ratio with the
theoretical limit for direct evaporative cooling. These observations
indicate that that the wet-bulb effectiveness for indirect evapora-
tive cooling depends significantly on the ventilation airflow rate.
Similar to the observations from Figure 11, tests with 100% outside
airflow do not cool ventilation air as far as tests with a lower ven-
tilation airflow rate.
Further scrutiny of the results presented in Figure 12 yields a few
significant observations. First, wet–bulb depression appears to
have some impact on the wet–bulb effectiveness for both com-
ponents. This is most likely due to the fact that the rate of sensible
heat transfer is driven by temperature difference and that condi-
tions with lower wet-bulb depression yield smaller temperature
difference to drive heat transfer between the water streams and
air streams. Second, and more importantly, it is apparent that for
lower ventilation rates, the indirect evaporative cooler actually
achieves better wet–bulb effectiveness than the direct–evapora-
tive condenser–air pre–cooler.
One may also reflect that the wet–bulb effectiveness for the
evaporative condenser–air pre–cooler is lower than what might
regularly be seen for a direct evaporative system. This is particu-
0
5
10
15
20
25
0 5 10 15 20 25 30 35
Tem
pera
ture
Di�
eren
ce (
°F)
Wet Bulb Depression Outside Air (°F) Water Across Water Coil Air Across Condenser Pre CoolerVentilation Air Across Water Coil(100% OSA)
Ventilation Air Across Water Coil (43% OSA)
0%
10%
20%
30%
40%
50%
60%
70%
80%
90%
100%
0 5 10 15 20 25 30 35
Wet
Bul
b E�
ectiv
enes
s (%
)
Outside Air Wet Bulb Depression (°F)
Condenser Air Pre-Cooler Indirect Evap Ventilation Air Cooling(100% OSA)Indirect Evap Ventilation Air Cooling
(43% OSA)
FIGURE 11: TEMPERATURE SHIFTS FOR WATER AND AIR FLOWS IN THE DUALCOOL COMPONENTS
FIGURE 12: WET-BULB EFFECTIVENESS AS A FUNCTION OF WET–BULB DEPRESSION
TRANE VOYAGER DC LAB RESULTS 24 PROJECT REPORT
larly important considering that the sump water is cooled so close to the wet–bulb temperature. Conclusive explanation of this result may
require further investigation, but a few possible reasons deserve consideration. First, since warm water delivered to the top of the evapora-
tive media cools as it flows down to the sump, the condenser–air flow crossing this media is presented with an unequal temperature face
for sensible heat exchange. Airflow through the upper portion of the media will be presented with a smaller temperature difference to
drive convective heat transfer than airflow through the bottom of the media. Second, it is possible that water distribution across the media
was uneven, such that even while the water flow cooled to very near wet–bulb there were some drier sections of the media that allowed
bypass without adequate opportunity for cooling. Neither of these possibilities can be substantiated from the laboratory data available.
Also, high airflow across an evaporative media can result in reduced wet - bulb effectiveness, although this last mechanism doesn’t seem
a likely factor in this case since tests with widely varying condenser–airflows has no obvious impact on wet - bulb effectiveness of the
condenser–air pre–cooler
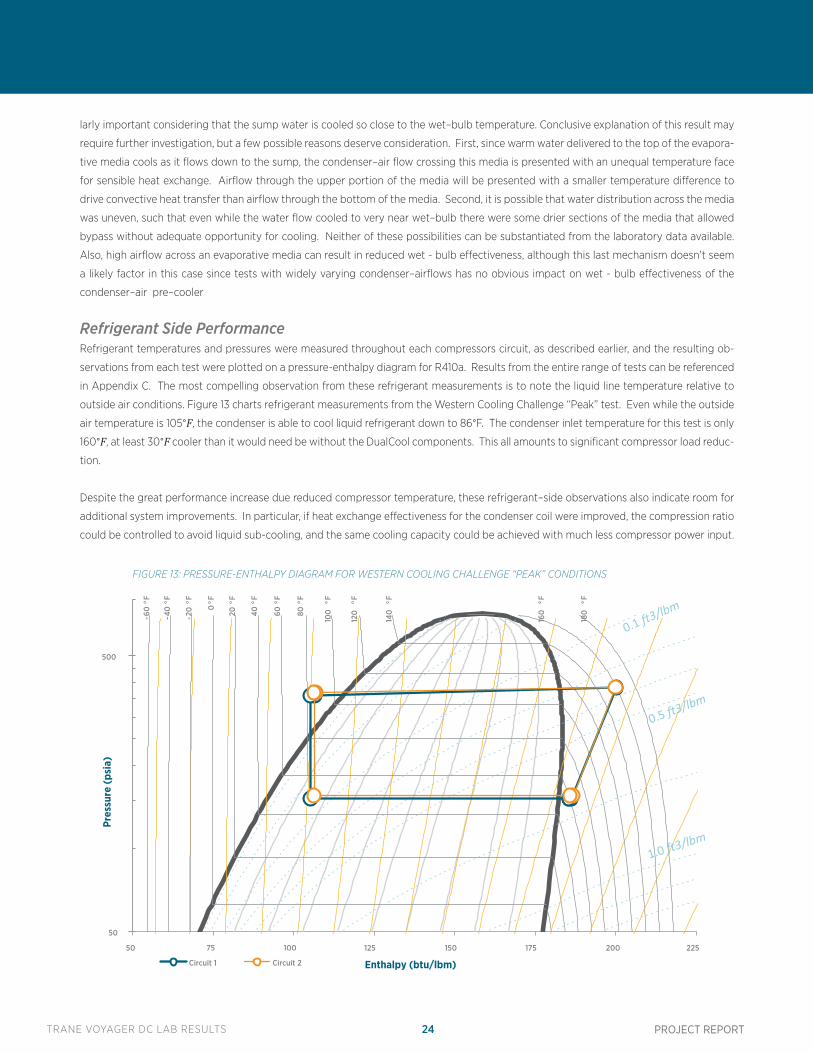
Refrigerant Side PerformanceRefrigerant temperatures and pressures were measured throughout each compressors circuit, as described earlier, and the resulting ob-
servations from each test were plotted on a pressure-enthalpy diagram for R410a. Results from the entire range of tests can be referenced
in Appendix C. The most compelling observation from these refrigerant measurements is to note the liquid line temperature relative to
outside air conditions. Figure 13 charts refrigerant measurements from the Western Cooling Challenge “Peak” test. Even while the outside
air temperature is 105°F, the condenser is able to cool liquid refrigerant down to 86°F. The condenser inlet temperature for this test is only
160°F, at least 30°F cooler than it would need be without the DualCool components. This all amounts to significant compressor load reduc-
tion.
Despite the great performance increase due reduced compressor temperature, these refrigerant–side observations also indicate room for
additional system improvements. In particular, if heat exchange effectiveness for the condenser coil were improved, the compression ratio
could be controlled to avoid liquid sub-cooling, and the same cooling capacity could be achieved with much less compressor power input.
50
500
50 75 100 125 150 175 200 225
Pres
sure
(psi
a)
Enthalpy (btu/lbm) Circuit 1 Circuit 2
40°F
60°F
80°F
20°F
100
°F
120
°F
0°F
-20
°F
140
°F
-40
°F
-60
°F
160
°F
180
°F
FIGURE 13: PRESSURE-ENTHALPY DIAGRAM FOR WESTERN COOLING CHALLENGE “PEAK” CONDITIONS
TRANE VOYAGER DC LAB RESULTS 25 PROJECT REPORT
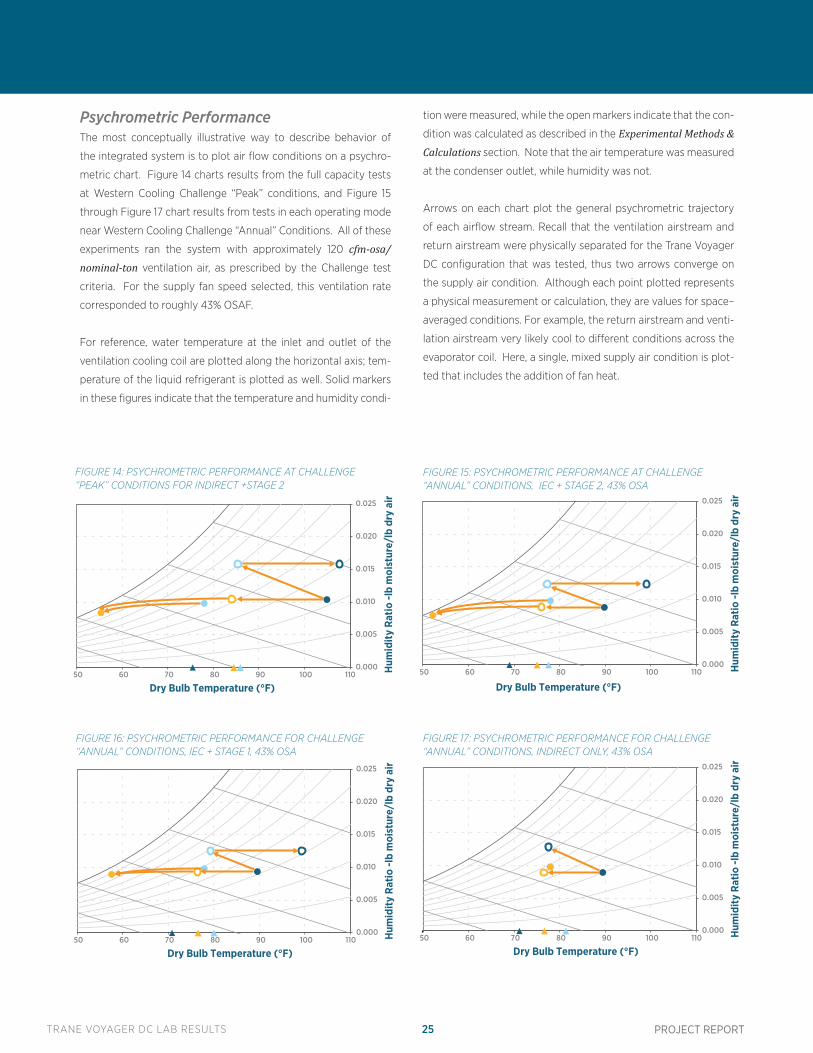
Psychrometric PerformanceThe most conceptually illustrative way to describe behavior of
the integrated system is to plot air flow conditions on a psychro-
metric chart. Figure 14 charts results from the full capacity tests
at Western Cooling Challenge “Peak” conditions, and Figure 15
through Figure 17 chart results from tests in each operating mode
near Western Cooling Challenge “Annual” Conditions. All of these
experiments ran the system with approximately 120 cfm-osa/nominal-ton ventilation air, as prescribed by the Challenge test
criteria. For the supply fan speed selected, this ventilation rate
corresponded to roughly 43% OSAF.
For reference, water temperature at the inlet and outlet of the
ventilation cooling coil are plotted along the horizontal axis; tem-
perature of the liquid refrigerant is plotted as well. Solid markers
in these figures indicate that the temperature and humidity condi-
tion were measured, while the open markers indicate that the con-
dition was calculated as described in the Experimental Methods & Calculations section. Note that the air temperature was measured
at the condenser outlet, while humidity was not.
Arrows on each chart plot the general psychrometric trajectory
of each airflow stream. Recall that the ventilation airstream and
return airstream were physically separated for the Trane Voyager
DC configuration that was tested, thus two arrows converge on
the supply air condition. Although each point plotted represents
a physical measurement or calculation, they are values for space–
averaged conditions. For example, the return airstream and venti-
lation airstream very likely cool to different conditions across the
evaporator coil. Here, a single, mixed supply air condition is plot-
ted that includes the addition of fan heat.
0.000
0.005
0.010
0.015
0.020
0.025
50 60 70 80 90 100 110
Hum
idity
Rat
io -l
b m
oist
ure/
lb d
ry a
ir
Dry Bulb Temperature (°F)
FIGURE 15: PSYCHROMETRIC PERFORMANCE AT CHALLENGE “ANNUAL” CONDITIONS, IEC + STAGE 2, 43% OSA
0.000
0.005
0.010
0.015
0.020
0.025
50 60 70 80 90 100 110
Hum
idity
Rat
io -l
b m
oist
ure/
lb d
ry a
ir
Dry Bulb Temperature (°F)
FIGURE 14: PSYCHROMETRIC PERFORMANCE AT CHALLENGE “PEAK” CONDITIONS FOR INDIRECT +STAGE 2
0.000
0.005
0.010
0.015
0.020
0.025
50 60 70 80 90 100 110
Hum
idity
Rat
io -l
b m
oist
ure/
lb d
ry a
ir
Dry Bulb Temperature (°F)
0.000
0.005
0.010
0.015
0.020
0.025
50 60 70 80 90 100 110
Hum
idity
Rat
io -l
b m
oist
ure/
lb d
ry a
ir
Dry Bulb Temperature (°F)
FIGURE 16: PSYCHROMETRIC PERFORMANCE FOR CHALLENGE “ANNUAL” CONDITIONS, IEC + STAGE 1, 43% OSA
FIGURE 17: PSYCHROMETRIC PERFORMANCE FOR CHALLENGE “ANNUAL” CONDITIONS, INDIRECT ONLY, 43% OSA
TRANE VOYAGER DC LAB RESULTS 26 PROJECT REPORT
For the “Peak” condition test, indirect evaporative ventilation air
cooling offloads the ventilation cooling load significantly, deliver-
ing air to the vapor compression evaporator coil at approximately
84°F, instead of 105°F. For “Annual” conditions, indirect evapora-
tive completely cuts the ventilation cooling load and actually pro-
vides a minor amount of space cooling capacity. For all cases, air
and water exit the ventilation cooling coil nearly the same temper-
ature. Similarly, the condenser liquid line temperature is always
only 1-2°F warmer than the condenser inlet temperature after the
evaporative condenser–air pre–cooler.
For Figure 14 through Figure 17, note that the condenser inlet con-
dition is at a somewhat higher specific enthalpy than the outside
air. As explained in Experimental Methods & Calculations section
this difference is due to transfer of sensible enthalpy from the ven-
tilation air flow to the condenser–air flow via the indirect evapo-
rative cooling process. Accounting for the difference in air flow
rates, the total enthalpy gain across the condenser–air pre–cooler
is equal to enthalpy decrease for airflow across the ventilation air
cooling coil.
Figure 17 plots performance of the system in an indirect evapora-
tive only mode, operating with 43% outside air. While operation
with minimum ventilation air and indirect evaporative cooling only
is not a part of the current sequence of operations, future revisions
should consider the benefit of this scenario to cover ventilation
cooling load while there is no active call for cooling. In fact, opera-
tion in this mode could even provide a significant amount of space
cooling for certain conditions, effectively extending the range for
economizer operation.
Appendix B provides similar psychrometric charts for the entire
range of tests that were conducted.
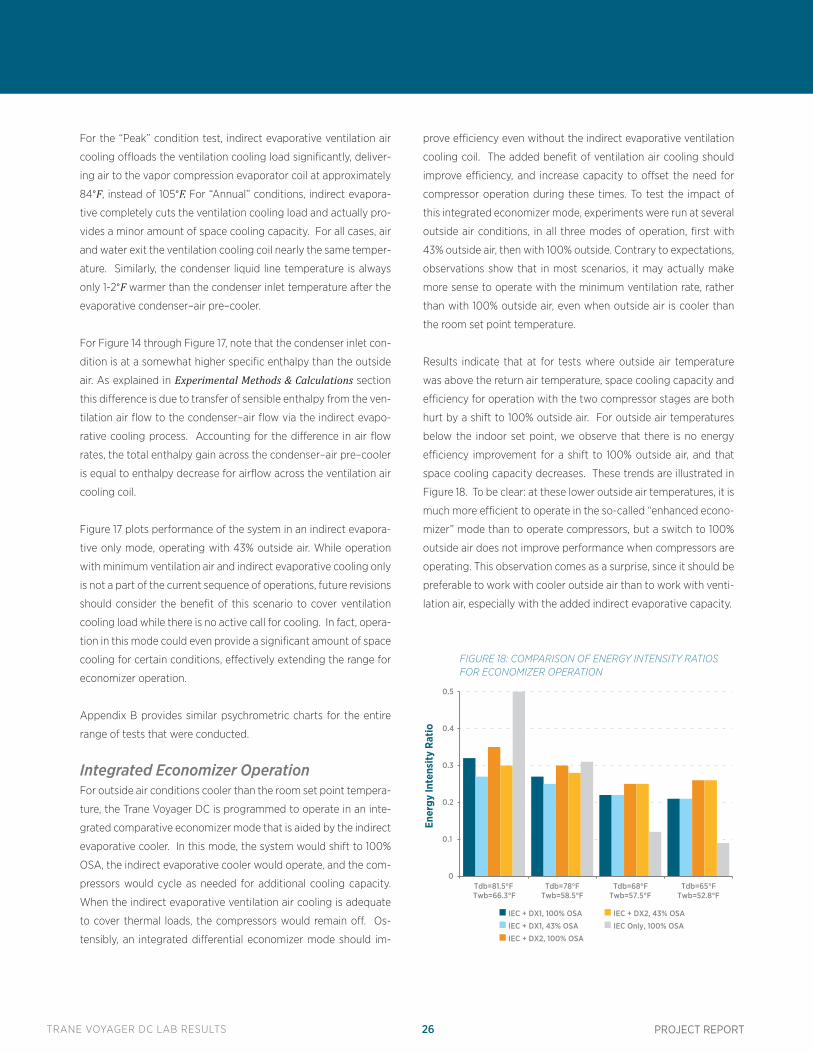
Integrated Economizer OperationFor outside air conditions cooler than the room set point tempera-
ture, the Trane Voyager DC is programmed to operate in an inte-
grated comparative economizer mode that is aided by the indirect
evaporative cooler. In this mode, the system would shift to 100%
OSA, the indirect evaporative cooler would operate, and the com-
pressors would cycle as needed for additional cooling capacity.
When the indirect evaporative ventilation air cooling is adequate
to cover thermal loads, the compressors would remain off. Os-
tensibly, an integrated differential economizer mode should im-
prove efficiency even without the indirect evaporative ventilation
cooling coil. The added benefit of ventilation air cooling should
improve efficiency, and increase capacity to offset the need for
compressor operation during these times. To test the impact of
this integrated economizer mode, experiments were run at several
outside air conditions, in all three modes of operation, first with
43% outside air, then with 100% outside. Contrary to expectations,
observations show that in most scenarios, it may actually make
more sense to operate with the minimum ventilation rate, rather
than with 100% outside air, even when outside air is cooler than
the room set point temperature.
Results indicate that at for tests where outside air temperature
was above the return air temperature, space cooling capacity and
efficiency for operation with the two compressor stages are both
hurt by a shift to 100% outside air. For outside air temperatures
below the indoor set point, we observe that there is no energy
efficiency improvement for a shift to 100% outside air, and that
space cooling capacity decreases. These trends are illustrated in
Figure 18. To be clear: at these lower outside air temperatures, it is
much more efficient to operate in the so-called “enhanced econo-
mizer” mode than to operate compressors, but a switch to 100%
outside air does not improve performance when compressors are
operating. This observation comes as a surprise, since it should be
preferable to work with cooler outside air than to work with venti-
lation air, especially with the added indirect evaporative capacity.
0
0.1
0.2
0.3
0.4
0.5
Tdb=81.5°FTwb=66.3°F
Tdb=78°FTwb=58.5°F
Tdb=68°FTwb=57.5°F
Tdb=65°FTwb=52.8°F
Ener
gy In
tens
ity R
atio
IEC + DX1, 100% OSA
IEC + DX1, 43% OSA
IEC + DX2, 100% OSA
IEC + DX2, 43% OSA
IEC Only, 100% OSA
FIGURE 18: COMPARISON OF ENERGY INTENSITY RATIOS FOR ECONOMIZER OPERATION
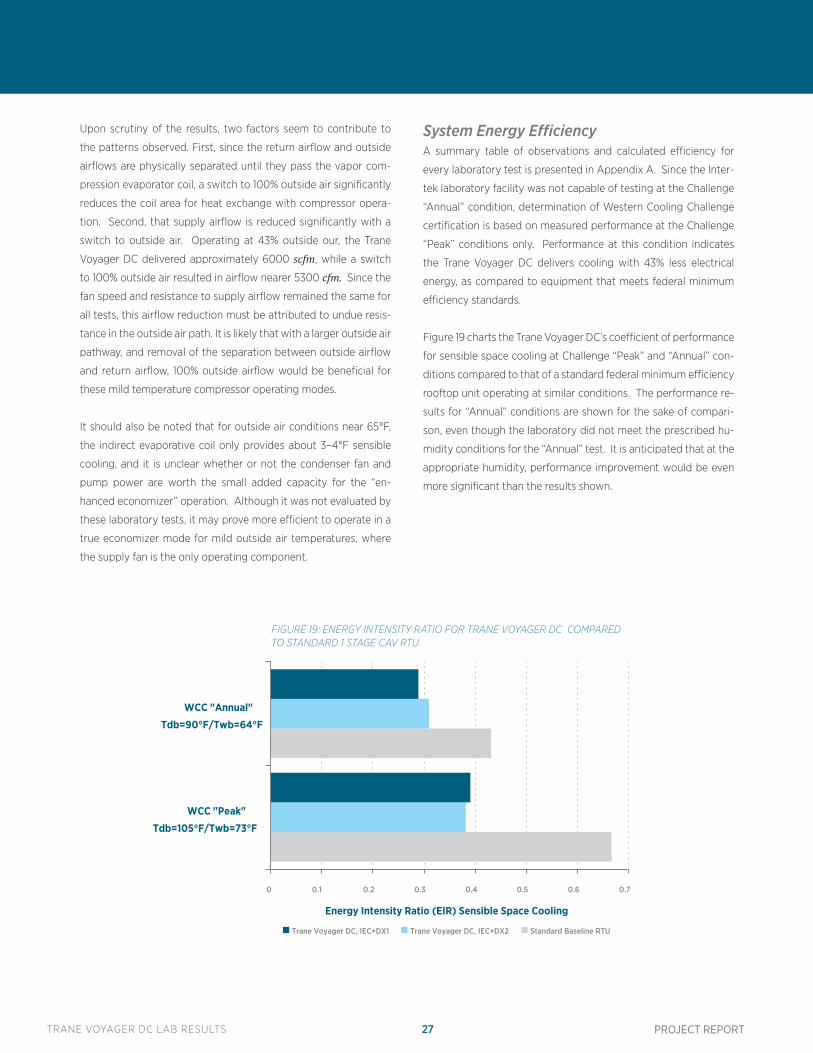
TRANE VOYAGER DC LAB RESULTS 27 PROJECT REPORT
Upon scrutiny of the results, two factors seem to contribute to
the patterns observed. First, since the return airflow and outside
airflows are physically separated until they pass the vapor com-
pression evaporator coil, a switch to 100% outside air significantly
reduces the coil area for heat exchange with compressor opera-
tion. Second, that supply airflow is reduced significantly with a
switch to outside air. Operating at 43% outside our, the Trane
Voyager DC delivered approximately 6000 scfm, while a switch
to 100% outside air resulted in airflow nearer 5300 cfm. Since the
fan speed and resistance to supply airflow remained the same for
all tests, this airflow reduction must be attributed to undue resis-
tance in the outside air path. It is likely that with a larger outside air
pathway, and removal of the separation between outside airflow
and return airflow, 100% outside airflow would be beneficial for
these mild temperature compressor operating modes.
It should also be noted that for outside air conditions near 65°F,
the indirect evaporative coil only provides about 3–4°F sensible
cooling, and it is unclear whether or not the condenser fan and
pump power are worth the small added capacity for the “en-
hanced economizer” operation. Although it was not evaluated by
these laboratory tests, it may prove more efficient to operate in a
true economizer mode for mild outside air temperatures, where
the supply fan is the only operating component.
System Energy EfficiencyA summary table of observations and calculated efficiency for
every laboratory test is presented in Appendix A. Since the Inter-
tek laboratory facility was not capable of testing at the Challenge
“Annual” condition, determination of Western Cooling Challenge
certification is based on measured performance at the Challenge
“Peak” conditions only. Performance at this condition indicates
the Trane Voyager DC delivers cooling with 43% less electrical
energy, as compared to equipment that meets federal minimum
efficiency standards.
Figure 19 charts the Trane Voyager DC’s coefficient of performance
for sensible space cooling at Challenge “Peak” and “Annual” con-
ditions compared to that of a standard federal minimum efficiency
rooftop unit operating at similar conditions. The performance re-
sults for “Annual” conditions are shown for the sake of compari-
son, even though the laboratory did not meet the prescribed hu-
midity conditions for the “Annual” test. It is anticipated that at the
appropriate humidity, performance improvement would be even
more significant than the results shown.
0 0.1 0.2 0.3 0.4 0.5 0.6 0.7
WCC "Peak"
Tdb=105°F/Twb=73°F
WCC "Annual"
Tdb=90°F/Twb=64°F
Energy Intensity Ratio (EIR) Sensible Space Cooling
Trane Voyager DC, IEC+DX1 Trane Voyager DC, IEC+DX2 Standard Baseline RTU
FIGURE 19: ENERGY INTENSITY RATIO FOR TRANE VOYAGER DC COMPARED TO STANDARD 1 STAGE CAV RTU
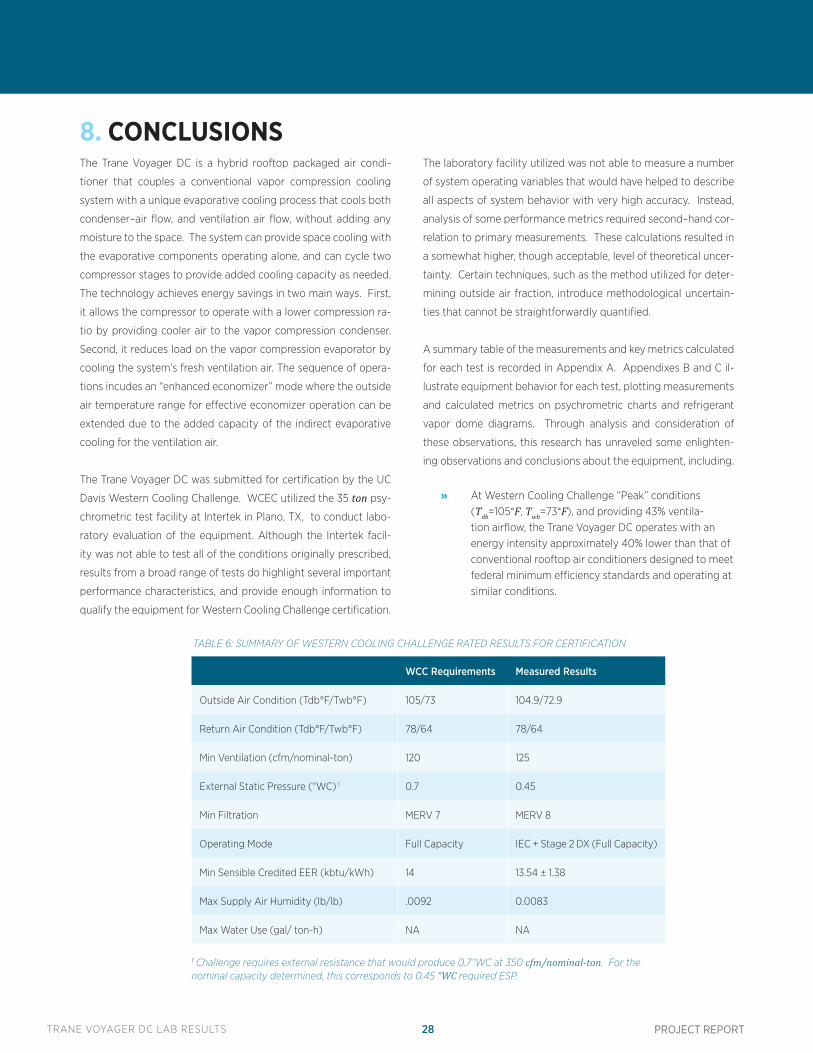
TRANE VOYAGER DC LAB RESULTS 28 PROJECT REPORT
8. CONCLUSIONSThe Trane Voyager DC is a hybrid rooftop packaged air condi-
tioner that couples a conventional vapor compression cooling
system with a unique evaporative cooling process that cools both
condenser–air flow, and ventilation air flow, without adding any
moisture to the space. The system can provide space cooling with
the evaporative components operating alone, and can cycle two
compressor stages to provide added cooling capacity as needed.
The technology achieves energy savings in two main ways. First,
it allows the compressor to operate with a lower compression ra-
tio by providing cooler air to the vapor compression condenser.
Second, it reduces load on the vapor compression evaporator by
cooling the system’s fresh ventilation air. The sequence of opera-
tions incudes an “enhanced economizer” mode where the outside
air temperature range for effective economizer operation can be
extended due to the added capacity of the indirect evaporative
cooling for the ventilation air.
The Trane Voyager DC was submitted for certification by the UC
Davis Western Cooling Challenge. WCEC utilized the 35 ton psy-
chrometric test facility at Intertek in Plano, TX, to conduct labo-
ratory evaluation of the equipment. Although the Intertek facil-
ity was not able to test all of the conditions originally prescribed,
results from a broad range of tests do highlight several important
performance characteristics, and provide enough information to
qualify the equipment for Western Cooling Challenge certification.
The laboratory facility utilized was not able to measure a number
of system operating variables that would have helped to describe
all aspects of system behavior with very high accuracy. Instead,
analysis of some performance metrics required second–hand cor-
relation to primary measurements. These calculations resulted in
a somewhat higher, though acceptable, level of theoretical uncer-
tainty. Certain techniques, such as the method utilized for deter-
mining outside air fraction, introduce methodological uncertain-
ties that cannot be straightforwardly quantified.
A summary table of the measurements and key metrics calculated
for each test is recorded in Appendix A. Appendixes B and C il-
lustrate equipment behavior for each test, plotting measurements
and calculated metrics on psychrometric charts and refrigerant
vapor dome diagrams. Through analysis and consideration of
these observations, this research has unraveled some enlighten-
ing observations and conclusions about the equipment, including.
» At Western Cooling Challenge “Peak” conditions (Tdb=105°F, Twb=73°F), and providing 43% ventila-tion airflow, the Trane Voyager DC operates with an energy intensity approximately 40% lower than that of conventional rooftop air conditioners designed to meet federal minimum efficiency standards and operating at similar conditions.
1 Challenge requires external resistance that would produce 0.7”WC at 350 cfm/nominal-ton. For the nominal capacity determined, this corresponds to 0.45 “WC required ESP.
WCC Requirements Measured Results
Outside Air Condition (Tdb°F/Twb°F) 105/73 104.9/72.9
Return Air Condition (Tdb°F/Twb°F) 78/64 78/64
Min Ventilation (cfm/nominal-ton) 120 125
External Static Pressure (“WC) 1 0.7 0.45
Min Filtration MERV 7 MERV 8
Operating Mode Full Capacity IEC + Stage 2 DX (Full Capacity)
Min Sensible Credited EER (kbtu/kWh) 14 13.54 ± 1.38
Max Supply Air Humidity (lb/lb) .0092 0.0083
Max Water Use (gal/ ton-h) NA NA
TABLE 6: SUMMARY OF WESTERN COOLING CHALLENGE RATED RESULTS FOR CERTIFICATION
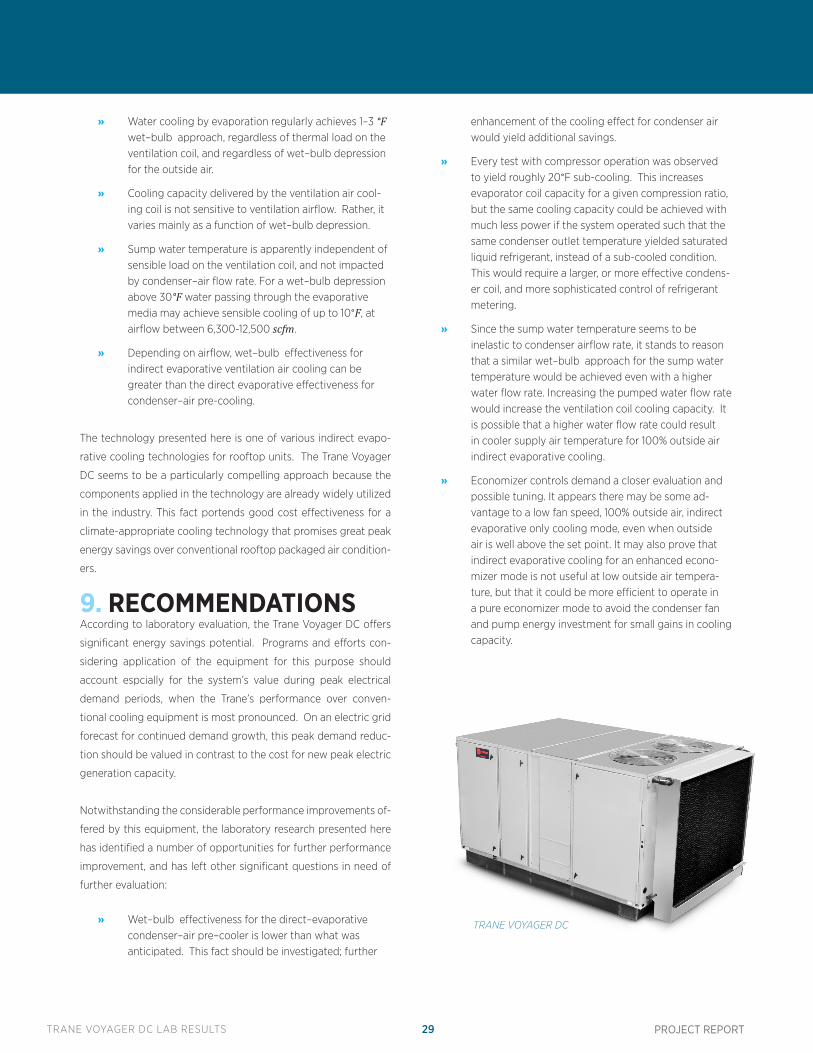
TRANE VOYAGER DC LAB RESULTS 29 PROJECT REPORT
» Water cooling by evaporation regularly achieves 1–3 °F wet–bulb approach, regardless of thermal load on the ventilation coil, and regardless of wet–bulb depression for the outside air.
» Cooling capacity delivered by the ventilation air cool-ing coil is not sensitive to ventilation airflow. Rather, it varies mainly as a function of wet–bulb depression.
» Sump water temperature is apparently independent of sensible load on the ventilation coil, and not impacted by condenser–air flow rate. For a wet–bulb depression above 30°F water passing through the evaporative media may achieve sensible cooling of up to 10°F, at airflow between 6,300-12,500 scfm.
» Depending on airflow, wet–bulb effectiveness for indirect evaporative ventilation air cooling can be greater than the direct evaporative effectiveness for condenser–air pre-cooling.
The technology presented here is one of various indirect evapo-
rative cooling technologies for rooftop units. The Trane Voyager
DC seems to be a particularly compelling approach because the
components applied in the technology are already widely utilized
in the industry. This fact portends good cost effectiveness for a
climate-appropriate cooling technology that promises great peak
energy savings over conventional rooftop packaged air condition-
ers.
According to laboratory evaluation, the Trane Voyager DC offers
significant energy savings potential. Programs and efforts con-
sidering application of the equipment for this purpose should
account espcially for the system’s value during peak electrical
demand periods, when the Trane’s performance over conven-
tional cooling equipment is most pronounced. On an electric grid
forecast for continued demand growth, this peak demand reduc-
tion should be valued in contrast to the cost for new peak electric
generation capacity.
Notwithstanding the considerable performance improvements of-
fered by this equipment, the laboratory research presented here
has identified a number of opportunities for further performance
improvement, and has left other significant questions in need of
further evaluation:
» Wet–bulb effectiveness for the direct–evaporative condenser–air pre–cooler is lower than what was anticipated. This fact should be investigated; further
enhancement of the cooling effect for condenser air would yield additional savings.
» Every test with compressor operation was observed to yield roughly 20°F sub-cooling. This increases evaporator coil capacity for a given compression ratio, but the same cooling capacity could be achieved with much less power if the system operated such that the same condenser outlet temperature yielded saturated liquid refrigerant, instead of a sub-cooled condition. This would require a larger, or more effective condens-er coil, and more sophisticated control of refrigerant metering.
» Since the sump water temperature seems to be inelastic to condenser airflow rate, it stands to reason that a similar wet–bulb approach for the sump water temperature would be achieved even with a higher water flow rate. Increasing the pumped water flow rate would increase the ventilation coil cooling capacity. It is possible that a higher water flow rate could result in cooler supply air temperature for 100% outside air indirect evaporative cooling.
» Economizer controls demand a closer evaluation and possible tuning. It appears there may be some ad-vantage to a low fan speed, 100% outside air, indirect evaporative only cooling mode, even when outside air is well above the set point. It may also prove that indirect evaporative cooling for an enhanced econo-mizer mode is not useful at low outside air tempera-ture, but that it could be more efficient to operate in a pure economizer mode to avoid the condenser fan and pump energy investment for small gains in cooling capacity.
9. RECOMMENDATIONS
TRANE VOYAGER DC
TRANE VOYAGER DC LAB RESULTS 30 PROJECT REPORT
The equipment is designed especially to capture energy savings in applications where the system provides
a significant amount of ventilation air. If installed to replace equipment that currently operates without
ventilation air, the Trane Voyager DC would not achieve the same degree of savings. The ventilation rate
applied to these tests is representative of typical design practices for large retail facilities. If air balance for
the building is such that this amount of ventilation is not required, the Trane Voyager DC could be applied to
cover the continuous ventilation load that would be required by multiple rooftop units that serve the same
general space.
It should be noted that the manufacturer offers a number of options for additional energy savings measures
that were not laboratory tested and evaluated here. Ongoing investigation through various pilot field instal-
lations will evaluate the impact of variable speed fan controls, micro–channel heat exchangers, and demand
controlled ventilation strategies. In summary, the laboratory evaluation inspires great confidence that the
equipment provides compelling energy savings, and highlights a number of opportunities for still further
improvement.
10. REFERENCESWoolley, Modera. Speakman Hybrid Rooftop Unit Performance: Western Cooling Challenge Laboratory Test Results. Southern California Ediston, Design and Engineering Services. Report HT.10.SCE.232. 2011.
California Public Utilities Commission. Energy Efficiency Strategic Plan - January 2011 Update. Available
Online. http://www.cpuc.ca.gov/NR/rdonlyres/A54B59C2-D571-440D-9477-3363726F573A/0/CAEnergyEf-
ficiencyStrategicPlan_Jan2011.pdf. 2011.
Western Cooling Efficiency Center. Western Cooling Challenge Program Requirements. Online. http://wcec.
ucdavis.edu/. 2012.
Woolley, J. Modera, M. Advancing Development of Hybrid Rooftop Packaged Air Conditioners: Test Protocol and Performance Criteria for the Western Cooling Challenge. ASHRAE 2011-86098. ASHRAE Transactions,
2011, Vol. 117 Issue 1, p533-540. 2011.
Kozubal, E; Slayzak, S. Coolerado 5 Ton RTU Performance: Western Cooling Challenge Results. National
Renewable Energy Laboratory. Technical Report NREL/TP-5500-46524. November 2010.
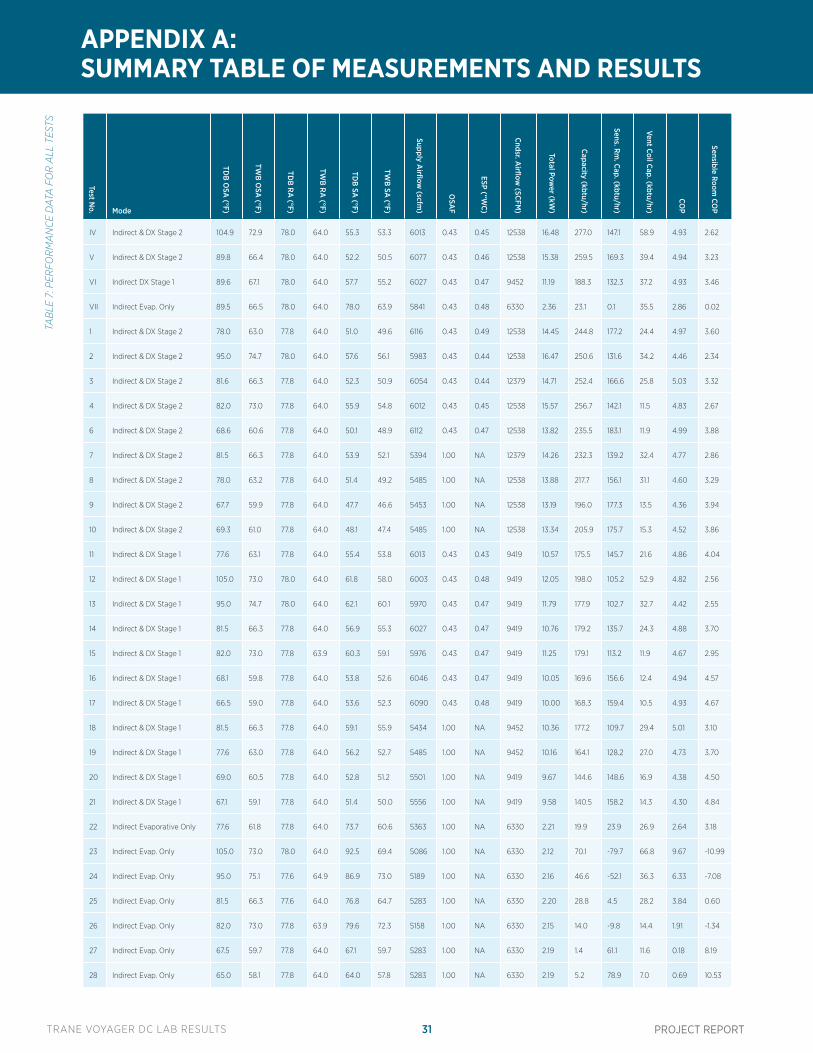
TRANE VOYAGER DC LAB RESULTS 31 PROJECT REPORT
Test No. Mode
TDB
OSA
(°F)
TWB
OSA
(°F)
TDB
RA
(°F)
TWB
RA
(°F)
TDB
SA (°F)
TWB
SA (°F)
Supply Airflow
(scfm)
OSA
F
ESP (“WC)
Cndsr. Airflow
(SCFM)
Total Power (kW
)
Capacity (kbtu/hr)
Sens. Rm
. Cap. (kbtu/hr)
Vent Coil Cap. (kbtu/hr)
COP
Sensible Room CO
P
IV Indirect & DX Stage 2 104.9 72.9 78.0 64.0 55.3 53.3 6013 0.43 0.45 12538 16.48 277.0 147.1 58.9 4.93 2.62
V Indirect & DX Stage 2 89.8 66.4 78.0 64.0 52.2 50.5 6077 0.43 0.46 12538 15.38 259.5 169.3 39.4 4.94 3.23
VI Indirect DX Stage 1 89.6 67.1 78.0 64.0 57.7 55.2 6027 0.43 0.47 9452 11.19 188.3 132.3 37.2 4.93 3.46
VII Indirect Evap. Only 89.5 66.5 78.0 64.0 78.0 63.9 5841 0.43 0.48 6330 2.36 23.1 0.1 35.5 2.86 0.02
1 Indirect & DX Stage 2 78.0 63.0 77.8 64.0 51.0 49.6 6116 0.43 0.49 12538 14.45 244.8 177.2 24.4 4.97 3.60
2 Indirect & DX Stage 2 95.0 74.7 78.0 64.0 57.6 56.1 5983 0.43 0.44 12538 16.47 250.6 131.6 34.2 4.46 2.34
3 Indirect & DX Stage 2 81.6 66.3 77.8 64.0 52.3 50.9 6054 0.43 0.44 12379 14.71 252.4 166.6 25.8 5.03 3.32
4 Indirect & DX Stage 2 82.0 73.0 77.8 64.0 55.9 54.8 6012 0.43 0.45 12538 15.57 256.7 142.1 11.5 4.83 2.67
6 Indirect & DX Stage 2 68.6 60.6 77.8 64.0 50.1 48.9 6112 0.43 0.47 12538 13.82 235.5 183.1 11.9 4.99 3.88
7 Indirect & DX Stage 2 81.5 66.3 77.8 64.0 53.9 52.1 5394 1.00 NA 12379 14.26 232.3 139.2 32.4 4.77 2.86
8 Indirect & DX Stage 2 78.0 63.2 77.8 64.0 51.4 49.2 5485 1.00 NA 12538 13.88 217.7 156.1 31.1 4.60 3.29
9 Indirect & DX Stage 2 67.7 59.9 77.8 64.0 47.7 46.6 5453 1.00 NA 12538 13.19 196.0 177.3 13.5 4.36 3.94
10 Indirect & DX Stage 2 69.3 61.0 77.8 64.0 48.1 47.4 5485 1.00 NA 12538 13.34 205.9 175.7 15.3 4.52 3.86
11 Indirect & DX Stage 1 77.6 63.1 77.8 64.0 55.4 53.8 6013 0.43 0.43 9419 10.57 175.5 145.7 21.6 4.86 4.04
12 Indirect & DX Stage 1 105.0 73.0 78.0 64.0 61.8 58.0 6003 0.43 0.48 9419 12.05 198.0 105.2 52.9 4.82 2.56
13 Indirect & DX Stage 1 95.0 74.7 78.0 64.0 62.1 60.1 5970 0.43 0.47 9419 11.79 177.9 102.7 32.7 4.42 2.55
14 Indirect & DX Stage 1 81.5 66.3 77.8 64.0 56.9 55.3 6027 0.43 0.47 9419 10.76 179.2 135.7 24.3 4.88 3.70
15 Indirect & DX Stage 1 82.0 73.0 77.8 63.9 60.3 59.1 5976 0.43 0.47 9419 11.25 179.1 113.2 11.9 4.67 2.95
16 Indirect & DX Stage 1 68.1 59.8 77.8 64.0 53.8 52.6 6046 0.43 0.47 9419 10.05 169.6 156.6 12.4 4.94 4.57
17 Indirect & DX Stage 1 66.5 59.0 77.8 64.0 53.6 52.3 6090 0.43 0.48 9419 10.00 168.3 159.4 10.5 4.93 4.67
18 Indirect & DX Stage 1 81.5 66.3 77.8 64.0 59.1 55.9 5434 1.00 NA 9452 10.36 177.2 109.7 29.4 5.01 3.10
19 Indirect & DX Stage 1 77.6 63.0 77.8 64.0 56.2 52.7 5485 1.00 NA 9452 10.16 164.1 128.2 27.0 4.73 3.70
20 Indirect & DX Stage 1 69.0 60.5 77.8 64.0 52.8 51.2 5501 1.00 NA 9419 9.67 144.6 148.6 16.9 4.38 4.50
21 Indirect & DX Stage 1 67.1 59.1 77.8 64.0 51.4 50.0 5556 1.00 NA 9419 9.58 140.5 158.2 14.3 4.30 4.84
22 Indirect Evaporative Only 77.6 61.8 77.8 64.0 73.7 60.6 5363 1.00 NA 6330 2.21 19.9 23.9 26.9 2.64 3.18
23 Indirect Evap. Only 105.0 73.0 78.0 64.0 92.5 69.4 5086 1.00 NA 6330 2.12 70.1 -79.7 66.8 9.67 -10.99
24 Indirect Evap. Only 95.0 75.1 77.6 64.9 86.9 73.0 5189 1.00 NA 6330 2.16 46.6 -52.1 36.3 6.33 -7.08
25 Indirect Evap. Only 81.5 66.3 77.6 64.0 76.8 64.7 5283 1.00 NA 6330 2.20 28.8 4.5 28.2 3.84 0.60
26 Indirect Evap. Only 82.0 73.0 77.8 63.9 79.6 72.3 5158 1.00 NA 6330 2.15 14.0 -9.8 14.4 1.91 -1.34
27 Indirect Evap. Only 67.5 59.7 77.8 64.0 67.1 59.7 5283 1.00 NA 6330 2.19 1.4 61.1 11.6 0.18 8.19
28 Indirect Evap. Only 65.0 58.1 77.8 64.0 64.0 57.8 5283 1.00 NA 6330 2.19 5.2 78.9 7.0 0.69 10.53
APPENDIX A: SUMMARY TABLE OF MEASUREMENTS AND RESULTS
TAB
LE 7
: PER
FOR
MA
NC
E D
ATA
FO
R A
LL T
ESTS
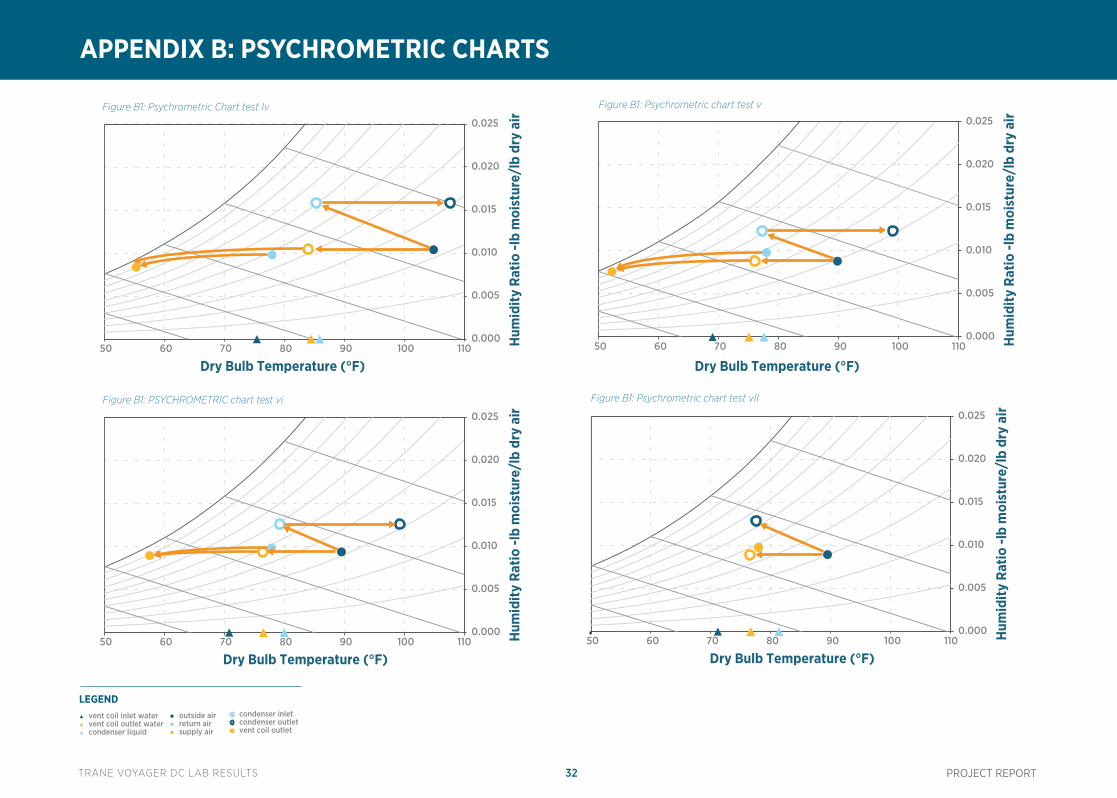
TRANE VOYAGER DC LAB RESULTS 32 PROJECT REPORT
APPENDIX B: PSYCHROMETRIC CHARTS
0.000
0.005
0.010
0.015
0.020
0.025
50 60 70 80 90 100 110
Hum
idity
Rat
io -l
b m
oist
ure/
lb d
ry a
ir
Dry Bulb Temperature (°F)
Figure B1: Psychrometric chart test v
0.000
0.005
0.010
0.015
0.020
0.025
50 60 70 80 90 100 110
Hum
idity
Rat
io -l
b m
oist
ure/
lb d
ry a
ir
Dry Bulb Temperature (°F)
Figure B1: Psychrometric Chart test Iv
0.000
0.005
0.010
0.015
0.020
0.025
50 60 70 80 90 100 110
Hum
idity
Rat
io -l
b m
oist
ure/
lb d
ry a
ir
Dry Bulb Temperature (°F)
0.000
0.005
0.010
0.015
0.020
0.025
50 60 70 80 90 100 110
Hum
idity
Rat
io -l
b m
oist
ure/
lb d
ry a
ir
Dry Bulb Temperature (°F)
Figure B1: PSYCHROMETRIC chart test vi Figure B1: Psychrometric chart test vII
vent coil inlet water vent coil outlet water condenser liquid
outside air return air supply air
condenser inlet condenser outlet vent coil outlet
LEGEND
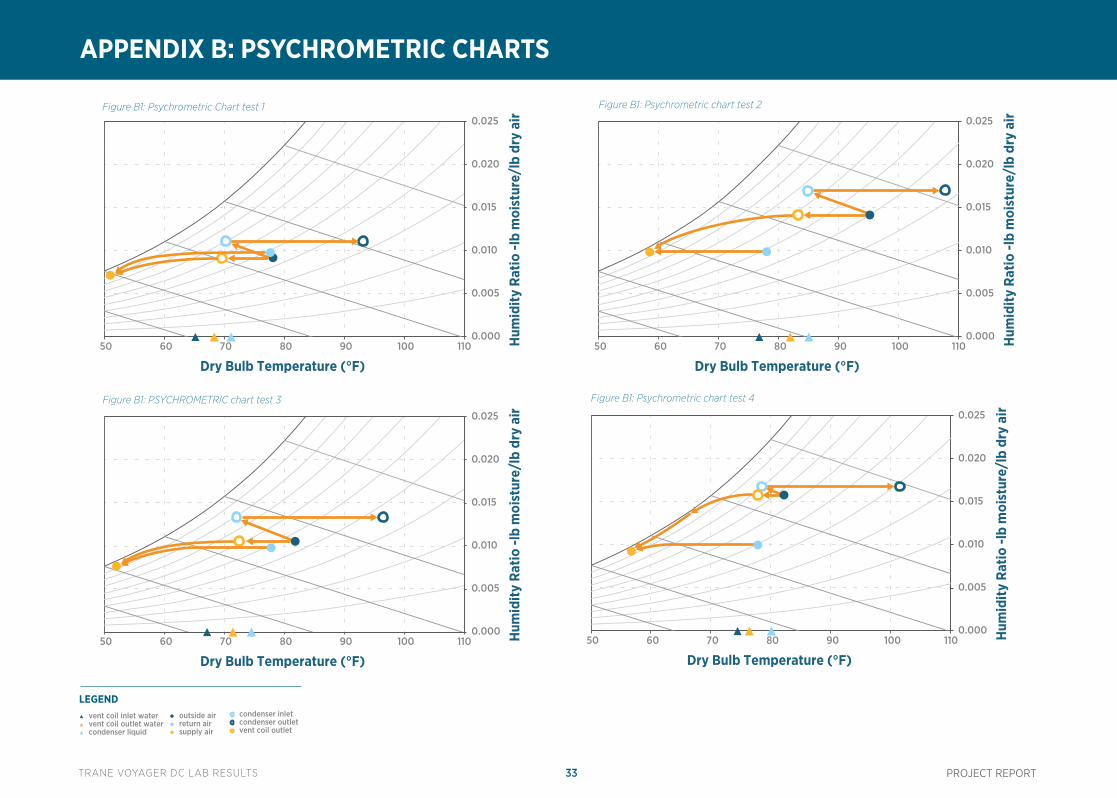
TRANE VOYAGER DC LAB RESULTS 33 PROJECT REPORT
APPENDIX B: PSYCHROMETRIC CHARTS
0.000
0.005
0.010
0.015
0.020
0.025
50 60 70 80 90 100 110
Hum
idity
Rat
io -l
b m
oist
ure/
lb d
ry a
ir
Dry Bulb Temperature (°F)
Figure B1: Psychrometric chart test 2
0.000
0.005
0.010
0.015
0.020
0.025
50 60 70 80 90 100 110
Hum
idity
Rat
io -l
b m
oist
ure/
lb d
ry a
ir
Dry Bulb Temperature (°F)
Figure B1: Psychrometric Chart test 1
0.000
0.005
0.010
0.015
0.020
0.025
50 60 70 80 90 100 110
Hum
idity
Rat
io -l
b m
oist
ure/
lb d
ry a
ir
Dry Bulb Temperature (°F)
0.000
0.005
0.010
0.015
0.020
0.025
50 60 70 80 90 100 110
Hum
idity
Rat
io -l
b m
oist
ure/
lb d
ry a
ir
Dry Bulb Temperature (°F)
Figure B1: PSYCHROMETRIC chart test 3 Figure B1: Psychrometric chart test 4
vent coil inlet water vent coil outlet water condenser liquid
outside air return air supply air
condenser inlet condenser outlet vent coil outlet
LEGEND
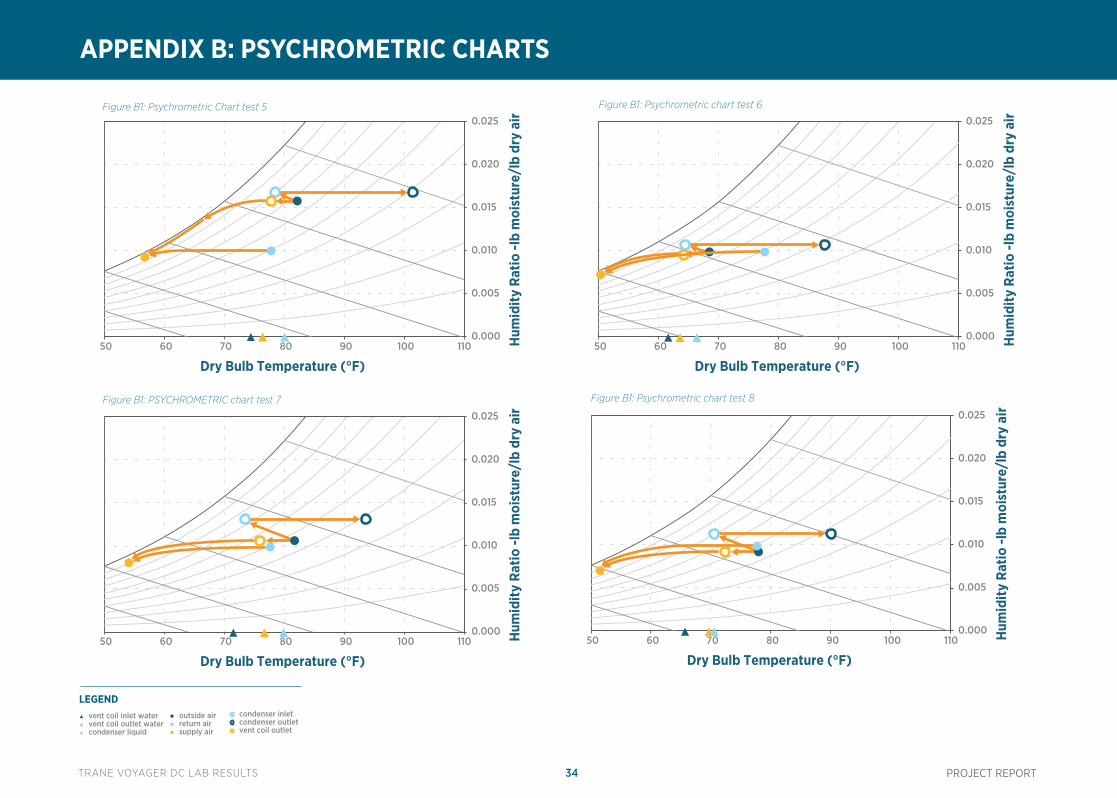
TRANE VOYAGER DC LAB RESULTS 34 PROJECT REPORT
APPENDIX B: PSYCHROMETRIC CHARTS
0.000
0.005
0.010
0.015
0.020
0.025
50 60 70 80 90 100 110
Hum
idity
Rat
io -l
b m
oist
ure/
lb d
ry a
ir
Dry Bulb Temperature (°F)
Figure B1: Psychrometric chart test 6
0.000
0.005
0.010
0.015
0.020
0.025
50 60 70 80 90 100 110
Hum
idity
Rat
io -l
b m
oist
ure/
lb d
ry a
ir
Dry Bulb Temperature (°F)
Figure B1: Psychrometric Chart test 5
0.000
0.005
0.010
0.015
0.020
0.025
50 60 70 80 90 100 110
Hum
idity
Rat
io -l
b m
oist
ure/
lb d
ry a
ir
Dry Bulb Temperature (°F)
0.000
0.005
0.010
0.015
0.020
0.025
50 60 70 80 90 100 110
Hum
idity
Rat
io -l
b m
oist
ure/
lb d
ry a
ir
Dry Bulb Temperature (°F)
Figure B1: PSYCHROMETRIC chart test 7 Figure B1: Psychrometric chart test 8
vent coil inlet water vent coil outlet water condenser liquid
outside air return air supply air
condenser inlet condenser outlet vent coil outlet
LEGEND
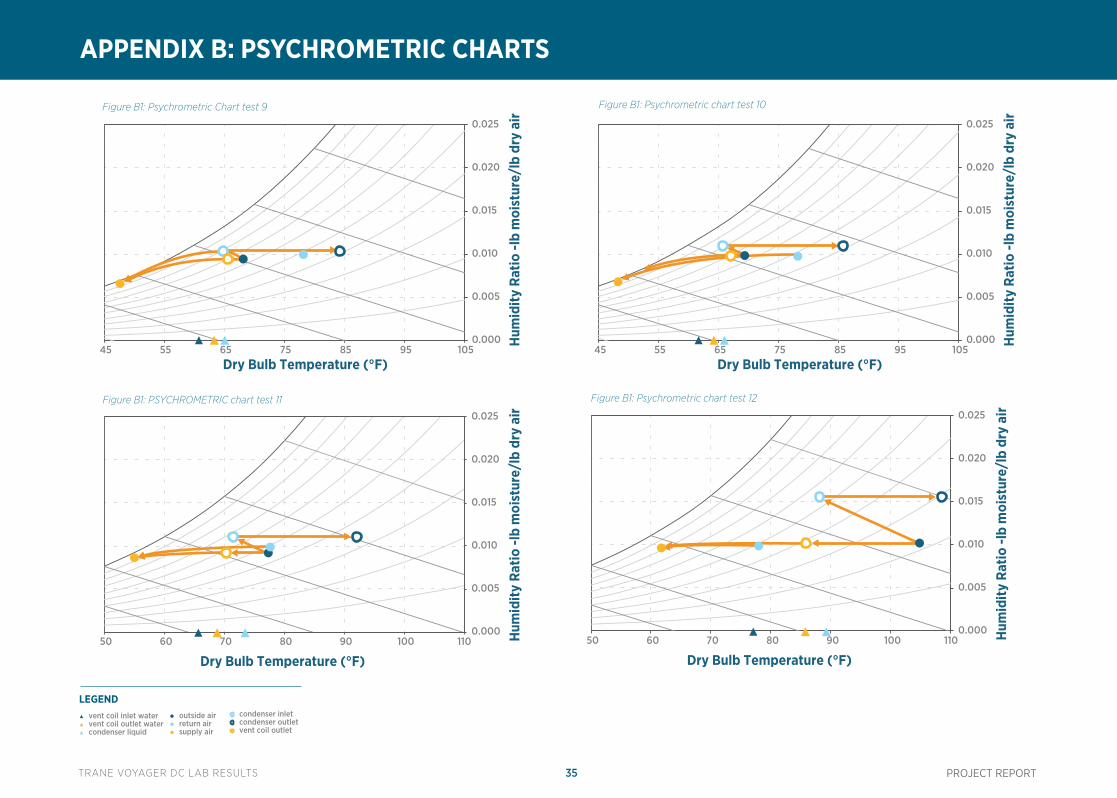
TRANE VOYAGER DC LAB RESULTS 35 PROJECT REPORT
APPENDIX B: PSYCHROMETRIC CHARTS
0.000
0.005
0.010
0.015
0.020
0.025
45 55 65 75 85 95 105
Hum
idity
Rat
io -l
b m
oist
ure/
lb d
ry a
ir
Dry Bulb Temperature (°F)
Figure B1: Psychrometric chart test 10
0.000
0.005
0.010
0.015
0.020
0.025
45 55 65 75 85 95 105
Hum
idity
Rat
io -l
b m
oist
ure/
lb d
ry a
ir
Dry Bulb Temperature (°F)
Figure B1: Psychrometric Chart test 9
0.000
0.005
0.010
0.015
0.020
0.025
50 60 70 80 90 100 110
Hum
idity
Rat
io -l
b m
oist
ure/
lb d
ry a
ir
Dry Bulb Temperature (°F)
0.000
0.005
0.010
0.015
0.020
0.025
50 60 70 80 90 100 110
Hum
idity
Rat
io -l
b m
oist
ure/
lb d
ry a
ir
Dry Bulb Temperature (°F)
Figure B1: PSYCHROMETRIC chart test 11 Figure B1: Psychrometric chart test 12
vent coil inlet water vent coil outlet water condenser liquid
outside air return air supply air
condenser inlet condenser outlet vent coil outlet
LEGEND
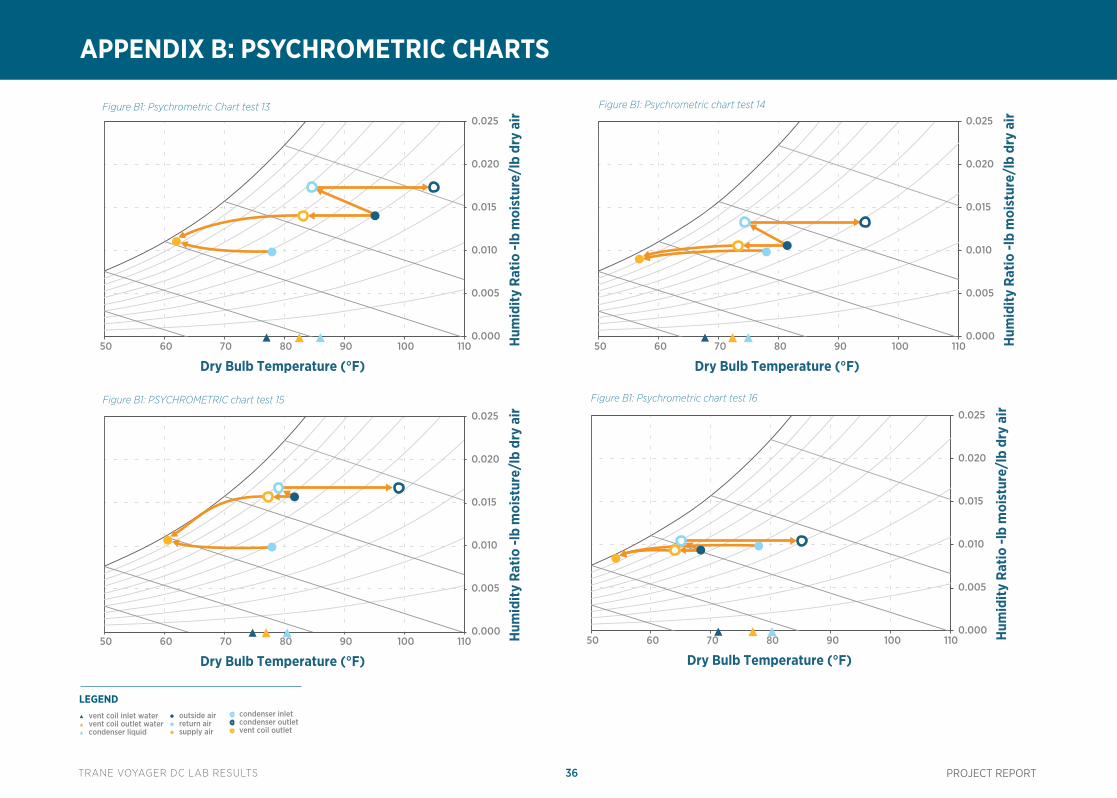
TRANE VOYAGER DC LAB RESULTS 36 PROJECT REPORT
APPENDIX B: PSYCHROMETRIC CHARTS
0.000
0.005
0.010
0.015
0.020
0.025
50 60 70 80 90 100 110
Hum
idity
Rat
io -l
b m
oist
ure/
lb d
ry a
ir
Dry Bulb Temperature (°F)
Figure B1: Psychrometric chart test 14
0.000
0.005
0.010
0.015
0.020
0.025
50 60 70 80 90 100 110
Hum
idity
Rat
io -l
b m
oist
ure/
lb d
ry a
ir
Dry Bulb Temperature (°F)
Figure B1: Psychrometric Chart test 13
0.000
0.005
0.010
0.015
0.020
0.025
50 60 70 80 90 100 110
Hum
idity
Rat
io -l
b m
oist
ure/
lb d
ry a
ir
Dry Bulb Temperature (°F)
0.000
0.005
0.010
0.015
0.020
0.025
50 60 70 80 90 100 110
Hum
idity
Rat
io -l
b m
oist
ure/
lb d
ry a
ir
Dry Bulb Temperature (°F)
Figure B1: PSYCHROMETRIC chart test 15 Figure B1: Psychrometric chart test 16
vent coil inlet water vent coil outlet water condenser liquid
outside air return air supply air
condenser inlet condenser outlet vent coil outlet
LEGEND
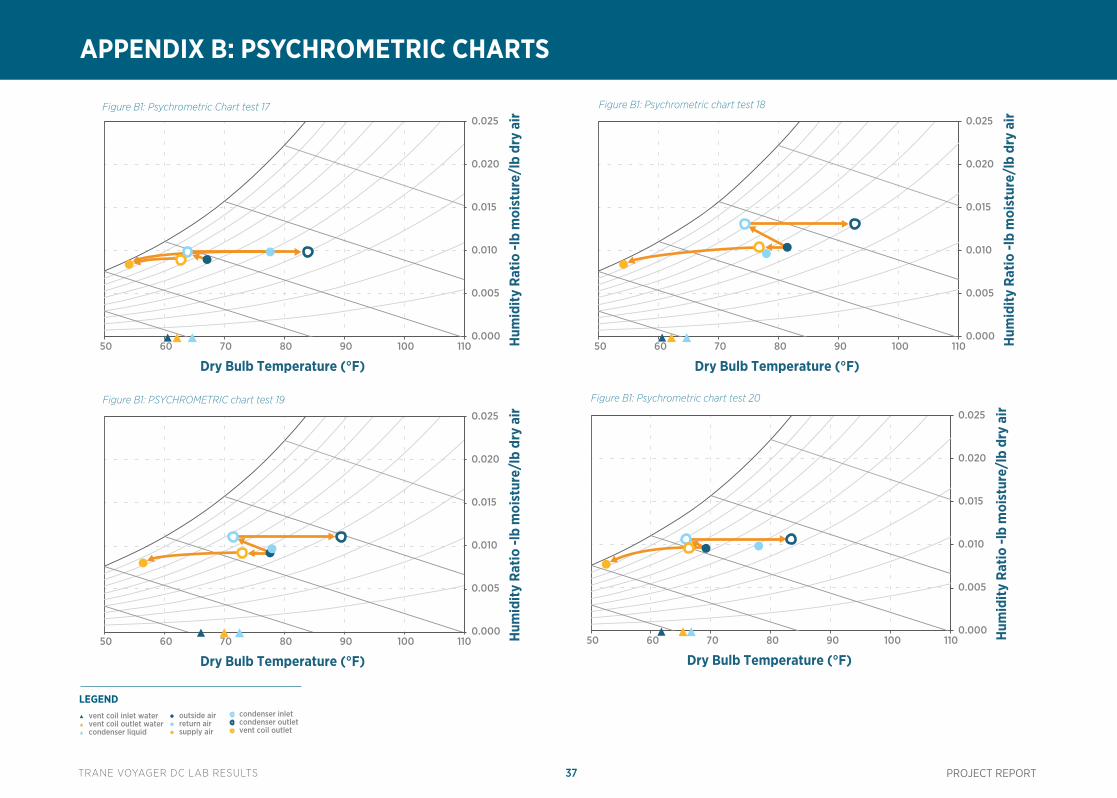
TRANE VOYAGER DC LAB RESULTS 37 PROJECT REPORT
APPENDIX B: PSYCHROMETRIC CHARTS
0.000
0.005
0.010
0.015
0.020
0.025
50 60 70 80 90 100 110
Hum
idity
Rat
io -l
b m
oist
ure/
lb d
ry a
ir
Dry Bulb Temperature (°F)
Figure B1: Psychrometric chart test 18
0.000
0.005
0.010
0.015
0.020
0.025
50 60 70 80 90 100 110
Hum
idity
Rat
io -l
b m
oist
ure/
lb d
ry a
ir
Dry Bulb Temperature (°F)
Figure B1: Psychrometric Chart test 17
0.000
0.005
0.010
0.015
0.020
0.025
50 60 70 80 90 100 110
Hum
idity
Rat
io -l
b m
oist
ure/
lb d
ry a
ir
Dry Bulb Temperature (°F)
0.000
0.005
0.010
0.015
0.020
0.025
50 60 70 80 90 100 110
Hum
idity
Rat
io -l
b m
oist
ure/
lb d
ry a
ir
Dry Bulb Temperature (°F)
Figure B1: PSYCHROMETRIC chart test 19 Figure B1: Psychrometric chart test 20
vent coil inlet water vent coil outlet water condenser liquid
outside air return air supply air
condenser inlet condenser outlet vent coil outlet
LEGEND
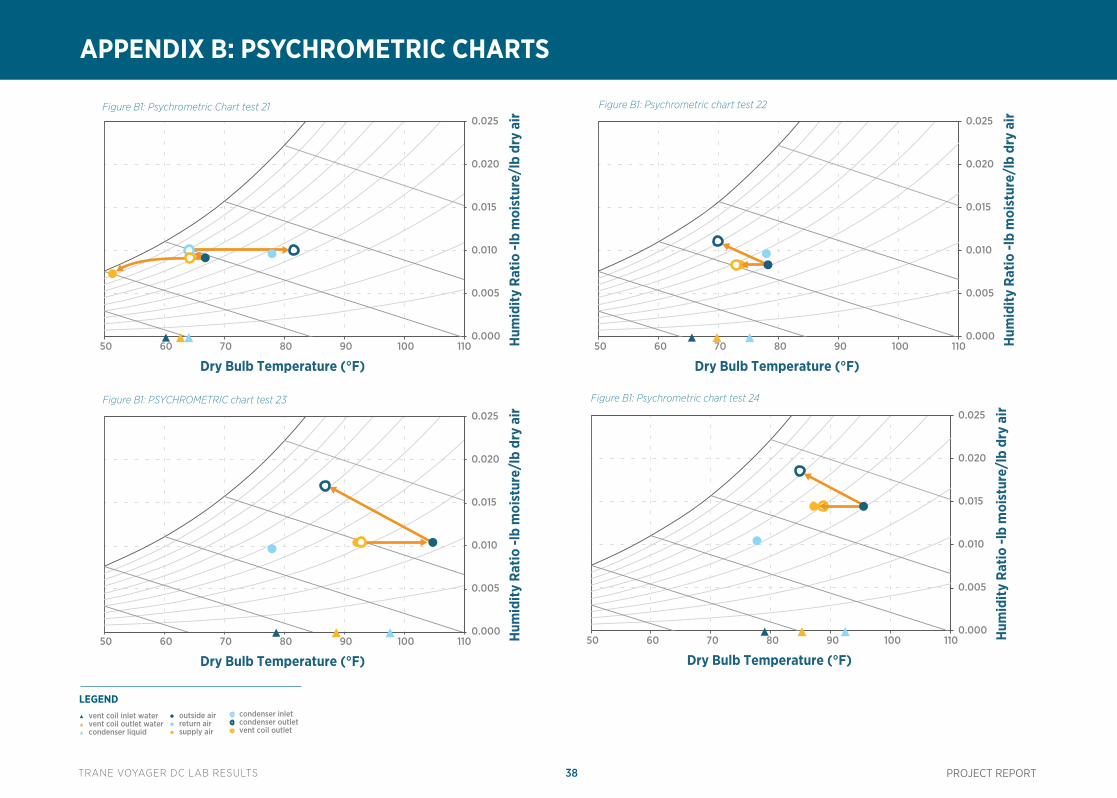
TRANE VOYAGER DC LAB RESULTS 38 PROJECT REPORT
APPENDIX B: PSYCHROMETRIC CHARTS
0.000
0.005
0.010
0.015
0.020
0.025
50 60 70 80 90 100 110
Hum
idity
Rat
io -l
b m
oist
ure/
lb d
ry a
ir
Dry Bulb Temperature (°F)
Figure B1: Psychrometric chart test 22
0.000
0.005
0.010
0.015
0.020
0.025
50 60 70 80 90 100 110
Hum
idity
Rat
io -l
b m
oist
ure/
lb d
ry a
ir
Dry Bulb Temperature (°F)
Figure B1: Psychrometric Chart test 21
0.000
0.005
0.010
0.015
0.020
0.025
50 60 70 80 90 100 110
Hum
idity
Rat
io -l
b m
oist
ure/
lb d
ry a
ir
Dry Bulb Temperature (°F)
0.000
0.005
0.010
0.015
0.020
0.025
50 60 70 80 90 100 110
Hum
idity
Rat
io -l
b m
oist
ure/
lb d
ry a
ir
Dry Bulb Temperature (°F)
Figure B1: PSYCHROMETRIC chart test 23 Figure B1: Psychrometric chart test 24
vent coil inlet water vent coil outlet water condenser liquid
outside air return air supply air
condenser inlet condenser outlet vent coil outlet
LEGEND
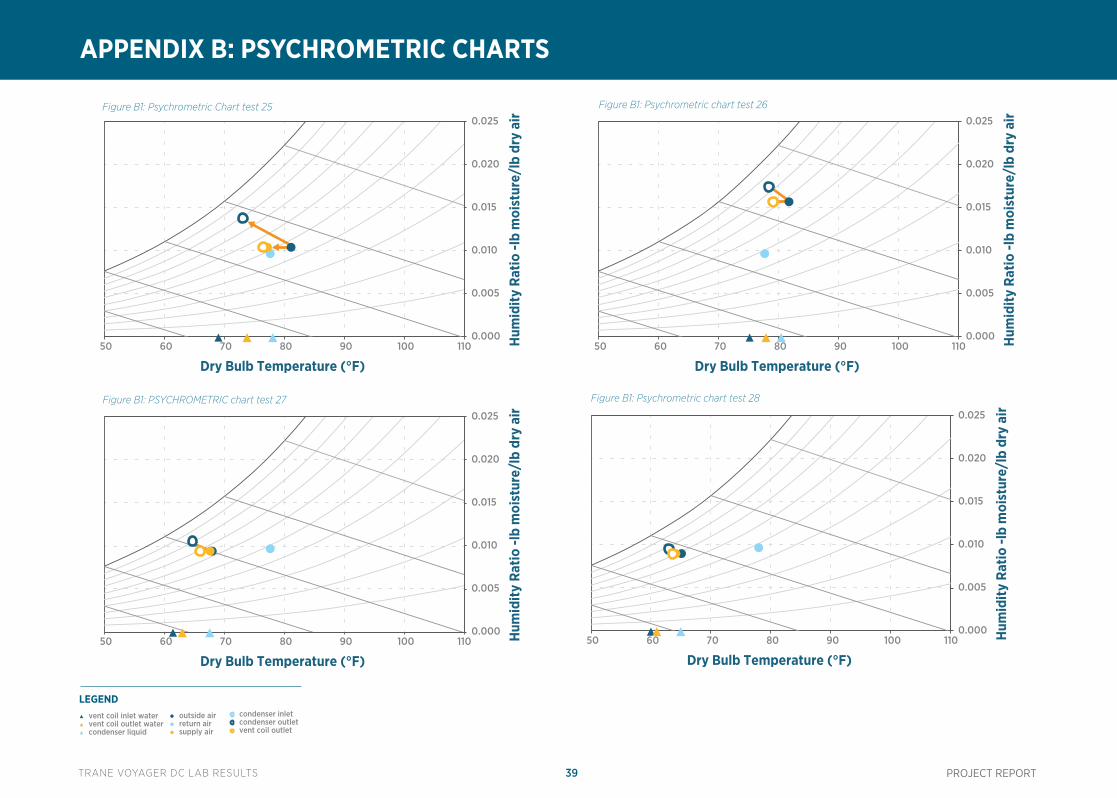
TRANE VOYAGER DC LAB RESULTS 39 PROJECT REPORT
APPENDIX B: PSYCHROMETRIC CHARTS
0.000
0.005
0.010
0.015
0.020
0.025
50 60 70 80 90 100 110
Hum
idity
Rat
io -l
b m
oist
ure/
lb d
ry a
ir
Dry Bulb Temperature (°F)
Figure B1: Psychrometric chart test 26
0.000
0.005
0.010
0.015
0.020
0.025
50 60 70 80 90 100 110
Hum
idity
Rat
io -l
b m
oist
ure/
lb d
ry a
ir
Dry Bulb Temperature (°F)
Figure B1: Psychrometric Chart test 25
0.000
0.005
0.010
0.015
0.020
0.025
50 60 70 80 90 100 110
Hum
idity
Rat
io -l
b m
oist
ure/
lb d
ry a
ir
Dry Bulb Temperature (°F)
0.000
0.005
0.010
0.015
0.020
0.025
50 60 70 80 90 100 110
Hum
idity
Rat
io -l
b m
oist
ure/
lb d
ry a
ir
Dry Bulb Temperature (°F)
Figure B1: PSYCHROMETRIC chart test 27 Figure B1: Psychrometric chart test 28
vent coil inlet water vent coil outlet water condenser liquid
outside air return air supply air
condenser inlet condenser outlet vent coil outlet
LEGEND
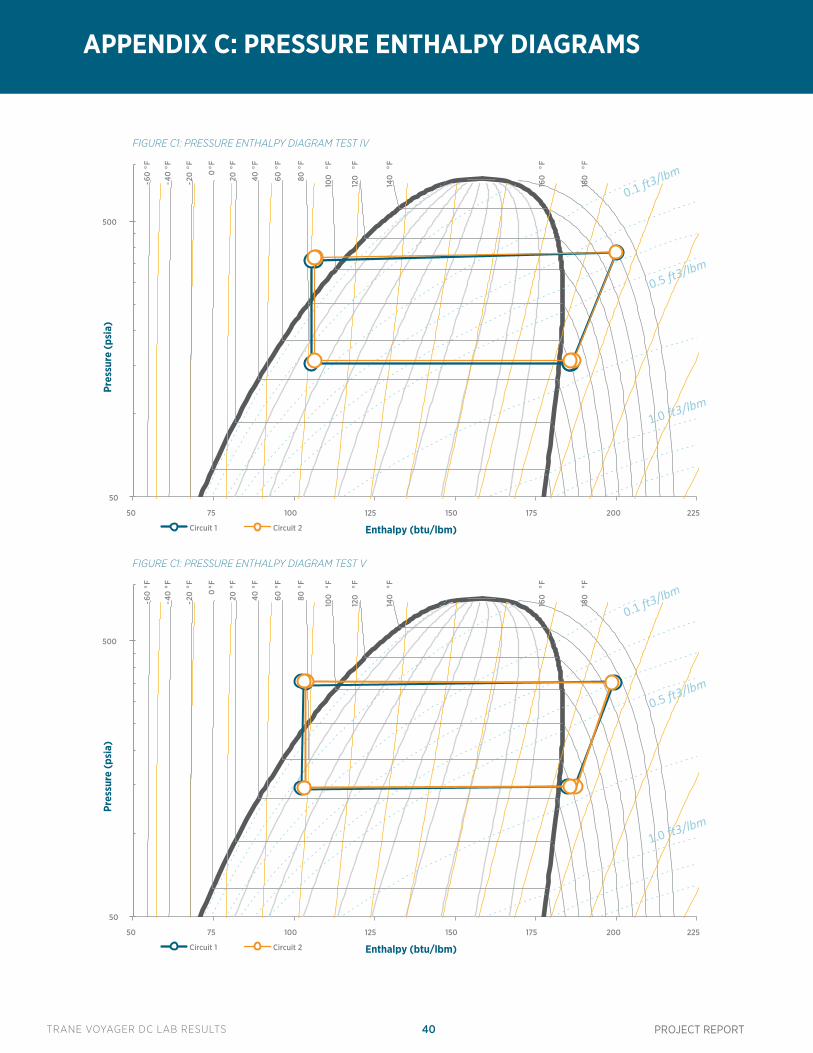
TRANE VOYAGER DC LAB RESULTS 40 PROJECT REPORT
APPENDIX C: PRESSURE ENTHALPY DIAGRAMS
50
500
50 75 100 125 150 175 200 225
Pres
sure
(psi
a)
Enthalpy (btu/lbm) Circuit 1 Circuit 2
40°F
60°F
80°F
20°F
100
°F
120
°F
0°F
-20
°F
140
°F
-40
°F
-60
°F
160
°F
180
°F
50
500
50 75 100 125 150 175 200 225
Pres
sure
(psi
a)
Enthalpy (btu/lbm) Circuit 1 Circuit 2
40°F
60°F
80°F
20°F
100
°F
120
°F
0°F
-20
°F
140
°F
-40
°F
-60
°F
160
°F
180
°F
FIGURE C1: PRESSURE ENTHALPY DIAGRAM TEST IV
FIGURE C1: PRESSURE ENTHALPY DIAGRAM TEST V
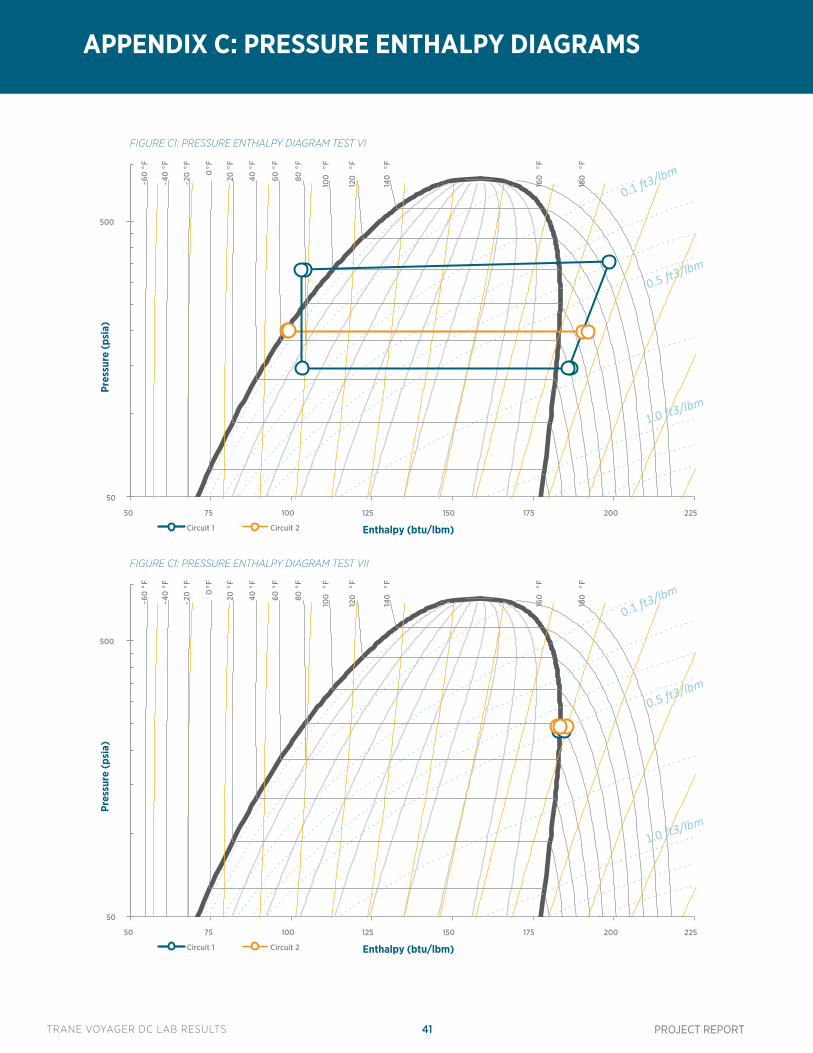
TRANE VOYAGER DC LAB RESULTS 41 PROJECT REPORT
APPENDIX C: PRESSURE ENTHALPY DIAGRAMS
50
500
50 75 100 125 150 175 200 225
Pres
sure
(psi
a)
Enthalpy (btu/lbm) Circuit 1 Circuit 2
40°F
60°F
80°F
20°F
100
°F
120
°F
0°F
-20
°F
140
°F
-40
°F
-60
°F
160
°F
180
°F
50
500
50 75 100 125 150 175 200 225
Pres
sure
(psi
a)
Enthalpy (btu/lbm) Circuit 1 Circuit 2
40°F
60°F
80°F
20°F
100
°F
120
°F
0°F
-20
°F
140
°F
-40
°F
-60
°F
160
°F
180
°F
FIGURE C1: PRESSURE ENTHALPY DIAGRAM TEST VI
FIGURE C1: PRESSURE ENTHALPY DIAGRAM TEST VII
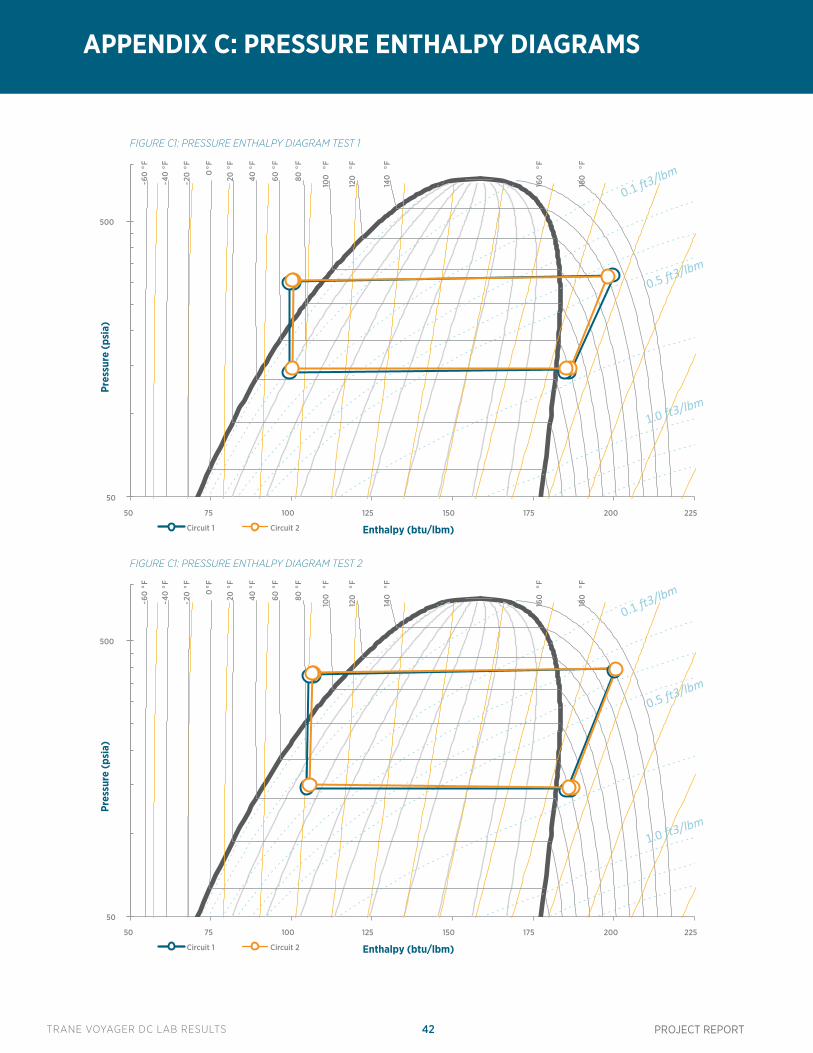
TRANE VOYAGER DC LAB RESULTS 42 PROJECT REPORT
APPENDIX C: PRESSURE ENTHALPY DIAGRAMS
50
500
50 75 100 125 150 175 200 225
Pres
sure
(psi
a)
Enthalpy (btu/lbm) Circuit 1 Circuit 2
40°F
60°F
80°F
20°F
100
°F
120
°F
0°F
-20
°F
140
°F
-40
°F
-60
°F
160
°F
180
°F
50
500
50 75 100 125 150 175 200 225
Pres
sure
(psi
a)
Enthalpy (btu/lbm) Circuit 1 Circuit 2
40°F
60°F
80°F
20°F
100
°F
120
°F
0°F
-20
°F
140
°F
-40
°F
-60
°F
160
°F
180
°F
FIGURE C1: PRESSURE ENTHALPY DIAGRAM TEST 1
FIGURE C1: PRESSURE ENTHALPY DIAGRAM TEST 2
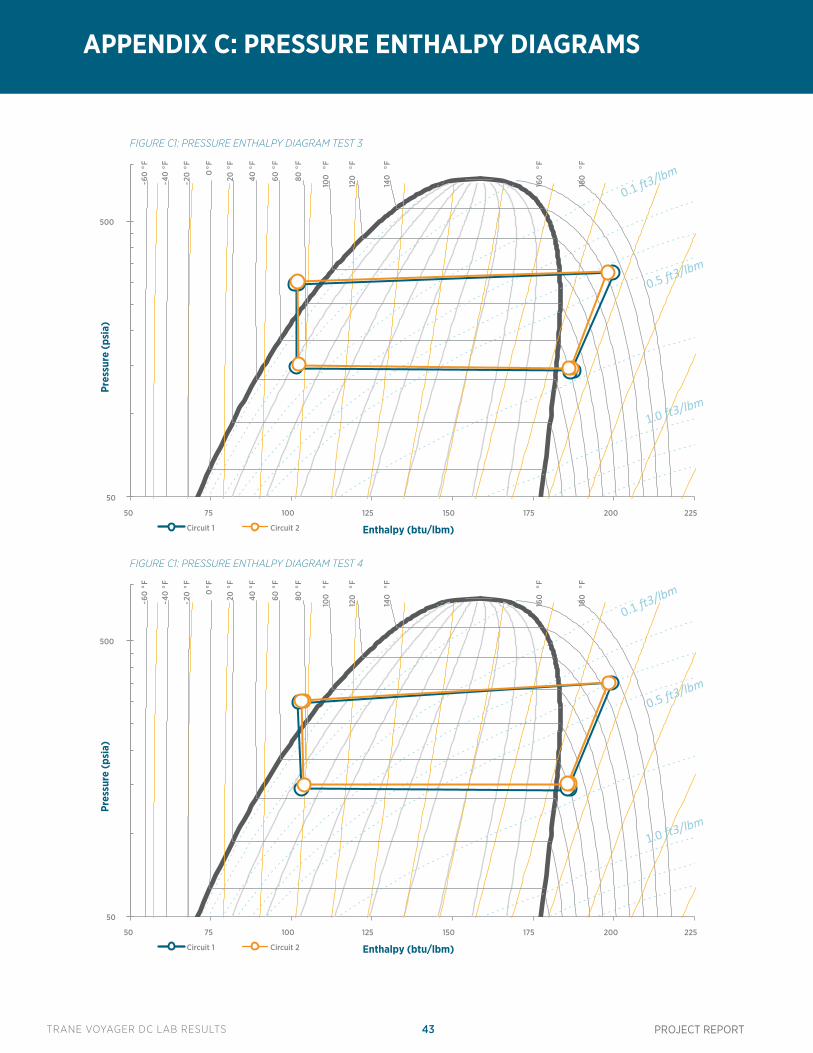
TRANE VOYAGER DC LAB RESULTS 43 PROJECT REPORT
APPENDIX C: PRESSURE ENTHALPY DIAGRAMS
50
500
50 75 100 125 150 175 200 225
Pres
sure
(psi
a)
Enthalpy (btu/lbm) Circuit 1 Circuit 2
40°F
60°F
80°F
20°F
100
°F
120
°F
0°F
-20
°F
140
°F
-40
°F
-60
°F
160
°F
180
°F
50
500
50 75 100 125 150 175 200 225
Pres
sure
(psi
a)
Enthalpy (btu/lbm) Circuit 1 Circuit 2
40°F
60°F
80°F
20°F
100
°F
120
°F
0°F
-20
°F
140
°F
-40
°F
-60
°F
160
°F
180
°F
FIGURE C1: PRESSURE ENTHALPY DIAGRAM TEST 3
FIGURE C1: PRESSURE ENTHALPY DIAGRAM TEST 4
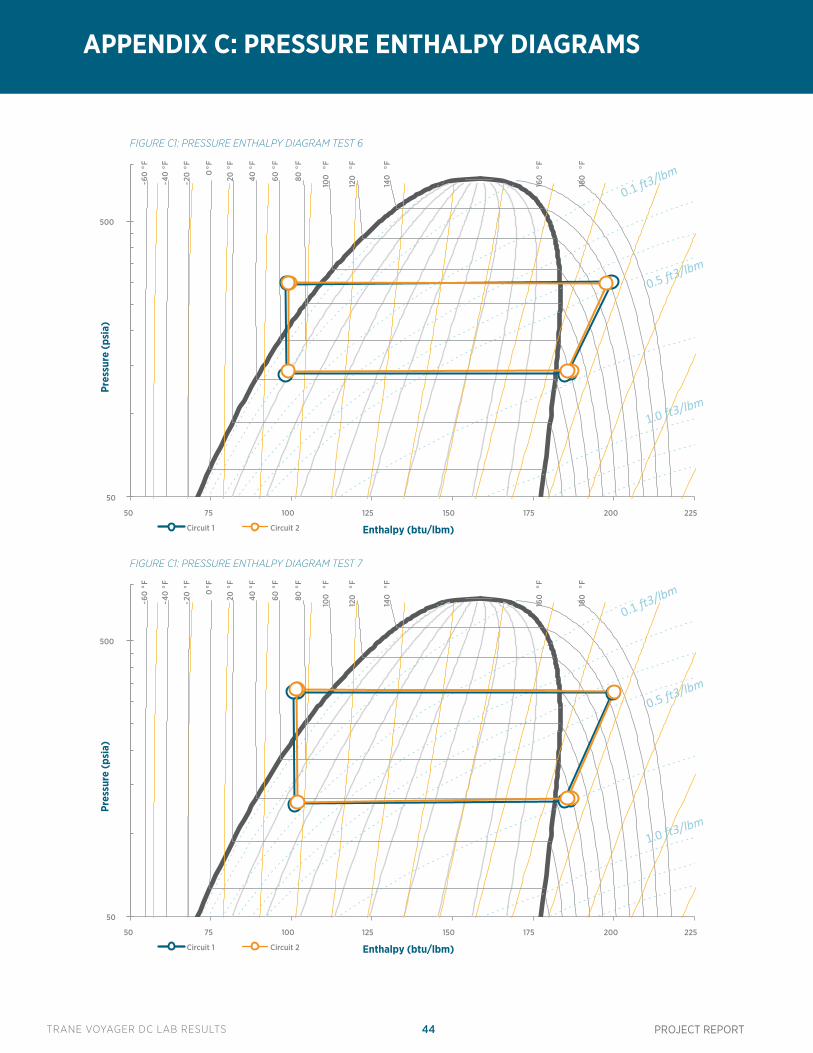
TRANE VOYAGER DC LAB RESULTS 44 PROJECT REPORT
APPENDIX C: PRESSURE ENTHALPY DIAGRAMS
50
500
50 75 100 125 150 175 200 225
Pres
sure
(psi
a)
Enthalpy (btu/lbm) Circuit 1 Circuit 2
40°F
60°F
80°F
20°F
100
°F
120
°F
0°F
-20
°F
140
°F
-40
°F
-60
°F
160
°F
180
°F
50
500
50 75 100 125 150 175 200 225
Pres
sure
(psi
a)
Enthalpy (btu/lbm) Circuit 1 Circuit 2
40°F
60°F
80°F
20°F
100
°F
120
°F
0°F
-20
°F
140
°F
-40
°F
-60
°F
160
°F
180
°F
FIGURE C1: PRESSURE ENTHALPY DIAGRAM TEST 6
FIGURE C1: PRESSURE ENTHALPY DIAGRAM TEST 7
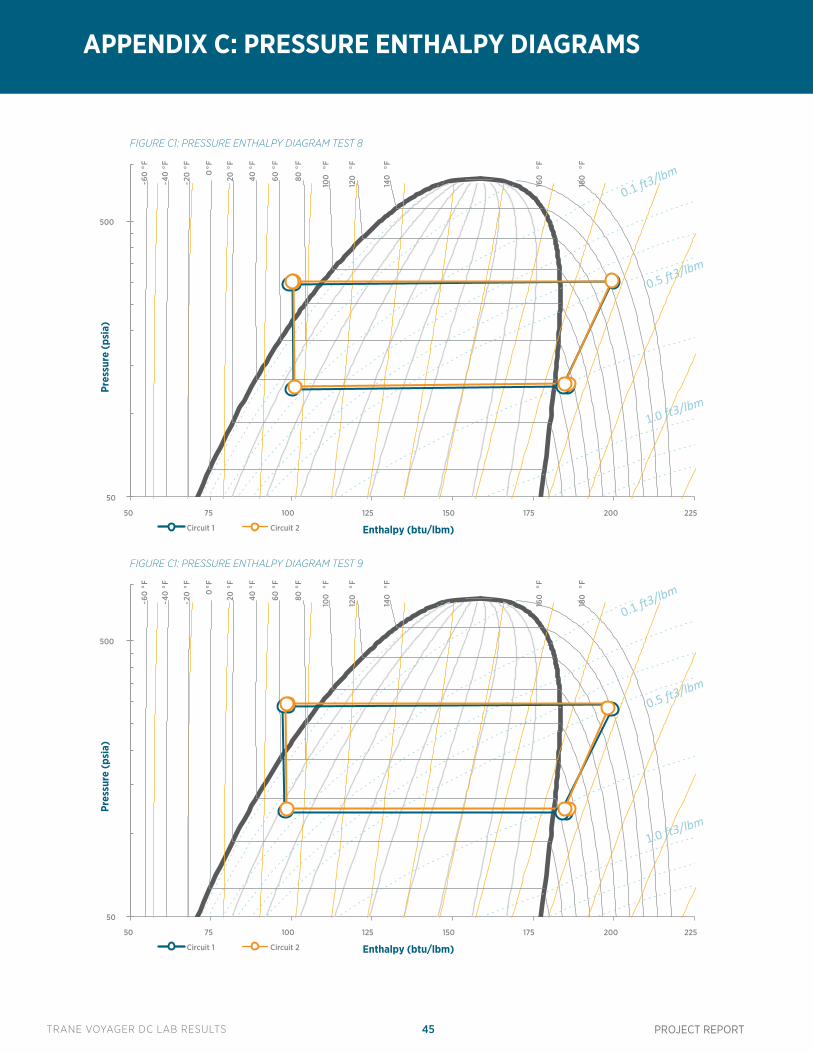
TRANE VOYAGER DC LAB RESULTS 45 PROJECT REPORT
APPENDIX C: PRESSURE ENTHALPY DIAGRAMS
50
500
50 75 100 125 150 175 200 225
Pres
sure
(psi
a)
Enthalpy (btu/lbm) Circuit 1 Circuit 2
40°F
60°F
80°F
20°F
100
°F
120
°F
0°F
-20
°F
140
°F
-40
°F
-60
°F
160
°F
180
°F
50
500
50 75 100 125 150 175 200 225
Pres
sure
(psi
a)
Enthalpy (btu/lbm) Circuit 1 Circuit 2
40°F
60°F
80°F
20°F
100
°F
120
°F
0°F
-20
°F
140
°F
-40
°F
-60
°F
160
°F
180
°F
FIGURE C1: PRESSURE ENTHALPY DIAGRAM TEST 8
FIGURE C1: PRESSURE ENTHALPY DIAGRAM TEST 9
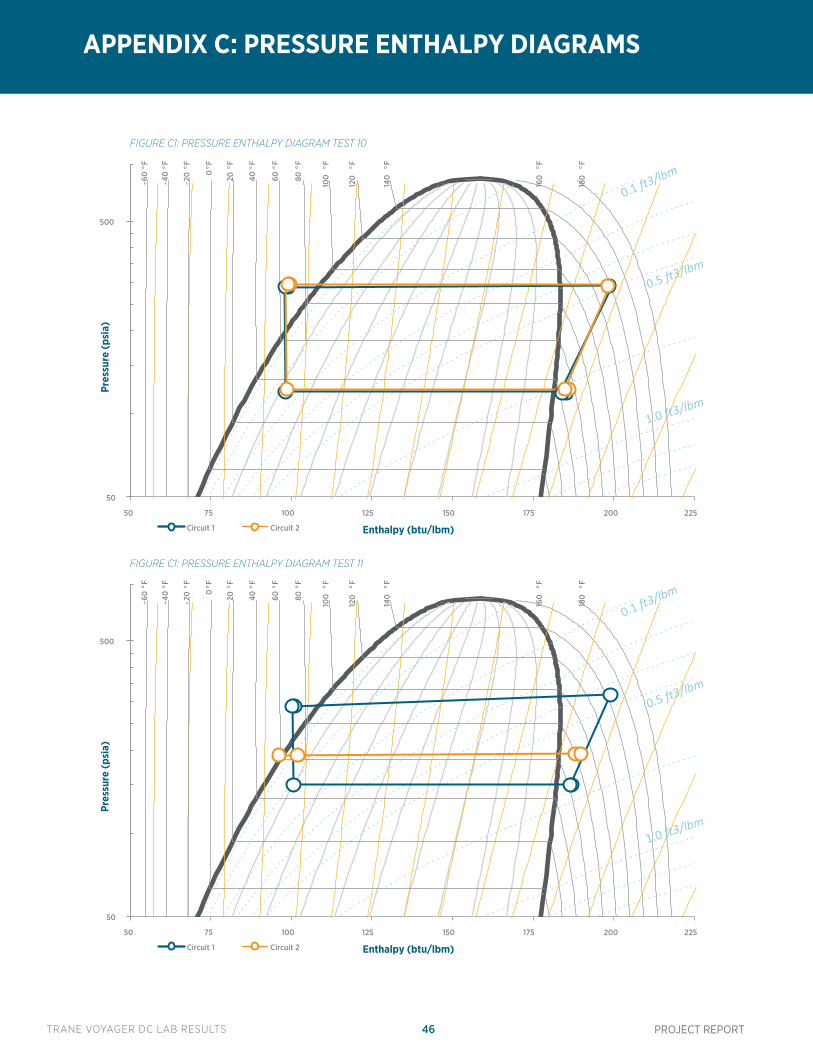
TRANE VOYAGER DC LAB RESULTS 46 PROJECT REPORT
APPENDIX C: PRESSURE ENTHALPY DIAGRAMS
50
500
50 75 100 125 150 175 200 225
Pres
sure
(psi
a)
Enthalpy (btu/lbm) Circuit 1 Circuit 2
40°F
60°F
80°F
20°F
100
°F
120
°F
0°F
-20
°F
140
°F
-40
°F
-60
°F
160
°F
180
°F
50
500
50 75 100 125 150 175 200 225
Pres
sure
(psi
a)
Enthalpy (btu/lbm) Circuit 1 Circuit 2
40°F
60°F
80°F
20°F
100
°F
120
°F
0°F
-20
°F
140
°F
-40
°F
-60
°F
160
°F
180
°F
FIGURE C1: PRESSURE ENTHALPY DIAGRAM TEST 10
FIGURE C1: PRESSURE ENTHALPY DIAGRAM TEST 11

TRANE VOYAGER DC LAB RESULTS 47 PROJECT REPORT
APPENDIX C: PRESSURE ENTHALPY DIAGRAMS
50
500
50 75 100 125 150 175 200 225
Pres
sure
(psi
a)
Enthalpy (btu/lbm) Circuit 1 Circuit 2
40°F
60°F
80°F
20°F
100
°F
120
°F
0°F
-20
°F
140
°F
-40
°F
-60
°F
160
°F
180
°F
50
500
50 75 100 125 150 175 200 225
Pres
sure
(psi
a)
Enthalpy (btu/lbm) Circuit 1 Circuit 2
40°F
60°F
80°F
20°F
100
°F
120
°F
0°F
-20
°F
140
°F
-40
°F
-60
°F
160
°F
180
°F
FIGURE C1: PRESSURE ENTHALPY DIAGRAM TEST 12
FIGURE C1: PRESSURE ENTHALPY DIAGRAM TEST 13
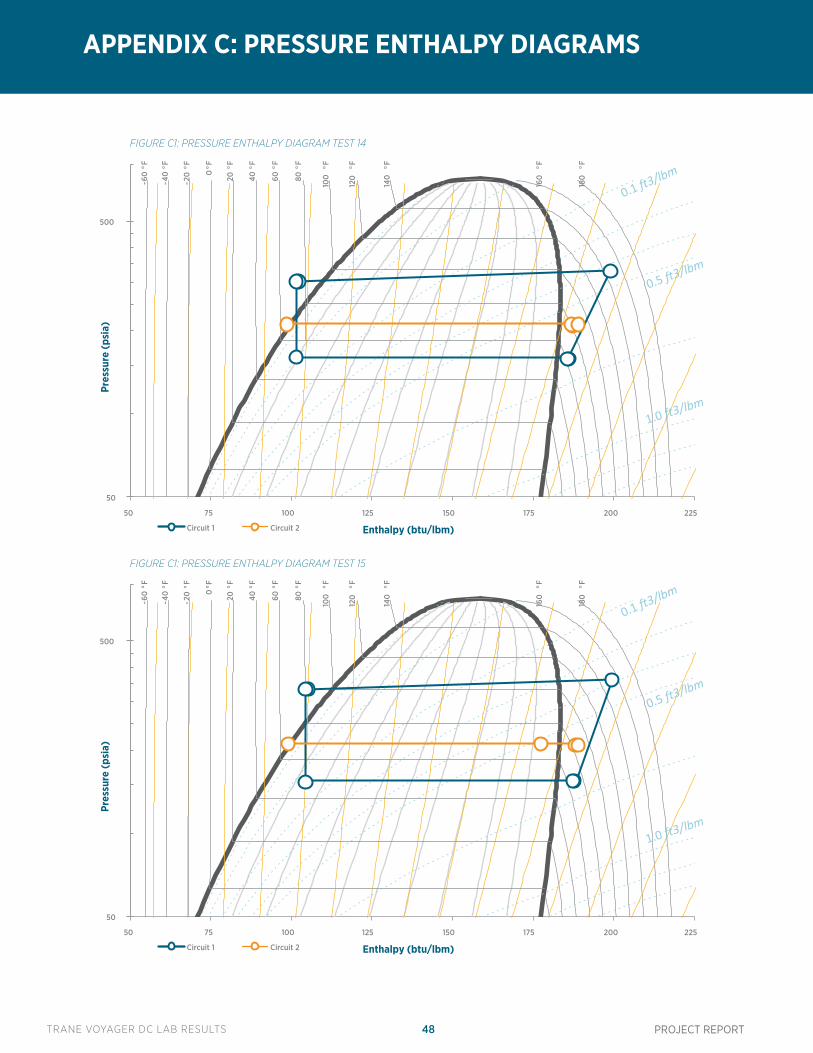
TRANE VOYAGER DC LAB RESULTS 48 PROJECT REPORT
APPENDIX C: PRESSURE ENTHALPY DIAGRAMS
50
500
50 75 100 125 150 175 200 225
Pres
sure
(psi
a)
Enthalpy (btu/lbm) Circuit 1 Circuit 2
40°F
60°F
80°F
20°F
100
°F
120
°F
0°F
-20
°F
140
°F
-40
°F
-60
°F
160
°F
180
°F
50
500
50 75 100 125 150 175 200 225
Pres
sure
(psi
a)
Enthalpy (btu/lbm) Circuit 1 Circuit 2
40°F
60°F
80°F
20°F
100
°F
120
°F
0°F
-20
°F
140
°F
-40
°F
-60
°F
160
°F
180
°F
FIGURE C1: PRESSURE ENTHALPY DIAGRAM TEST 14
FIGURE C1: PRESSURE ENTHALPY DIAGRAM TEST 15
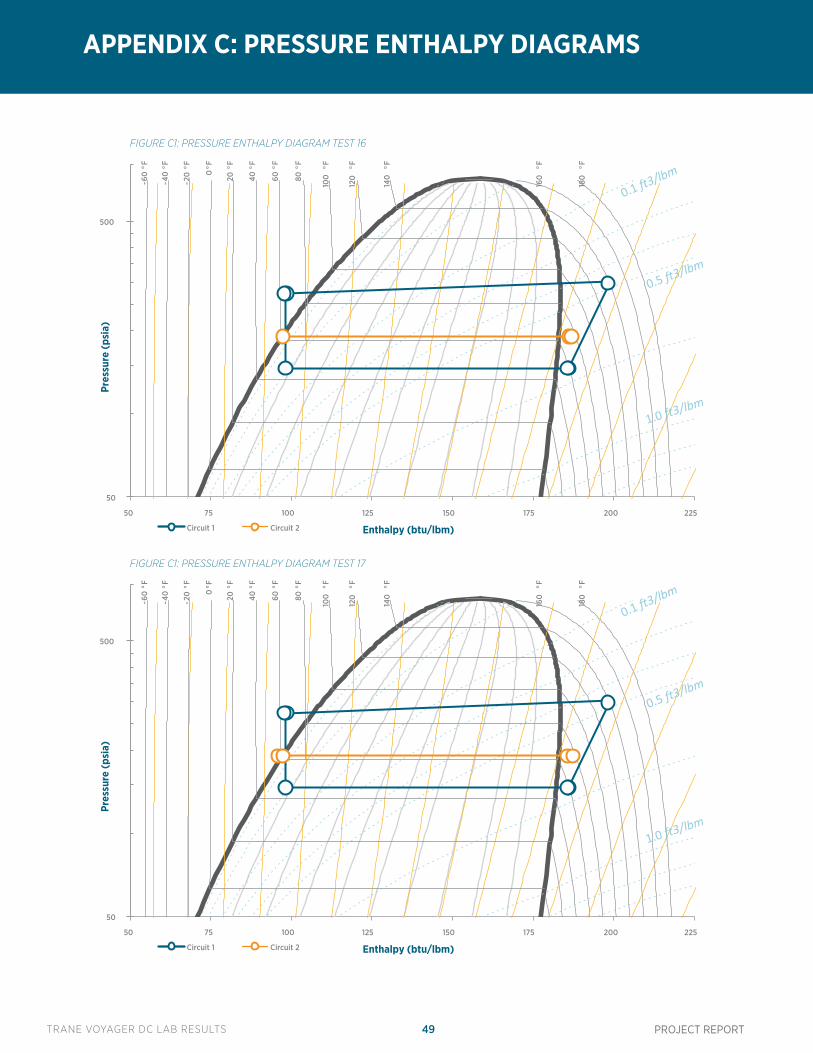
TRANE VOYAGER DC LAB RESULTS 49 PROJECT REPORT
APPENDIX C: PRESSURE ENTHALPY DIAGRAMS
50
500
50 75 100 125 150 175 200 225
Pres
sure
(psi
a)
Enthalpy (btu/lbm) Circuit 1 Circuit 2
40°F
60°F
80°F
20°F
100
°F
120
°F
0°F
-20
°F
140
°F
-40
°F
-60
°F
160
°F
180
°F
50
500
50 75 100 125 150 175 200 225
Pres
sure
(psi
a)
Enthalpy (btu/lbm) Circuit 1 Circuit 2
40°F
60°F
80°F
20°F
100
°F
120
°F
0°F
-20
°F
140
°F
-40
°F
-60
°F
160
°F
180
°F
FIGURE C1: PRESSURE ENTHALPY DIAGRAM TEST 16
FIGURE C1: PRESSURE ENTHALPY DIAGRAM TEST 17
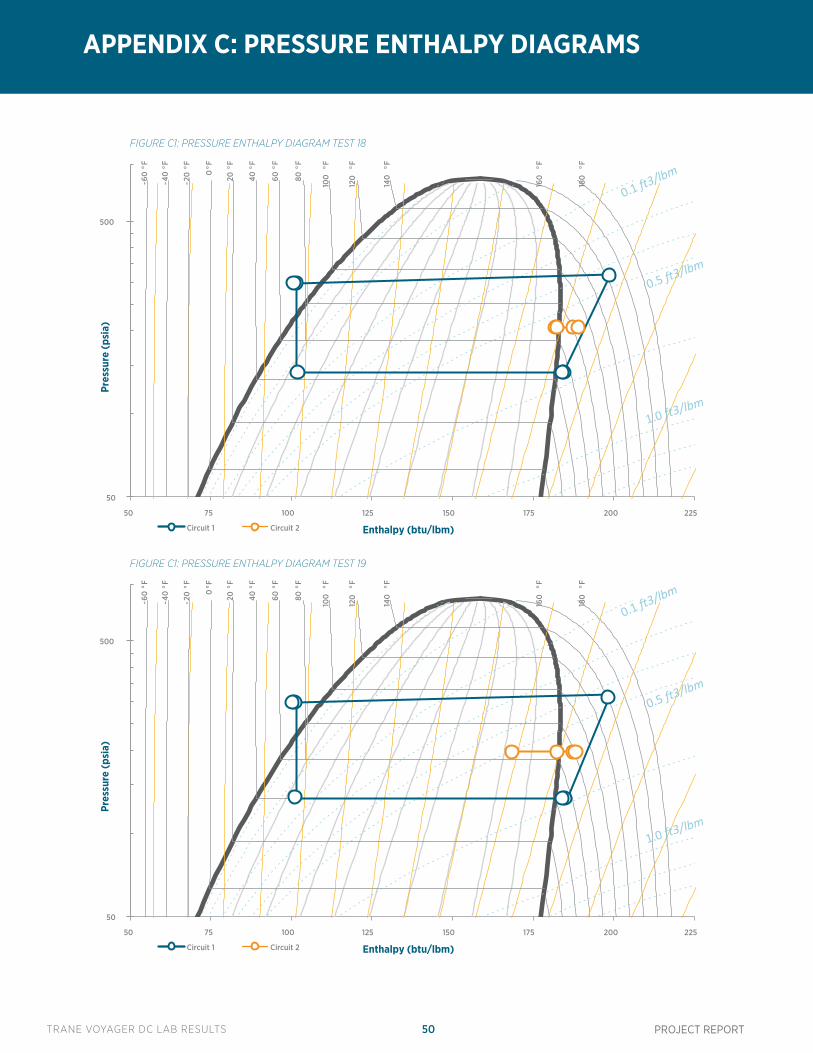
TRANE VOYAGER DC LAB RESULTS 50 PROJECT REPORT
APPENDIX C: PRESSURE ENTHALPY DIAGRAMS
50
500
50 75 100 125 150 175 200 225
Pres
sure
(psi
a)
Enthalpy (btu/lbm) Circuit 1 Circuit 2
40°F
60°F
80°F
20°F
100
°F
120
°F
0°F
-20
°F
140
°F
-40
°F
-60
°F
160
°F
180
°F
50
500
50 75 100 125 150 175 200 225
Pres
sure
(psi
a)
Enthalpy (btu/lbm) Circuit 1 Circuit 2
40°F
60°F
80°F
20°F
100
°F
120
°F
0°F
-20
°F
140
°F
-40
°F
-60
°F
160
°F
180
°F
FIGURE C1: PRESSURE ENTHALPY DIAGRAM TEST 18
FIGURE C1: PRESSURE ENTHALPY DIAGRAM TEST 19
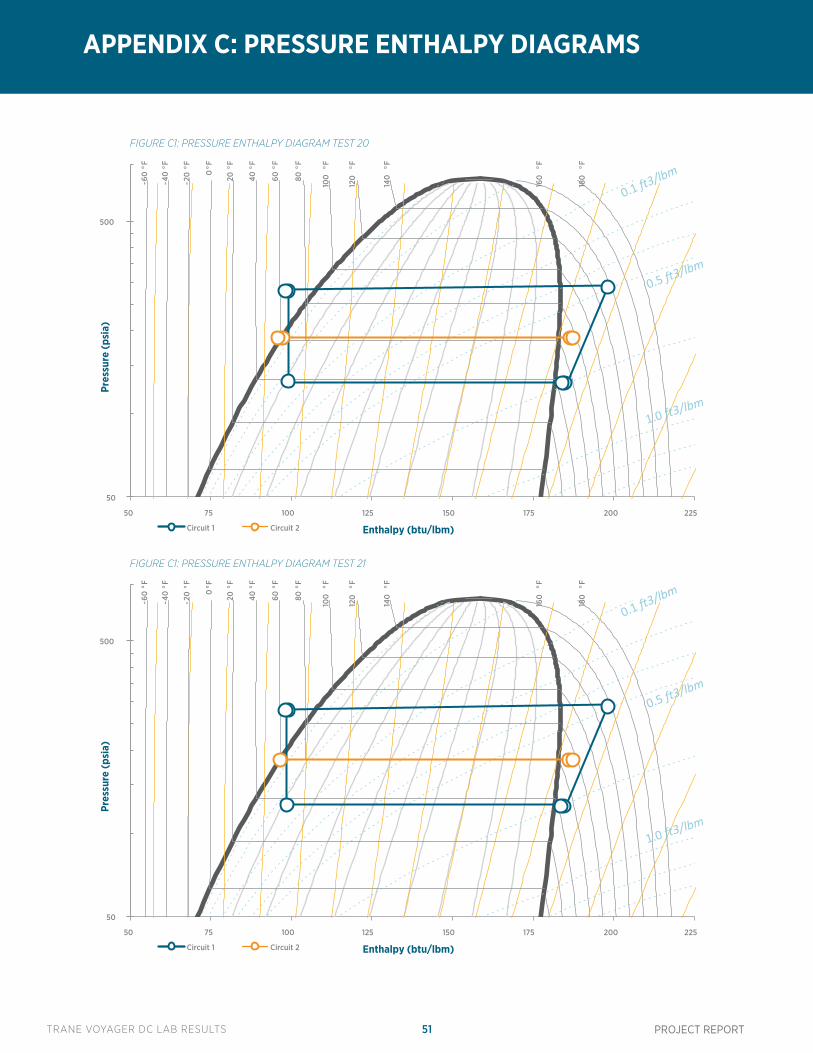
TRANE VOYAGER DC LAB RESULTS 51 PROJECT REPORT
APPENDIX C: PRESSURE ENTHALPY DIAGRAMS
50
500
50 75 100 125 150 175 200 225
Pres
sure
(psi
a)
Enthalpy (btu/lbm) Circuit 1 Circuit 2
40°F
60°F
80°F
20°F
100
°F
120
°F
0°F
-20
°F
140
°F
-40
°F
-60
°F
160
°F
180
°F
50
500
50 75 100 125 150 175 200 225
Pres
sure
(psi
a)
Enthalpy (btu/lbm) Circuit 1 Circuit 2
40°F
60°F
80°F
20°F
100
°F
120
°F
0°F
-20
°F
140
°F
-40
°F
-60
°F
160
°F
180
°F
FIGURE C1: PRESSURE ENTHALPY DIAGRAM TEST 20
FIGURE C1: PRESSURE ENTHALPY DIAGRAM TEST 21
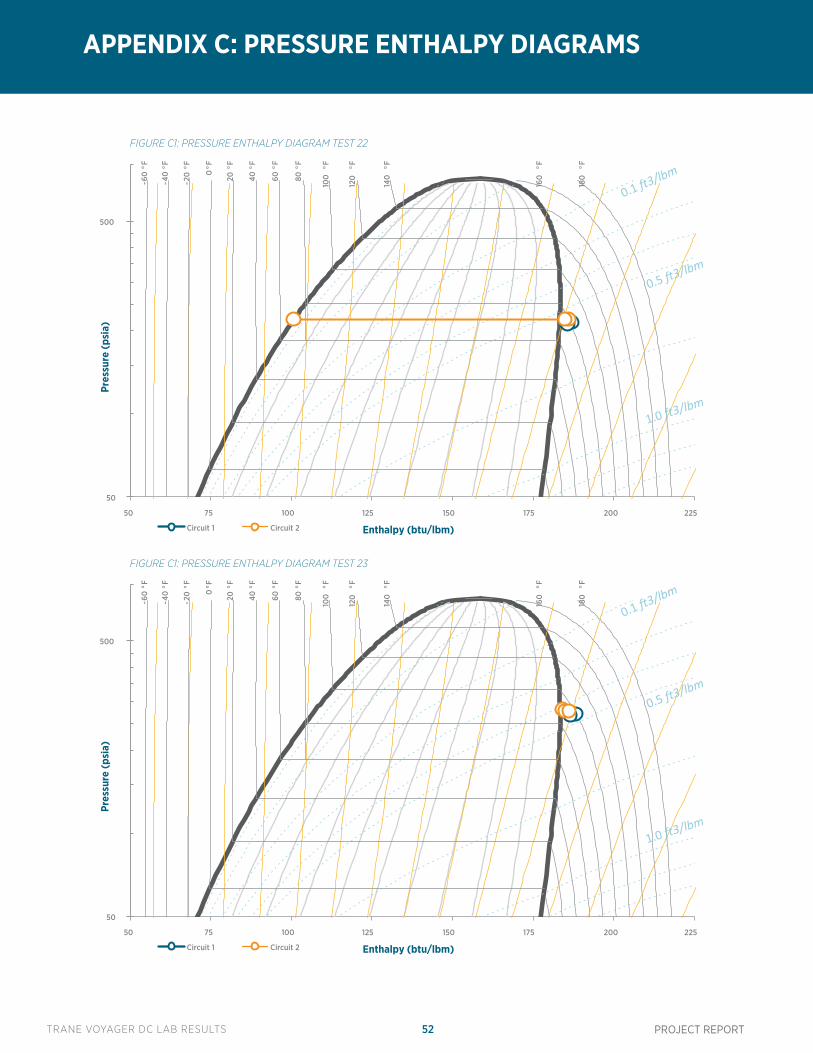
TRANE VOYAGER DC LAB RESULTS 52 PROJECT REPORT
APPENDIX C: PRESSURE ENTHALPY DIAGRAMS
50
500
50 75 100 125 150 175 200 225
Pres
sure
(psi
a)
Enthalpy (btu/lbm) Circuit 1 Circuit 2
40°F
60°F
80°F
20°F
100
°F
120
°F
0°F
-20
°F
140
°F
-40
°F
-60
°F
160
°F
180
°F
50
500
50 75 100 125 150 175 200 225
Pres
sure
(psi
a)
Enthalpy (btu/lbm) Circuit 1 Circuit 2
40°F
60°F
80°F
20°F
100
°F
120
°F
0°F
-20
°F
140
°F
-40
°F
-60
°F
160
°F
180
°F
FIGURE C1: PRESSURE ENTHALPY DIAGRAM TEST 22
FIGURE C1: PRESSURE ENTHALPY DIAGRAM TEST 23
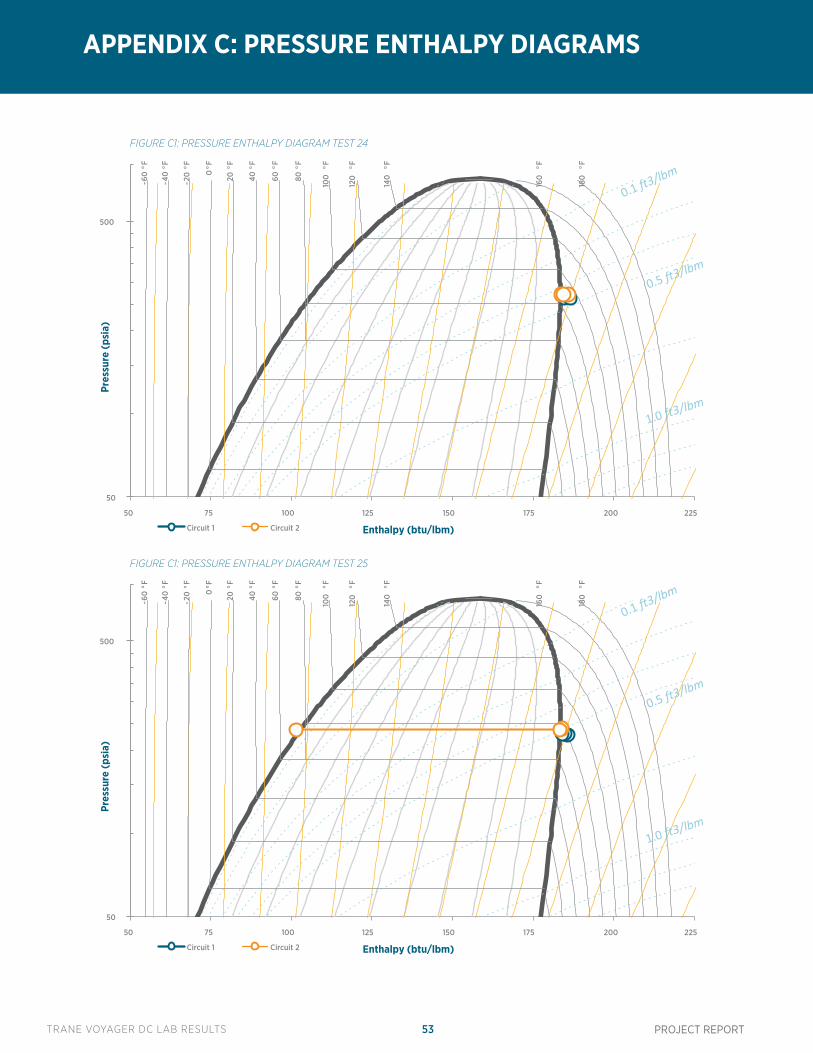
TRANE VOYAGER DC LAB RESULTS 53 PROJECT REPORT
APPENDIX C: PRESSURE ENTHALPY DIAGRAMS
50
500
50 75 100 125 150 175 200 225
Pres
sure
(psi
a)
Enthalpy (btu/lbm) Circuit 1 Circuit 2
40°F
60°F
80°F
20°F
100
°F
120
°F
0°F
-20
°F
140
°F
-40
°F
-60
°F
160
°F
180
°F
50
500
50 75 100 125 150 175 200 225
Pres
sure
(psi
a)
Enthalpy (btu/lbm) Circuit 1 Circuit 2
40°F
60°F
80°F
20°F
100
°F
120
°F
0°F
-20
°F
140
°F
-40
°F
-60
°F
160
°F
180
°F
FIGURE C1: PRESSURE ENTHALPY DIAGRAM TEST 24
FIGURE C1: PRESSURE ENTHALPY DIAGRAM TEST 25
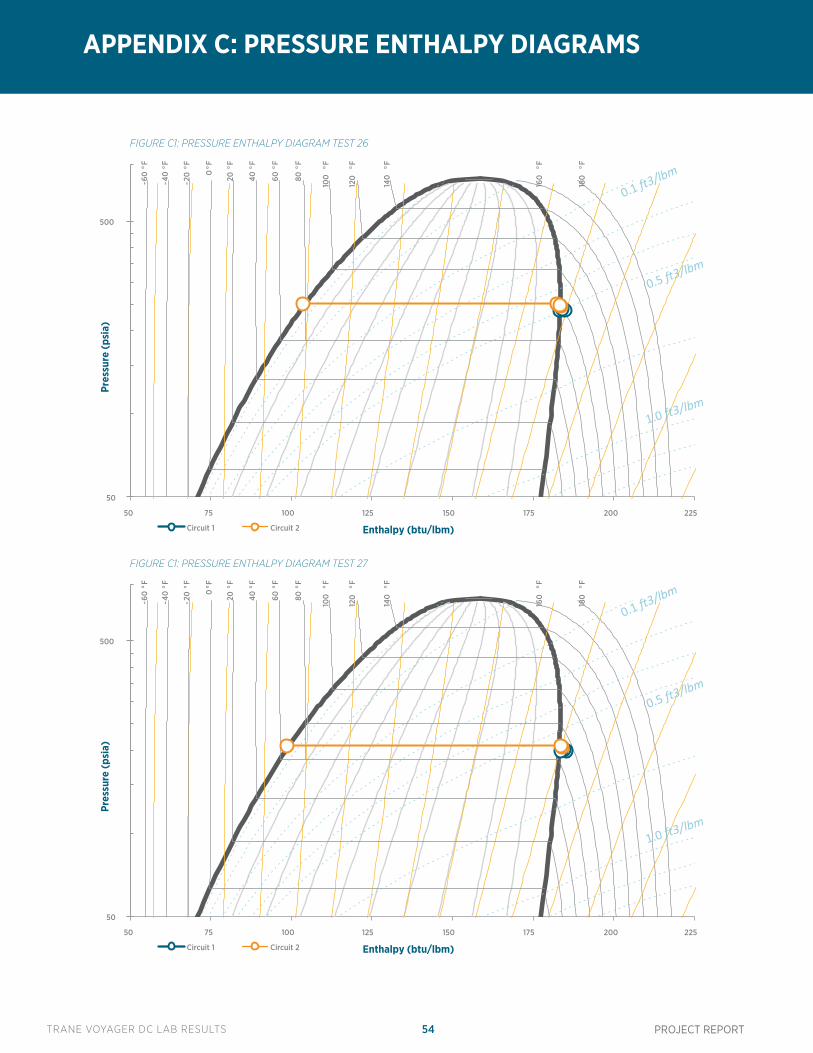
TRANE VOYAGER DC LAB RESULTS 54 PROJECT REPORT
APPENDIX C: PRESSURE ENTHALPY DIAGRAMS
50
500
50 75 100 125 150 175 200 225
Pres
sure
(psi
a)
Enthalpy (btu/lbm) Circuit 1 Circuit 2
40°F
60°F
80°F
20°F
100
°F
120
°F
0°F
-20
°F
140
°F
-40
°F
-60
°F
160
°F
180
°F
50
500
50 75 100 125 150 175 200 225
Pres
sure
(psi
a)
Enthalpy (btu/lbm) Circuit 1 Circuit 2
40°F
60°F
80°F
20°F
100
°F
120
°F
0°F
-20
°F
140
°F
-40
°F
-60
°F
160
°F
180
°F
FIGURE C1: PRESSURE ENTHALPY DIAGRAM TEST 26
FIGURE C1: PRESSURE ENTHALPY DIAGRAM TEST 27
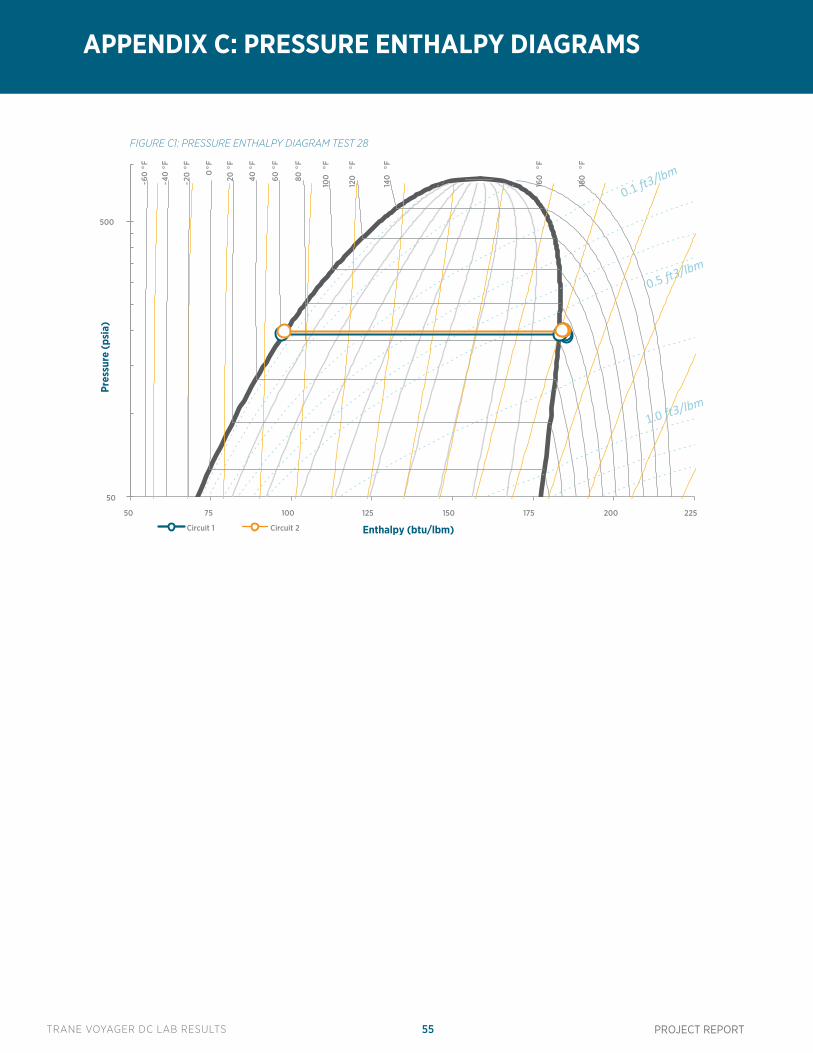
TRANE VOYAGER DC LAB RESULTS 55 PROJECT REPORT
APPENDIX C: PRESSURE ENTHALPY DIAGRAMS
50
500
50 75 100 125 150 175 200 225
Pres
sure
(psi
a)
Enthalpy (btu/lbm) Circuit 1 Circuit 2
40°F
60°F
80°F
20°F
100
°F
120
°F
0°F
-20
°F
140
°F
-40
°F
-60
°F
160
°F
180
°F
FIGURE C1: PRESSURE ENTHALPY DIAGRAM TEST 28